Embed Size (px)
Citation preview
4-1
FINANCIAL PLANNING AND CONTROL
Sales forecasts Projected financial statements –
Additional Funds Needed– Also called External Funds Needed (EFN)
Financial control Hypothetical Data for Northwest
Chemical Company
4-2
Financial PlanningThe projection of sales, income, and assets
based on alternative production and marketing strategies, as well as the determination of the resources needed to achieve these projections.
Forecasting also is important for production planning and human resource planning.
Financial ControlThe phase in which financial plans are
implemented; control deals with the feedback and adjustment process required to ensure adherence to plans and modification of plans because of unforeseen changes.
Financial Planning and Control

4-3
Financial Planning:
• Growth is a key theme behind financial forecasting. Remember that growth should not be the underlying goal of a corporation – creating shareholder value is the appropriate goal. In many cases, however, shareholder value creation is enabled through corporate growth.
•The sales forecast predicts a firm’s unit and dollar sales for some future period; generally based on recent sales trends plus forecasts of the economic prospects for the nation, region, industry, etc.
•We want to forecast if we need external funds – borrowing or a new stock issue
4-4
Percentage of Sales Method1. Projected Balance sheet forecasting of AFN2. Increased sales requires increased assets that must be
financed. We will discuss the strategy for forecasting assets.
3. Increased sales automatically increases spontaneous liabilities.
4. Some financing will come from retained earnings. Depending on the information, we formulate a strategy for determining RE.
5. If additional funds are needed we have to choose to finance with external funds -- debt or stock.
6. #5 affects #4 -- thus, we sometimes use an iterative approach.
4-5Steps to get AFN – simple one-pass
forecast balance sheet method
1. Calculate RE with the data given (method varies)
2. Increase CA and spontaneous liabilities proportionately with sales
3. Increase FA if needed based on capacity information given
4. Carry over bonds/bank-loans and stock
5. Calculate TA - (TL+E) = AFN AFN = additional funds needed from
external sources
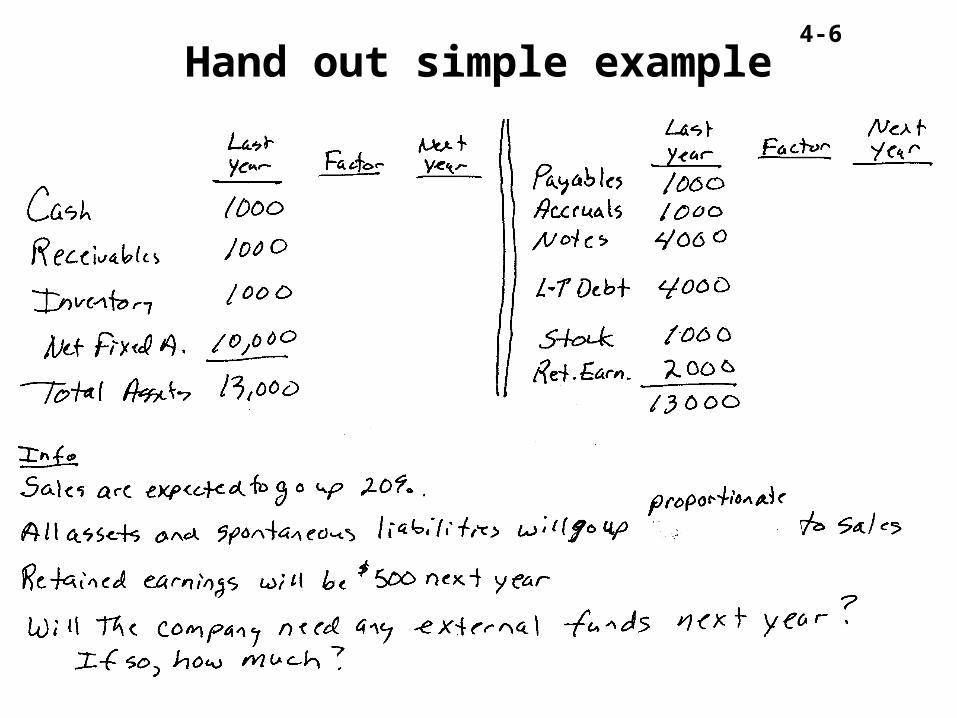
4-6
Hand out simple example

4-7Two pass method example: Northwest Chemical: 2001 Sales Projection(millions of dollars)
$0
$500
$1,000
$1,500
$2,000
$2,500
$3,000
1996 1997 1998 1999 2000 2001
4-8
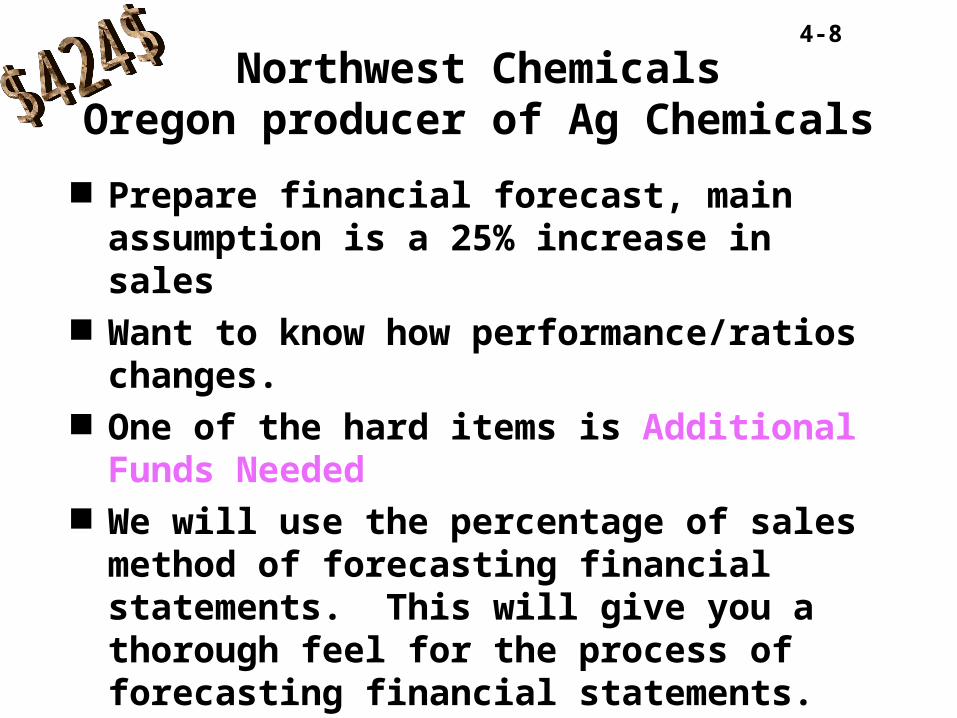
Northwest ChemicalsOregon producer of Ag Chemicals
Prepare financial forecast, main assumption is a 25% increase in sales
Want to know how performance/ratios changes.
One of the hard items is Additional Funds Needed
We will use the percentage of sales method of forecasting financial statements. This will give you a thorough feel for the process of forecasting financial statements.
4-9
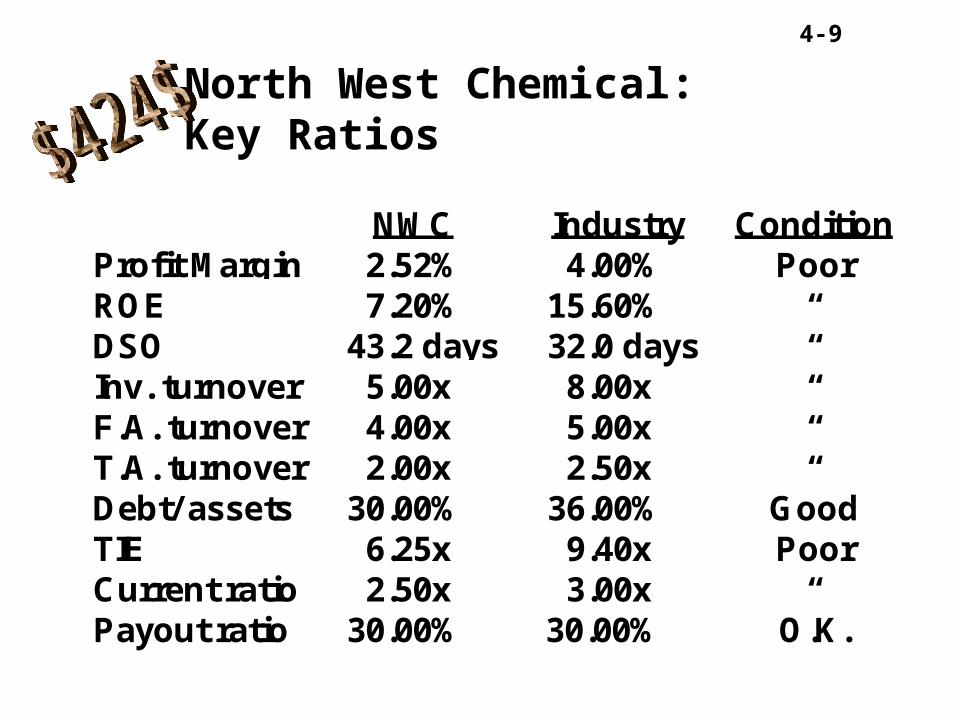
NWC Industry ConditionProfit Margin 2.52% 4.00% PoorROE 7.20% 15.60% “DSO 43.2 days 32.0 days “Inv. turnover 5.00x 8.00x “F.A. turnover 4.00x 5.00x “T.A. turnover 2.00x 2.50x “Debt/ assets 30.00% 36.00% GoodTIE 6.25x 9.40x PoorCurrent ratio 2.50x 3.00x “Payout ratio 30.00% 30.00% O.K.
North West Chemical:
Key Ratios
4-10
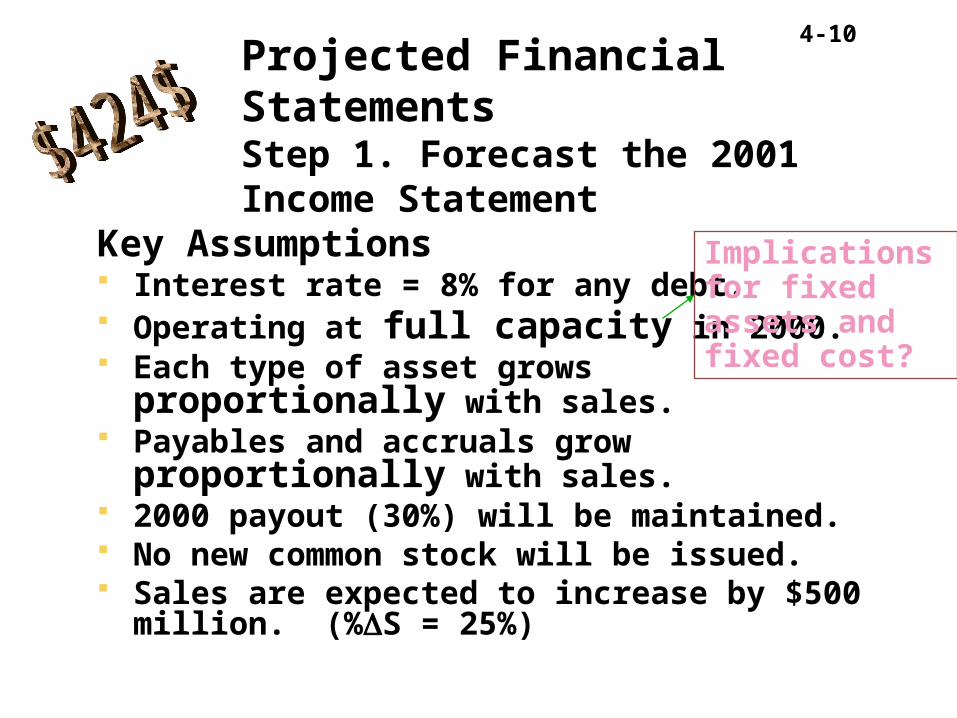
Key Assumptions Interest rate = 8% for any debt. Operating at full capacity in 2000. Each type of asset grows proportionally with
sales. Payables and accruals grow proportionally with
sales. 2000 payout (30%) will be maintained. No new common stock will be issued. Sales are expected to increase by $500 million.
(%S = 25%)
Projected Financial StatementsStep 1. Forecast the 2001 Income Statement
Implications for fixed assets and fixed cost?

4-11
There will be simpler problems than this in lab
4-12
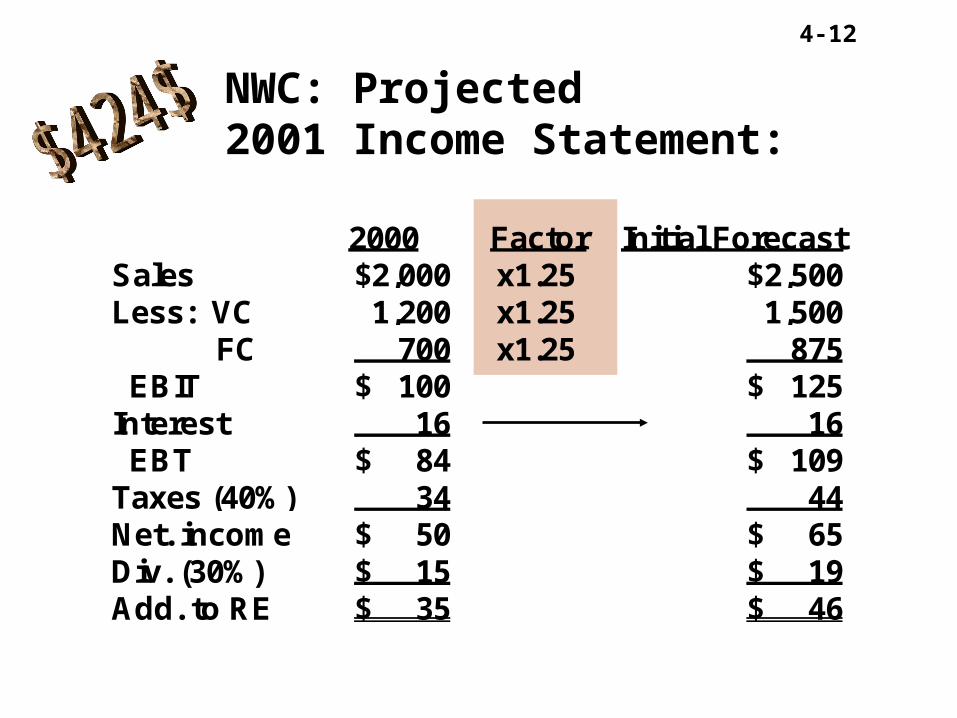
NWC: Projected 2001 Income Statement:
2000 Factor Initial ForecastSales $2,000 x1.25 $2,500Less: VC 1,200 x1.25 1,500 FC 700 x1.25 875 EBIT $ 100 $ 125Interest 16 16 EBT $ 84 $ 109Taxes (40%) 34 44Net. income $ 50 $ 65Div. (30%) $ 15 $ 19Add. to RE $ 35 $ 46
4-13
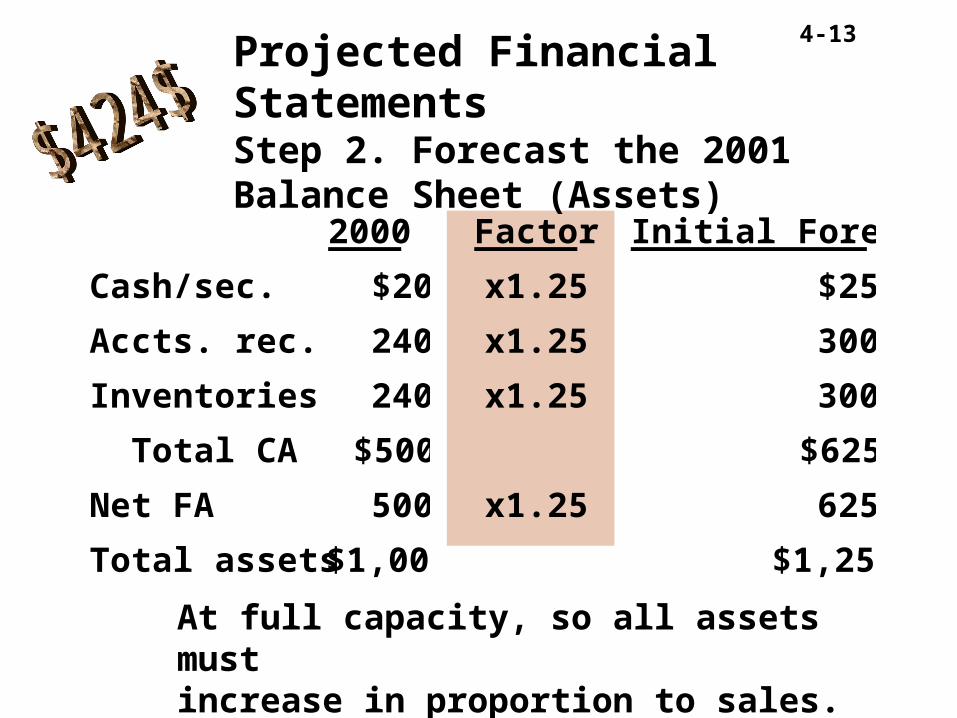
2000 Factor Initial Forecast
Cash/sec. $20 x1.25 $25
Accts. rec. 240 x1.25 300
Inventories 240 x1.25 300
Total CA $500 $625
Net FA 500 x1.25 625
Total assets $1,000 $1,250
Projected Financial StatementsStep 2. Forecast the 2001 Balance Sheet (Assets)
At full capacity, so all assets mustincrease in proportion to sales.

4-14
2000 Factor Initial Forecast
AP/accruals $100 x1.25 $125
Notes payable 100 100
Total CL $200 $225
L-T debt 100 100
Common stk. 500 500
Ret. earnings 200 +46* 246
Total liab./eq. $1,000 $1,071
Projected Financial StatementsStep 2. Forecast the 2001 Balance Sheet (Liability & Equity)
*From projected income statement.
4-15
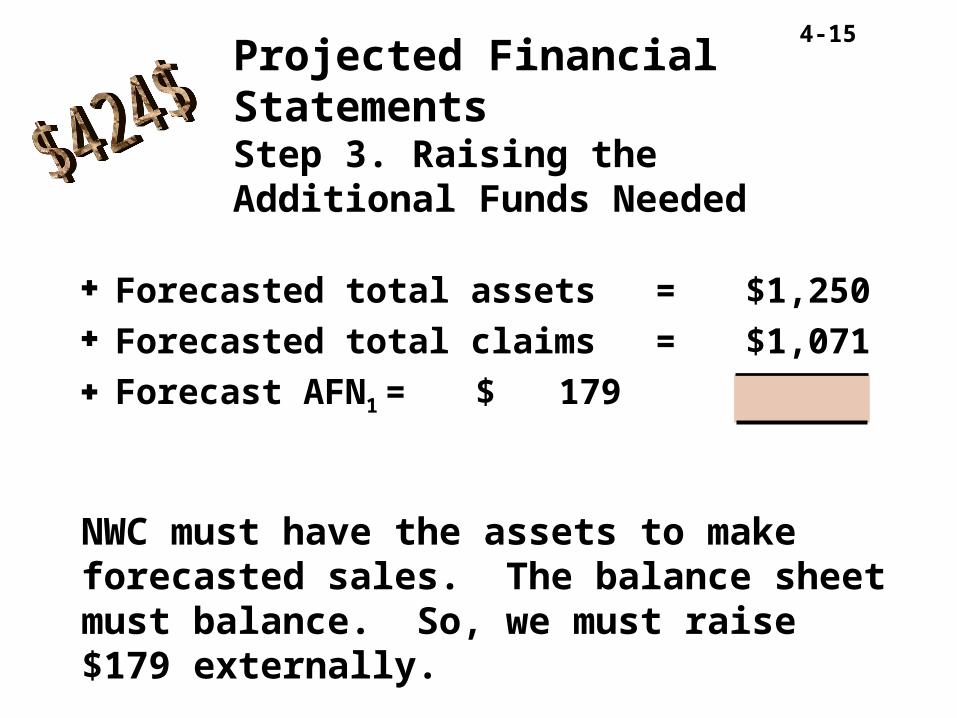
Forecasted total assets = $1,250 Forecasted total claims = $1,071 Forecast AFN1 = $ 179
NWC must have the assets to makeforecasted sales. The balance sheet must balance. So, we must raise $179 externally.
Projected Financial StatementsStep 3. Raising the Additional Funds Needed

4-16
Additional notes payable =0.5 ($179) = $89.50
Additional L-T debt =0.5 ($179) = $89.50
But this financing will add 0.08 ($179) = $14.32 to interest expense, which will lower NI and retained earnings.
How will the AFN be financed?
4-17
Projected Financial StatementsStep 4. Financing Feedbacks
The effects on the income statement and balance sheet of actions taken to finance forecasted increases in assets.

4-18
1st Pass Feedback 2nd PassSales $2,500 $2,500Less: VC 1,500 1,500 FC 875 875 EBIT $125 $125Interest 16 +14 30 EBT $109 $95Taxes (40%) 44 38Net. income $65 $57Div. (30%) $19 $17Add. to RE $46 $40
NWC: 2001 Adjusted Forecast of Income Statement
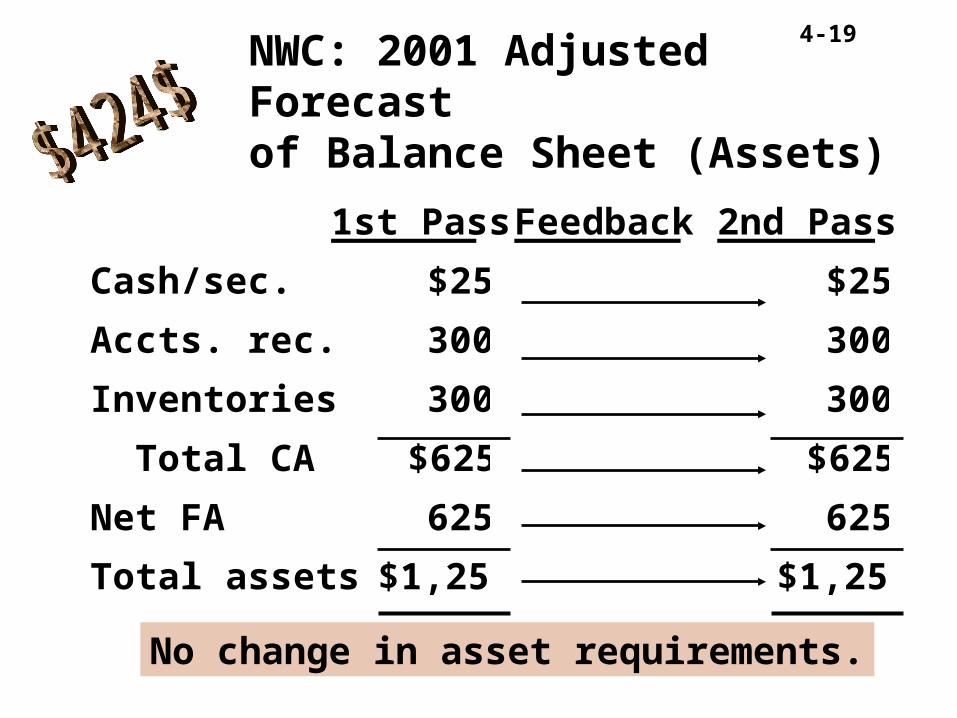
4-19
1st Pass Feedback 2nd Pass
Cash/sec. $25 $25
Accts. rec. 300 300
Inventories 300 300
Total CA $625 $625
Net FA 625 625
Total assets $1,250 $1,250
NWC: 2001 Adjusted Forecast of Balance Sheet (Assets)
No change in asset requirements.
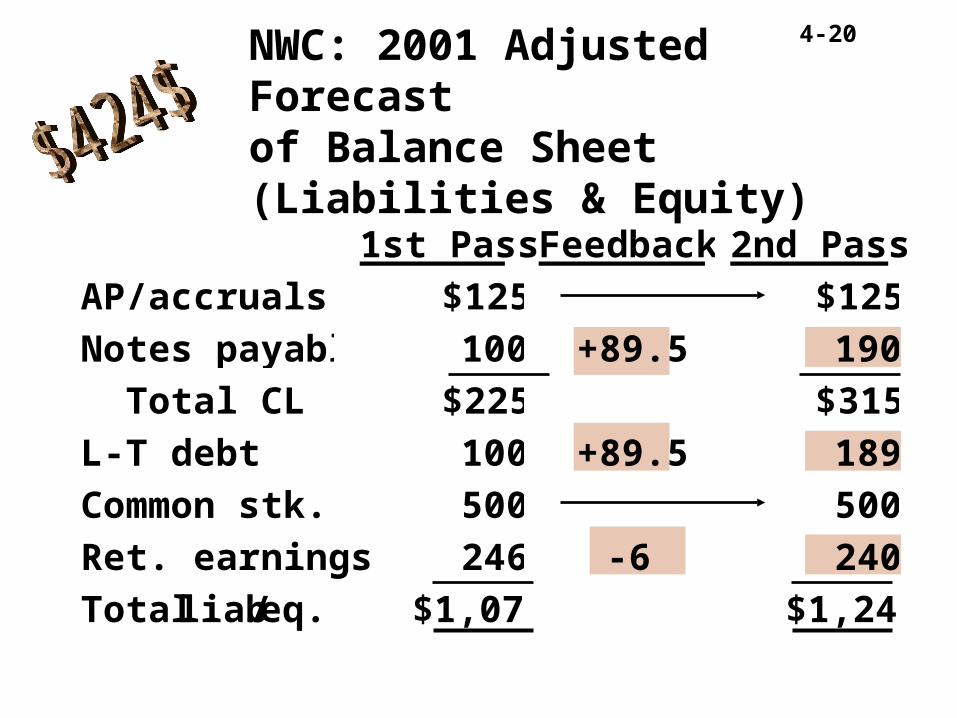
4-20
1st Pass Feedback 2nd Pass
AP/accruals $125 $125
Notes payable 100 +89.5 190
Total CL $225 $315
L-T debt 100 +89.5 189
Common stk. 500 500
Ret. earnings 246 -6 240
Total liab./eq. $1,071 $1,244
NWC: 2001 Adjusted Forecast of Balance Sheet (Liabilities & Equity)
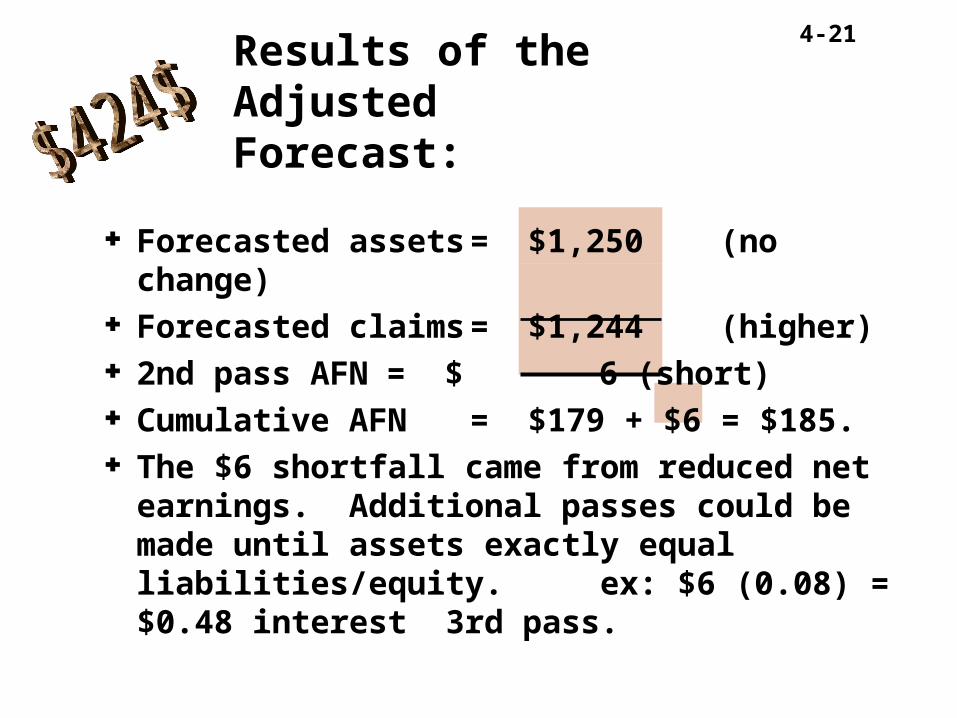
4-21
Forecasted assets = $1,250 (no change) Forecasted claims = $1,244 (higher) 2nd pass AFN = $ 6 (short) Cumulative AFN = $179 + $6 = $185. The $6 shortfall came from reduced net
earnings. Additional passes could be made until assets exactly equal liabilities/equity. ex: $6 (0.08) = $0.48 interest 3rd pass.
Results of the Adjusted Forecast:
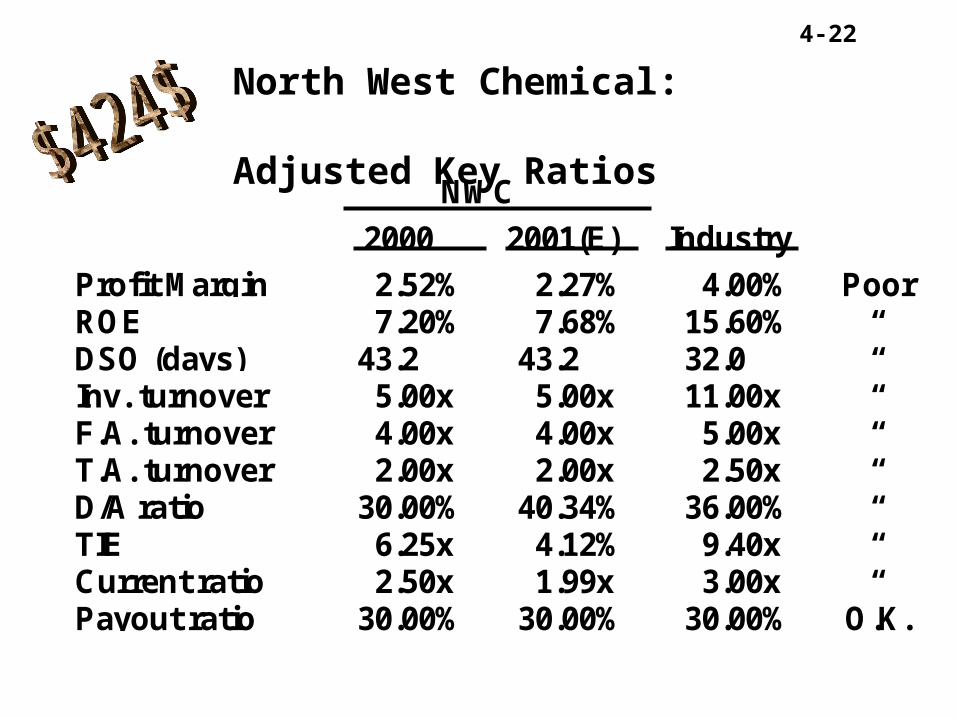
4-22
NWC
2000 2001(E) Industry
Profit Margin 2.52% 2.27% 4.00% PoorROE 7.20% 7.68% 15.60% “DSO (days) 43.2 43.2 32.0 “Inv. turnover 5.00x 5.00x 11.00x “F.A. turnover 4.00x 4.00x 5.00x “T.A. turnover 2.00x 2.00x 2.50x “D/A ratio 30.00% 40.34% 36.00% “TIE 6.25x 4.12% 9.40x “Current ratio 2.50x 1.99x 3.00x “Payout ratio 30.00% 30.00% 30.00% O.K.
North West Chemical: Adjusted Key Ratios
4-23
Not very profitable relative to other companies in the industry.
Carrying excess inventory and receivables. Debt ratio projected to move ahead of
average. Overall, not in good shapenot in good shape and doesn’t
appear to be improving.
Analysis of the Forecast:How does North West Chemical Compare?
4-24
Capacity Issues
Sales last year $500 Last year at 80% of capacity Sales will increase 50% What percentage will fixed cost and fixed
assets increase?
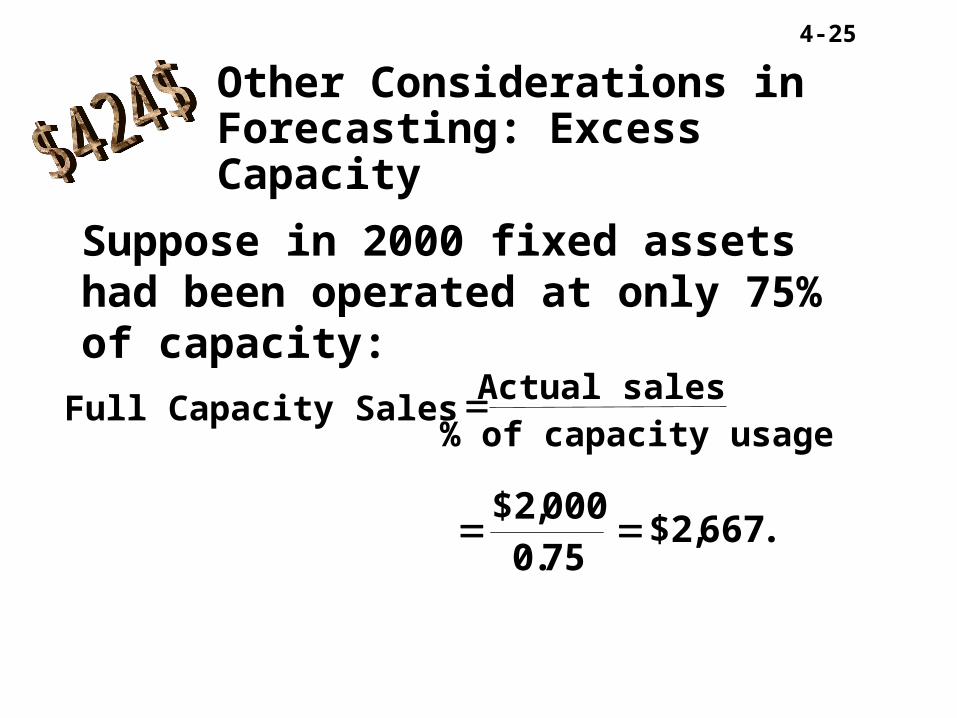
4-25
Suppose in 2000 fixed assets had been operated at only 75% of capacity:
Full Capacity SalesActual sales
% of capacity usage
$2,
.$2, .
000
0 75667
Other Considerations in Forecasting: Excess Capacity
4-26
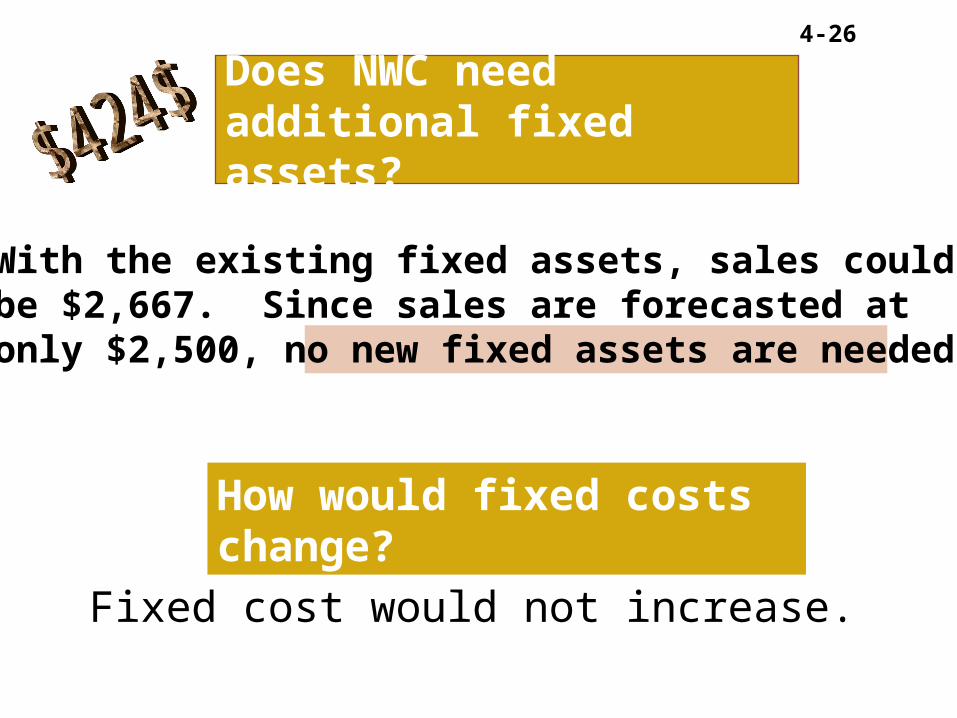
With the existing fixed assets, sales couldbe $2,667. Since sales are forecasted atonly $2,500, no new fixed assets are needed.
Does NWC need additional fixed assets?
How would fixed costs change?
Fixed cost would not increase.
4-27
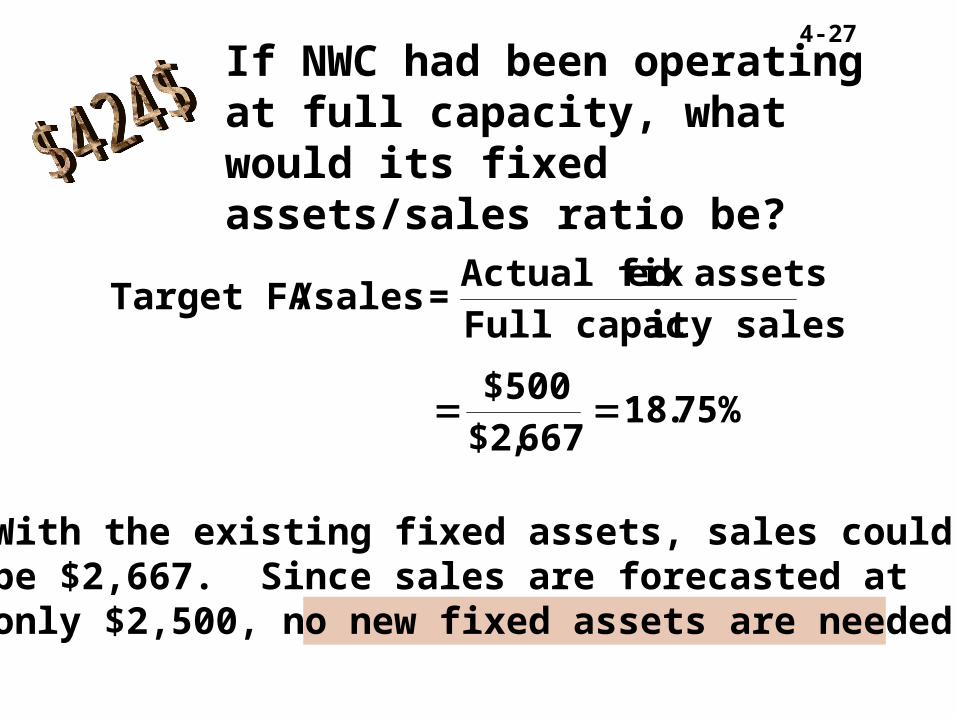
With the existing fixed assets, sales couldbe $2,667. Since sales are forecasted atonly $2,500, no new fixed assets are needed.
If NWC had been operating at full capacity, what would its fixed assets/sales ratio be?
Target FA / sales =Actual fixed assets
Full capacity sales
$500
$2,.
66718 75%

4-28
2000 Factor Initial Forecast
Cash/sec. $20 x1.25 $25
Accts. rec. 240 x1.25 300
Inventories 240 x1.25 300
Total CA $500 $625
Net FA 500 x1.25 625
Total assets $1,000 $1,250
Projected Financial StatementsStep 2. Forecast the 2001 Balance Sheet (Assets)
At full capacity, so all assets mustincrease in proportion to sales.
4-29
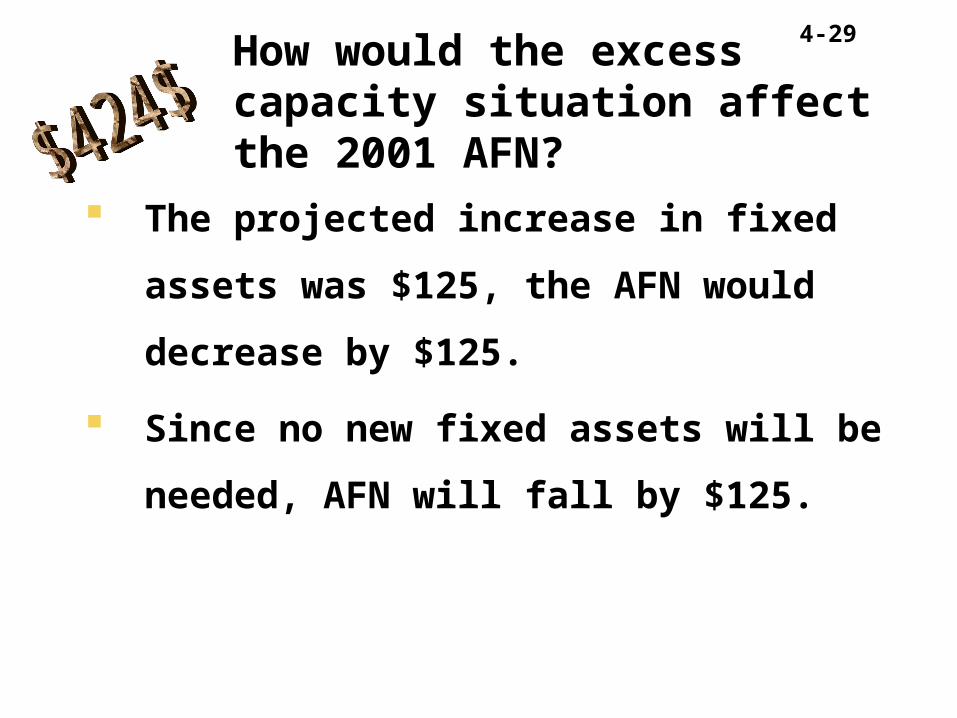
The projected increase in fixed assets was
$125, the AFN would decrease by $125.
Since no new fixed assets will be needed,
AFN will fall by $125.
How would the excess capacity situation affect the 2001 AFN?

4-30
NWC: Projected 2001 Income Statement:
2000 Factor Initial ForecastSales $2,000 x1.25 $2,500Less: VC 1,200 x1.25 1,500 FC 700 x1.25 875 EBIT $ 100 $ 125Interest 16 16 EBT $ 84 $ 109Taxes (40%) 34 44Net. income $ 50 $ 65Div. (30%) $ 15 $ 19Add. to RE $ 35 $ 46

4-31
Fixed cost would not increase, increasing
EBIT by $175
In turn net income and RE would increase,
thus more internal financing and AFN
would be smaller.
How would the excess capacity situation affect the 2001 AFN?

4-32
Sales wouldn’t change but assets would be lower, so turnovers would be better.
Less new debt, hence lower interest, so higher profits, EPS,ROE.
Debt ratio, TIE would improve.
How would excess capacity affect the forecasted ratios?
4-33
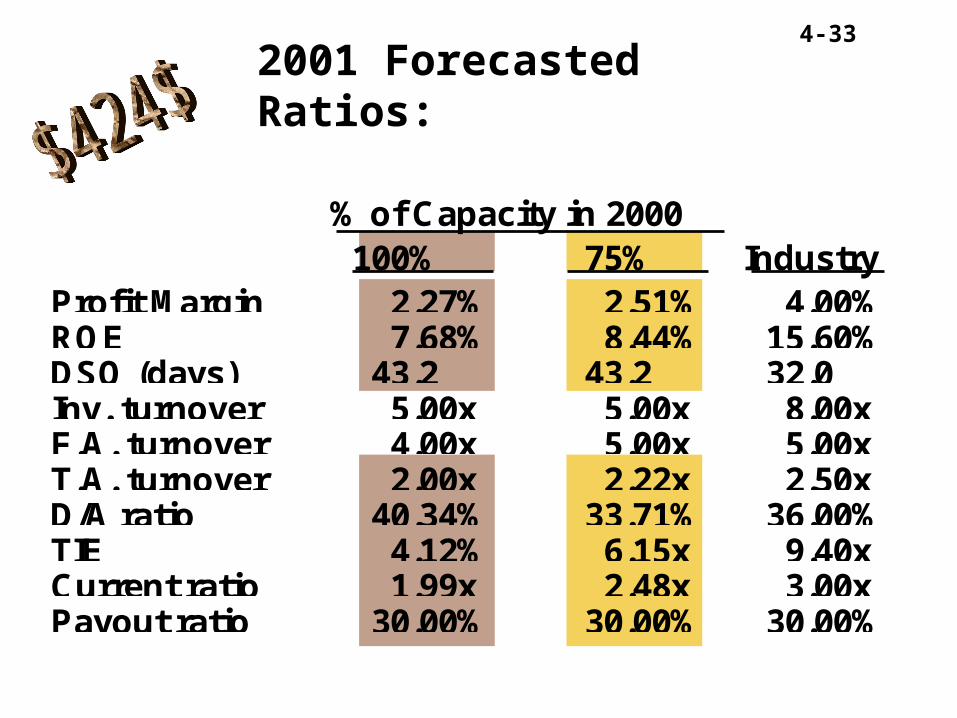
% of Capacity in 2000100% 75% Industry
Profit Margin 2.27% 2.51% 4.00%ROE 7.68% 8.44% 15.60%DSO (days) 43.2 43.2 32.0Inv. turnover 5.00x 5.00x 8.00xF.A. turnover 4.00x 5.00x 5.00xT.A. turnover 2.00x 2.22x 2.50xD/A ratio 40.34% 33.71% 36.00%TIE 4.12% 6.15x 9.40xCurrent ratio 1.99x 2.48x 3.00xPayout ratio 30.00% 30.00% 30.00%
2001 Forecasted Ratios:
4-34
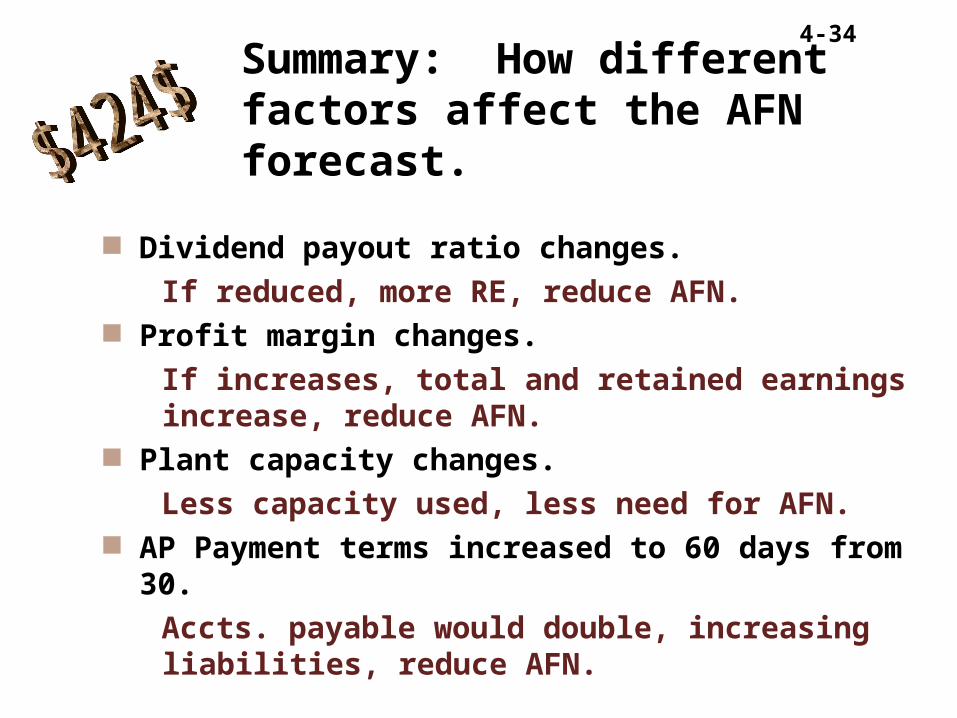
Summary: How different factors affect the AFN forecast.
Dividend payout ratio changes.
If reduced, more RE, reduce AFN. Profit margin changes.
If increases, total and retained earnings increase, reduce AFN.
Plant capacity changes.
Less capacity used, less need for AFN. AP Payment terms increased to 60 days from 30.
Accts. payable would double, increasing liabilities, reduce AFN.