Embed Size (px)
Citation preview
Chapter 4 New Disaster Scenario
4-57
(4) Damage estimation for bridges
A. Collected data
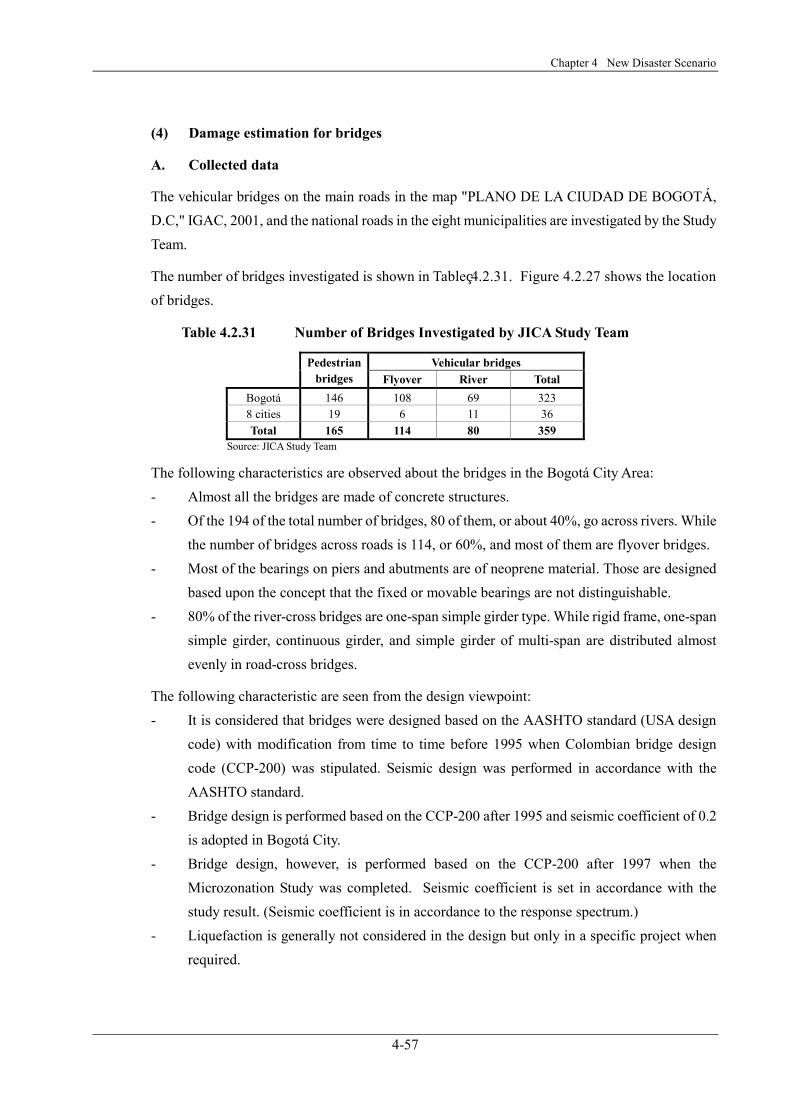
The vehicular bridges on the main roads in the map "PLANO DE LA CIUDAD DE BOGOTÁ, D.C," IGAC, 2001, and the national roads in the eight municipalities are investigated by the Study Team.
The number of bridges investigated is shown in Table 4.2.31. Figure 4.2.27 shows the location of bridges.
Table 4.2.31 Number of Bridges Investigated by JICA Study Team
Vehicular bridges
Pedestrian bridges Flyover River Total
Bogotá 146 108 69 323 8 cities 19 6 11 36 Total 165 114 80 359
Source: JICA Study Team
The following characteristics are observed about the bridges in the Bogotá City Area: - Almost all the bridges are made of concrete structures. - Of the 194 of the total number of bridges, 80 of them, or about 40%, go across rivers. While
the number of bridges across roads is 114, or 60%, and most of them are flyover bridges. - Most of the bearings on piers and abutments are of neoprene material. Those are designed
based upon the concept that the fixed or movable bearings are not distinguishable. - 80% of the river-cross bridges are one-span simple girder type. While rigid frame, one-span
simple girder, continuous girder, and simple girder of multi-span are distributed almost evenly in road-cross bridges.
The following characteristic are seen from the design viewpoint: - It is considered that bridges were designed based on the AASHTO standard (USA design
code) with modification from time to time before 1995 when Colombian bridge design code (CCP-200) was stipulated. Seismic design was performed in accordance with the AASHTO standard.
- Bridge design is performed based on the CCP-200 after 1995 and seismic coefficient of 0.2 is adopted in Bogotá City.
- Bridge design, however, is performed based on the CCP-200 after 1997 when the Microzonation Study was completed. Seismic coefficient is set in accordance with the study result. (Seismic coefficient is in accordance to the response spectrum.)
- Liquefaction is generally not considered in the design but only in a specific project when required.
The Study on Disaster Prevention in the Bogotá Metropolitan Area in the Republic of Colombia
4-58
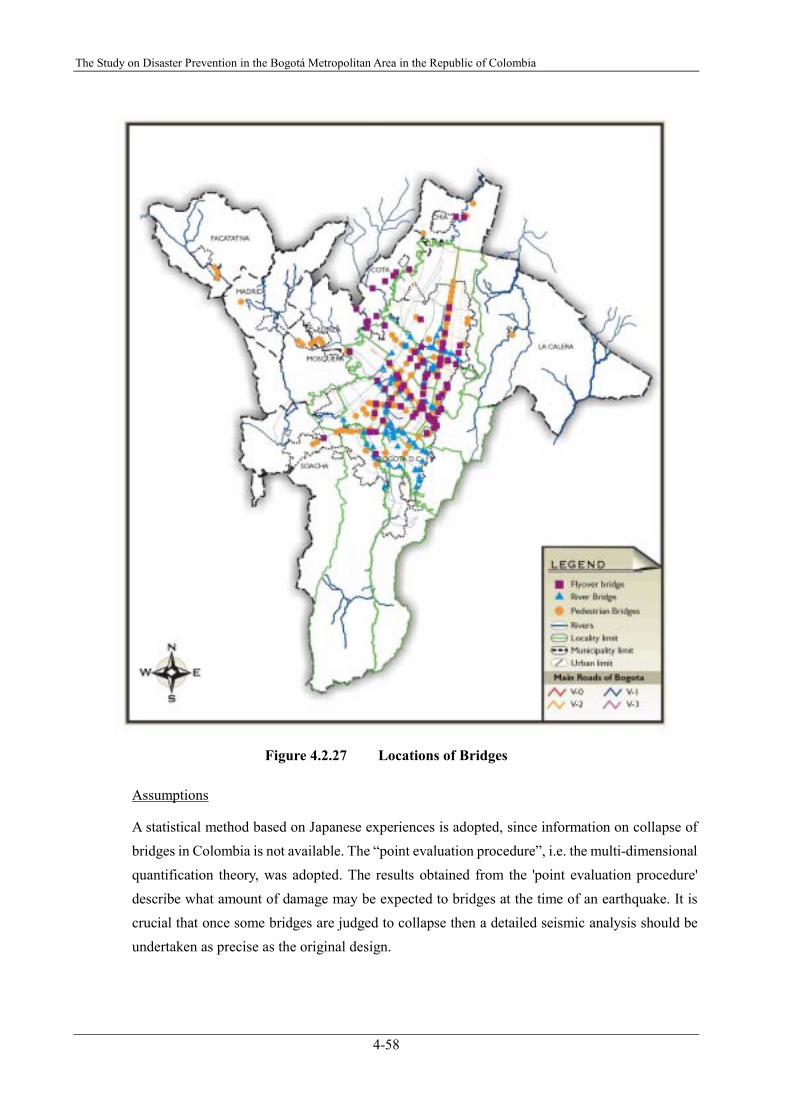
Figure 4.2.27 Locations of Bridges
Assumptions
A statistical method based on Japanese experiences is adopted, since information on collapse of bridges in Colombia is not available. The “point evaluation procedure”, i.e. the multi-dimensional quantification theory, was adopted. The results obtained from the 'point evaluation procedure' describe what amount of damage may be expected to bridges at the time of an earthquake. It is crucial that once some bridges are judged to collapse then a detailed seismic analysis should be undertaken as precise as the original design.
Chapter 4 New Disaster Scenario
4-59
B. Methods and procedures
Procedures
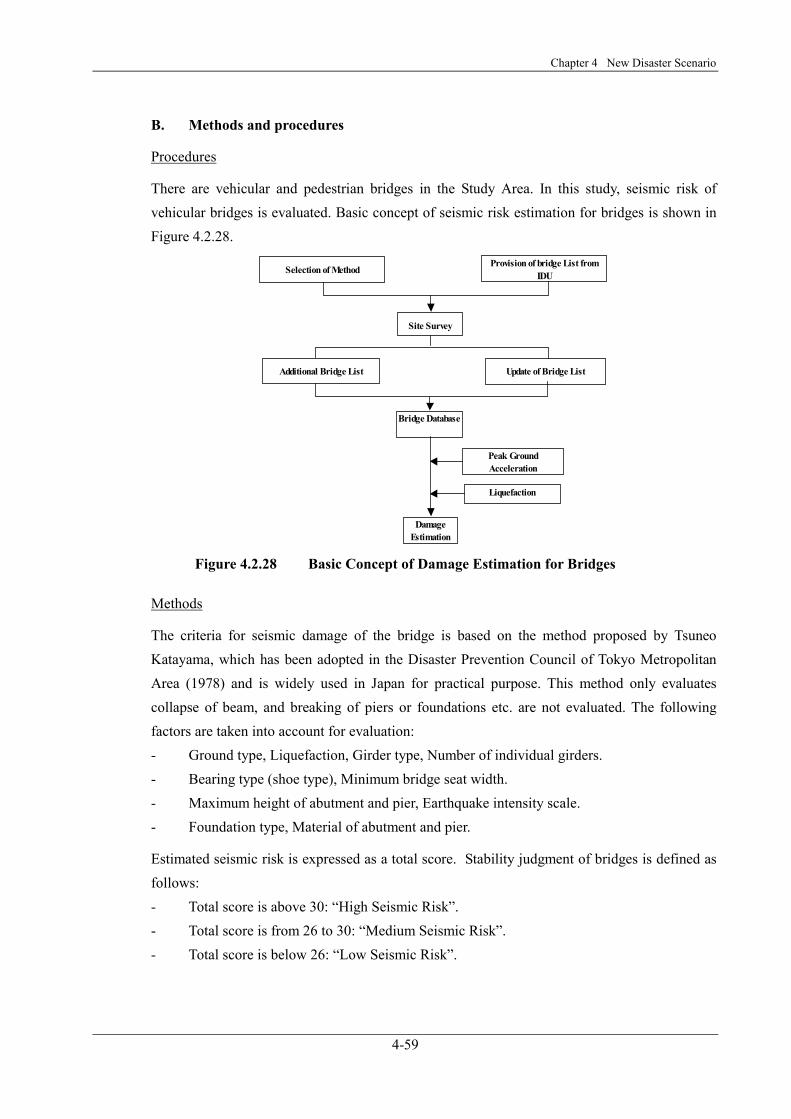
There are vehicular and pedestrian bridges in the Study Area. In this study, seismic risk of vehicular bridges is evaluated. Basic concept of seismic risk estimation for bridges is shown in Figure 4.2.28.
Selection of MethodProvision of bridge List from
IDU
Site Survey
Additional Bridge List Update of Bridge List
Bridge Database
Peak Ground Acceleration
Liquefaction
Damage Estimation
Figure 4.2.28 Basic Concept of Damage Estimation for Bridges
Methods
The criteria for seismic damage of the bridge is based on the method proposed by Tsuneo Katayama, which has been adopted in the Disaster Prevention Council of Tokyo Metropolitan Area (1978) and is widely used in Japan for practical purpose. This method only evaluates collapse of beam, and breaking of piers or foundations etc. are not evaluated. The following factors are taken into account for evaluation: - Ground type, Liquefaction, Girder type, Number of individual girders. - Bearing type (shoe type), Minimum bridge seat width. - Maximum height of abutment and pier, Earthquake intensity scale. - Foundation type, Material of abutment and pier.
Estimated seismic risk is expressed as a total score. Stability judgment of bridges is defined as follows: - Total score is above 30: “High Seismic Risk”. - Total score is from 26 to 30: “Medium Seismic Risk”. - Total score is below 26: “Low Seismic Risk”.
The Study on Disaster Prevention in the Bogotá Metropolitan Area in the Republic of Colombia
4-60
Pedestrian Bridge
In this study, pedestrian bridges are evaluated only with respect to liquefaction potential area. This is partly because collapsed pedestrian bridges will not pose major obstacles after an earthquake, since it is relatively easy to remove the wreckage. Another reason is that there was no collapse of pedestrian bridges in earthquakes in Japan. Furthermore, no information on collapse of pedestrian bridges during earthquakes in Colombia was available.
C. Results of damage estimation
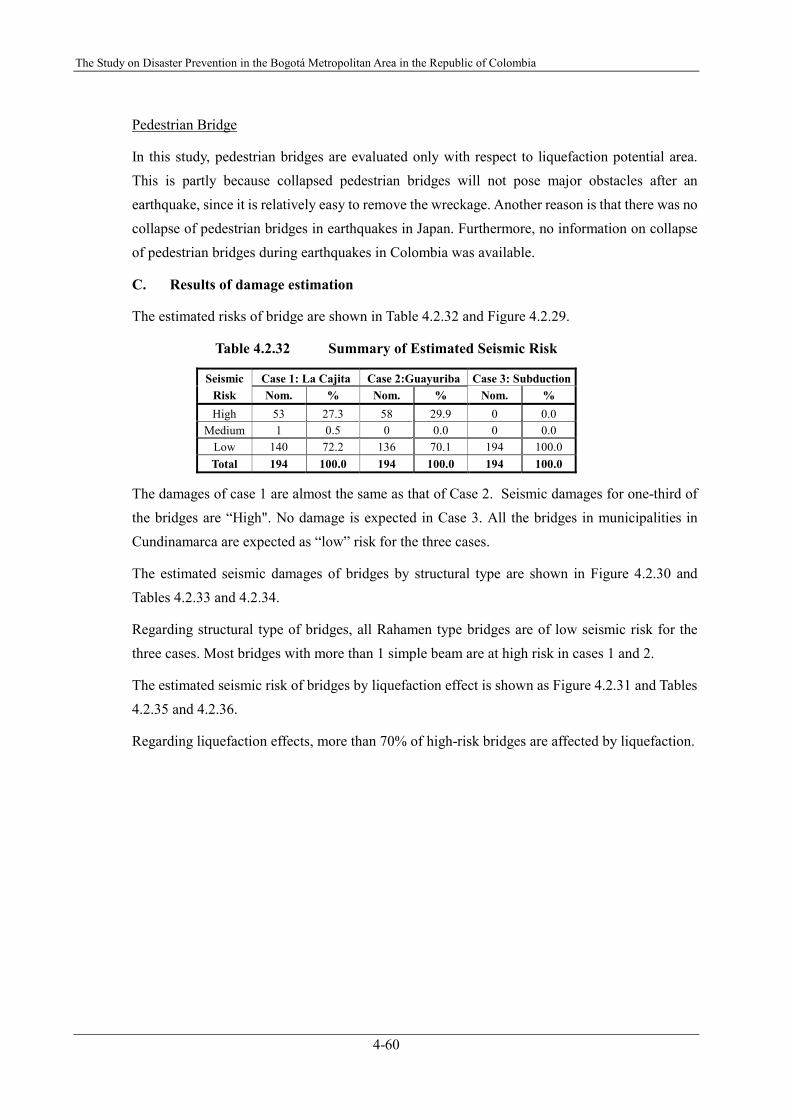
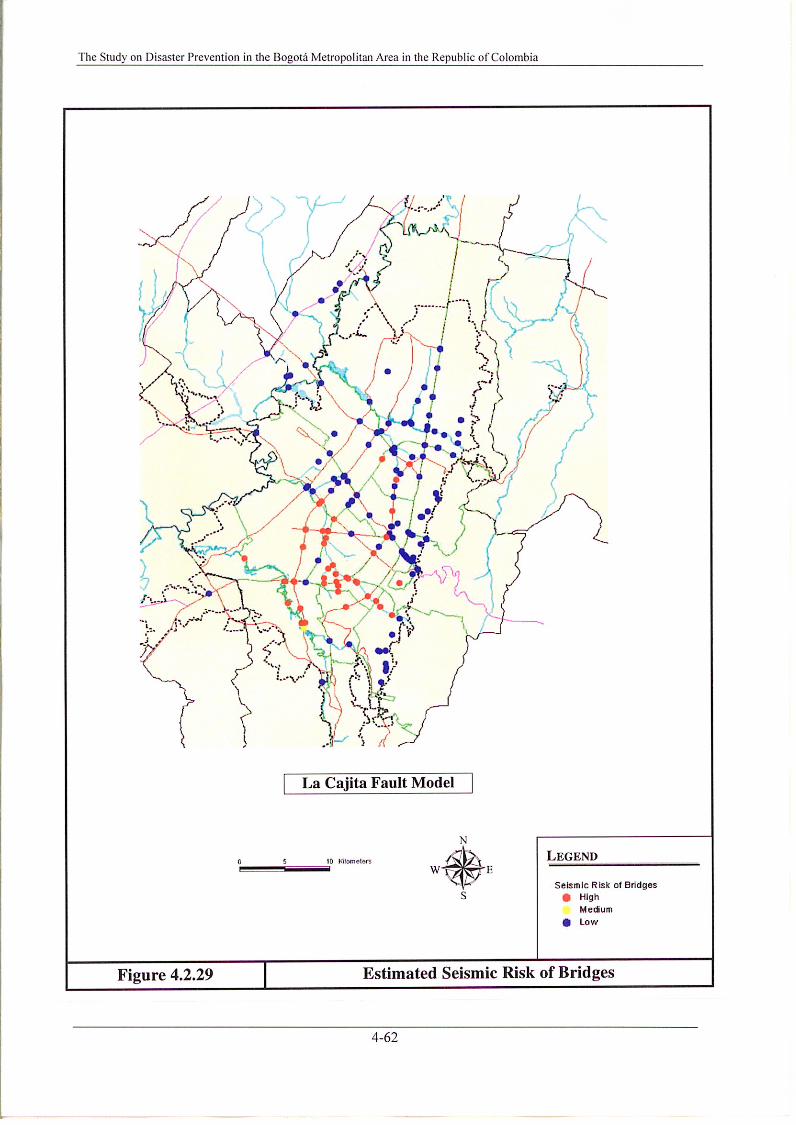
The estimated risks of bridge are shown in Table 4.2.32 and Figure 4.2.29.
Table 4.2.32 Summary of Estimated Seismic Risk
Seismic Case 1: La Cajita Case 2:Guayuriba Case 3: Subduction Risk Nom. % Nom. % Nom. % High 53 27.3 58 29.9 0 0.0
Medium 1 0.5 0 0.0 0 0.0 Low 140 72.2 136 70.1 194 100.0 Total 194 100.0 194 100.0 194 100.0
The damages of case 1 are almost the same as that of Case 2. Seismic damages for one-third of the bridges are “High". No damage is expected in Case 3. All the bridges in municipalities in Cundinamarca are expected as “low” risk for the three cases.
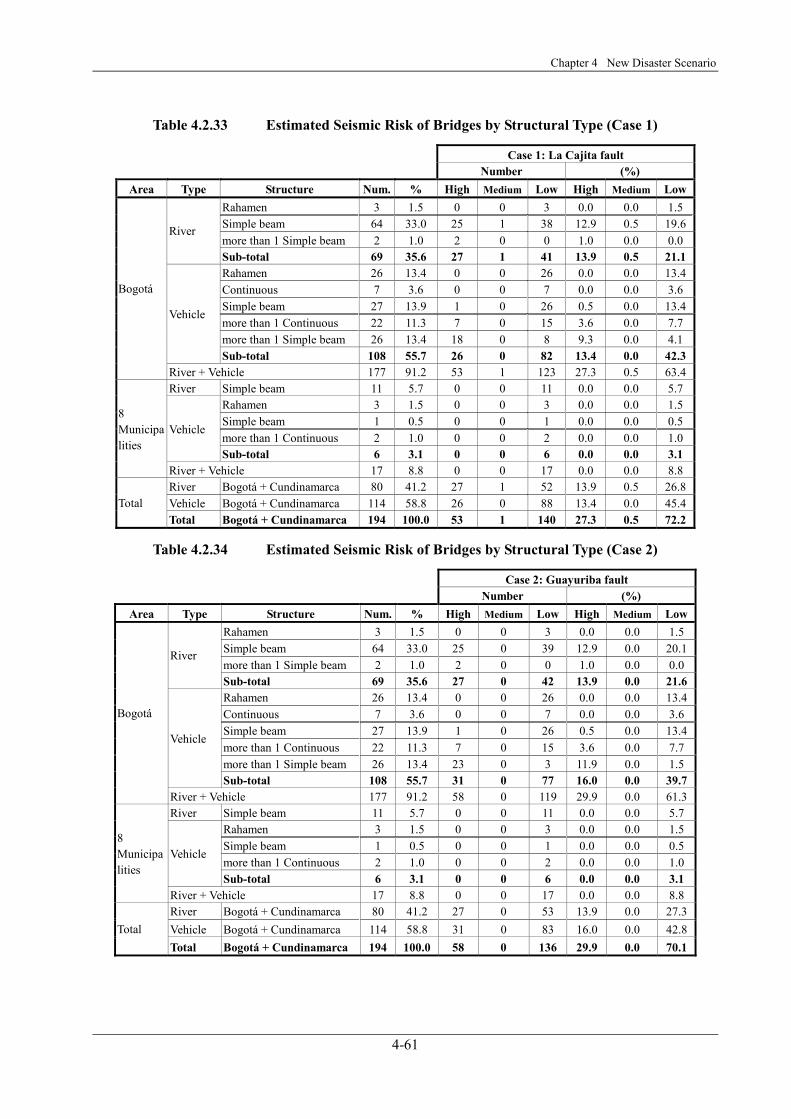
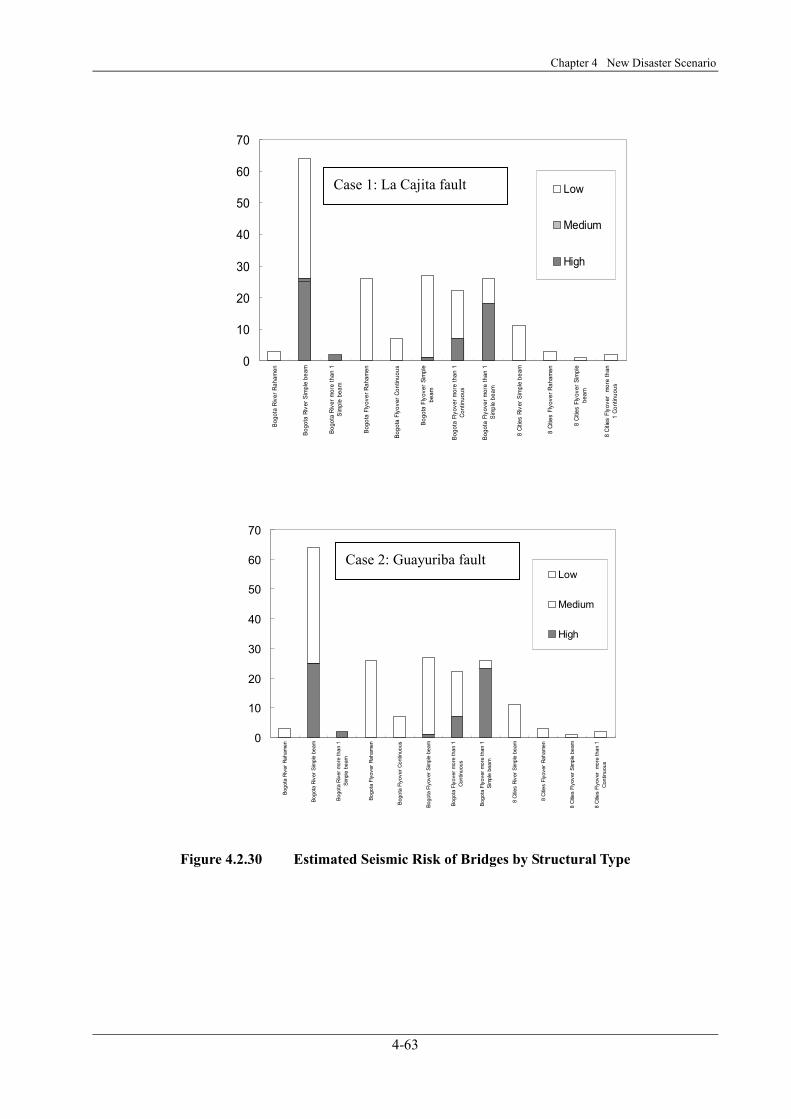
The estimated seismic damages of bridges by structural type are shown in Figure 4.2.30 and Tables 4.2.33 and 4.2.34.
Regarding structural type of bridges, all Rahamen type bridges are of low seismic risk for the three cases. Most bridges with more than 1 simple beam are at high risk in cases 1 and 2.
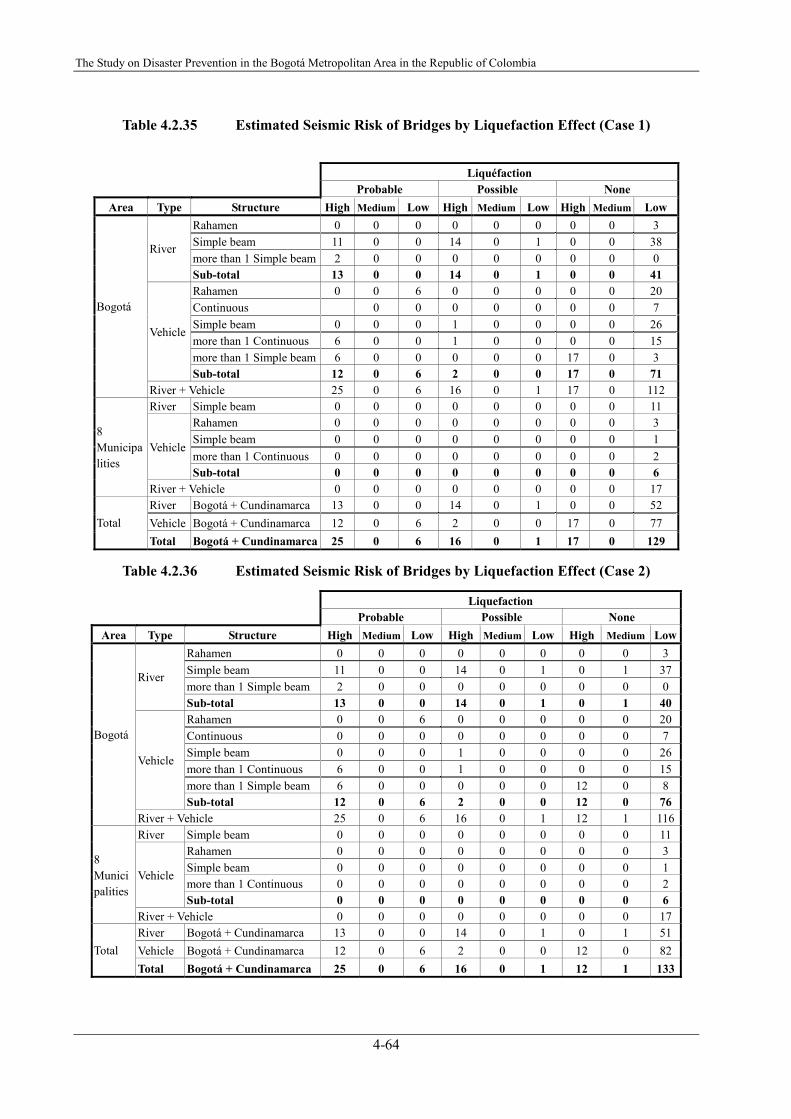
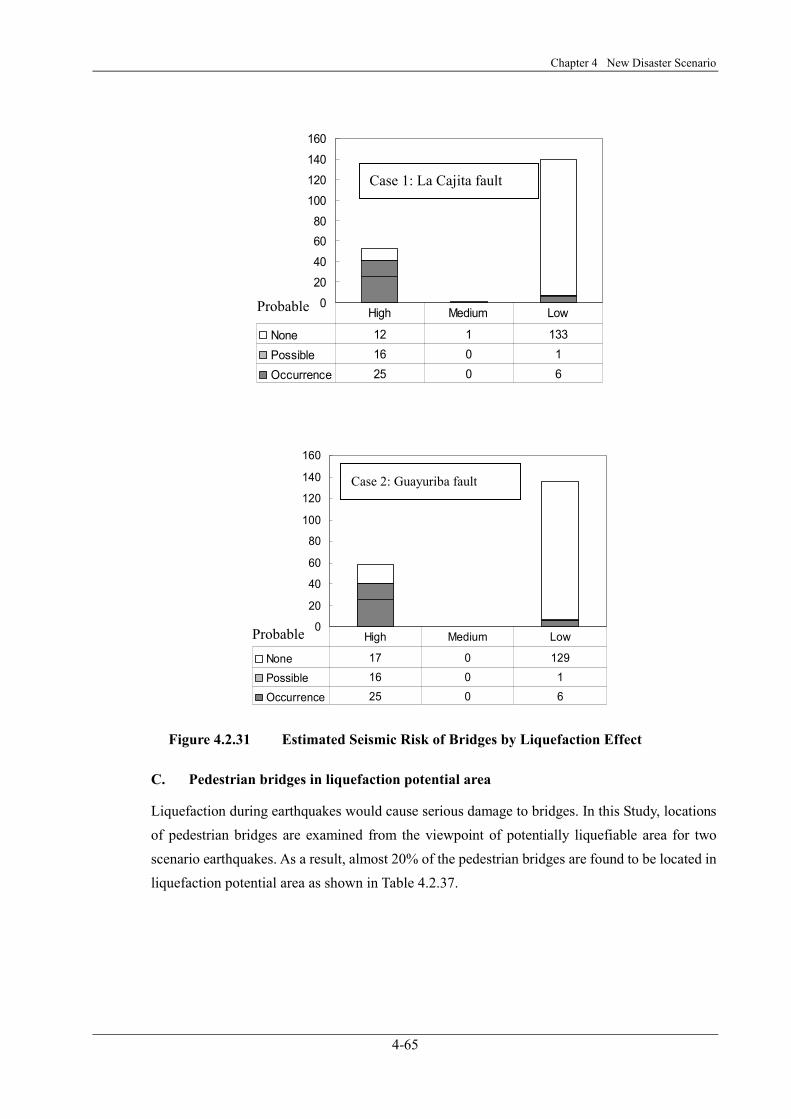
The estimated seismic risk of bridges by liquefaction effect is shown as Figure 4.2.31 and Tables 4.2.35 and 4.2.36.
Regarding liquefaction effects, more than 70% of high-risk bridges are affected by liquefaction.
Chapter 4 New Disaster Scenario
4-61
Table 4.2.33 Estimated Seismic Risk of Bridges by Structural Type (Case 1)
Case 1: La Cajita fault Number (%)
Area Type Structure Num. % High Medium Low High Medium LowRahamen 3 1.5 0 0 3 0.0 0.0 1.5Simple beam 64 33.0 25 1 38 12.9 0.5 19.6more than 1 Simple beam 2 1.0 2 0 0 1.0 0.0 0.0
River
Sub-total 69 35.6 27 1 41 13.9 0.5 21.1Rahamen 26 13.4 0 0 26 0.0 0.0 13.4Continuous 7 3.6 0 0 7 0.0 0.0 3.6Simple beam 27 13.9 1 0 26 0.5 0.0 13.4more than 1 Continuous 22 11.3 7 0 15 3.6 0.0 7.7more than 1 Simple beam 26 13.4 18 0 8 9.3 0.0 4.1
Vehicle
Sub-total 108 55.7 26 0 82 13.4 0.0 42.3
Bogotá
River + Vehicle 177 91.2 53 1 123 27.3 0.5 63.4River Simple beam 11 5.7 0 0 11 0.0 0.0 5.7
Rahamen 3 1.5 0 0 3 0.0 0.0 1.5Simple beam 1 0.5 0 0 1 0.0 0.0 0.5more than 1 Continuous 2 1.0 0 0 2 0.0 0.0 1.0
Vehicle
Sub-total 6 3.1 0 0 6 0.0 0.0 3.1
8 Municipalities
River + Vehicle 17 8.8 0 0 17 0.0 0.0 8.8River Bogotá + Cundinamarca 80 41.2 27 1 52 13.9 0.5 26.8Vehicle Bogotá + Cundinamarca 114 58.8 26 0 88 13.4 0.0 45.4Total Total Bogotá + Cundinamarca 194 100.0 53 1 140 27.3 0.5 72.2
Table 4.2.34 Estimated Seismic Risk of Bridges by Structural Type (Case 2)
Case 2: Guayuriba fault Number (%)
Area Type Structure Num. % High Medium Low High Medium LowRahamen 3 1.5 0 0 3 0.0 0.0 1.5Simple beam 64 33.0 25 0 39 12.9 0.0 20.1more than 1 Simple beam 2 1.0 2 0 0 1.0 0.0 0.0
River
Sub-total 69 35.6 27 0 42 13.9 0.0 21.6Rahamen 26 13.4 0 0 26 0.0 0.0 13.4Continuous 7 3.6 0 0 7 0.0 0.0 3.6Simple beam 27 13.9 1 0 26 0.5 0.0 13.4more than 1 Continuous 22 11.3 7 0 15 3.6 0.0 7.7more than 1 Simple beam 26 13.4 23 0 3 11.9 0.0 1.5
Vehicle
Sub-total 108 55.7 31 0 77 16.0 0.0 39.7
Bogotá
River + Vehicle 177 91.2 58 0 119 29.9 0.0 61.3River Simple beam 11 5.7 0 0 11 0.0 0.0 5.7
Rahamen 3 1.5 0 0 3 0.0 0.0 1.5Simple beam 1 0.5 0 0 1 0.0 0.0 0.5more than 1 Continuous 2 1.0 0 0 2 0.0 0.0 1.0
Vehicle
Sub-total 6 3.1 0 0 6 0.0 0.0 3.1
8 Municipalities
River + Vehicle 17 8.8 0 0 17 0.0 0.0 8.8River Bogotá + Cundinamarca 80 41.2 27 0 53 13.9 0.0 27.3Vehicle Bogotá + Cundinamarca 114 58.8 31 0 83 16.0 0.0 42.8Total Total Bogotá + Cundinamarca 194 100.0 58 0 136 29.9 0.0 70.1
Chapter 4 New Disaster Scenario
4-63
0
10
20
30
40
50
60
70
Bogo
ta R
iver
Rah
amen
Bogo
ta R
iver
Sim
ple
beam
Bogo
ta R
iver
mor
e th
an 1
Sim
ple
beam
Bogo
ta F
lyov
er R
aham
en
Bogo
ta F
lyov
er C
ontin
uous
Bogo
ta F
lyov
er S
impl
ebe
am
Bogo
ta F
lyov
er m
ore
than
1Co
ntin
uous
Bogo
ta F
lyov
er m
ore
than
1Si
mpl
e be
am
8 Ci
ties
Rive
r Sim
ple
beam
8 Ci
ties
Flyo
ver R
aham
en
8 Ci
ties
Flyo
ver S
impl
ebe
am
8 Ci
ties
Flyo
ver
mor
e th
an1
Cont
inuo
us
Low
Medium
High
0
10
20
30
40
50
60
70
Bogo
ta R
iver
Rah
amen
Bogo
ta R
iver
Sim
ple
beam
Bogo
ta R
iver
mor
e th
an 1
Sim
ple
beam
Bogo
ta F
lyov
er R
aham
en
Bogo
ta F
lyov
er C
ontin
uous
Bogo
ta F
lyov
er S
impl
e be
am
Bogo
ta F
lyov
er m
ore
than
1Co
ntin
uous
Bogo
ta F
lyov
er m
ore
than
1Si
mpl
e be
am
8 Ci
ties
Rive
r Sim
ple
beam
8 Ci
ties
Flyo
ver R
aham
en
8 Ci
ties
Flyo
ver S
impl
e be
am
8 Ci
ties
Flyo
ver
mor
e th
an 1
Cont
inuo
us
Low
Medium
High
Figure 4.2.30 Estimated Seismic Risk of Bridges by Structural Type
Case 2: Guayuriba fault
Case 1: La Cajita fault
The Study on Disaster Prevention in the Bogotá Metropolitan Area in the Republic of Colombia
4-64
Table 4.2.35 Estimated Seismic Risk of Bridges by Liquefaction Effect (Case 1)
Table 4.2.36 Estimated Seismic Risk of Bridges by Liquefaction Effect (Case 2)
Liquefaction Probable Possible None
Area Type Structure High Medium Low High Medium Low High Medium LowRahamen 0 0 0 0 0 0 0 0 3Simple beam 11 0 0 14 0 1 0 1 37more than 1 Simple beam 2 0 0 0 0 0 0 0 0
River
Sub-total 13 0 0 14 0 1 0 1 40Rahamen 0 0 6 0 0 0 0 0 20Continuous 0 0 0 0 0 0 0 0 7Simple beam 0 0 0 1 0 0 0 0 26more than 1 Continuous 6 0 0 1 0 0 0 0 15more than 1 Simple beam 6 0 0 0 0 0 12 0 8
Vehicle
Sub-total 12 0 6 2 0 0 12 0 76
Bogotá
River + Vehicle 25 0 6 16 0 1 12 1 116River Simple beam 0 0 0 0 0 0 0 0 11
Rahamen 0 0 0 0 0 0 0 0 3Simple beam 0 0 0 0 0 0 0 0 1more than 1 Continuous 0 0 0 0 0 0 0 0 2
Vehicle
Sub-total 0 0 0 0 0 0 0 0 6
8 Municipalities
River + Vehicle 0 0 0 0 0 0 0 0 17River Bogotá + Cundinamarca 13 0 0 14 0 1 0 1 51Vehicle Bogotá + Cundinamarca 12 0 6 2 0 0 12 0 82Total Total Bogotá + Cundinamarca 25 0 6 16 0 1 12 1 133
Liquéfaction Probable Possible None
Area Type Structure High Medium Low High Medium Low High Medium LowRahamen 0 0 0 0 0 0 0 0 3 Simple beam 11 0 0 14 0 1 0 0 38 more than 1 Simple beam 2 0 0 0 0 0 0 0 0
River
Sub-total 13 0 0 14 0 1 0 0 41 Rahamen 0 0 6 0 0 0 0 0 20 Continuous 0 0 0 0 0 0 0 7 Simple beam 0 0 0 1 0 0 0 0 26 more than 1 Continuous 6 0 0 1 0 0 0 0 15 more than 1 Simple beam 6 0 0 0 0 0 17 0 3
Vehicle
Sub-total 12 0 6 2 0 0 17 0 71
Bogotá
River + Vehicle 25 0 6 16 0 1 17 0 112 River Simple beam 0 0 0 0 0 0 0 0 11
Rahamen 0 0 0 0 0 0 0 0 3 Simple beam 0 0 0 0 0 0 0 0 1 more than 1 Continuous 0 0 0 0 0 0 0 0 2
Vehicle
Sub-total 0 0 0 0 0 0 0 0 6
8 Municipalities
River + Vehicle 0 0 0 0 0 0 0 0 17 River Bogotá + Cundinamarca 13 0 0 14 0 1 0 0 52 Vehicle Bogotá + Cundinamarca 12 0 6 2 0 0 17 0 77 Total Total Bogotá + Cundinamarca 25 0 6 16 0 1 17 0 129
Chapter 4 New Disaster Scenario
4-65
020406080
100120140
160
None 12 1 133Possible 16 0 1Occurrence 25 0 6
High Medium Low
0
20
40
60
80
100
120
140
160
None 17 0 129
Possible 16 0 1
Occurrence 25 0 6
High Medium Low
Figure 4.2.31 Estimated Seismic Risk of Bridges by Liquefaction Effect
C. Pedestrian bridges in liquefaction potential area
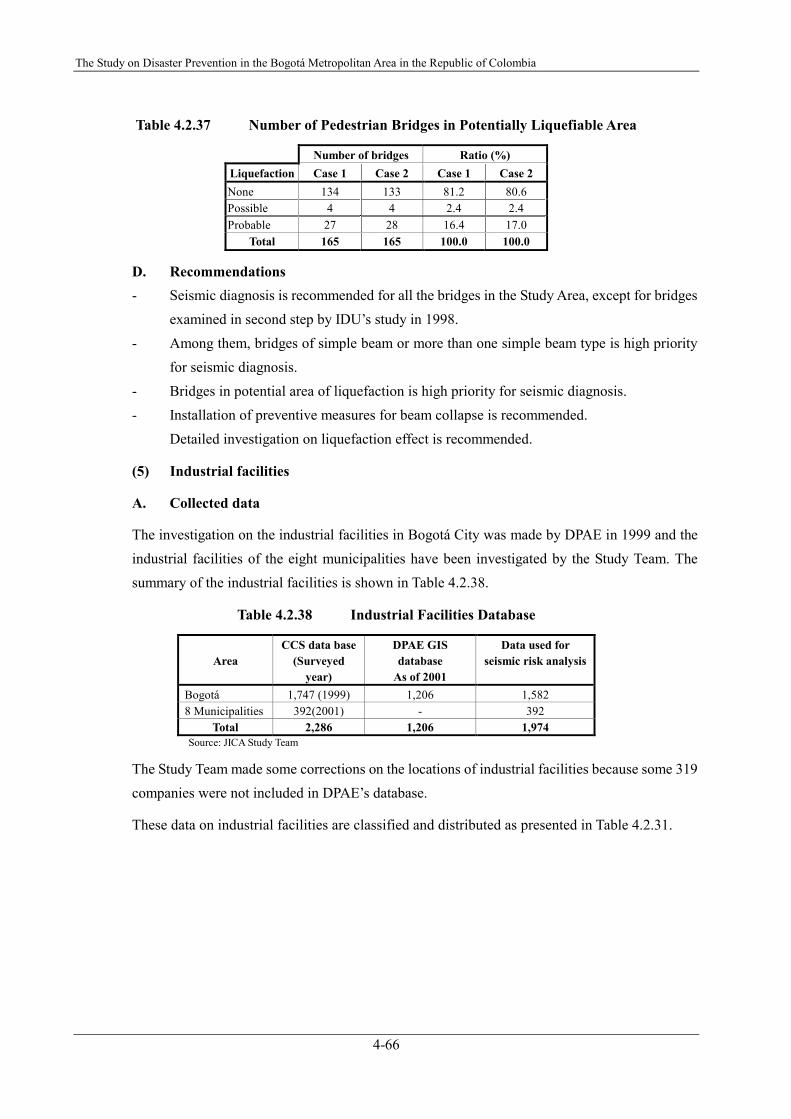
Liquefaction during earthquakes would cause serious damage to bridges. In this Study, locations of pedestrian bridges are examined from the viewpoint of potentially liquefiable area for two scenario earthquakes. As a result, almost 20% of the pedestrian bridges are found to be located in liquefaction potential area as shown in Table 4.2.37.
Case 2: Guayuriba fault
Case 1: La Cajita fault
Probable
Probable
The Study on Disaster Prevention in the Bogotá Metropolitan Area in the Republic of Colombia
4-66
Table 4.2.37 Number of Pedestrian Bridges in Potentially Liquefiable Area
Number of bridges Ratio (%) Liquefaction Case 1 Case 2 Case 1 Case 2 None 134 133 81.2 80.6 Possible 4 4 2.4 2.4 Probable 27 28 16.4 17.0
Total 165 165 100.0 100.0
D. Recommendations - Seismic diagnosis is recommended for all the bridges in the Study Area, except for bridges
examined in second step by IDU’s study in 1998. - Among them, bridges of simple beam or more than one simple beam type is high priority
for seismic diagnosis. - Bridges in potential area of liquefaction is high priority for seismic diagnosis. - Installation of preventive measures for beam collapse is recommended. Detailed investigation on liquefaction effect is recommended.
(5) Industrial facilities
A. Collected data
The investigation on the industrial facilities in Bogotá City was made by DPAE in 1999 and the industrial facilities of the eight municipalities have been investigated by the Study Team. The summary of the industrial facilities is shown in Table 4.2.38.
Table 4.2.38 Industrial Facilities Database
Area
CCS data base(Surveyed
year)
DPAE GIS database
As of 2001
Data used for seismic risk analysis
Bogotá 1,747 (1999) 1,206 1,582 8 Municipalities 392(2001) - 392
Total 2,286 1,206 1,974 Source: JICA Study Team
The Study Team made some corrections on the locations of industrial facilities because some 319 companies were not included in DPAE’s database.
These data on industrial facilities are classified and distributed as presented in Table 4.2.31.
Chapter 4 New Disaster Scenario
4-67
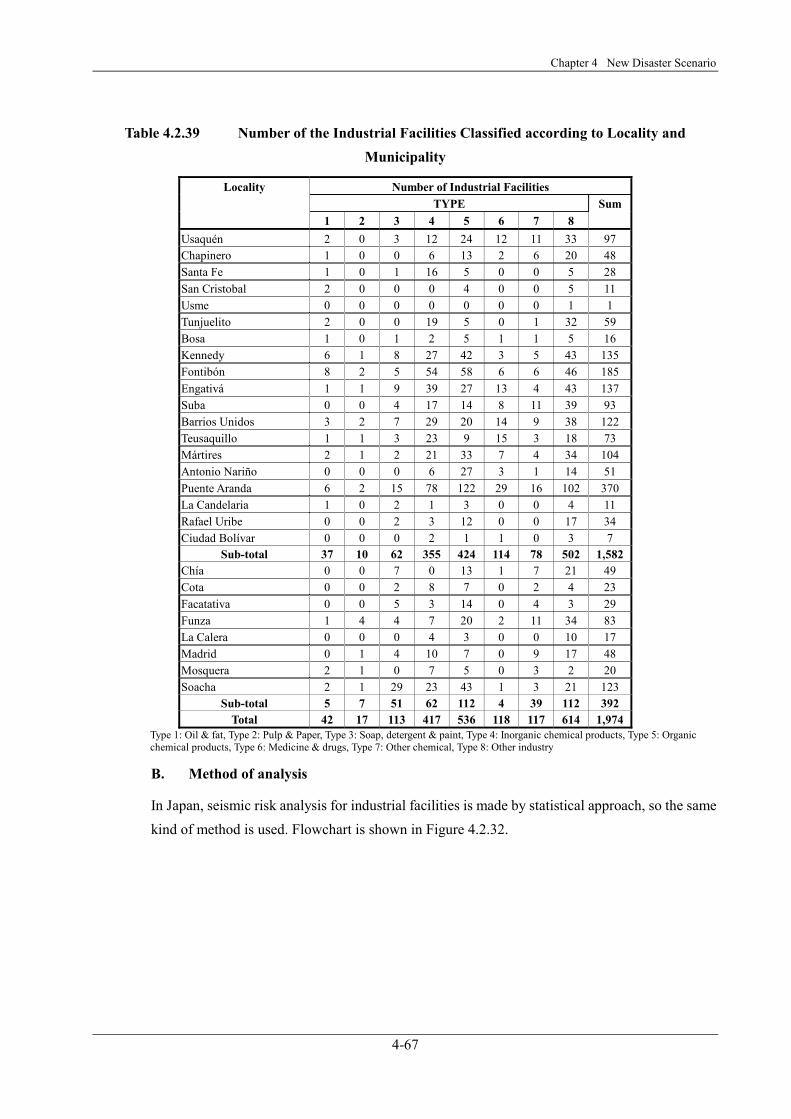
Table 4.2.39 Number of the Industrial Facilities Classified according to Locality and Municipality
Locality Number of Industrial Facilities TYPE Sum 1 2 3 4 5 6 7 8
Usaquén 2 0 3 12 24 12 11 33 97 Chapinero 1 0 0 6 13 2 6 20 48 Santa Fe 1 0 1 16 5 0 0 5 28 San Cristobal 2 0 0 0 4 0 0 5 11 Usme 0 0 0 0 0 0 0 1 1 Tunjuelito 2 0 0 19 5 0 1 32 59 Bosa 1 0 1 2 5 1 1 5 16 Kennedy 6 1 8 27 42 3 5 43 135 Fontibón 8 2 5 54 58 6 6 46 185 Engativá 1 1 9 39 27 13 4 43 137 Suba 0 0 4 17 14 8 11 39 93 Barrios Unidos 3 2 7 29 20 14 9 38 122 Teusaquillo 1 1 3 23 9 15 3 18 73 Mártires 2 1 2 21 33 7 4 34 104 Antonio Nariño 0 0 0 6 27 3 1 14 51 Puente Aranda 6 2 15 78 122 29 16 102 370 La Candelaria 1 0 2 1 3 0 0 4 11 Rafael Uribe 0 0 2 3 12 0 0 17 34 Ciudad Bolívar 0 0 0 2 1 1 0 3 7
Sub-total 37 10 62 355 424 114 78 502 1,582 Chía 0 0 7 0 13 1 7 21 49 Cota 0 0 2 8 7 0 2 4 23 Facatativa 0 0 5 3 14 0 4 3 29 Funza 1 4 4 7 20 2 11 34 83 La Calera 0 0 0 4 3 0 0 10 17 Madrid 0 1 4 10 7 0 9 17 48 Mosquera 2 1 0 7 5 0 3 2 20 Soacha 2 1 29 23 43 1 3 21 123
Sub-total 5 7 51 62 112 4 39 112 392 Total 42 17 113 417 536 118 117 614 1,974
Type 1: Oil & fat, Type 2: Pulp & Paper, Type 3: Soap, detergent & paint, Type 4: Inorganic chemical products, Type 5: Organic chemical products, Type 6: Medicine & drugs, Type 7: Other chemical, Type 8: Other industry
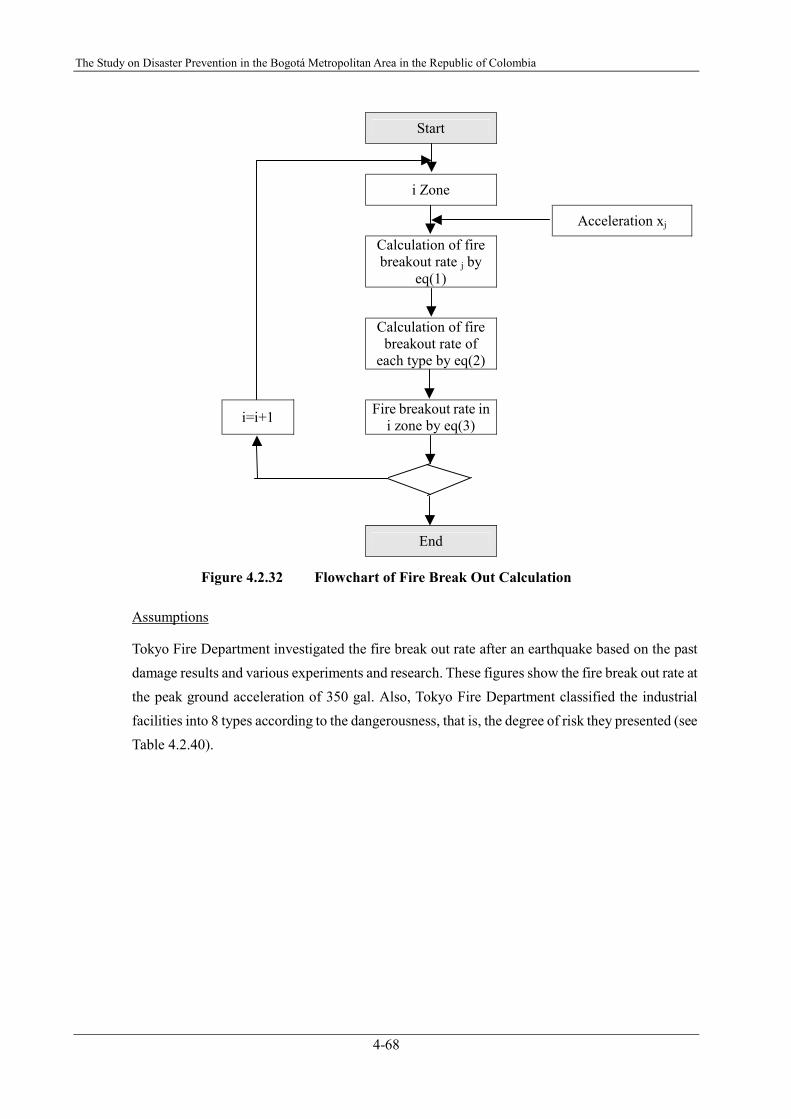
B. Method of analysis
In Japan, seismic risk analysis for industrial facilities is made by statistical approach, so the same kind of method is used. Flowchart is shown in Figure 4.2.32.
The Study on Disaster Prevention in the Bogotá Metropolitan Area in the Republic of Colombia
4-68
Start
i Zone
Acceleration xj
Calculation of fire breakout rate j by
eq(1)
Calculation of fire
breakout rate of each type by eq(2)
i=i+1 Fire breakout rate in i zone by eq(3)
End
Figure 4.2.32 Flowchart of Fire Break Out Calculation
Assumptions
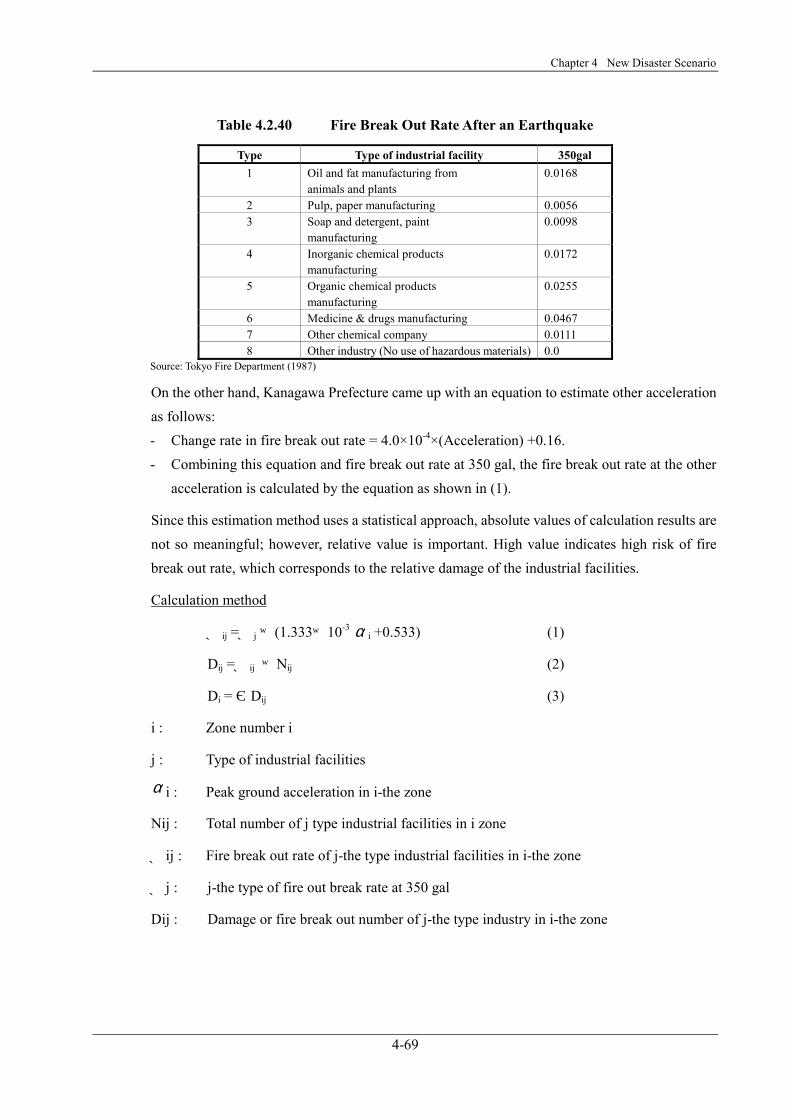
Tokyo Fire Department investigated the fire break out rate after an earthquake based on the past damage results and various experiments and research. These figures show the fire break out rate at the peak ground acceleration of 350 gal. Also, Tokyo Fire Department classified the industrial facilities into 8 types according to the dangerousness, that is, the degree of risk they presented (see Table 4.2.40).
Chapter 4 New Disaster Scenario
4-69
Table 4.2.40 Fire Break Out Rate After an Earthquake
Type Type of industrial facility 350gal 1 Oil and fat manufacturing from
animals and plants 0.0168
2 Pulp, paper manufacturing 0.0056 3 Soap and detergent, paint
manufacturing 0.0098
4 Inorganic chemical products manufacturing
0.0172
5 Organic chemical products manufacturing
0.0255
6 Medicine & drugs manufacturing 0.0467 7 Other chemical company 0.0111 8 Other industry (No use of hazardous materials) 0.0
Source: Tokyo Fire Department (1987)
On the other hand, Kanagawa Prefecture came up with an equation to estimate other acceleration as follows: - Change rate in fire break out rate = 4.0×10⁻⁴×(Acceleration) +0.16. - Combining this equation and fire break out rate at 350 gal, the fire break out rate at the other
acceleration is calculated by the equation as shown in (1).
Since this estimation method uses a statistical approach, absolute values of calculation results are not so meaningful; however, relative value is important. High value indicates high risk of fire break out rate, which corresponds to the relative damage of the industrial facilities.
Calculation method
Aij =Aj ×(1.333×10⁻³ α i +0.533) (1)
Dij =Aij ×Nij (2)
Di = ΣDij (3)
i : Zone number i
j : Type of industrial facilities
α i : Peak ground acceleration in i-the zone
Nij : Total number of j type industrial facilities in i zone
Aij : Fire break out rate of j-the type industrial facilities in i-the zone
Aj : j-the type of fire out break rate at 350 gal
Dij : Damage or fire break out number of j-the type industry in i-the zone
The Study on Disaster Prevention in the Bogotá Metropolitan Area in the Republic of Colombia
4-70
0,00
0,02
0,04
0,06
0,08
0 200 400 600 800
Acceleration(gal)
Firebreaout rate Oil and fat
Pulp,paperSoap
InorganicOrganic chemMedicineOther chem
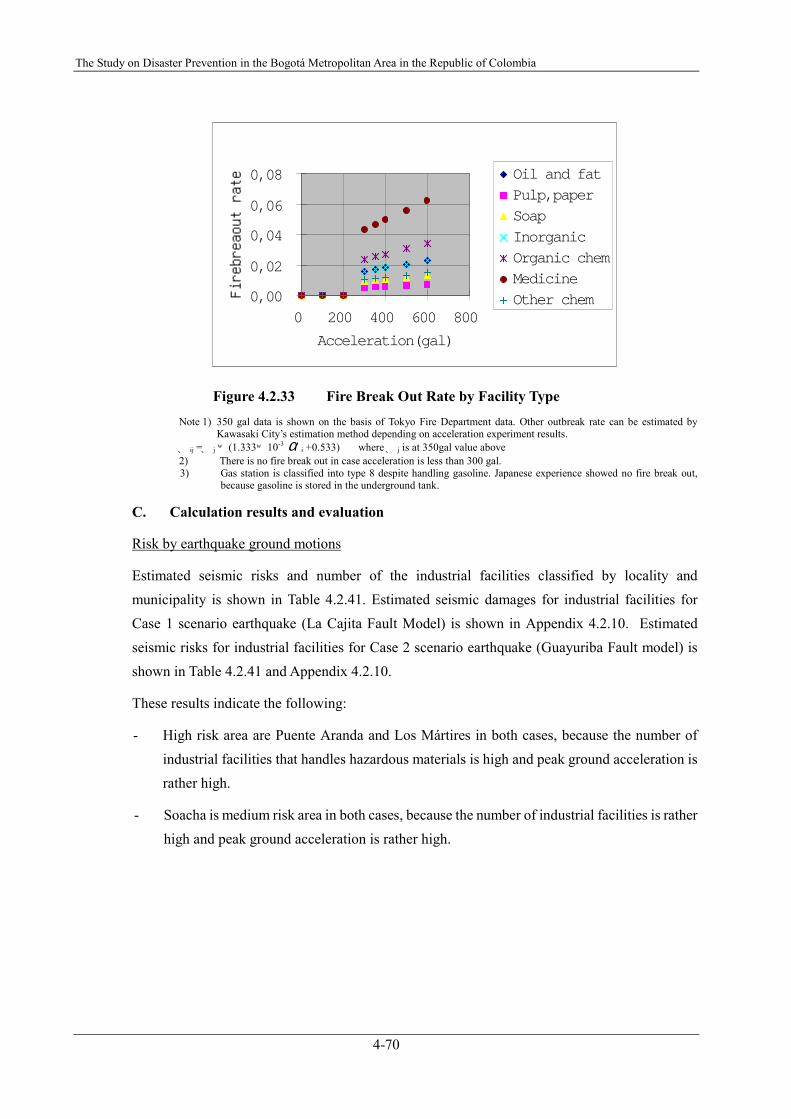
Figure 4.2.33 Fire Break Out Rate by Facility Type
Note 1) 350 gal data is shown on the basis of Tokyo Fire Department data. Other outbreak rate can be estimated by Kawasaki City’s estimation method depending on acceleration experiment results.
Aij =Aj ×(1.333×10⁻³ α i +0.533) where Aj is at 350gal value above 2) There is no fire break out in case acceleration is less than 300 gal. 3) Gas station is classified into type 8 despite handling gasoline. Japanese experience showed no fire break out,
because gasoline is stored in the underground tank.
C. Calculation results and evaluation
Risk by earthquake ground motions
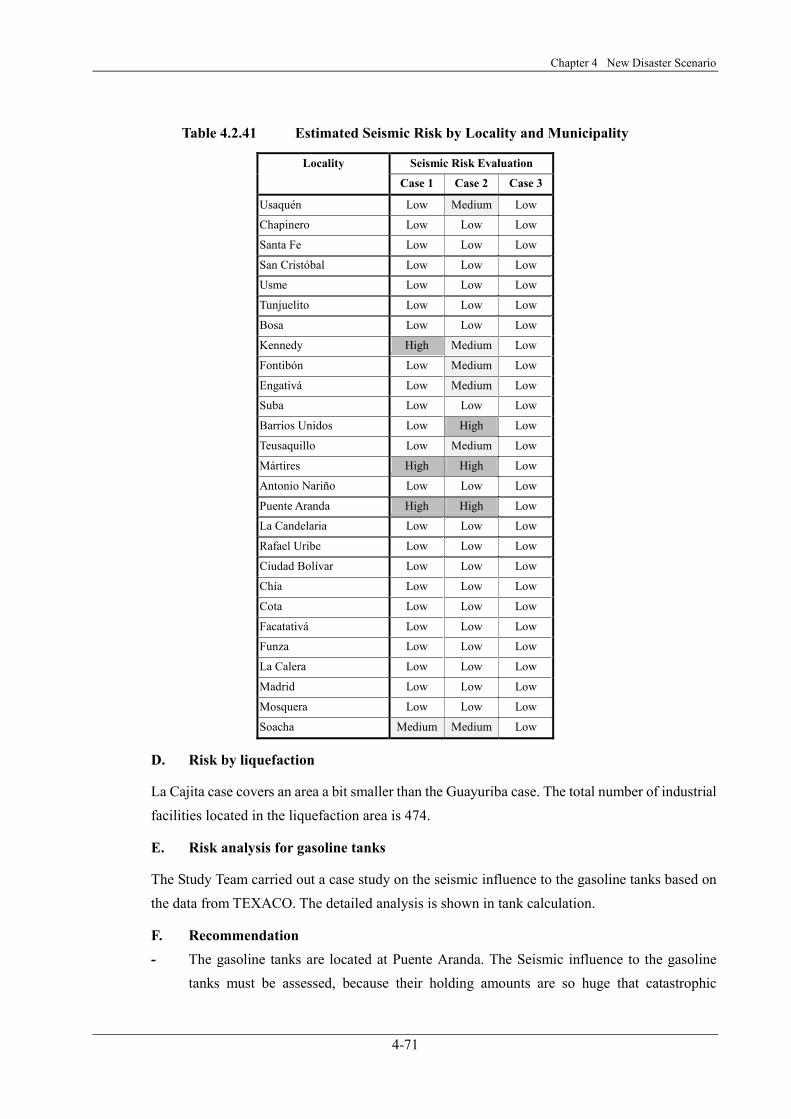
Estimated seismic risks and number of the industrial facilities classified by locality and municipality is shown in Table 4.2.41. Estimated seismic damages for industrial facilities for Case 1 scenario earthquake (La Cajita Fault Model) is shown in Appendix 4.2.10. Estimated seismic risks for industrial facilities for Case 2 scenario earthquake (Guayuriba Fault model) is shown in Table 4.2.41 and Appendix 4.2.10.
These results indicate the following:
- High risk area are Puente Aranda and Los Mártires in both cases, because the number of industrial facilities that handles hazardous materials is high and peak ground acceleration is rather high.
- Soacha is medium risk area in both cases, because the number of industrial facilities is rather high and peak ground acceleration is rather high.
Chapter 4 New Disaster Scenario
4-71
Table 4.2.41 Estimated Seismic Risk by Locality and Municipality
Locality Seismic Risk Evaluation
Case 1 Case 2 Case 3
Usaquén Low Medium Low
Chapinero Low Low Low
Santa Fe Low Low Low
San Cristóbal Low Low Low
Usme Low Low Low
Tunjuelito Low Low Low
Bosa Low Low Low
Kennedy High Medium Low
Fontibón Low Medium Low
Engativá Low Medium Low
Suba Low Low Low
Barrios Unidos Low High Low
Teusaquillo Low Medium Low
Mártires High High Low
Antonio Nariño Low Low Low
Puente Aranda High High Low
La Candelaria Low Low Low
Rafael Uribe Low Low Low
Ciudad Bolívar Low Low Low
Chía Low Low Low
Cota Low Low Low
Facatativá Low Low Low
Funza Low Low Low
La Calera Low Low Low
Madrid Low Low Low
Mosquera Low Low Low
Soacha Medium Medium Low
D. Risk by liquefaction
La Cajita case covers an area a bit smaller than the Guayuriba case. The total number of industrial facilities located in the liquefaction area is 474.
E. Risk analysis for gasoline tanks
The Study Team carried out a case study on the seismic influence to the gasoline tanks based on the data from TEXACO. The detailed analysis is shown in tank calculation.
F. Recommendation - The gasoline tanks are located at Puente Aranda. The Seismic influence to the gasoline
tanks must be assessed, because their holding amounts are so huge that catastrophic
The Study on Disaster Prevention in the Bogotá Metropolitan Area in the Republic of Colombia
4-72
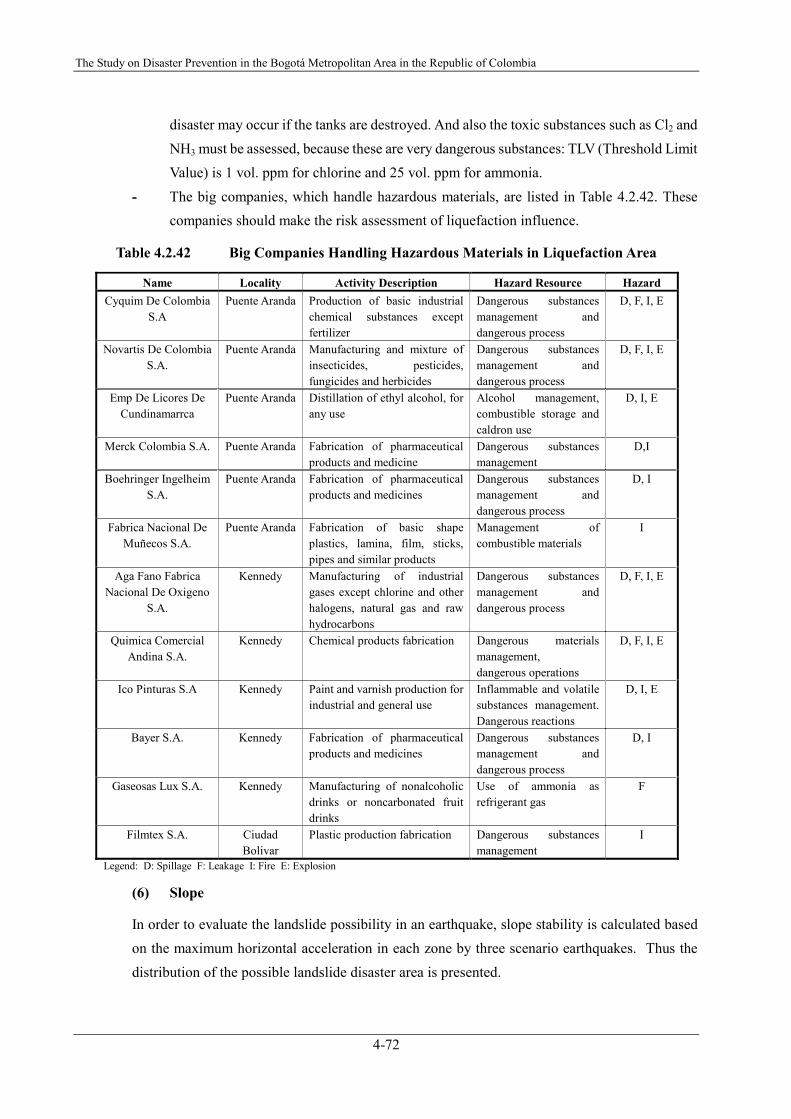
disaster may occur if the tanks are destroyed. And also the toxic substances such as Cl2 and NH3 must be assessed, because these are very dangerous substances: TLV (Threshold Limit Value) is 1 vol. ppm for chlorine and 25 vol. ppm for ammonia.
- The big companies, which handle hazardous materials, are listed in Table 4.2.42. These companies should make the risk assessment of liquefaction influence.
Table 4.2.42 Big Companies Handling Hazardous Materials in Liquefaction Area
Name Locality Activity Description Hazard Resource Hazard Cyquim De Colombia
S.A Puente Aranda Production of basic industrial
chemical substances except fertilizer
Dangerous substances management and dangerous process
D, F, I, E
Novartis De Colombia S.A.
Puente Aranda Manufacturing and mixture of insecticides, pesticides, fungicides and herbicides
Dangerous substances management and dangerous process
D, F, I, E
Emp De Licores De Cundinamarrca
Puente Aranda Distillation of ethyl alcohol, for any use
Alcohol management, combustible storage and caldron use
D, I, E
Merck Colombia S.A. Puente Aranda Fabrication of pharmaceutical products and medicine
Dangerous substances management
D,I
Boehringer Ingelheim S.A.
Puente Aranda Fabrication of pharmaceutical products and medicines
Dangerous substances management and dangerous process
D, I
Fabrica Nacional De Muñecos S.A.
Puente Aranda Fabrication of basic shape plastics, lamina, film, sticks, pipes and similar products
Management of combustible materials
I
Aga Fano Fabrica Nacional De Oxigeno
S.A.
Kennedy Manufacturing of industrial gases except chlorine and other halogens, natural gas and raw hydrocarbons
Dangerous substances management and dangerous process
D, F, I, E
Quimica Comercial Andina S.A.
Kennedy Chemical products fabrication Dangerous materials management, dangerous operations
D, F, I, E
Ico Pinturas S.A Kennedy Paint and varnish production for industrial and general use
Inflammable and volatile substances management. Dangerous reactions
D, I, E
Bayer S.A. Kennedy Fabrication of pharmaceutical products and medicines
Dangerous substances management and dangerous process
D, I
Gaseosas Lux S.A. Kennedy Manufacturing of nonalcoholic drinks or noncarbonated fruit drinks
Use of ammonia as refrigerant gas
F
Filmtex S.A. Ciudad Bolivar
Plastic production fabrication Dangerous substances management
I
Legend: D: Spillage F: Leakage I: Fire E: Explosion
(6) Slope
In order to evaluate the landslide possibility in an earthquake, slope stability is calculated based on the maximum horizontal acceleration in each zone by three scenario earthquakes. Thus the distribution of the possible landslide disaster area is presented.
Chapter 4 New Disaster Scenario
4-73
A. Data
The slope data used in this analysis is based on maps obtained from IGAC, which was digitized and converted to grid data by the Study Team. The size of grid is 50m by 50m within basin area, or
25m by 25m within mountainous area. Slope angles (θ ') were calculated for each mesh.
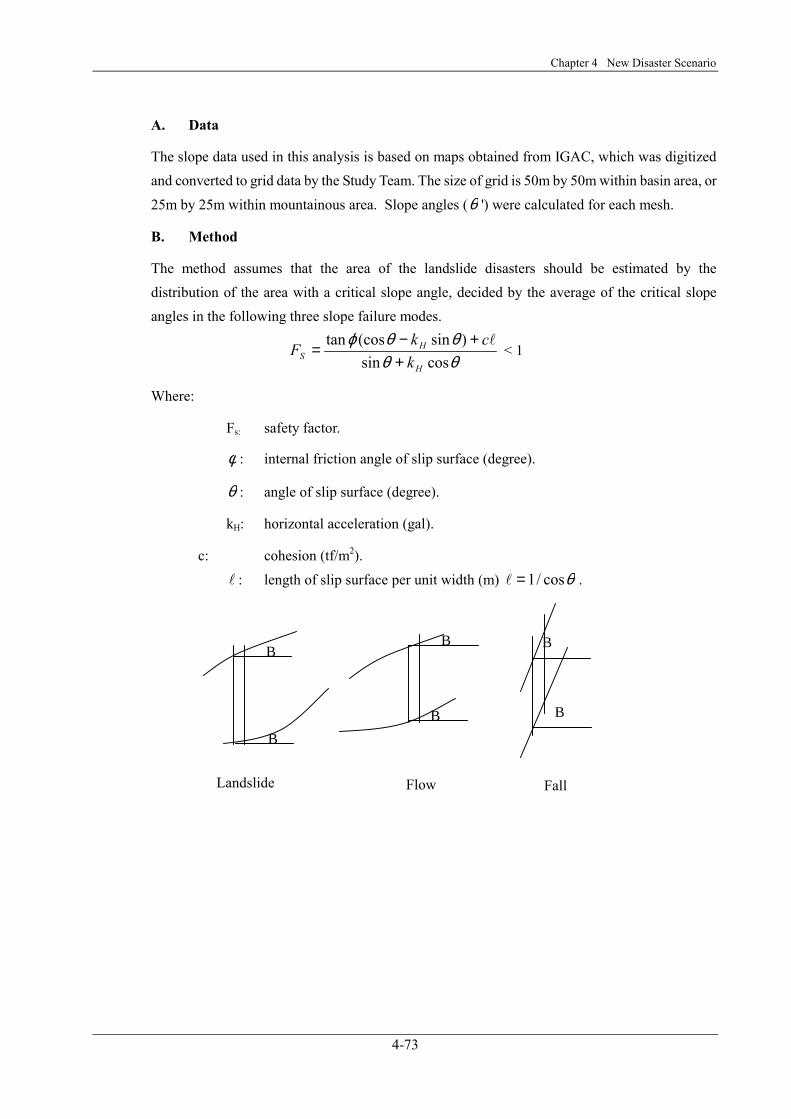
B. Method
The method assumes that the area of the landslide disasters should be estimated by the distribution of the area with a critical slope angle, decided by the average of the critical slope angles in the following three slope failure modes.
θθθθϕ
cossin)sin(costan
H
HS k
ckF+
+−=
l < 1
Where:
Fs: safety factor.
φ : internal friction angle of slip surface (degree).
θ : angle of slip surface (degree).
kH: horizontal acceleration (gal).
c: cohesion (tf/m2).
l : length of slip surface per unit width (m) θcos/1=l .
θθ
θ
θ
θ
θ
Landslide Flow Fall
The Study on Disaster Prevention in the Bogotá Metropolitan Area in the Republic of Colombia
4-74
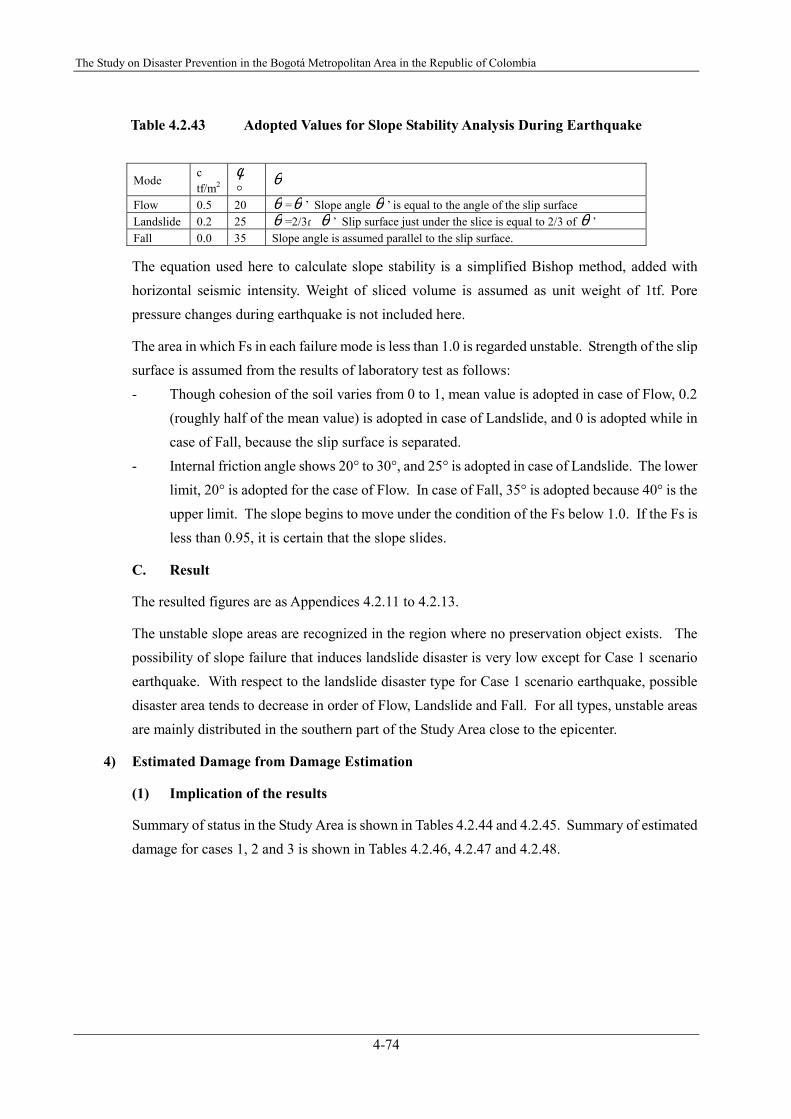
Table 4.2.43 Adopted Values for Slope Stability Analysis During Earthquake
The equation used here to calculate slope stability is a simplified Bishop method, added with horizontal seismic intensity. Weight of sliced volume is assumed as unit weight of 1tf. Pore pressure changes during earthquake is not included here.
The area in which Fs in each failure mode is less than 1.0 is regarded unstable. Strength of the slip surface is assumed from the results of laboratory test as follows: - Though cohesion of the soil varies from 0 to 1, mean value is adopted in case of Flow, 0.2
(roughly half of the mean value) is adopted in case of Landslide, and 0 is adopted while in case of Fall, because the slip surface is separated.
- Internal friction angle shows 20° to 30°, and 25° is adopted in case of Landslide. The lower limit, 20° is adopted for the case of Flow. In case of Fall, 35° is adopted because 40° is the upper limit. The slope begins to move under the condition of the Fs below 1.0. If the Fs is less than 0.95, it is certain that the slope slides.
C. Result
The resulted figures are as Appendices 4.2.11 to 4.2.13.
The unstable slope areas are recognized in the region where no preservation object exists. The possibility of slope failure that induces landslide disaster is very low except for Case 1 scenario earthquake. With respect to the landslide disaster type for Case 1 scenario earthquake, possible disaster area tends to decrease in order of Flow, Landslide and Fall. For all types, unstable areas are mainly distributed in the southern part of the Study Area close to the epicenter.
4) Estimated Damage from Damage Estimation
(1) Implication of the results
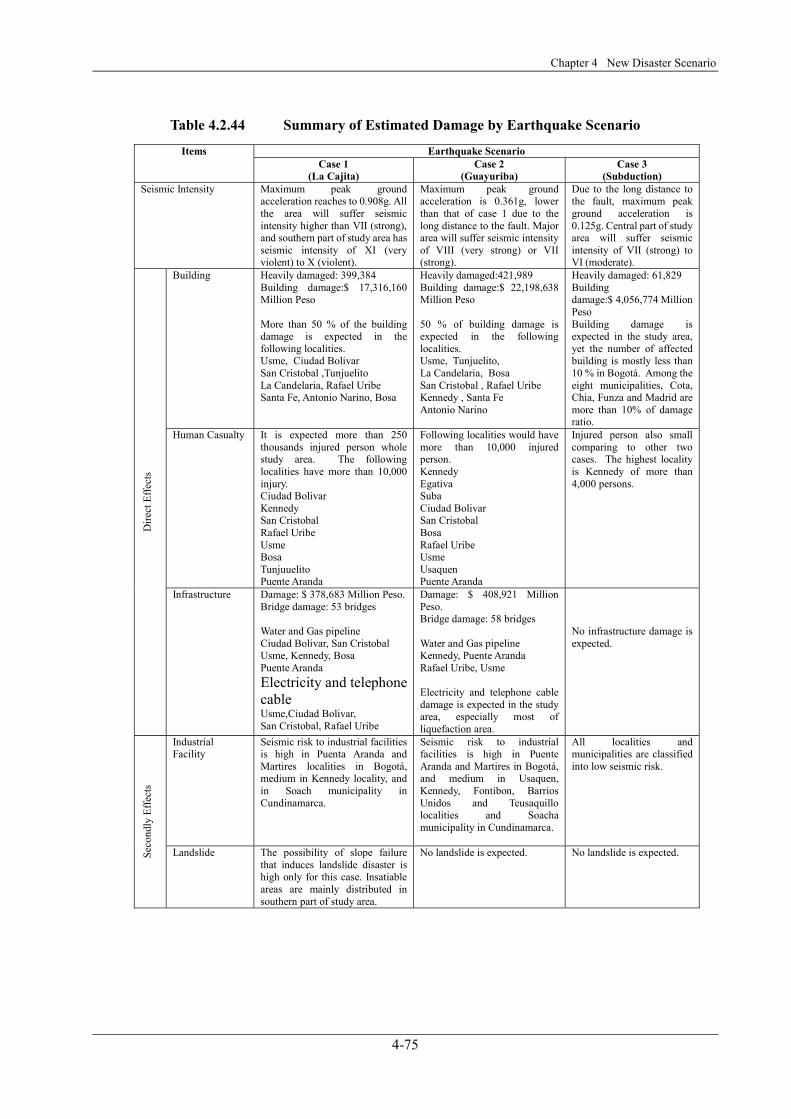
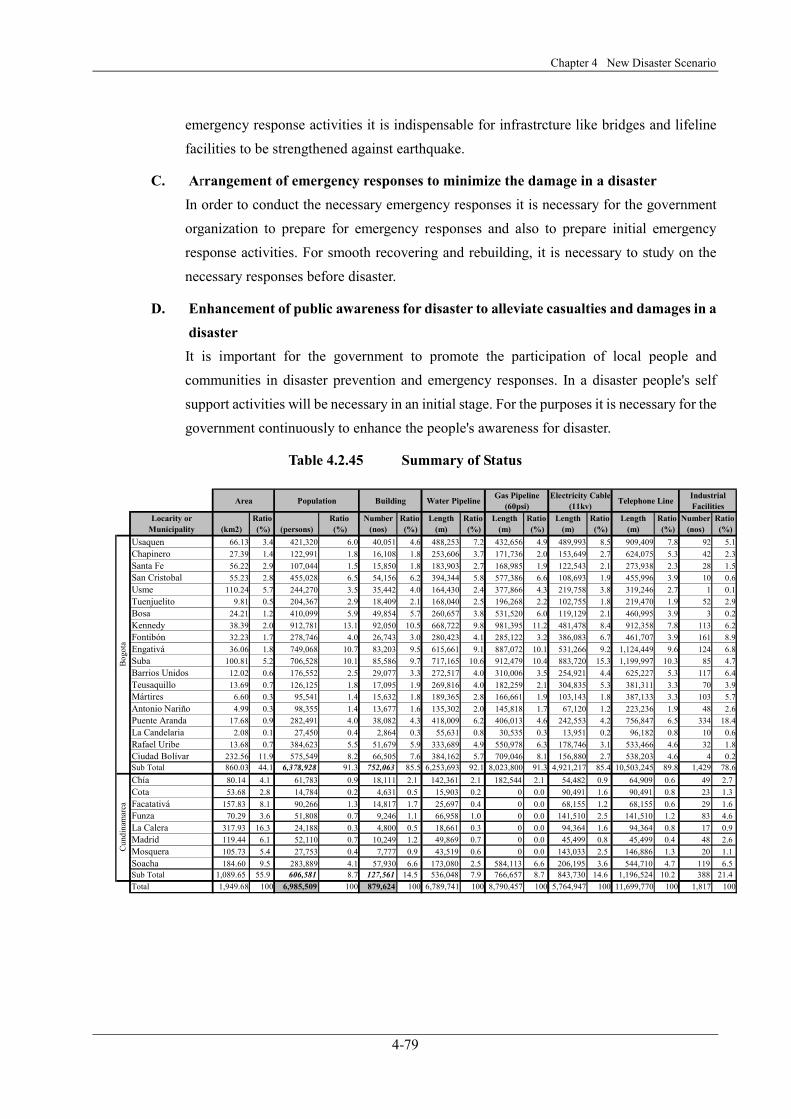
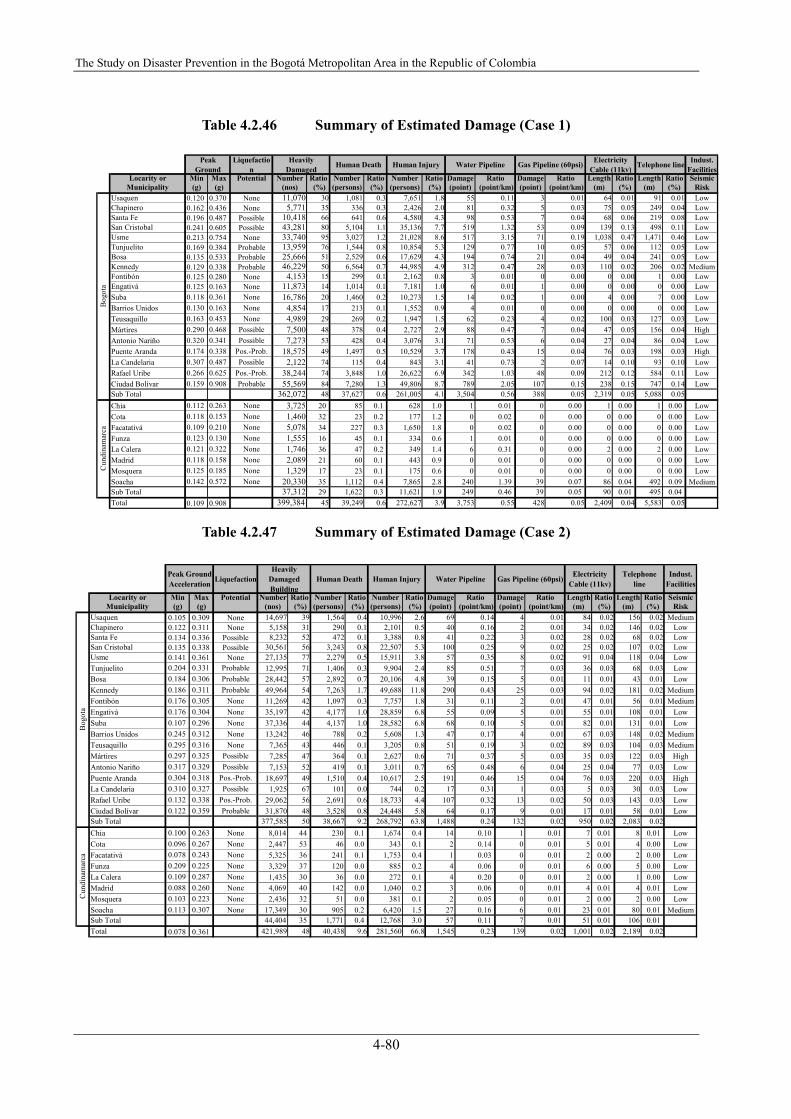
Summary of status in the Study Area is shown in Tables 4.2.44 and 4.2.45. Summary of estimated damage for cases 1, 2 and 3 is shown in Tables 4.2.46, 4.2.47 and 4.2.48.
Mode c tf/m2
φ o
θ
Flow 0.5 20 θ =θ ’ Slope angle θ ’ is equal to the angle of the slip surface Landslide 0.2 25 θ =2/3・θ ’ Slip surface just under the slice is equal to 2/3 of θ ’ Fall 0.0 35 Slope angle is assumed parallel to the slip surface.
Chapter 4 New Disaster Scenario
4-75
Table 4.2.44 Summary of Estimated Damage by Earthquake Scenario
Earthquake Scenario Items Case 1
(La Cajita) Case 2
(Guayuriba) Case 3
(Subduction) Seismic Intensity Maximum peak ground
acceleration reaches to 0.908g. All the area will suffer seismic intensity higher than VII (strong), and southern part of study area has seismic intensity of XI (very violent) to X (violent).
Maximum peak ground acceleration is 0.361g, lower than that of case 1 due to the long distance to the fault. Major area will suffer seismic intensity of VIII (very strong) or VII (strong).
Due to the long distance to the fault, maximum peak ground acceleration is 0.125g. Central part of study area will suffer seismic intensity of VII (strong) to VI (moderate).
Building Heavily damaged: 399,384 Building damage:$ 17,316,160 Million Peso More than 50 % of the building damage is expected in the following localities. Usme, Ciudad Bolivar San Cristobal ,Tunjuelito La Candelaria, Rafael Uribe Santa Fe, Antonio Narino, Bosa
Heavily damaged:421,989 Building damage:$ 22,198,638 Million Peso 50 % of building damage is expected in the following localities. Usme, Tunjuelito, La Candelaria, Bosa San Cristobal , Rafael Uribe Kennedy , Santa Fe Antonio Narino
Heavily damaged: 61,829 Building damage:$ 4,056,774 Million Peso Building damage is expected in the study area, yet the number of affected building is mostly less than 10 % in Bogotá. Among the eight municipalities, Cota, Chia, Funza and Madrid are more than 10% of damage ratio.
Human Casualty It is expected more than 250 thousands injured person whole study area. The following localities have more than 10,000 injury. Ciudad Bolivar Kennedy San Cristobal Rafael Uribe Usme Bosa Tunjuuelito Puente Aranda
Following localities would have more than 10,000 injured person. Kennedy Egativa Suba Ciudad Bolivar San Cristobal Bosa Rafael Uribe Usme Usaquen Puente Aranda
Injured person also small comparing to other two cases. The highest locality is Kennedy of more than 4,000 persons.
Dire
ct E
ffect
s
Infrastructure Damage: $ 378,683 Million Peso.Bridge damage: 53 bridges Water and Gas pipeline Ciudad Bolivar, San Cristobal Usme, Kennedy, Bosa Puente Aranda Electricity and telephone cable Usme,Ciudad Bolivar, San Cristobal, Rafael Uribe
Damage: $ 408,921 Million Peso. Bridge damage: 58 bridges Water and Gas pipeline Kennedy, Puente Aranda Rafael Uribe, Usme Electricity and telephone cable damage is expected in the study area, especially most of liquefaction area.
No infrastructure damage is expected.
Industrial Facility
Seismic risk to industrial facilities is high in Puenta Aranda and Martires localities in Bogotá, medium in Kennedy locality, and in Soach municipality in Cundinamarca.
Seismic risk to industrial facilities is high in Puente Aranda and Martires in Bogotá, and medium in Usaquen, Kennedy, Fontibon, Barrios Unidos and Teusaquillo localities and Soacha municipality in Cundinamarca.
All localities and municipalities are classified into low seismic risk.
Seco
ndly
Effe
cts
Landslide The possibility of slope failure that induces landslide disaster is high only for this case. Insatiable areas are mainly distributed in southern part of study area.
No landslide is expected. No landslide is expected.
The Study on Disaster Prevention in the Bogotá Metropolitan Area in the Republic of Colombia
4-76
(2) Disaster Scenario
The disaster scenario shows an outline of the direct damage in the Case 1 scenario earthquake (Cajita fault) and also suggests necessary disaster prevention and emergency response to protect the Bogotá Metropolitan Area from disasters by severe earthquakes.
A. Earthquake
An earthquake with epicenter in the Cajita fault will occur early in the morning. The MMI will
range from Ⅶ to Ⅹ, i.e., the area near the epicenter: Ⅷ-Ⅹ, the southern part of Bogotá: Ⅷ-Ⅸ, the central part and northwestern part of Bogotá: Ⅶ, but the terrace and cone in Facatativa and the piedmont soil at the eastern part of Bogotá and La Calera: Ⅷ.
Buildings at the southern part of Bogotá will be heavily damaged, and from the central to the northwestern part, half of the buildings will be damaged but slightly. There will be numerous deaths and injuries in areas of heavily damaged buildings. In the southern part of Bogotá, due to the liquefaction effects, collapsed bridges will block the emergency road network at many places. The lifeline facilities, such as water supply, gas, electric power supply and telephone service facilities, will also be damaged, and public services will be stopped. The seismic damage of the Bogotá Metropolitan Area will affect the regional economy. Furthermore, the effect of the seismic damages will be spread and increased due to the delay of the arrangement related to government and non-government entities for emergency response and also the delay of the arrangement of inter-municipal, interregional and international cooperation. It will become a tragic disaster.
Consequently, the functions of the Bogotá Metropolitan Area will be paralyzed and resumption of operations will take a long time, and that will give serious impact not only to the regional economy but also to the national economy.
B. Expansion of the damage due to the delay of arrangement of disaster prevention and emergency response organizations
On the same day the, President will declare a curfew, and the next day, a state of national disaster. The Metropolitan Police and the Military will start their functions and responsibilities. The Bogotá Metropolitan Area will be militarized. Also, the President will establish a Fund for the reconstruction and social development of the Bogotá Metropolitan Area and set up a national emergency response headquarters.
The responsible entities for disaster prevention and emergency response of Bogotá City, Cundinamarca and the national government, will be affected due to blockage of the emergency road network. The emergency response activities will be delayed due to the lack of preparation for emergency response activities and there will be many difficulties for the administrative entities in conducting their emergency response activities, except the military, police, civil defense, the Red
Chapter 4 New Disaster Scenario
4-77
Cross and firefighting bodies. The delay of overall emergency response and recovery activities by the administrative entities will cause and expand new problems and damages.
C. Building Damage
There are 956 thousand buildings either without any seismic resistance capacities or with low resistance capacities. However, a full-scale reinforcement of buildings have not been conducted yet, thus, about 400 thousand buildings in the Bogotá Metropolitan Area will be damaged, especially in the localities of the southern part of Bogotá City, i.e. Ciudad Bolivar, San Cristobal, Tunjuelito, La Candelaria, Rafael Uribe, Santa Fe, Antonio Nariño, Bosa and Kennedy. These localities are lack of basic infrastructure and are therefore vulnerable. The government or public buildings, except the buildings currently constructed, will be damaged in a seismic disaster. The destruction of many of the government buildings will paralyze emergency response activities and cause diminished administrative functions. The demolition of heavily damaged buildings and the clearance of a large volume of debris will be required.
The delay of arrangement of shelters and evacuation places and of reconstruction support activities, due to the lack of preparation, will lead social unrest.
D. Casualties and injuries due to building collapse
The collapse of about 400 thousand buildings will cause 39,000 deaths and 270,000 injuries. The scale of deaths and injuries will overwhelm the medical response capacity of the Bogotá Metropolitan Area. Due to the destruction of many medical facilities and hospitals, the emergency medical response capacities will be diminished and make difficult the conduct of relief activities and transportation of the injured. Also, due to lack of arrangement, support activities from the other cities and other countries will be delayed. Conditions will turn even more miserable.
E. Diminishing transportation capacity due to the damage to infrastructure
In the disaster 53 bridges will be collapsed. The trunk roads in the Bogotá Metropolitan Area will be blocked at many points and lose their function for emergency transportation. Removing the debris is the easy part; it is the recovery of function, which will take a long time because of the lack of preparation and the delay of clearing the roads. Emergency response activities and emergency transportation will be conducted through the bypasses. Traffic will totally be controlled and vehicles for emergency activities only will be allowed entry into the Metropolitan Area.
F. Victims, evacuation space and place of refuge
In the Bogotá Metropolitan Area, about 400 thousand houses/buildings would be damaged, leaving over 3 million people homeless. However, both evacuation spaces and places of refuge
The Study on Disaster Prevention in the Bogotá Metropolitan Area in the Republic of Colombia
4-78
will not be sufficient. Numerous victims will have to stay in the collapsed houses because of lack of evacuation spaces and evacuation facilities, water supply, food and other necessities of life.
G. Damaged lifeline facilities and lack of emergency response facilities
In the disaster, lifeline facilities will be damaged in a number of places, i.e., water supply pipeline at 3,753 places, gas pipeline at 428 places, electric cable at 2,077 places, and telephone cable at 2,771 places. The service companies will give their best efforts; however, the fundamental public services like water supply service will be stopped for a long time. In the Bogotá Metropolitan Area, there is almost no emergency water supply for victims.
H. Heavy damage in the vulnerable areas
Vulnerable areas in the southern part and some in the northern part of Bogotá, will show a high damage rate. The indirect damage will increase because of lack of basic infrastructure like evacuation sites and evacuation roads.
I. Communication
Telephone service will be cut locally in the southern part of Bogotá. Wireless telephones and portable telephones will be used. However, it will be difficult to communicate smoothly the necessary disaster and emergency information, including personal safety information.
J. Secondary damage
The earthquake will trigger fires at some of the industries, and will continue to burn, in the localities of Puente Aranda and Los Martires because of blockage of emergency road network and also because of diminished capacities of firefighting bodies owing to their own collapsed facilities. Landslides will occur in the southern part of Bogotá, in areas near to the epicenter, and some inhabitants will have to be evacuated. Landslide areas are shown in Appendices 4.2.11, 4.2.12 and 4.2.13.
(3) Issues for Disaster Management
For prevention and mitigation of the Seismic damages it requires to conduct countermeasures as follows:
A. Arrangement of disaster prevention organizations In order to alleviate or mitigate the damages to casualties and assets it will be a basic measure for the Bogotá Metropolitan Area to establish organizations for disaster prevention and emergecy responses.
B. Strengthening of buildings, infrastructure and lifeline facilities In order to decrease the number of casualties it is indispensable for the Bogotá metropolitan Area to alleviate or mitigate the building damages. Also for smooth conduction of
Chapter 4 New Disaster Scenario
4-79
emergency response activities it is indispensable for infrastrcture like bridges and lifeline facilities to be strengthened against earthquake.
C. Arrangement of emergency responses to minimize the damage in a disaster In order to conduct the necessary emergency responses it is necessary for the government organization to prepare for emergency responses and also to prepare initial emergency response activities. For smooth recovering and rebuilding, it is necessary to study on the necessary responses before disaster.
D. Enhancement of public awareness for disaster to alleviate casualties and damages in a disaster It is important for the government to promote the participation of local people and communities in disaster prevention and emergency responses. In a disaster people's self support activities will be necessary in an initial stage. For the purposes it is necessary for the government continuously to enhance the people's awareness for disaster.
Table 4.2.45 Summary of Status
Area Population Building Water Pipeline Gas Pipeline(60psi)
Electricity Cable(11kv) Telephone Line Industrial
FacilitiesLocarity or Ratio Ratio Number Ratio Length Ratio Length Ratio Length Ratio Length Ratio Number Ratio
Municipality (km2) (%) (persons) (%) (nos) (%) (m) (%) (m) (%) (m) (%) (m) (%) (nos) (%)Usaquen 66.13 3.4 421,320 6.0 40,051 4.6 488,253 7.2 432,656 4.9 489,993 8.5 909,409 7.8 92 5.1Chapinero 27.39 1.4 122,991 1.8 16,108 1.8 253,606 3.7 171,736 2.0 153,649 2.7 624,075 5.3 42 2.3Santa Fe 56.22 2.9 107,044 1.5 15,850 1.8 183,903 2.7 168,985 1.9 122,543 2.1 273,938 2.3 28 1.5San Cristobal 55.23 2.8 455,028 6.5 54,156 6.2 394,344 5.8 577,386 6.6 108,693 1.9 455,996 3.9 10 0.6Usme 110.24 5.7 244,270 3.5 35,442 4.0 164,430 2.4 377,866 4.3 219,758 3.8 319,246 2.7 1 0.1Tuenjuelito 9.81 0.5 204,367 2.9 18,409 2.1 168,040 2.5 196,268 2.2 102,755 1.8 219,470 1.9 52 2.9Bosa 24.21 1.2 410,099 5.9 49,854 5.7 260,657 3.8 531,520 6.0 119,129 2.1 460,995 3.9 3 0.2Kennedy 38.39 2.0 912,781 13.1 92,050 10.5 668,722 9.8 981,395 11.2 481,478 8.4 912,358 7.8 113 6.2Fontibón 32.23 1.7 278,746 4.0 26,743 3.0 280,423 4.1 285,122 3.2 386,083 6.7 461,707 3.9 161 8.9Engativá 36.06 1.8 749,068 10.7 83,203 9.5 615,661 9.1 887,072 10.1 531,266 9.2 1,124,449 9.6 124 6.8Suba 100.81 5.2 706,528 10.1 85,586 9.7 717,165 10.6 912,479 10.4 883,720 15.3 1,199,997 10.3 85 4.7Barrios Unidos 12.02 0.6 176,552 2.5 29,077 3.3 272,517 4.0 310,006 3.5 254,921 4.4 625,227 5.3 117 6.4Teusaquillo 13.69 0.7 126,125 1.8 17,095 1.9 269,816 4.0 182,259 2.1 304,835 5.3 381,311 3.3 70 3.9Mártires 6.60 0.3 95,541 1.4 15,632 1.8 189,365 2.8 166,661 1.9 103,143 1.8 387,133 3.3 103 5.7Antonio Nariño 4.99 0.3 98,355 1.4 13,677 1.6 135,302 2.0 145,818 1.7 67,120 1.2 223,236 1.9 48 2.6Puente Aranda 17.68 0.9 282,491 4.0 38,082 4.3 418,009 6.2 406,013 4.6 242,553 4.2 756,847 6.5 334 18.4La Candelaria 2.08 0.1 27,450 0.4 2,864 0.3 55,631 0.8 30,535 0.3 13,951 0.2 96,182 0.8 10 0.6Rafael Uribe 13.68 0.7 384,623 5.5 51,679 5.9 333,689 4.9 550,978 6.3 178,746 3.1 533,466 4.6 32 1.8Ciudad Bolívar 232.56 11.9 575,549 8.2 66,505 7.6 384,162 5.7 709,046 8.1 156,880 2.7 538,203 4.6 4 0.2Sub Total 860.03 44.1 6,378,928 91.3 752,063 85.5 6,253,693 92.1 8,023,800 91.3 4,921,217 85.4 10,503,245 89.8 1,429 78.6Chía 80.14 4.1 61,783 0.9 18,111 2.1 142,361 2.1 182,544 2.1 54,482 0.9 64,909 0.6 49 2.7Cota 53.68 2.8 14,784 0.2 4,631 0.5 15,903 0.2 0 0.0 90,491 1.6 90,491 0.8 23 1.3Facatativá 157.83 8.1 90,266 1.3 14,817 1.7 25,697 0.4 0 0.0 68,155 1.2 68,155 0.6 29 1.6Funza 70.29 3.6 51,808 0.7 9,246 1.1 66,958 1.0 0 0.0 141,510 2.5 141,510 1.2 83 4.6La Calera 317.93 16.3 24,188 0.3 4,800 0.5 18,661 0.3 0 0.0 94,364 1.6 94,364 0.8 17 0.9Madrid 119.44 6.1 52,110 0.7 10,249 1.2 49,869 0.7 0 0.0 45,499 0.8 45,499 0.4 48 2.6Mosquera 105.73 5.4 27,753 0.4 7,777 0.9 43,519 0.6 0 0.0 143,033 2.5 146,886 1.3 20 1.1Soacha 184.60 9.5 283,889 4.1 57,930 6.6 173,080 2.5 584,113 6.6 206,195 3.6 544,710 4.7 119 6.5Sub Total 1,089.65 55.9 606,581 8.7 127,561 14.5 536,048 7.9 766,657 8.7 843,730 14.6 1,196,524 10.2 388 21.4Total 1,949.68 100 6,985,509 100 879,624 100 6,789,741 100 8,790,457 100 5,764,947 100 11,699,770 100 1,817 100
Bog
ota
Cun
dina
mar
ca
The Study on Disaster Prevention in the Bogotá Metropolitan Area in the Republic of Colombia
4-80
Table 4.2.46 Summary of Estimated Damage (Case 1)
PeakGround
Liquefaction
HeavilyDamaged Human Death Human Injury Water Pipeline Gas Pipeline (60psi) Electricity
Cable (11kv) Telephone line Indust.Facilities
Locarity or Min Max Potential Number Ratio Number Ratio Number Ratio Damage Ratio Damage Ratio Length Ratio Length Ratio SeismicMunicipality (g) (g) (nos) (%) (persons) (%) (persons) (%) (point) (point/km) (point) (point/km) (m) (%) (m) (%) Risk
Usaquen 0.120 0.370 None 11,070 30 1,081 0.3 7,651 1.8 55 0.11 3 0.01 64 0.01 91 0.01 LowChapinero 0.162 0.436 None 5,771 35 336 0.3 2,426 2.0 81 0.32 5 0.03 75 0.05 249 0.04 LowSanta Fe 0.196 0.487 Possible 10,418 66 641 0.6 4,580 4.3 98 0.53 7 0.04 68 0.06 219 0.08 LowSan Cristobal 0.241 0.605 Possible 43,281 80 5,104 1.1 35,136 7.7 519 1.32 53 0.09 139 0.13 498 0.11 LowUsme 0.213 0.754 None 33,740 95 3,027 1.2 21,028 8.6 517 3.15 71 0.19 1,038 0.47 1,471 0.46 LowTunjuelito 0.169 0.384 Probable 13,959 76 1,544 0.8 10,854 5.3 129 0.77 10 0.05 57 0.06 112 0.05 LowBosa 0.135 0.533 Probable 25,666 51 2,529 0.6 17,629 4.3 194 0.74 21 0.04 49 0.04 241 0.05 LowKennedy 0.129 0.338 Probable 46,229 50 6,564 0.7 44,985 4.9 312 0.47 28 0.03 110 0.02 206 0.02 MediumFontibón 0.125 0.280 None 4,153 15 299 0.1 2,162 0.8 3 0.01 0 0.00 0 0.00 1 0.00 LowEngativá 0.125 0.163 None 11,873 14 1,014 0.1 7,181 1.0 6 0.01 1 0.00 0 0.00 0 0.00 LowSuba 0.118 0.361 None 16,786 20 1,460 0.2 10,273 1.5 14 0.02 1 0.00 4 0.00 7 0.00 LowBarrios Unidos 0.130 0.163 None 4,854 17 213 0.1 1,552 0.9 4 0.01 0 0.00 0 0.00 0 0.00 LowTeusaquillo 0.163 0.453 None 4,989 29 269 0.2 1,947 1.5 62 0.23 4 0.02 100 0.03 127 0.03 LowMártires 0.290 0.468 Possible 7,500 48 378 0.4 2,727 2.9 88 0.47 7 0.04 47 0.05 156 0.04 HighAntonio Nariño 0.320 0.341 Possible 7,273 53 428 0.4 3,076 3.1 71 0.53 6 0.04 27 0.04 86 0.04 LowPuente Aranda 0.174 0.338 Pos.-Prob. 18,575 49 1,497 0.5 10,529 3.7 178 0.43 15 0.04 76 0.03 198 0.03 HighLa Candelaria 0.307 0.487 Possible 2,122 74 115 0.4 843 3.1 41 0.73 2 0.07 14 0.10 93 0.10 LowRafael Uribe 0.266 0.625 Pos.-Prob. 38,244 74 3,848 1.0 26,622 6.9 342 1.03 48 0.09 212 0.12 584 0.11 LowCiudad Bolívar 0.159 0.908 Probable 55,569 84 7,280 1.3 49,806 8.7 789 2.05 107 0.15 238 0.15 747 0.14 LowSub Total 362,072 48 37,627 0.6 261,005 4.1 3,504 0.56 388 0.05 2,319 0.05 5,088 0.05Chia 0.112 0.263 None 3,725 20 85 0.1 628 1.0 1 0.01 0 0.00 1 0.00 1 0.00 LowCota 0.118 0.153 None 1,460 32 23 0.2 177 1.2 0 0.02 0 0.00 0 0.00 0 0.00 LowFacatativá 0.109 0.210 None 5,078 34 227 0.3 1,650 1.8 0 0.02 0 0.00 0 0.00 0 0.00 LowFunza 0.123 0.130 None 1,555 16 45 0.1 334 0.6 1 0.01 0 0.00 0 0.00 0 0.00 LowLa Calera 0.121 0.322 None 1,746 36 47 0.2 349 1.4 6 0.31 0 0.00 2 0.00 2 0.00 LowMadrid 0.118 0.158 None 2,089 21 60 0.1 443 0.9 0 0.01 0 0.00 0 0.00 0 0.00 LowMosquera 0.125 0.185 None 1,329 17 23 0.1 175 0.6 0 0.01 0 0.00 0 0.00 0 0.00 LowSoacha 0.142 0.572 None 20,330 35 1,112 0.4 7,865 2.8 240 1.39 39 0.07 86 0.04 492 0.09 MediumSub Total 37,312 29 1,622 0.3 11,621 1.9 249 0.46 39 0.05 90 0.01 495 0.04Total 0.109 0.908 399,384 45 39,249 0.6 272,627 3.9 3,753 0.55 428 0.05 2,409 0.04 5,583 0.05
Bog
ota
Cun
dina
mar
ca
Table 4.2.47 Summary of Estimated Damage (Case 2)
Peak GroundAcceleration Liquefaction
HeavilyDamagedBuilding
Human Death Human Injury Water Pipeline Gas Pipeline (60psi)Electricity
Cable (11kv)Telephone
lineIndust.
Facilities
Locarity or Min Max Potential Number Ratio Number Ratio Number Ratio Damage Ratio Damage Ratio Length Ratio Length Ratio SeismicMunicipality (g) (g) (nos) (%) (persons) (%) (persons) (%) (point) (point/km) (point) (point/km) (m) (%) (m) (%) Risk
Usaquen 0.105 0.309 None 14,697 39 1,564 0.4 10,996 2.6 69 0.14 4 0.01 84 0.02 156 0.02 MediumChapinero 0.122 0.311 None 5,158 31 290 0.1 2,101 0.5 40 0.16 2 0.01 34 0.02 146 0.02 LowSanta Fe 0.134 0.336 Possible 8,232 52 472 0.1 3,388 0.8 41 0.22 3 0.02 28 0.02 68 0.02 LowSan Cristobal 0.135 0.338 Possible 30,561 56 3,243 0.8 22,507 5.3 100 0.25 9 0.02 25 0.02 107 0.02 LowUsme 0.141 0.361 None 27,135 77 2,279 0.5 15,911 3.8 57 0.35 8 0.02 91 0.04 118 0.04 LowTunjuelito 0.204 0.331 Probable 12,995 71 1,406 0.3 9,904 2.4 85 0.51 7 0.03 36 0.03 68 0.03 LowBosa 0.184 0.306 Probable 28,442 57 2,892 0.7 20,106 4.8 39 0.15 5 0.01 11 0.01 43 0.01 LowKennedy 0.186 0.311 Probable 49,964 54 7,263 1.7 49,688 11.8 290 0.43 25 0.03 94 0.02 181 0.02 MediumFontibón 0.176 0.305 None 11,269 42 1,097 0.3 7,757 1.8 31 0.11 2 0.01 47 0.01 56 0.01 MediumEngativá 0.176 0.304 None 35,197 42 4,177 1.0 28,859 6.8 55 0.09 5 0.01 55 0.01 108 0.01 LowSuba 0.107 0.296 None 37,336 44 4,137 1.0 28,582 6.8 68 0.10 5 0.01 82 0.01 131 0.01 LowBarrios Unidos 0.245 0.312 None 13,242 46 788 0.2 5,608 1.3 47 0.17 4 0.01 67 0.03 148 0.02 MediumTeusaquillo 0.295 0.316 None 7,365 43 446 0.1 3,205 0.8 51 0.19 3 0.02 89 0.03 104 0.03 MediumMártires 0.297 0.325 Possible 7,285 47 364 0.1 2,627 0.6 71 0.37 5 0.03 35 0.03 122 0.03 HighAntonio Nariño 0.317 0.329 Possible 7,153 52 419 0.1 3,011 0.7 65 0.48 6 0.04 25 0.04 77 0.03 LowPuente Aranda 0.304 0.318 Pos.-Prob. 18,697 49 1,510 0.4 10,617 2.5 191 0.46 15 0.04 76 0.03 220 0.03 HighLa Candelaria 0.310 0.327 Possible 1,925 67 101 0.0 744 0.2 17 0.31 1 0.03 5 0.03 30 0.03 LowRafael Uribe 0.132 0.338 Pos.-Prob. 29,062 56 2,691 0.6 18,733 4.4 107 0.32 13 0.02 50 0.03 143 0.03 LowCiudad Bolívar 0.122 0.359 Probable 31,870 48 3,528 0.8 24,448 5.8 64 0.17 9 0.01 17 0.01 58 0.01 LowSub Total 377,585 50 38,667 9.2 268,792 63.8 1,488 0.24 132 0.02 950 0.02 2,083 0.02Chia 0.100 0.263 None 8,014 44 230 0.1 1,674 0.4 14 0.10 1 0.01 7 0.01 8 0.01 LowCota 0.096 0.267 None 2,447 53 46 0.0 343 0.1 2 0.14 0 0.01 5 0.01 4 0.00 LowFacatativá 0.078 0.243 None 5,325 36 241 0.1 1,753 0.4 1 0.03 0 0.01 2 0.00 2 0.00 LowFunza 0.209 0.225 None 3,329 37 120 0.0 885 0.2 4 0.06 0 0.01 6 0.00 5 0.00 LowLa Calera 0.109 0.287 None 1,435 30 36 0.0 272 0.1 4 0.20 0 0.01 2 0.00 1 0.00 LowMadrid 0.088 0.260 None 4,069 40 142 0.0 1,040 0.2 3 0.06 0 0.01 4 0.01 4 0.01 LowMosquera 0.103 0.223 None 2,436 32 51 0.0 381 0.1 2 0.05 0 0.01 2 0.00 2 0.00 LowSoacha 0.113 0.307 None 17,349 30 905 0.2 6,420 1.5 27 0.16 6 0.01 23 0.01 80 0.01 MediumSub Total 44,404 35 1,771 0.4 12,768 3.0 57 0.11 7 0.01 51 0.01 106 0.01Total 0.078 0.361 421,989 48 40,438 9.6 281,560 66.8 1,545 0.23 139 0.02 1,001 0.02 2,189 0.02
Bog
ota
Cun
dina
mar
ca
Chapter 4 New Disaster Scenario
4-81
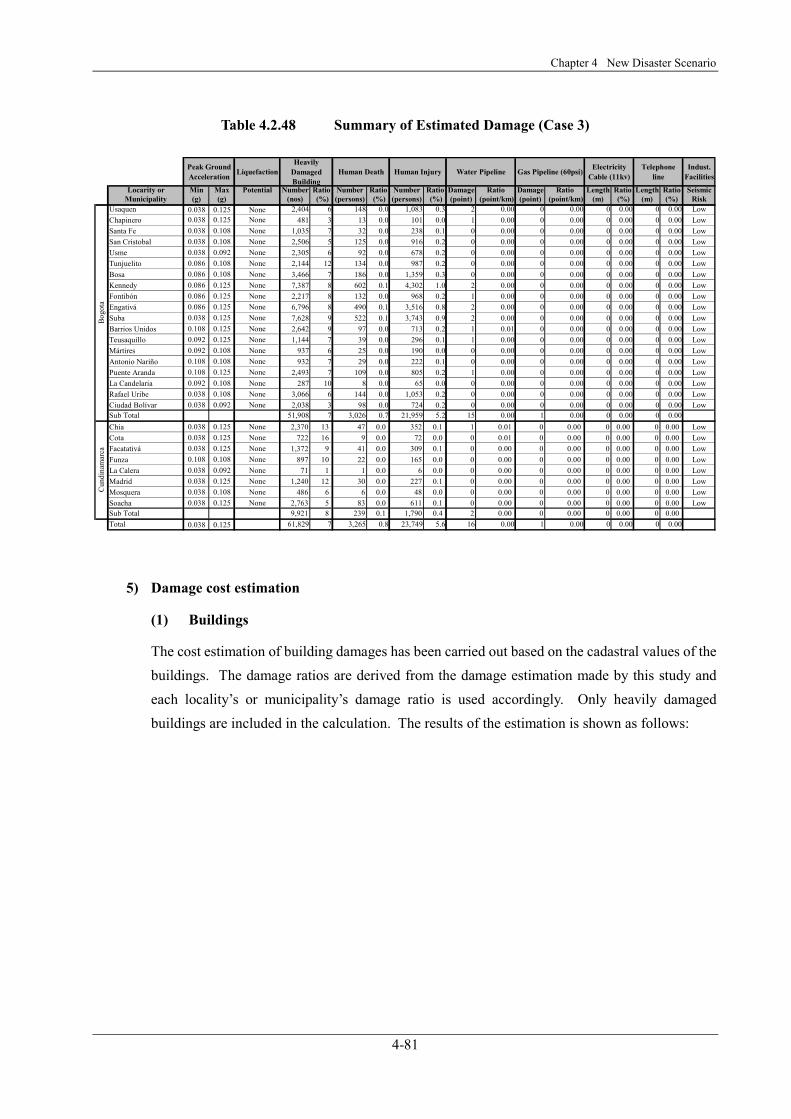
Table 4.2.48 Summary of Estimated Damage (Case 3)
Peak GroundAcceleration Liquefaction
HeavilyDamagedBuilding
Human Death Human Injury Water Pipeline Gas Pipeline (60psi) ElectricityCable (11kv)
Telephoneline
Indust.Facilities
Locarity or Min Max Potential Number Ratio Number Ratio Number Ratio Damage Ratio Damage Ratio Length Ratio Length Ratio SeismicMunicipality (g) (g) (nos) (%) (persons) (%) (persons) (%) (point) (point/km) (point) (point/km) (m) (%) (m) (%) Risk
Usaquen 0.038 0.125 None 2,404 6 148 0.0 1,083 0.3 2 0.00 0 0.00 0 0.00 0 0.00 LowChapinero 0.038 0.125 None 481 3 13 0.0 101 0.0 1 0.00 0 0.00 0 0.00 0 0.00 LowSanta Fe 0.038 0.108 None 1,035 7 32 0.0 238 0.1 0 0.00 0 0.00 0 0.00 0 0.00 LowSan Cristobal 0.038 0.108 None 2,506 5 125 0.0 916 0.2 0 0.00 0 0.00 0 0.00 0 0.00 LowUsme 0.038 0.092 None 2,305 6 92 0.0 678 0.2 0 0.00 0 0.00 0 0.00 0 0.00 LowTunjuelito 0.086 0.108 None 2,144 12 134 0.0 987 0.2 0 0.00 0 0.00 0 0.00 0 0.00 LowBosa 0.086 0.108 None 3,466 7 186 0.0 1,359 0.3 0 0.00 0 0.00 0 0.00 0 0.00 LowKennedy 0.086 0.125 None 7,387 8 602 0.1 4,302 1.0 2 0.00 0 0.00 0 0.00 0 0.00 LowFontibón 0.086 0.125 None 2,217 8 132 0.0 968 0.2 1 0.00 0 0.00 0 0.00 0 0.00 LowEngativá 0.086 0.125 None 6,796 8 490 0.1 3,516 0.8 2 0.00 0 0.00 0 0.00 0 0.00 LowSuba 0.038 0.125 None 7,628 9 522 0.1 3,743 0.9 2 0.00 0 0.00 0 0.00 0 0.00 LowBarrios Unidos 0.108 0.125 None 2,642 9 97 0.0 713 0.2 1 0.01 0 0.00 0 0.00 0 0.00 LowTeusaquillo 0.092 0.125 None 1,144 7 39 0.0 296 0.1 1 0.00 0 0.00 0 0.00 0 0.00 LowMártires 0.092 0.108 None 937 6 25 0.0 190 0.0 0 0.00 0 0.00 0 0.00 0 0.00 LowAntonio Nariño 0.108 0.108 None 932 7 29 0.0 222 0.1 0 0.00 0 0.00 0 0.00 0 0.00 LowPuente Aranda 0.108 0.125 None 2,493 7 109 0.0 805 0.2 1 0.00 0 0.00 0 0.00 0 0.00 LowLa Candelaria 0.092 0.108 None 287 10 8 0.0 65 0.0 0 0.00 0 0.00 0 0.00 0 0.00 LowRafael Uribe 0.038 0.108 None 3,066 6 144 0.0 1,053 0.2 0 0.00 0 0.00 0 0.00 0 0.00 LowCiudad Bolívar 0.038 0.092 None 2,038 3 98 0.0 724 0.2 0 0.00 0 0.00 0 0.00 0 0.00 LowSub Total 51,908 7 3,026 0.7 21,959 5.2 15 0.00 1 0.00 0 0.00 0 0.00Chia 0.038 0.125 None 2,370 13 47 0.0 352 0.1 1 0.01 0 0.00 0 0.00 0 0.00 LowCota 0.038 0.125 None 722 16 9 0.0 72 0.0 0 0.01 0 0.00 0 0.00 0 0.00 LowFacatativá 0.038 0.125 None 1,372 9 41 0.0 309 0.1 0 0.00 0 0.00 0 0.00 0 0.00 LowFunza 0.108 0.108 None 897 10 22 0.0 165 0.0 0 0.00 0 0.00 0 0.00 0 0.00 LowLa Calera 0.038 0.092 None 71 1 1 0.0 6 0.0 0 0.00 0 0.00 0 0.00 0 0.00 LowMadrid 0.038 0.125 None 1,240 12 30 0.0 227 0.1 0 0.00 0 0.00 0 0.00 0 0.00 LowMosquera 0.038 0.108 None 486 6 6 0.0 48 0.0 0 0.00 0 0.00 0 0.00 0 0.00 LowSoacha 0.038 0.125 None 2,763 5 83 0.0 611 0.1 0 0.00 0 0.00 0 0.00 0 0.00 LowSub Total 9,921 8 239 0.1 1,790 0.4 2 0.00 0 0.00 0 0.00 0 0.00Total 0.038 0.125 61,829 7 3,265 0.8 23,749 5.6 16 0.00 1 0.00 0 0.00 0 0.00
Bog
ota
Cun
dina
mar
ca
5) Damage cost estimation
(1) Buildings
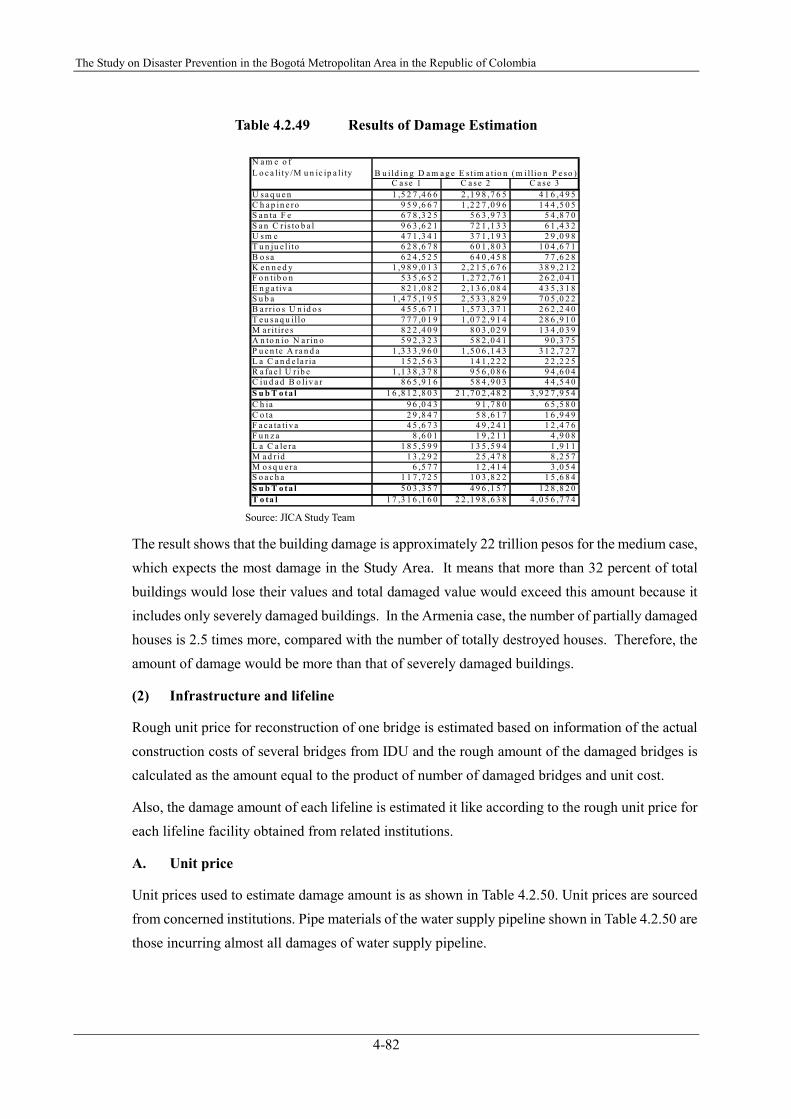
The cost estimation of building damages has been carried out based on the cadastral values of the buildings. The damage ratios are derived from the damage estimation made by this study and each locality’s or municipality’s damage ratio is used accordingly. Only heavily damaged buildings are included in the calculation. The results of the estimation is shown as follows:
The Study on Disaster Prevention in the Bogotá Metropolitan Area in the Republic of Colombia
4-82
Table 4.2.49 Results of Damage Estimation
N a m e o fL o c a lity /M u n ic ip a li ty
C a se 1 C a s e 2 C a s e 3U s a q u e n 1 ,5 2 7 ,4 6 6 2 ,1 9 8 ,7 6 5 4 1 6 ,4 9 5C h a p in e ro 9 5 9 ,6 6 7 1 ,2 2 7 ,0 9 6 1 4 4 ,5 0 5S a n ta F e 6 7 8 ,3 2 5 5 6 3 ,9 7 3 5 4 ,8 7 0S a n C r is to b a l 9 6 3 ,6 2 1 7 2 1 ,1 3 3 6 1 ,4 3 2U s m e 4 7 1 ,3 4 1 3 7 1 ,1 9 3 2 9 ,0 9 8T u n ju e l ito 6 2 8 ,6 7 8 6 0 1 ,8 0 3 1 0 4 ,6 7 1B o s a 6 2 4 ,5 2 5 6 4 0 ,4 5 8 7 7 ,6 2 8K e n n e d y 1 ,9 8 9 ,0 1 3 2 ,2 1 5 ,6 7 6 3 8 9 ,2 1 2F o n tib o n 5 3 5 ,6 5 2 1 ,2 7 2 ,7 6 1 2 6 2 ,0 4 1E n g a tiv a 8 2 1 ,0 8 2 2 ,1 3 6 ,0 8 4 4 3 5 ,3 1 8S u b a 1 ,4 7 5 ,1 9 5 2 ,5 3 3 ,8 2 9 7 0 5 ,0 2 2B a rr io s U n id o s 4 5 5 ,6 7 1 1 ,5 7 3 ,3 7 1 2 6 2 ,2 4 0T e u s a q u illo 7 7 7 ,0 1 9 1 ,0 7 2 ,9 1 4 2 8 6 ,9 1 0M a ritire s 8 2 2 ,4 0 9 8 0 3 ,0 2 9 1 3 4 ,0 3 9A n to n io N a r in o 5 9 2 ,3 2 3 5 8 2 ,0 4 1 9 0 ,3 7 5P u e n te A ra n d a 1 ,3 3 3 ,9 6 0 1 ,5 0 6 ,1 4 3 3 1 2 ,7 2 7L a C a n d e la r ia 1 5 2 ,5 6 3 1 4 1 ,2 2 2 2 2 ,2 2 5R a fa e l U r ib e 1 ,1 3 8 ,3 7 8 9 5 6 ,0 8 6 9 4 ,6 0 4C iu d a d B o liv a r 8 6 5 ,9 1 6 5 8 4 ,9 0 3 4 4 ,5 4 0S u b T o t a l 1 6 ,8 1 2 ,8 0 3 2 1 ,7 0 2 ,4 8 2 3 ,9 2 7 ,9 5 4C h ia 9 6 ,0 4 3 9 1 ,7 8 0 6 5 ,5 8 0C o ta 2 9 ,8 4 7 5 8 ,6 1 7 1 6 ,9 4 9F a c a ta tiv a 4 5 ,6 7 3 4 9 ,2 4 1 1 2 ,4 7 6F u n z a 8 ,6 0 1 1 9 ,2 1 1 4 ,9 0 8L a C a le ra 1 8 5 ,5 9 9 1 3 5 ,5 9 4 1 ,9 1 1M a d r id 1 3 ,2 9 2 2 5 ,4 7 8 8 ,2 5 7M o s q u e ra 6 ,5 7 7 1 2 ,4 1 4 3 ,0 5 4S o a c h a 1 1 7 ,7 2 5 1 0 3 ,8 2 2 1 5 ,6 8 4S u b T o t a l 5 0 3 ,3 5 7 4 9 6 ,1 5 7 1 2 8 ,8 2 0T o ta l 1 7 ,3 1 6 ,1 6 0 2 2 ,1 9 8 ,6 3 8 4 ,0 5 6 ,7 7 4
B u i ld in g D a m a g e E st im a tio n ( m i ll io n P e s o )
Source: JICA Study Team
The result shows that the building damage is approximately 22 trillion pesos for the medium case, which expects the most damage in the Study Area. It means that more than 32 percent of total buildings would lose their values and total damaged value would exceed this amount because it includes only severely damaged buildings. In the Armenia case, the number of partially damaged houses is 2.5 times more, compared with the number of totally destroyed houses. Therefore, the amount of damage would be more than that of severely damaged buildings.
(2) Infrastructure and lifeline
Rough unit price for reconstruction of one bridge is estimated based on information of the actual construction costs of several bridges from IDU and the rough amount of the damaged bridges is calculated as the amount equal to the product of number of damaged bridges and unit cost.
Also, the damage amount of each lifeline is estimated it like according to the rough unit price for each lifeline facility obtained from related institutions.
A. Unit price
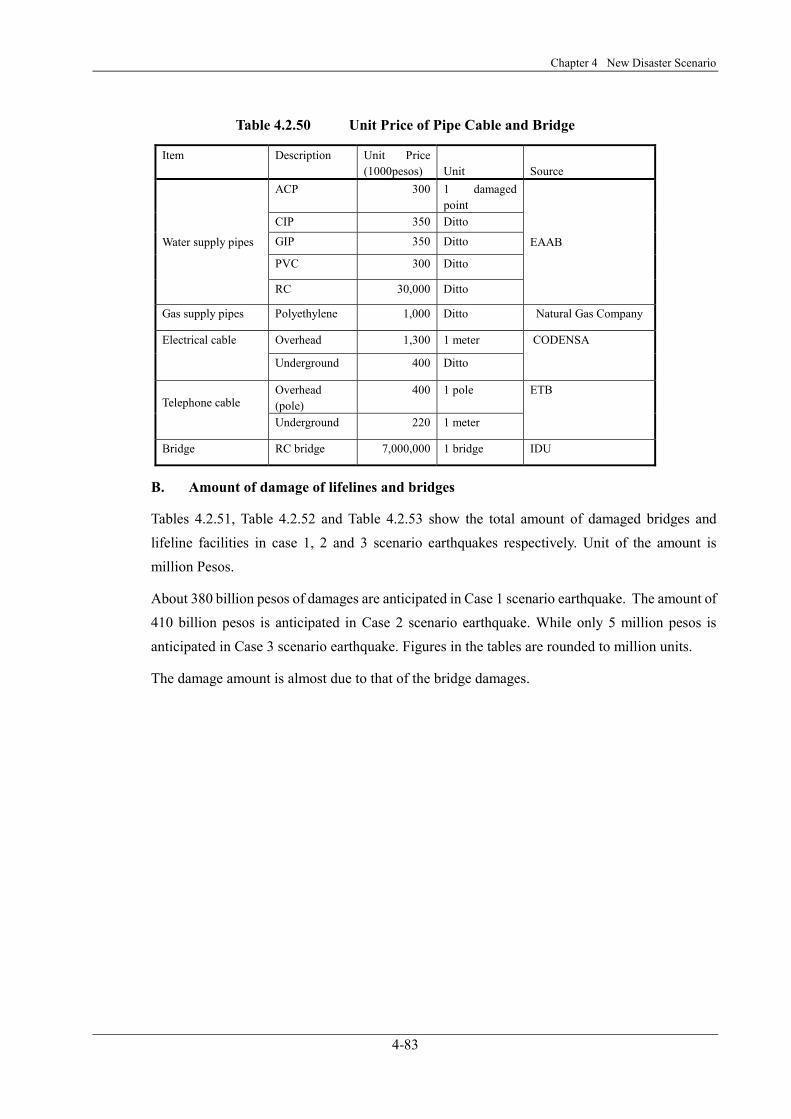
Unit prices used to estimate damage amount is as shown in Table 4.2.50. Unit prices are sourced from concerned institutions. Pipe materials of the water supply pipeline shown in Table 4.2.50 are those incurring almost all damages of water supply pipeline.
Chapter 4 New Disaster Scenario
4-83
Table 4.2.50 Unit Price of Pipe Cable and Bridge
Item Description Unit Price (1000pesos)
Unit
Source
ACP 300 1 damaged point
CIP 350 Ditto
GIP 350 Ditto
PVC 300 Ditto
Water supply pipes
RC 30,000 Ditto
EAAB
Gas supply pipes Polyethylene 1,000 Ditto Natural Gas Company
Overhead 1,300 1 meter Electrical cable
Underground 400 Ditto
CODENSA
Overhead (pole)
400 1 pole Telephone cable Underground 220 1 meter
ETB
Bridge RC bridge 7,000,000 1 bridge IDU
B. Amount of damage of lifelines and bridges
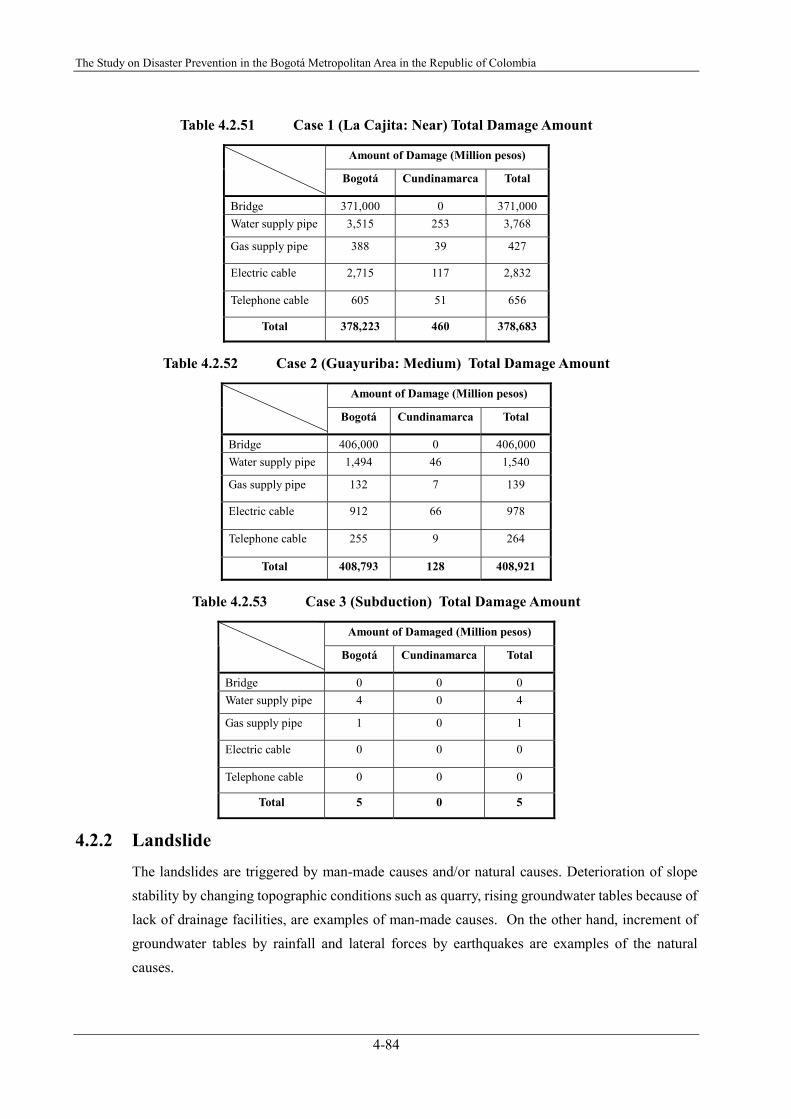
Tables 4.2.51, Table 4.2.52 and Table 4.2.53 show the total amount of damaged bridges and lifeline facilities in case 1, 2 and 3 scenario earthquakes respectively. Unit of the amount is million Pesos.
About 380 billion pesos of damages are anticipated in Case 1 scenario earthquake. The amount of 410 billion pesos is anticipated in Case 2 scenario earthquake. While only 5 million pesos is anticipated in Case 3 scenario earthquake. Figures in the tables are rounded to million units.
The damage amount is almost due to that of the bridge damages.
The Study on Disaster Prevention in the Bogotá Metropolitan Area in the Republic of Colombia
4-84
Table 4.2.51 Case 1 (La Cajita: Near) Total Damage Amount
Amount of Damage (Million pesos)
Bogotá Cundinamarca Total
Bridge 371,000 0 371,000Water supply pipe 3,515 253 3,768
Gas supply pipe 388 39 427
Electric cable 2,715 117 2,832
Telephone cable 605 51 656
Total 378,223 460 378,683
Table 4.2.52 Case 2 (Guayuriba: Medium) Total Damage Amount
Amount of Damage (Million pesos)
Bogotá Cundinamarca Total
Bridge 406,000 0 406,000 Water supply pipe 1,494 46 1,540
Gas supply pipe 132 7 139
Electric cable 912 66 978
Telephone cable 255 9 264
Total 408,793 128 408,921
Table 4.2.53 Case 3 (Subduction) Total Damage Amount
Amount of Damaged (Million pesos)
Bogotá Cundinamarca Total
Bridge 0 0 0 Water supply pipe 4 0 4
Gas supply pipe 1 0 1
Electric cable 0 0 0
Telephone cable 0 0 0
Total 5 0 5
4.2.2 Landslide The landslides are triggered by man-made causes and/or natural causes. Deterioration of slope stability by changing topographic conditions such as quarry, rising groundwater tables because of lack of drainage facilities, are examples of man-made causes. On the other hand, increment of groundwater tables by rainfall and lateral forces by earthquakes are examples of the natural causes.
Chapter 4 New Disaster Scenario
4-85
All these causes except for earthquakes are regular phenomena.
1) Regular Scenario
Slope failures triggered by rainfall frequently occur in the rainy season in general. In Bogotá, rainy season lasts from March to May and from October to November. However, monitoring results at El Espino show that the landslides began in the dry season, in August and in September, and that the landslide movements and the rainfalls were not necessarily related. Any relationship is not found between rainy seasons and landslides.
The ground movement was rather related to the beginning of the sewage discharge due to the installation of water supply facilities. In the regular disaster scenario, it is not likely that many landslides occur at the same time in a particular season.
4.2.3 Flooding The flood scenario should consider magnitudes of the external force and the probable flood of 100-year return period in the flood hazard areas.
The flood disaster scenario should consider magnitudes of the external force and estimate the extent of disaster under these conditions. The external force and disaster would be assumed as follows: - External force: Amount of runoff. - Disaster: Flooding and inundation including flash floods.
It is necessary to conduct a flood analysis for the Bogotá City Area to set up the probable flood hazard areas, but it has not been done yet. The flood disaster scenario is to be formulated based on the existing flood risk maps of Bogotá and of the eight municipalities in Cundinamarca.
1) Scenario under Existing Conditions (without Project)
According to the study report of EAAB, the existing conveyance capacity of the Rio Bogotá is evaluated at between 5-year and 10-year return period floods, so that the run-off of 100-year return period flood will overtop the river banks. The flooding area and the affected population are estimated at 11,000 ha and 615,000 as mentioned in Chapter 3.1.3 of this report.
2) Countermeasures against the Scenario under Existing Conditions
There are two countermeasures, namely, structural measures and non-structural measures to reduce the flood damage. However, the non-structural measures cannot prevent the natural phenomena of flooding. Therefore, to prevent the disasters caused by the inundation, the structural measures will basically be applied. The design scales of preventive structures have been determined with the consideration of the importance and accumulation of the assets of the possible inundation areas.
The Study on Disaster Prevention in the Bogotá Metropolitan Area in the Republic of Colombia
4-86
- Rio Bogotá and Tributaries in Bogotá City: 100-year return period flood. - Other tributaries: 10-year return period flood.
3) Scenario under Future Conditions after Completion of Structural Measures
Even though the structural countermeasures will be completed, there will still be flooding larger than the design scale along the river. It means that it is impossible to prevent all floods by the structural countermeasures. It is, therefore, necessary to consider the non-structural measures as well as structural measures to minimize the flood damage.
4.2.4 Industrial Facilities The disaster scenario for industrial disasters is to prevent a disaster caused by dangerous materials.
1) Dangerous Materials
According to the investigation in Bogotá, the most frequent events in the past were fires followed by the explosions and these explosions were mostly linked to gunpowder and propane gas.
In terms of frequency and impact of the event, the dangerous materials are gunpowder (including Christmas hot air balloons), propane, gasoline, ammonia, solvents, natural gas, chloride and hydrochloride.
2) Localities and Company Size
The related industries are mostly located in the 8 localities of Puente Aranda, Fontibón, Kennedy, Enqativá, Barrios Unidos, and in lower rates in Usaquén, Los Mártires and Suba. These localities have 78% of the related industries in Bogotá and almost 80% of the companies are small, according to the size classification criteria based on the gross assets reported by the Chamber of Commerce.
Chapter 4 New Disaster Scenario
4-87
4.3 Resources Requirement
4.3.1 Earthquake To prevent the seismic disasters and reduce the damages estimated by the severe scenario earthquake and also to take proper emergency responses, the preparedness required is as follows:
(Basic measures) - To conduct geological and geo-technical study on the eight municipalities in Cundinamarca. - To establish seismic instrumentation in the eight municipalities in Cundinamarca. - To establish emergency response measures against seismic disasters. - To select important buildings and facilities like emergency centers, medical centers for
emergency responses. - To conduct seismic safety evaluation on the major buildings, facilities, infrastructure and
lifeline structures, and to plan their countermeasures. - To plan disaster prevention centers required for emergency responses, and - To establish a unified structure for disaster prevention and emergency responses among the
concerned entities.
(Preventive measures) - To conduct preliminary seismic design for the major buildings, facilities, infrastructure and
lifeline structures, and to implement their countermeasures. - To conduct preliminary seismic design for historical buildings and to implement their
countermeasures. - To prepare a seismic hazard map. - To prepare a location map for emergency responses. - To prepare manuals for emergency responses, and - To set up a communication system as a Disaster Management Information System.
(Preventive actions) - To enhance public education for preventing seismic disasters and mitigating seismic
damages and emergency responses. - To enhance the technical education for seismic design of buildings and public facilities due
to the Colombian Regulation for Earthquake Resistant Design and Construction. - To review the Colombian Regulation for Earthquake Resistant Design and Construction for
masonry structures. - To establish the inspection process for the construction of buildings. - To establish a standard seismic design for masonry buildings. - To prepare standard remedial measures for the existing non-reinforced masonry structures. - To enhance public education for law-abiding behaviors, and
The Study on Disaster Prevention in the Bogotá Metropolitan Area in the Republic of Colombia
4-88
- To publicize information on seismic hazards and required emergency responses in the Bogotá Metropolitan Area.
4.3.2 Landslide In the regular scenario, landslide disasters occur sparsely in potential landslide areas, while an earthquake like in Case1- La Cajita will cause landslides at the areas close to the epicenter.
Therefore, the disaster prevention system should be quite different between the cases of regular time and earthquake time. In regular period, relatively small numbers of people will have to make some decisions, while large numbers of people will have to make some quick decisions in case of an earthquake. The expected cost will be mostly equal in both cases. However, in the case of an earthquake, commitment of the engineer or specialists from private consulting companies as disaster aid volunteers is indispensable in order to secure the qualified engineers or specialists.
4.3.3 Flooding The basic concepts against flood disasters are as follows: - No inundation will be occurred under the event of new disaster scenario. - To minimize flood damages with the optimum combination of structural and non-structural
measures.
The preparedness required is as follows:
(Basic measures) - To establish a hydrological observation network for flood warning. - To establish a flood warning and evacuation system for the Bogotá Metropolitan Area as a
part of the Disaster Management Information System. - To study flood hazard areas of the Bogotá Metropolitan Area, and - To review the flood disaster prevention program in the POT.
(Preventive measures) - To conduct river improvement works for the Rio Bogotá from Alicachin to Conejera to have
a conveyance capacity of the flood discharges of 100-year return period. - To conduct improvement works for the flood control facilities of the Rio Tunjuelo. - To conduct river improvement works for the Rio Botello in Facatativa, and - To conduct river improvement works and mudflow disaster prevention works at La Calera.
(Preventive actions) - To study and to improve operation methods of the Alicachin Gates during floods. - To enhance the control of the land use along the river from river management aspects. - To enhance public education for prevention of flood disaster and mitigation of flood
damages.
Chapter 4 New Disaster Scenario
4-89
- To conduct proper operation and maintenance activities for the river facilities, and - To enhance the management of the Rio Bogotá basin from water resources and
environmental aspects.
4.3.4 Industrial Facilities In order to prevent the urban area from the disasters related to dangerous materials and the industries handling them and to mitigate the damages, the measures required by the national, regional and company levels are suggested as follows:
(Basic measures) - To identify hazardous materials and hazardous industries in the Bogotá Metropolitan Area. - To prepare location maps of hazardous spots in the Bogotá Metropolitan Area, and - To establish disaster prevention measures and emergency responses.
(Preventive measures of national and regional levels) - To guide all companies to prepare information about hazardous materials that they are
handling and to prepare a Material Safety Data Sheet (MSDS) for the hazardous materials. - To guide all companies to conduct labeling of bottles containing hazardous materials. - To start a qualification and training program on technological emergency management on
hazardous materials. - To reconsider the gunpowder restriction in Bogotá or to develop a prevention program for
the safe management of hazardous materials based on international standards, and - To prepare regulations for handling of hazardous materials, referring to the UNCED, US
(NFPA Code, EPA RPM), Mexican Regulation, Japanese Fire Service Law etc.
(Preventive measures of regional level) - To instruct small companies about industrial safety. - To instruct all companies to establish a Reporting System. - To instruct all companies to report technological accidents. - To instruct all companies to report their industrial processes, raw materials or new projects
development. - To regulate the land use in the Bogotá City Area, and - To relocate the high-risk facilities and industries.
(Preventive measures of company level) - To prepare prevention plans of propane gas and natural gas disasters, and - To reconsider the gunpowder restriction in Bogotá or to develop a prevention program for
the safe management of hazardous materials based on international standards.
The Study on Disaster Prevention in the Bogotá Metropolitan Area in the Republic of Colombia
4-90
(Preventive actions) - To enhance the public education of hazardous materials and hazardous industries, and - To publicize the hazardous spots in the Bogotá Metropolitan Area.
4.3.5 Others 1) Emergency Health and Medical Services
(Basic measures) - To establish an emergency medical response network of hospitals. - To set up an emergency medical information system as a part of the Disaster Management
Information System. - To establish medical aide teams. - To compile manuals on emergency disaster medical services. - To identify core hospitals for emergency medical services, and - To conduct preliminary seismic safety evaluation on the core hospitals.
(Preventive measures) - To increase capacity and capability to receive patients in case of emergency, and - To prepare temporary hospitals.
(Preventive actions) - To enhance public education for emergency medical responses.