Embed Size (px)
Citation preview
Post-EQK Damage Assessment of Bridges
Marc J. Veletzos, Ph.D., P.E.Merrimack College
Post-Earthquake Reconnaissance Workshop2015 EERI Annual Meeting
April 3, 2015

Some Questions for You
Who is… An Undergraduate Student? A Graduate Student?
Who has taken… EQK Engineering Class? Bridge Design Class? Concrete Design Class? Steel Design Class?
Who is from… West coast? East coast? Middle states?

Outline
Current State of Practice Reinforced Concrete Bridge Behavior Inspection and Assessment Protocol of RC Bridge
Columns Questions

Current State of Practice
A Broad Perspective

ATC-20 (Buildings)
Three placard postings:
No apparent hazard
Hazardous condition exists
Extreme hazard present
Source: ATC, 2005

Assessment Procedures(Bridges) Indiana DOT
and
Kentucky DOT Pre-investigation, , and procedures
Mississippi DOT, , and
New York DOT Aerial reconnaissance, ,
, and
Oregon DOT (multi-hazard) First look, , , and
Utah DOT Initial reports, , , and
Washington DOT Level I investigation, , , and
ATC-20 equivalent

Washington DOT Emergency Response Inspection Procedure
Source: Reed and Wang, 1993.
Event Level I Not Collapsed
Collapsed
Level III
Unsafe (red)
Limited Entry
(yellow)
Safe (green)
Unsafe (red)
Unsafe (orange)
Limited Entry
(yellow)
Safe (green)
Repair/ Rebuild
End
: Inspection rating
: Inspection procedureLegend:
(Detailed Evaluation)
Level II
Forensic Investigation
(Rapid Evaluation)
(Engineering Evaluation)

NY DOT Damage Assessment Types -Aerial Reconnaissance

NY DOT Damage Assessment Types

NY DOT Damage Assessment Types -Preliminary Bridge Damage Assessment

NY DOT Damage Assessment Types -Special Post-EQK Bridge Inspection

NY DOT Damage Assessment Types -Further Investigation

NY DOT Process Flowchart(Mobilization of Assets)
EVENT
RE receives text message and/or email notification from USGS*
Affected residency conducts Preliminary Bridge Damage Assessment (PBDA) starting with state bridges on
priority routes and reports findings to RSE.
Response Level I:As directed by RSE.
Mw ≥ 3.5?Reports of damage?
Damage found?Uncertain?
RSE arranges for inspection of any critically important bridges within radius of concern (R).
Response Level II:3.5 ≤ Mw < 4.5
R = 40 miles
Response Level III:4.5 ≤ Mw < 5.5
R = 60 miles
Response Level IV:Mw ≥ 5.5
R = 80 miles
Inspect damage bridges found in PBDA and
seismically vulnerable bridges in 40 miles
radius. Inspect bridges with
VR = 1 or VR =2
Inspect damage bridges found in PBDA and
seismically vulnerable bridges in 60 miles
radius. Inspect bridges with VR
= 1 or VR =2
Conduct Aerial Reconnaissance
Inspect all bridges in 80 mile radius, starting with damaged and
seismically vulnerable bridges
Flag bridges per DOT policy. Call for further investigation if necessary
STOP
No
No
Yes
Yes
* In RL1, RSE receives notification
Sources: O’Connor, 2010.
If you have a Mw=4, do you inspect every bridge in your state?

Reinforced Concrete Bridge Behavior
A more detailed perspective

Possible Location of Plastic Hinges in Bridge
You need to know where to look for damage!

Longitudinal Bar Buckling of Pre '71 Design

Pull Out Failure of Pre '71 Design

Flexural Damage at Base of Column.
Note spallingof concrete

Flexural Failure of Post '94 Design

Shear Failure of Pre '71 Design
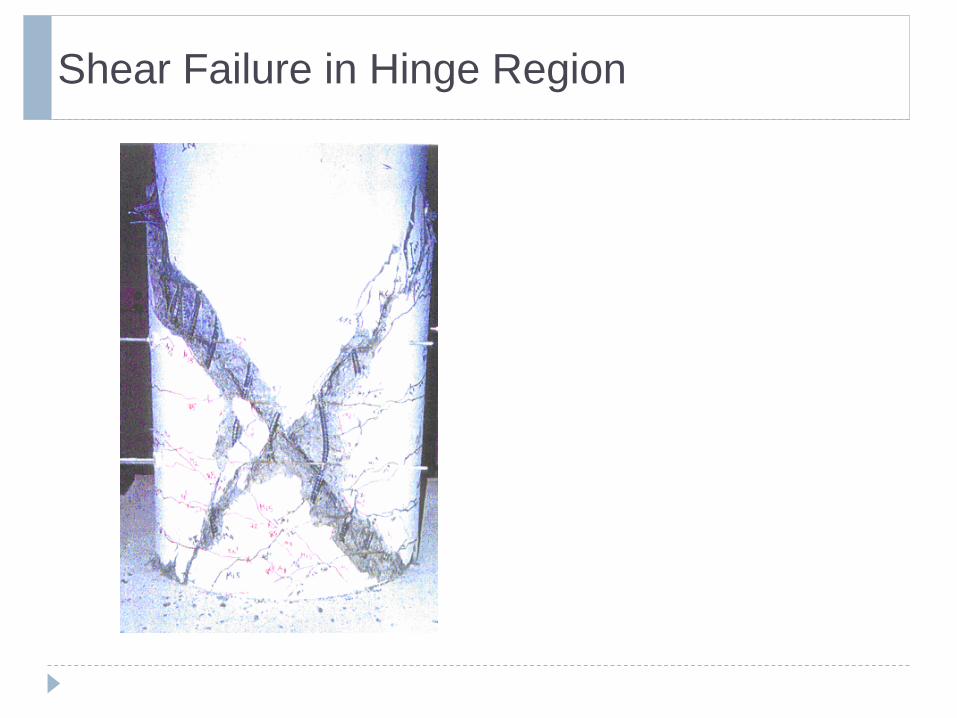
Shear Failure in Hinge Region

Column Lap Splice Failure

Shear Failure Below Flare

Flexural Failure of Flared Column
(Note: Research columns are tested upside down for convenience)

Connection/Joint Shear Failure

Abutment Shear Key Failure
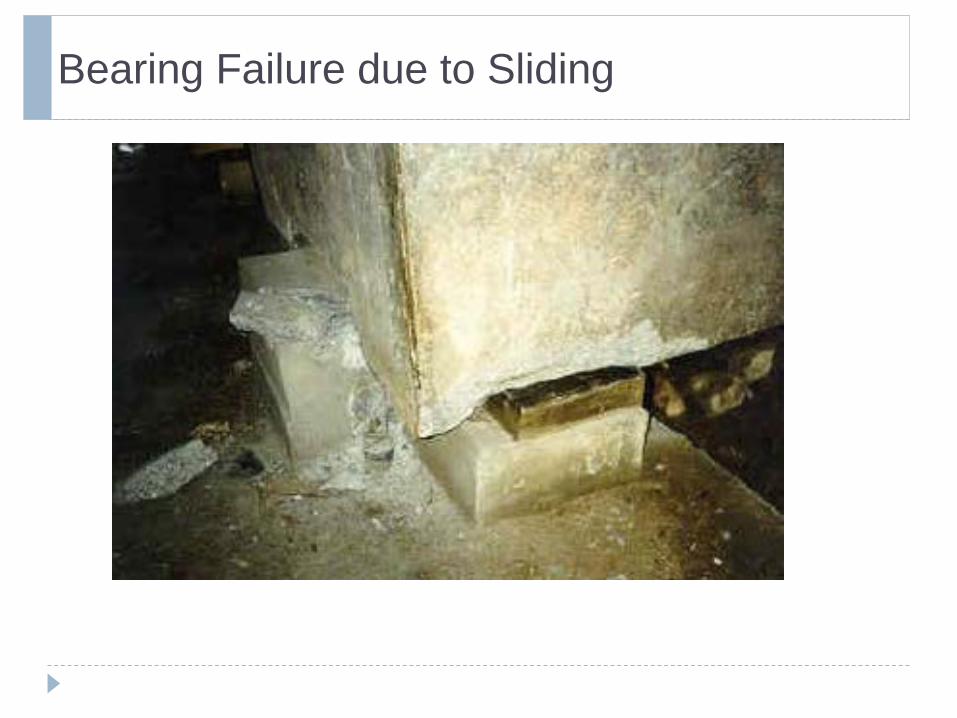
Bearing Failure due to Sliding

Inspection and Assessment Protocol of RC Bridge Columns
An approach proposed to Caltrans

PHASE I – DETERMINE PERFORMANCE CURVE
Late
ral F
orce
D - Response
SD - Response
B - Response
X
XX
Lateral Displacement
Late
ral F
orce
D - Response
SD - Response
B - Response
X
XX
Lateral Displacement
How is your column likely to respond?

Column Failure Mode and Performance Curve Decision Making Flowchart
“BRITTLE”Shear
dominated failure
“STRENGTH DEGRADING”Flexural failure
or
End
End
1. Column Retrofits
2. Aspect Ratio
3. Column Reinforcement Splices
Yes
No“BRITTLE”
Shear Dominated
Failure
F-F column jacket retrofit
Yes
No
“DUCTILE”flexure failure
P-F column jacket
retrofit
Yes
“STRENGTH DEGRADING” flexural failure but the column will retain vertical load capacity
collapse possible
Start
Check for Column Retrofits
L/D < 2 Yes “BRITTLE”Shear
Dominated Failure
Check Aspect Ratio
column jacket retrofit
Yes
No
No
3a. Check TRANSVERSE
Reinforcement for Lap Splices
Are hoops or spirals
continuous
No
P column jacket
retrofit
Yes
Check “2. Aspect Ratio”and “3. Transverse
Reinforcement”. This column may be moved to “BRITTLE” but will
be no better than “STRENGTH
DEGRADING”.
End
End
End
End
“BRITTLE”Shear
dominated failure
“STRENGTH DEGRADING”Flexural failure
or
EndEndEnd
EndEndEnd
1. Column Retrofits
2. Aspect Ratio
3. Column Reinforcement Splices
Yes
No“BRITTLE”
Shear Dominated
Failure
F-F column jacket retrofit
Yes
No
“DUCTILE”flexure failure
P-F column jacket
retrofit
Yes
“STRENGTH DEGRADING” flexural failure but the column will retain vertical load capacity
collapse possible
Start
Check for Column Retrofits
L/D < 2 Yes “BRITTLE”Shear
Dominated Failure
Check Aspect Ratio
column jacket retrofit
Yes
No
No
3a. Check TRANSVERSE
Reinforcement for Lap Splices
Are hoops or spirals
continuous
No
P column jacket
retrofit
Yes
Check “2. Aspect Ratio”and “3. Transverse
Reinforcement”. This column may be moved to “BRITTLE” but will
be no better than “STRENGTH
DEGRADING”.
EndEndEnd
EndEndEnd
EndEndEnd
EndEndEnd

Column Failure Mode and Performance Curve Decision Making Flowchart
End
4. Column Transverse Reinforcement
Any longitudinal splices in column
Yes
No
Column trans rebar
spacing > 8”
“STRENGTH DEGRADING” Flexure failure. Regardless of column
reinforcement, under extreme cycles the splice may slip and act more like a
strength degrading column. The column may retain vertical load capacity.
collapse is unlikely
“BRITTLE” Shear failure. The column may not retain
vertical load capacity collapse possible
Yes
No
Make note of inadequate development of column
long. rebar. Use this information to assess the
bridge system
l < ld
4a. Check Column TRANSVERSE Reinforcement
Spacing
3b. Check LONGITUDINAL
Reinforcement for Lap Splices
Check Development of
Column Longitudinal
Reinforcement
Yes
No
s <= min(6db, 8”) “DUCTILE”Flexural failure
4b. Check Confinement of Plastic Hinge Regions
(adjacent to fixed connections at footing
and/or bent cap)
s >= min(6db, 8”)
“STRENGTH DEGRADING”Flexural failure
#4 @ 12”(typ. of pre ‘72)
or spacing > 12”
Yes
No
“BRITTLE”Shear
Dominated Failure
Yes
No
5. Comments
End
End
End
End
End
Splicing not an issue. Check Column Transverse
Reinforcement
EndEndEnd
4. Column Transverse Reinforcement
Any longitudinal splices in column
Yes
No
Column trans rebar
spacing > 8”
“STRENGTH DEGRADING” Flexure failure. Regardless of column
reinforcement, under extreme cycles the splice may slip and act more like a
strength degrading column. The column may retain vertical load capacity.
collapse is unlikely
“BRITTLE” Shear failure. The column may not retain
vertical load capacity collapse possible
Yes
No
Make note of inadequate development of column
long. rebar. Use this information to assess the
bridge system
l < ld
4a. Check Column TRANSVERSE Reinforcement
Spacing
3b. Check LONGITUDINAL
Reinforcement for Lap Splices
Check Development of
Column Longitudinal
Reinforcement
Yes
No
s <= min(6db, 8”) “DUCTILE”Flexural failure
4b. Check Confinement of Plastic Hinge Regions
(adjacent to fixed connections at footing
and/or bent cap)
s >= min(6db, 8”)
“STRENGTH DEGRADING”Flexural failure
#4 @ 12”(typ. of pre ‘72)
or spacing > 12”
Yes
No
“BRITTLE”Shear
Dominated Failure
Yes
No
5. Comments
EndEndEnd
EndEndEnd
EndEndEnd
EndEndEnd
EndEndEnd
Splicing not an issue. Check Column Transverse
Reinforcement

PHASE II – DETERMINE DAMAGE LEVEL
Level I
Level II
Level III
Level IV
Level V
Level V
Late
ral F
orce
Ductile Curve
Strength Degrading Curve
Brittle Curve
X
XX
Lateral Displacement
Level I
Level II
Level III
Level IV
Level V
Level V
Late
ral F
orce
Ductile Curve
Strength Degrading Curve
Brittle Curve
X
XX
Lateral Displacement
Late
ral F
orce
Ductile Curve
Strength Degrading Curve
Brittle Curve
X
XX
Lateral Displacement
Where is your column on each curve?

Performance Classifications (Five Damage Levels)
Damage Level
Damage Classification
Damage Description
Repair Description
Socio-Economic
Description
I None Barely visible cracking No Repair Fully
Operational
II Minor Minor cracking Possible Repair Operational
III Moderate Open cracks; onset of spalling
Minimum Repair Life Safety
IV Major Very wide cracks; extended spalling Repair Near Collapse
V Local Failure/Collapse
Reinforcement buckling/rupture; Visible structural
damage
Replacement or substantial
retrofitCollapse
(Ref. Hose)

PHASE II – DETERMINE DAMAGE LEVEL
Step 1. - Check for diagonal cracks. Step 2. - Check for horizontal cracks. Step 3. - Check for concrete crushing or spalling. Step 4. - Check for longitudinal bar buckling. Step 5. - Check for rupture of transverse
reinforcement Step 6. - Determine the damage level based on
the observations above.

Determination of Extension of Diagonal Cracks
Extension of diagonal
cracks
D
Extension of diagonal
cracks
D

Length of Spalled Region
Length of spalledregion
D
spalledconcrete
Length of spalledregion
D
spalledconcrete

Performance Assessment
Damage Level
Performance Level
Qualitative Performance Description
Quantitative Performance Description
I Cracking Onset of hairline cracks Barely visible residual cracks
II Yielding Theoretical first yield of longitudinal reinforcement Residual crack width ~ 0.008in
IIIInitiation of
Local Mechanism
Initiation of inelastic deformation.
Onset of concrete spalling.
Development of diagonal cracks.
Residual crack width 0.04in – 0.08in
Length of spalled region >1/10 cross-section depth.
IV
Full Development of
Local Mechanism
Wide crack widths/spalling over full local mechanism region.
Residual crack width > 0.08in.
Diagonal cracks extend over 2/3 cross-section depth.
Length of spalled region > ½ cross-section depth.
V Strength Degradation
Buckling of main reinforcement.
Rupture of transverse reinforcement.
Crushing of core concrete.
Lateral capacity below 85% of maximum.
Section depth expands to >5% of original dimension.
(Ref. Hose)
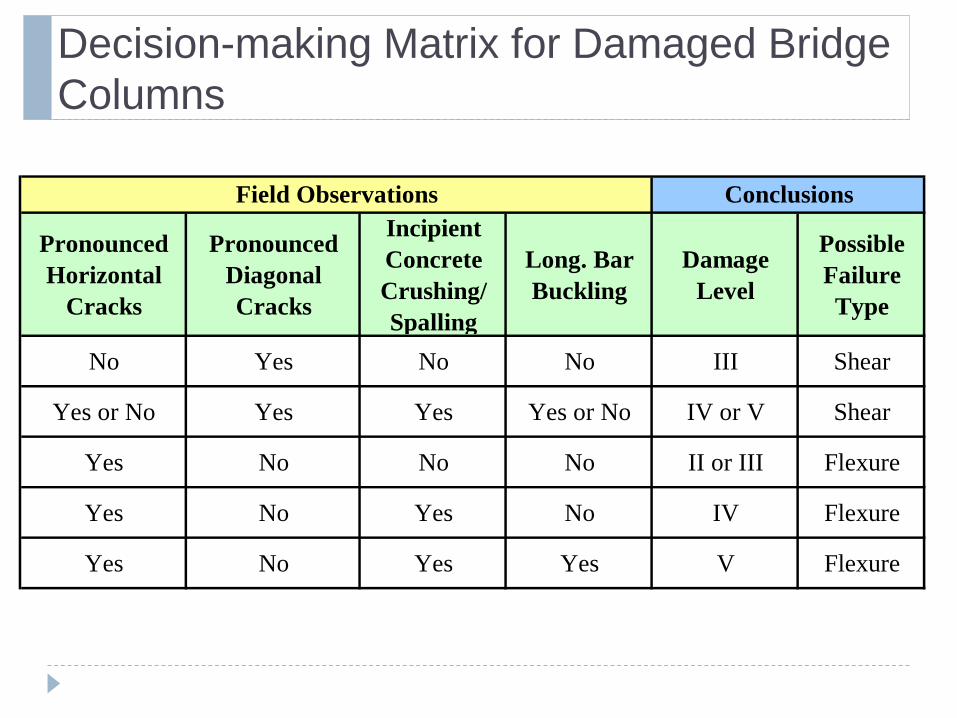
Decision-making Matrix for Damaged Bridge Columns
Pronounced Horizontal
Cracks
Pronounced Diagonal Cracks
Incipient Concrete Crushing/ Spalling
Long. Bar Buckling
Damage Level
Possible Failure Type
No Yes No No III Shear
Yes or No Yes Yes Yes or No IV or V Shear
Yes No No No II or III Flexure
Yes No Yes No IV Flexure
Yes No Yes Yes V Flexure
ConclusionsField Observations

PHASE III – ASSESS BRIDGE SYSTEM
Late
ral F
orce
Brittle Curve
X
Lateral Displacement
x
Level ILevel IILevel IIILevel IVLevel V
Bent 1 – Column 1 (Brittle)
Bent 1 – Column 2 (Brittle)
Remaining Capacity
Late
ral F
orce
Brittle Curve
X
Lateral Displacement
x
Level ILevel IILevel IIILevel IVLevel Vx
Level ILevel IILevel IIILevel IVLevel V
Bent 1 – Column 1 (Brittle)
Bent 1 – Column 2 (Brittle)
Remaining Capacity
Late
ral F
orce Strength Degrading CurveX
Lateral Displacement
x
Level ILevel IILevel IIILevel IVLevel V
Bent 2 – Columns 1 and 2 (Strength Degrading)
Remaining Capacity
Late
ral F
orce Strength Degrading CurveX
Lateral Displacement
x
Level ILevel IILevel IIILevel IVLevel Vx
Level ILevel IILevel IIILevel IVLevel V
Bent 2 – Columns 1 and 2 (Strength Degrading)
Remaining Capacity

Thanks!Questions?

ReferencesATC. 2002. Rapid Visual Screening of Buildings for Potential Seismic Hazards: A
Handbook. FEMA P-154, Edition 2.ATC. 2005. ATC-20-1: Field Manual: Procedures for the Postearthquake Safety
Evaluation of Buildings, Second Edition. Applied Technology Council, Redwood City, California.
Hose, Y.D., Silva, P., Seible, F., “Performance Library of Concrete Bridge Components, Sub-Assemblages, and Systems under Simulated Seismic Loads”, Structural Systems Research Program, SSRP 99/08, University of California, San Diego, La Jolla, CA, January, 1999.
O’Connor, J. S. 2010. Post-Earthquake Bridge Inspection Guidelines. Final Report for NYSDOT SPR Project # C-06-14.
Reed, D. A., and J. Wang. 1993. An Emergency Response Plan for Bridge Management. Report No. WA-RD 289.1. Washington Department of Transportation.
Veletzos, Panagiotau and Restrepo. 2006. Post Seismic Inspection and Capacity Assessment of Reinforced Concrete Bridges. UCSD Structural Systems Research Project SSRP-06/19.

Training Course:Post Earthquake Inspection
and Capacity Assessment of RC Bridges
Prepared by:University of California, San Diego
Department of Structural Engineering

Lectures
Lecture 1: Introduction, Seismic Design Concepts (A)Lecture 2: Seismic Design Concepts (B)Lecture 3: Performance of Bridge Components (A)Lecture 4: Performance of Bridge Components (B)Lecture 5: Post Earthquake EvaluationLecture 6: Lessons Learned

Lecture 6 – Lessons Learned
Flexure vs. Shear Design Era Shear vs. Lap Splice Abutments Connections

Lesson 1a. Flexure vs. ShearLecture 6
Flexural behavior (ductile curve) is progressive and gives warning
Shear behavior (brittle curve) is sudden and compromises gravity load carrying capacity.
Level I
Level II
Level III
Level IV
Level V
Level V
Late
ral F
orce
Ductile Curve
Brittle Curve
XX
Lateral Displacement
Level IVLevel I
Level II
Level III
Level IV
Level V
Level V
Late
ral F
orce
Ductile Curve
Brittle Curve
XX
Lateral Displacement
Level IVLevel I
Level II
Level III
Level IV
Level V
Level V
Late
ral F
orce
Ductile Curve
Brittle Curve
XX
Lateral Displacement
Level IVLevel I
Level II
Level III
Level IV
Level V
Level V
Late
ral F
orce
Ductile Curve
Brittle Curve
XX
Lateral Displacement
Level IV

Lesson 1b. Flexure vs. ShearLecture 6
Level II – Flexural Column Horizontal cracks
Level II – Shear Column Diagonal cracks
Flexure and shear have different crack patterns

Lesson 1c. Flexure vs. ShearLecture 6
Level IV Flexure
Level IV Shear
Similar level of damage very different amount of remaining capacity
Level I
Level II
Level III
Level IV
Level V
Level V
Late
ral F
orce
Ductile Curve
Brittle Curve
XX
Lateral Displacement
Level IVLevel I
Level II
Level III
Level IV
Level V
Level V
Late
ral F
orce
Ductile Curve
Brittle Curve
XX
Lateral Displacement
Level IV

Lesson 2a. Design EraLecture 6
Similar level of damage (crack sizes) different amount of remaining capacity
Level IV Post ‘71
Level IV Pre ‘71
Level I
Level II
Level IIILevel IV
Level V
Level V
Late
ral F
orce
Ductile Curve
Strength Degrading Curve
X
X
Lateral Displacement
Level IV
Level I
Level II
Level IIILevel IV
Level V
Level V
Late
ral F
orce
Ductile Curve
Strength Degrading Curve
X
X
Lateral Displacement
Level IV

Lesson 2b. Design EraLecture 6
Pre ’71 columns typically strength degrading
or brittle behavior
Level I
Level II
Level III
Level VLa
tera
l For
ce Strength Degrading Curve
Brittle Curve
XX
Lateral Displacement
Level I
Level II
Level IIILevel IV
Level V

Lesson 2c. Design EraLecture 6
Pre ’94 columns with aspect ratio < 4 susceptible to brittle shear behavior

Lesson 2d. Design EraLecture 6
Post ’94 columns with aspect ratio >4 typically ductile flexural behavior
Note heavy confinement
of hinge region

Lesson 3. Shear vs. Lap SpliceLecture 6
Shear F-∆ Response
Lap Splice F-∆ Response
Similar response, but ….
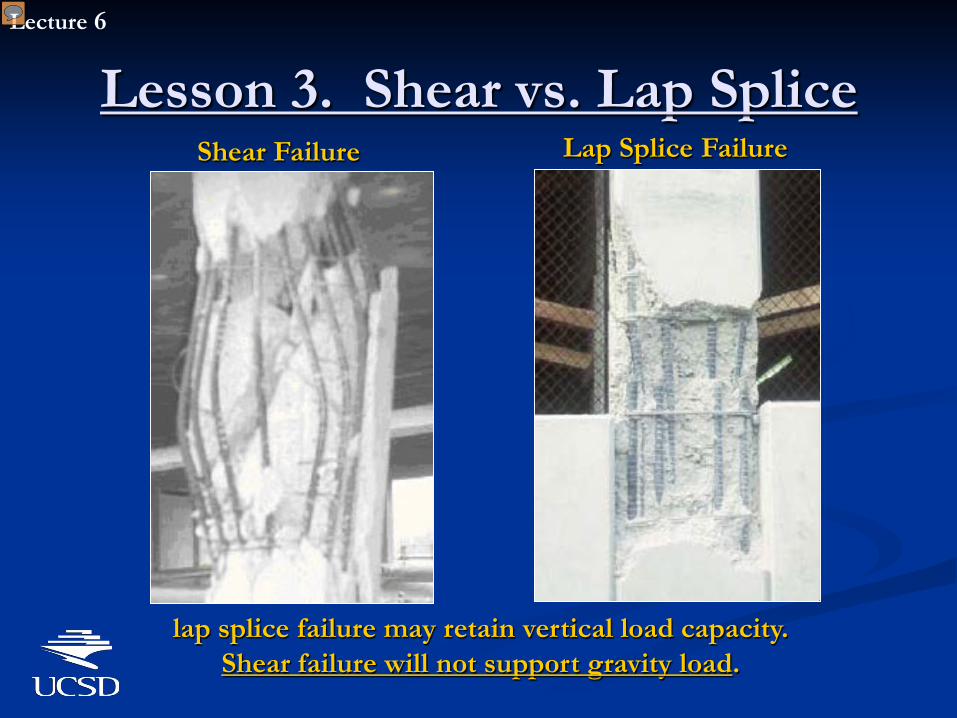
Lesson 3. Shear vs. Lap SpliceLecture 6
Shear Failure Lap Splice Failure
lap splice failure may retain vertical load capacity. Shear failure will not support gravity load.

Lesson 4. AbutmentsLecture 6
typically characterized by brittle performance curve
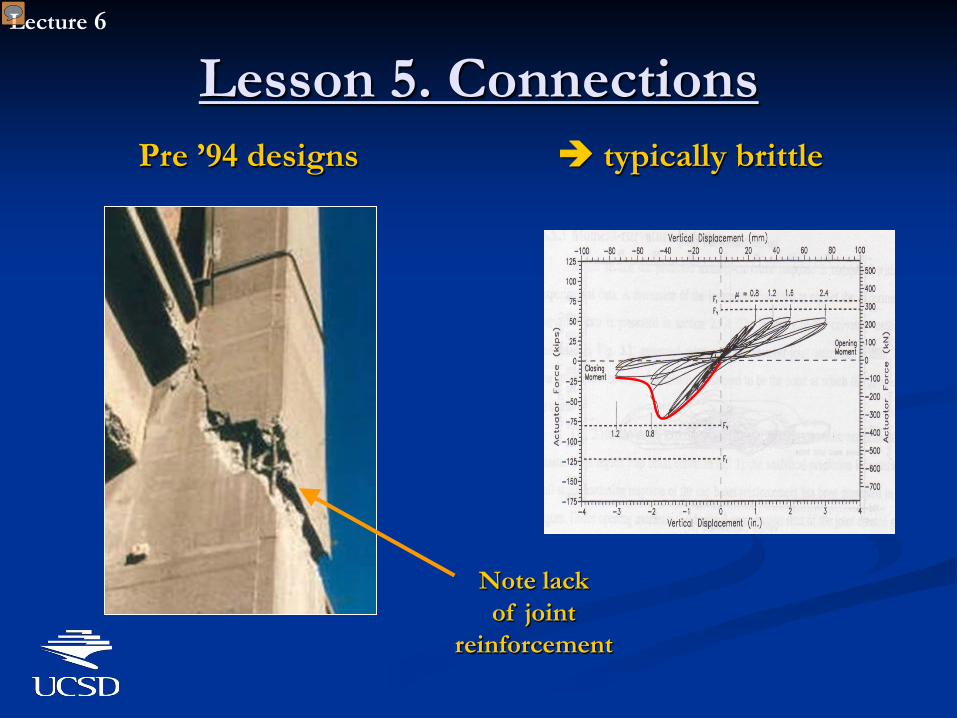
Lesson 5. ConnectionsLecture 6
Pre ’94 designs typically brittle
Note lack of joint
reinforcement