Embed Size (px)
Citation preview
1
4. The Great Migration, 1871-1890
Context:
The 1860s ended, after years of conflict, in recession, high public debt, growing strain
between central and provincial governments, and low levels of net immigration.
Vogel’s answer was an expansionist policy which, despite some opposition within the
colony, included both capital borrowing and the introduction of immigrants on a large
scale.1 In July 1869, he outlined his proposals to encourage renewed immigration,
referring to tangible inducements which included ‘deferred payments and ...
guaranteed employment on arrival,’ while insisting that the ‘old world’ problem of a
pauperised ‘submerged tenth’ would not reappear, nor would New Zealand become a
‘receptacle’ for ‘the refuse populations of large towns and cities, composed of beings
hopelessly diseased in body and mind, deficient in all capacity for useful labour,
vagrant and idle alike by habit and inclination, paupers by profession, and glorifying
in being so.’2 Vogel also hoped that immigration in association with public works like
roads and railways would settle down the frontier. New settlement, especially on land
confiscated from Maori, might improve security.
Vogel’s proposals implied planning and organisation on a large scale, and the careful
selection of migrants. In fact, the Immigration and Public Works Bill, introduced into
Parliament in 1870 simply empowered the government to enter into contracts to select
and bring to New Zealand the number and type of immigrants requested by the
provincial superintendents. What followed over the next few years was more
extensive. It eventually included the provision of subsidised and free passages, a
scheme which allowed relatives, friends and employers in the colony to nominate
immigrants, the centralisation of the recruitment drive in the London-based Agency-
General, and then extensive efforts using recruiting agents and lecturers to attract
particularly agricultural labourers and single women.
1 It must have seemed to Vogel that a real opportunity existed for enlisting the direct assistance of the imperial government. In February 1870, the British Government noted that ‘large numbers of well-conducted industrious labourers’ could not find employment in the United Kingdom while there existed ‘in most of the Colonies a more extensive demand for labour than the labouring class on the spot can supply…’asked the colonies to furnish details of the classes of labour most required. See Copy of a circular despatched by a recent mail to the governors of different colonies on the subject of emigration, BPP 1870.xlix.595. For some of the opposition within New Zealand, see Otago Daily Times 31 August 1870; Grey River Argus 20 September 1871; and NZPD 13, 1872, pp.127-128. 2 Appendices, Journals of the House of Representatives (AJHR) B2, 1870, p.19.
2
There was also one significant privately-organised scheme during this period. George
Vesey Stewart, a gentleman entrepreneur from County Tyrone, hoped to repair his
fortune by land speculation in New Zealand. Through political contacts he obtained
10,000 acres (4,000 hectares), and eventually attracted four groups of settlers. They
were Protestant families from Ulster who first came to Katikati in the Bay of Plenty,
aboard the Carisbrooke Castle in 1875 and the Lady Jocelyn in 1878. The last group
arrived in 1884.
Numbers
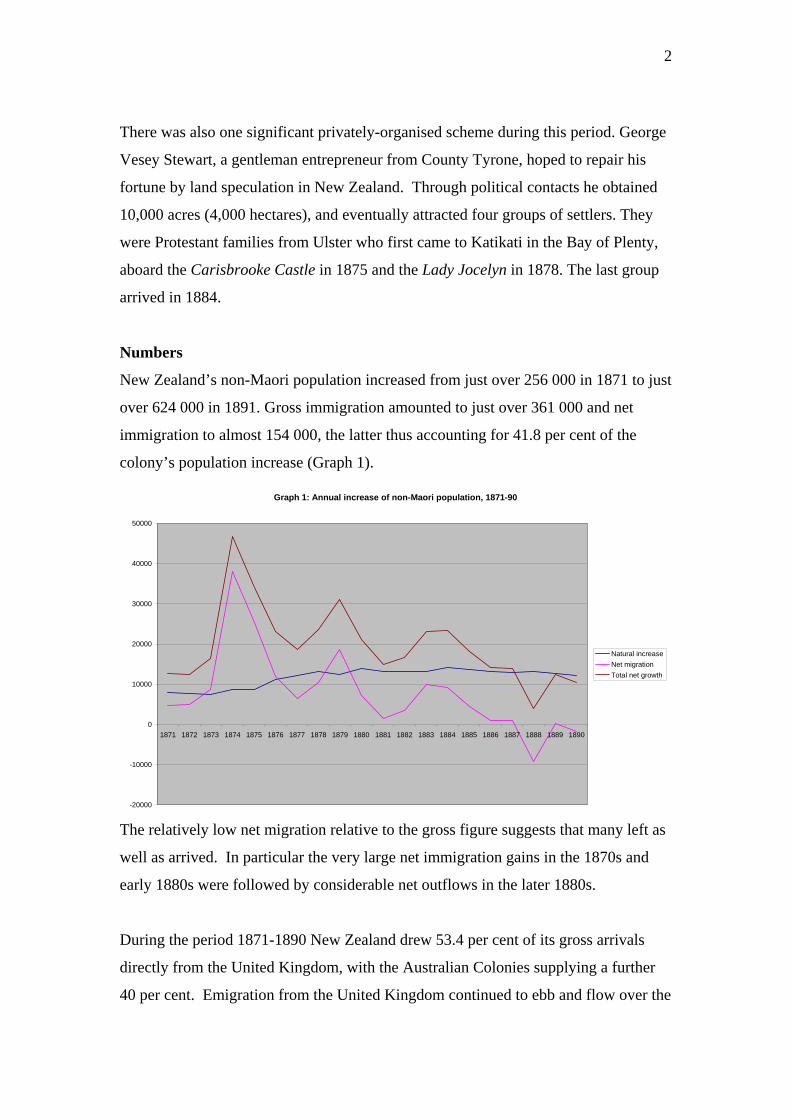
New Zealand’s non-Maori population increased from just over 256 000 in 1871 to just
over 624 000 in 1891. Gross immigration amounted to just over 361 000 and net
immigration to almost 154 000, the latter thus accounting for 41.8 per cent of the
colony’s population increase (Graph 1).
Graph 1: Annual increase of non-Maori population, 1871-90
-20000
-10000
0
10000
20000
30000
40000
50000
1871 1872 1873 1874 1875 1876 1877 1878 1879 1880 1881 1882 1883 1884 1885 1886 1887 1888 1889 1890
Natural increaseNet migrationTotal net growth
The relatively low net migration relative to the gross figure suggests that many left as
well as arrived. In particular the very large net immigration gains in the 1870s and
early 1880s were followed by considerable net outflows in the later 1880s.
During the period 1871-1890 New Zealand drew 53.4 per cent of its gross arrivals
directly from the United Kingdom, with the Australian Colonies supplying a further
40 per cent. Emigration from the United Kingdom continued to ebb and flow over the
3
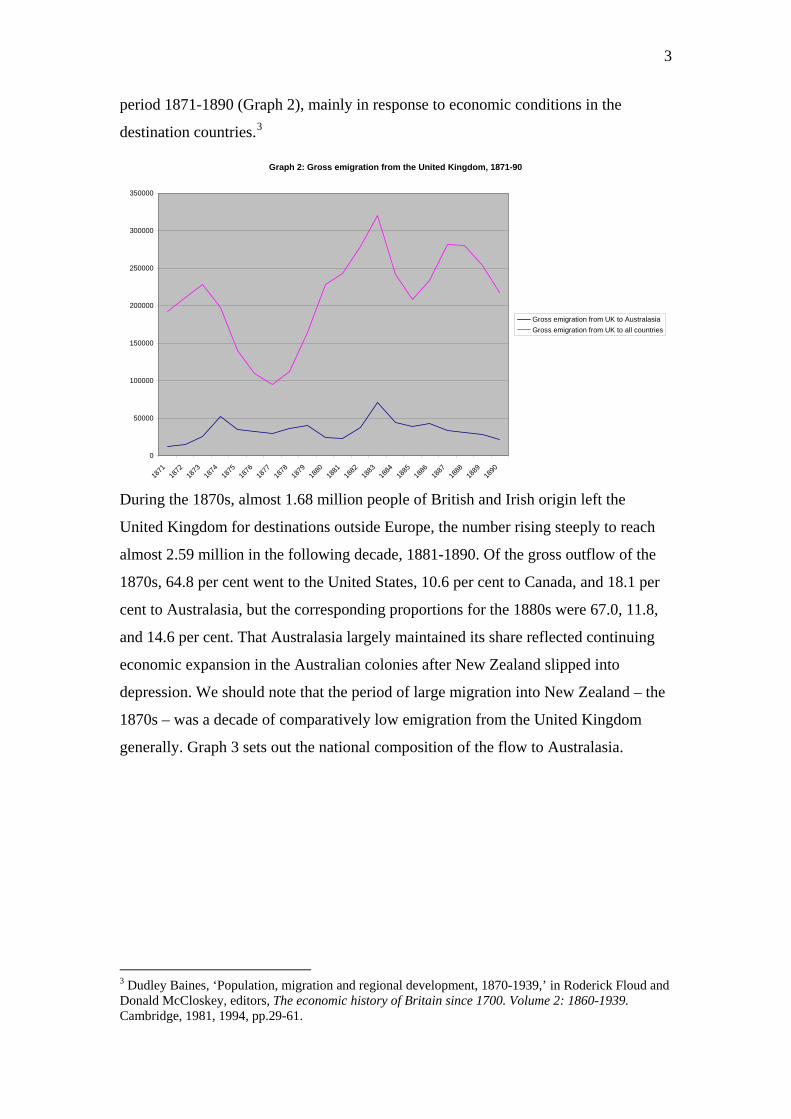
period 1871-1890 (Graph 2), mainly in response to economic conditions in the
destination countries.3
Graph 2: Gross emigration from the United Kingdom, 1871-90
0
50000
100000
150000
200000
250000
300000
350000
1871
1872
1873
1874
1875
1876
1877
1878
1879
1880
1881
1882
1883
1884
1885
1886
1887
1888
1889
1890
Gross emigration from UK to AustralasiaGross emigration from UK to all countries
During the 1870s, almost 1.68 million people of British and Irish origin left the
United Kingdom for destinations outside Europe, the number rising steeply to reach
almost 2.59 million in the following decade, 1881-1890. Of the gross outflow of the
1870s, 64.8 per cent went to the United States, 10.6 per cent to Canada, and 18.1 per
cent to Australasia, but the corresponding proportions for the 1880s were 67.0, 11.8,
and 14.6 per cent. That Australasia largely maintained its share reflected continuing
economic expansion in the Australian colonies after New Zealand slipped into
depression. We should note that the period of large migration into New Zealand – the
1870s – was a decade of comparatively low emigration from the United Kingdom
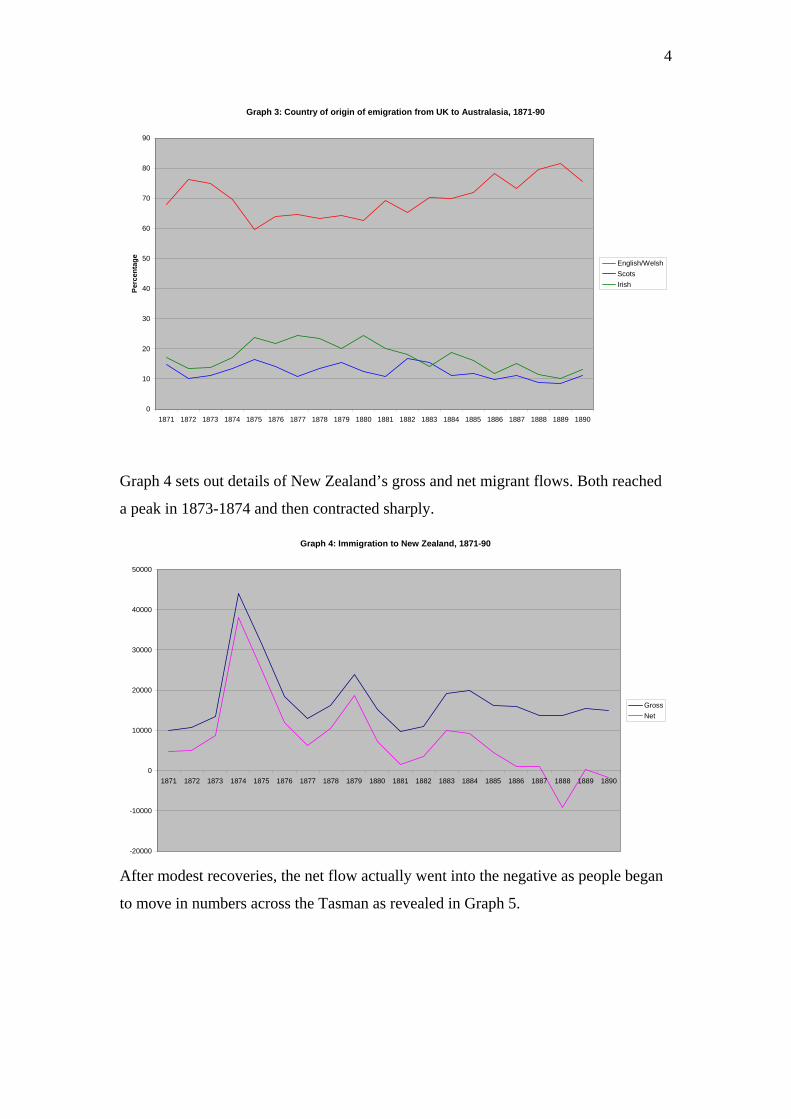
generally. Graph 3 sets out the national composition of the flow to Australasia.
3 Dudley Baines, ‘Population, migration and regional development, 1870-1939,’ in Roderick Floud and Donald McCloskey, editors, The economic history of Britain since 1700. Volume 2: 1860-1939. Cambridge, 1981, 1994, pp.29-61.
4
Graph 3: Country of origin of emigration from UK to Australasia, 1871-90
0
10
20
30
40
50
60
70
80
90
1871 1872 1873 1874 1875 1876 1877 1878 1879 1880 1881 1882 1883 1884 1885 1886 1887 1888 1889 1890
Perc
enta
ge English/WelshScotsIrish
Graph 4 sets out details of New Zealand’s gross and net migrant flows. Both reached
a peak in 1873-1874 and then contracted sharply.
Graph 4: Immigration to New Zealand, 1871-90
-20000
-10000
0
10000
20000
30000
40000
50000
1871 1872 1873 1874 1875 1876 1877 1878 1879 1880 1881 1882 1883 1884 1885 1886 1887 1888 1889 1890
GrossNet
After modest recoveries, the net flow actually went into the negative as people began
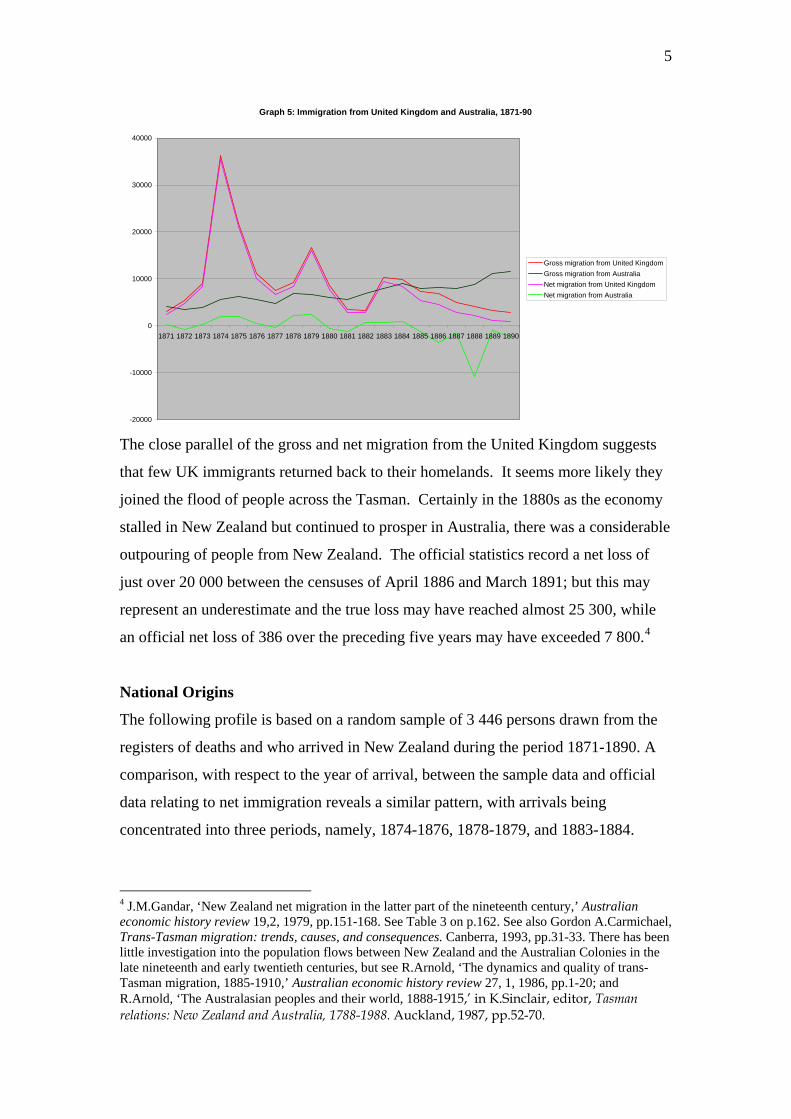
to move in numbers across the Tasman as revealed in Graph 5.
5
Graph 5: Immigration from United Kingdom and Australia, 1871-90
-20000
-10000
0
10000
20000
30000
40000
1871 1872 1873 1874 1875 1876 1877 1878 1879 1880 1881 1882 1883 1884 1885 1886 1887 1888 1889 1890
Gross migration from United KingdomGross migration from AustraliaNet migration from United KingdomNet migration from Australia
The close parallel of the gross and net migration from the United Kingdom suggests
that few UK immigrants returned back to their homelands. It seems more likely they
joined the flood of people across the Tasman. Certainly in the 1880s as the economy
stalled in New Zealand but continued to prosper in Australia, there was a considerable
outpouring of people from New Zealand. The official statistics record a net loss of
just over 20 000 between the censuses of April 1886 and March 1891; but this may
represent an underestimate and the true loss may have reached almost 25 300, while
an official net loss of 386 over the preceding five years may have exceeded 7 800.4
National Origins
The following profile is based on a random sample of 3 446 persons drawn from the
registers of deaths and who arrived in New Zealand during the period 1871-1890. A
comparison, with respect to the year of arrival, between the sample data and official
data relating to net immigration reveals a similar pattern, with arrivals being
concentrated into three periods, namely, 1874-1876, 1878-1879, and 1883-1884.
4 J.M.Gandar, ‘New Zealand net migration in the latter part of the nineteenth century,’ Australian economic history review 19,2, 1979, pp.151-168. See Table 3 on p.162. See also Gordon A.Carmichael, Trans-Tasman migration: trends, causes, and consequences. Canberra, 1993, pp.31-33. There has been little investigation into the population flows between New Zealand and the Australian Colonies in the late nineteenth and early twentieth centuries, but see R.Arnold, ‘The dynamics and quality of trans-Tasman migration, 1885-1910,’ Australian economic history review 27, 1, 1986, pp.1-20; and R.Arnold, ‘The Australasian peoples and their world, 1888-1915,’ in K.Sinclair, editor, Tasman relations: New Zealand and Australia, 1788-1988. Auckland, 1987, pp.52-70.
6
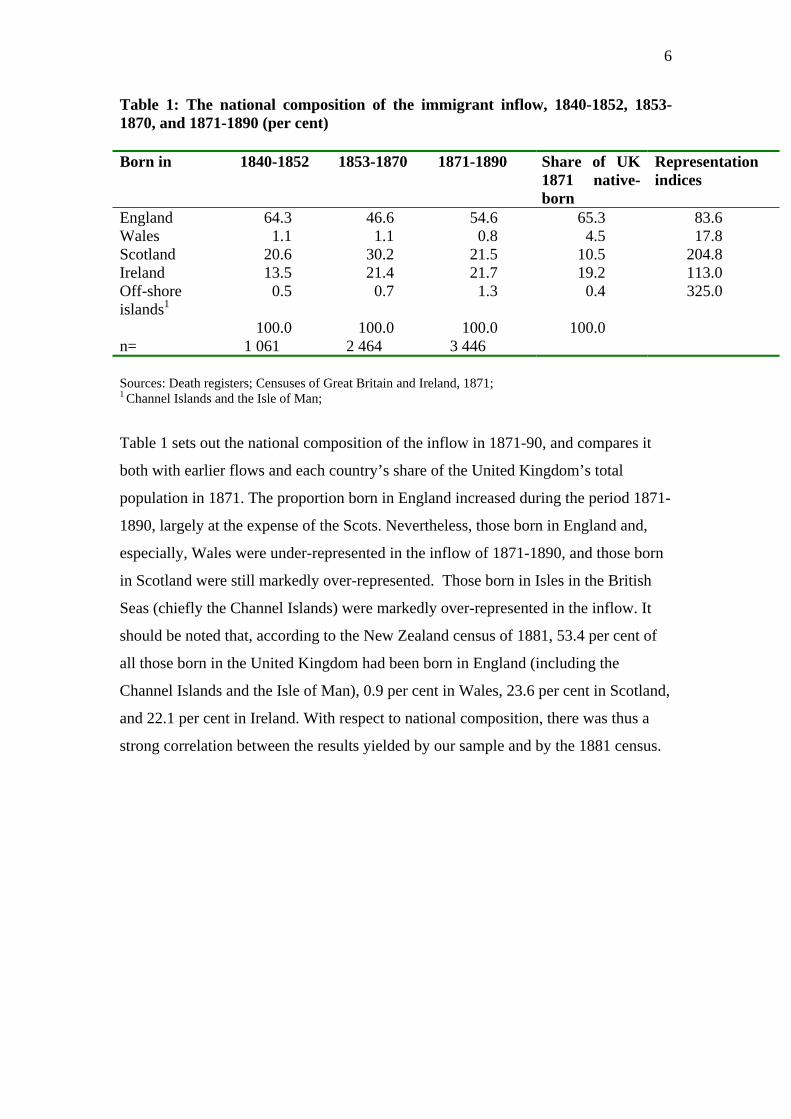
Table 1: The national composition of the immigrant inflow, 1840-1852, 1853-1870, and 1871-1890 (per cent) Born in 1840-1852 1853-1870 1871-1890 Share of UK
1871 native-born
Representation indices
England 64.3 46.6 54.6 65.3 83.6 Wales 1.1 1.1 0.8 4.5 17.8 Scotland 20.6 30.2 21.5 10.5 204.8 Ireland 13.5 21.4 21.7 19.2 113.0 Off-shore islands1
0.5 0.7 1.3 0.4 325.0
100.0 100.0 100.0 100.0 n= 1 061 2 464 3 446 Sources: Death registers; Censuses of Great Britain and Ireland, 1871; 1 Channel Islands and the Isle of Man;
Table 1 sets out the national composition of the inflow in 1871-90, and compares it
both with earlier flows and each country’s share of the United Kingdom’s total
population in 1871. The proportion born in England increased during the period 1871-
1890, largely at the expense of the Scots. Nevertheless, those born in England and,
especially, Wales were under-represented in the inflow of 1871-1890, and those born
in Scotland were still markedly over-represented. Those born in Isles in the British
Seas (chiefly the Channel Islands) were markedly over-represented in the inflow. It
should be noted that, according to the New Zealand census of 1881, 53.4 per cent of
all those born in the United Kingdom had been born in England (including the
Channel Islands and the Isle of Man), 0.9 per cent in Wales, 23.6 per cent in Scotland,
and 22.1 per cent in Ireland. With respect to national composition, there was thus a
strong correlation between the results yielded by our sample and by the 1881 census.
7
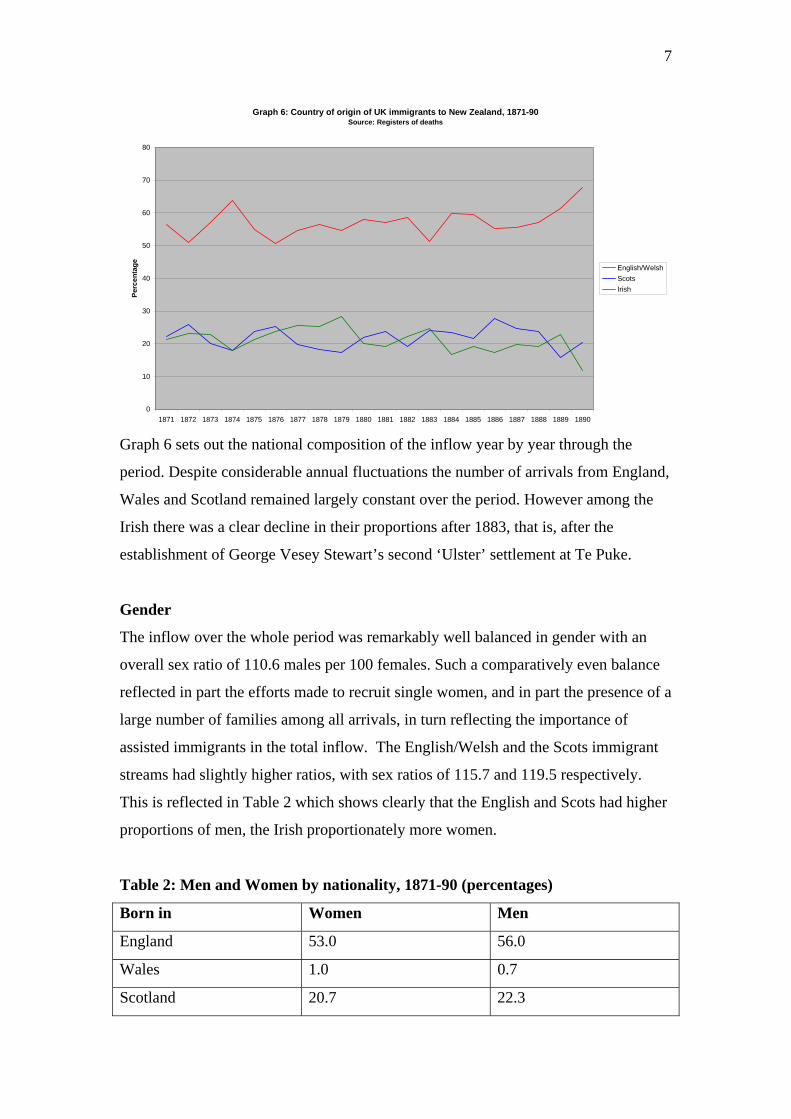
Graph 6: Country of origin of UK immigrants to New Zealand, 1871-90Source: Registers of deaths
0
10
20
30
40
50
60
70
80
1871 1872 1873 1874 1875 1876 1877 1878 1879 1880 1881 1882 1883 1884 1885 1886 1887 1888 1889 1890
Perc
enta
ge English/WelshScotsIrish
Graph 6 sets out the national composition of the inflow year by year through the
period. Despite considerable annual fluctuations the number of arrivals from England,
Wales and Scotland remained largely constant over the period. However among the
Irish there was a clear decline in their proportions after 1883, that is, after the
establishment of George Vesey Stewart’s second ‘Ulster’ settlement at Te Puke.
Gender
The inflow over the whole period was remarkably well balanced in gender with an
overall sex ratio of 110.6 males per 100 females. Such a comparatively even balance
reflected in part the efforts made to recruit single women, and in part the presence of a
large number of families among all arrivals, in turn reflecting the importance of
assisted immigrants in the total inflow. The English/Welsh and the Scots immigrant
streams had slightly higher ratios, with sex ratios of 115.7 and 119.5 respectively.
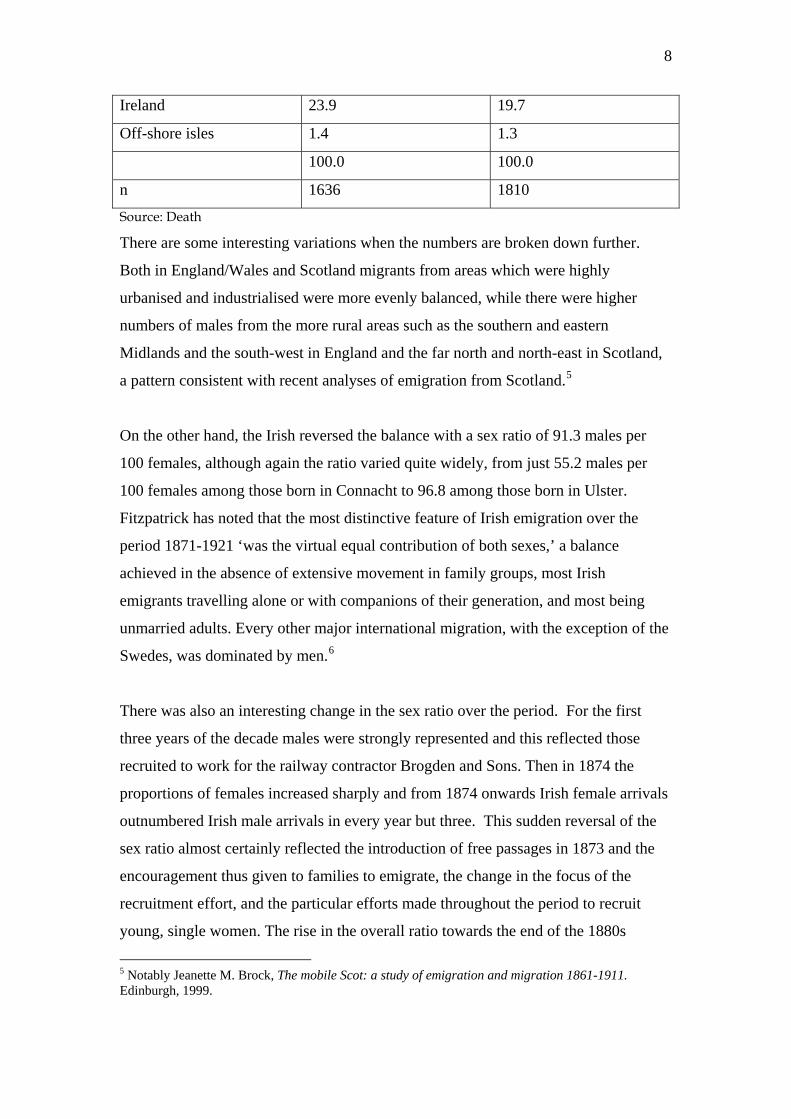
This is reflected in Table 2 which shows clearly that the English and Scots had higher
proportions of men, the Irish proportionately more women.
Table 2: Men and Women by nationality, 1871-90 (percentages)
Born in Women Men
England 53.0 56.0
Wales 1.0 0.7
Scotland 20.7 22.3
8
Ireland 23.9 19.7
Off-shore isles 1.4 1.3
100.0 100.0
n 1636 1810
Source: Death
There are some interesting variations when the numbers are broken down further.
Both in England/Wales and Scotland migrants from areas which were highly
urbanised and industrialised were more evenly balanced, while there were higher
numbers of males from the more rural areas such as the southern and eastern
Midlands and the south-west in England and the far north and north-east in Scotland,
a pattern consistent with recent analyses of emigration from Scotland.5
On the other hand, the Irish reversed the balance with a sex ratio of 91.3 males per
100 females, although again the ratio varied quite widely, from just 55.2 males per
100 females among those born in Connacht to 96.8 among those born in Ulster.
Fitzpatrick has noted that the most distinctive feature of Irish emigration over the
period 1871-1921 ‘was the virtual equal contribution of both sexes,’ a balance
achieved in the absence of extensive movement in family groups, most Irish
emigrants travelling alone or with companions of their generation, and most being
unmarried adults. Every other major international migration, with the exception of the
Swedes, was dominated by men.6
There was also an interesting change in the sex ratio over the period. For the first
three years of the decade males were strongly represented and this reflected those
recruited to work for the railway contractor Brogden and Sons. Then in 1874 the
proportions of females increased sharply and from 1874 onwards Irish female arrivals
outnumbered Irish male arrivals in every year but three. This sudden reversal of the
sex ratio almost certainly reflected the introduction of free passages in 1873 and the
encouragement thus given to families to emigrate, the change in the focus of the
recruitment effort, and the particular efforts made throughout the period to recruit
young, single women. The rise in the overall ratio towards the end of the 1880s
5 Notably Jeanette M. Brock, The mobile Scot: a study of emigration and migration 1861-1911. Edinburgh, 1999.
9
indicated a further change in the character of the immigrant inflow as assistance was
phased out, away from families towards single males.
Looking at those aged 20 or over, there was a sex ratio for the Scots of 136.7, among
the English and Welsh of 126.0, but among the Irish the ratio was almost even at
103.3. The overall ratio of those aged 20 or over was 122.6. Again the Irish figures
reflect the migration of large numbers of single adult Irish women. Within the age
groups, women were well represented among those aged 15-19 with a ratio of 89.2
males to 100 females; while in the next age group, 20-24 years, that imbalance was
sharply reversed, with 136.3 males per 100 females, the imbalance being marked in
the case of the English/Welsh and the Scots.
Ages
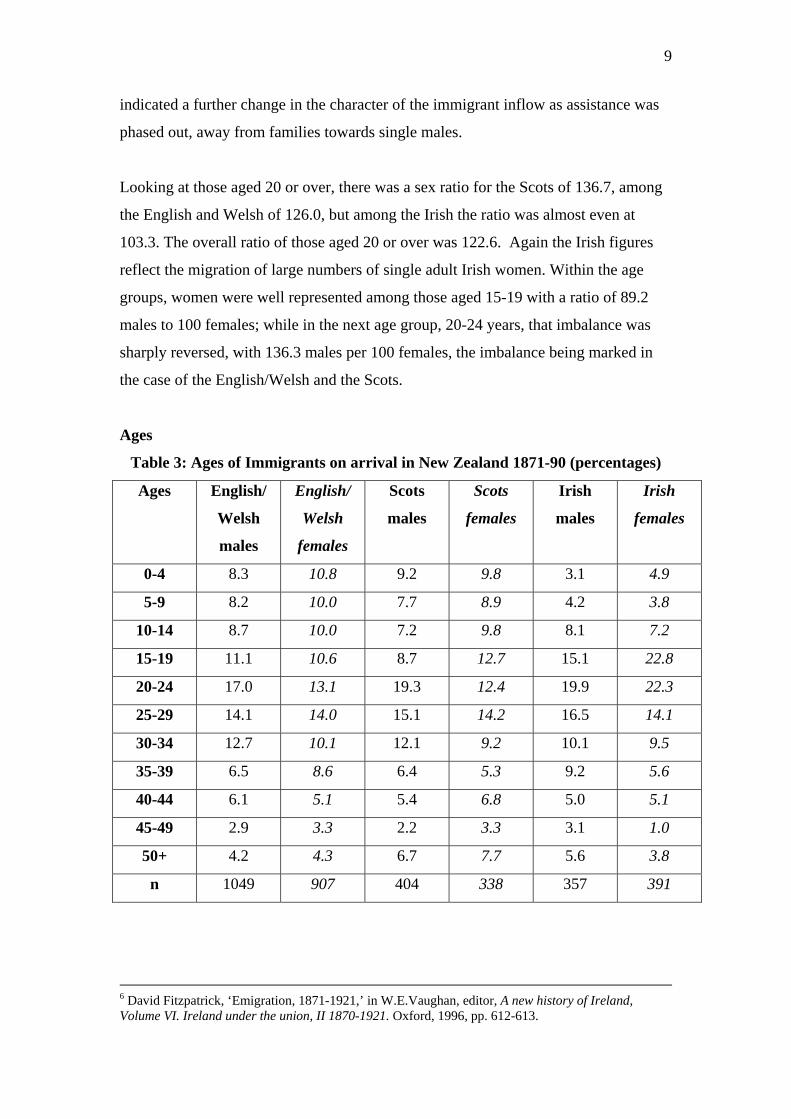
Table 3: Ages of Immigrants on arrival in New Zealand 1871-90 (percentages)
Ages English/
Welsh
males
English/
Welsh
females
Scots
males
Scots
females
Irish
males
Irish
females
0-4 8.3 10.8 9.2 9.8 3.1 4.9
5-9 8.2 10.0 7.7 8.9 4.2 3.8
10-14 8.7 10.0 7.2 9.8 8.1 7.2
15-19 11.1 10.6 8.7 12.7 15.1 22.8
20-24 17.0 13.1 19.3 12.4 19.9 22.3
25-29 14.1 14.0 15.1 14.2 16.5 14.1
30-34 12.7 10.1 12.1 9.2 10.1 9.5
35-39 6.5 8.6 6.4 5.3 9.2 5.6
40-44 6.1 5.1 5.4 6.8 5.0 5.1
45-49 2.9 3.3 2.2 3.3 3.1 1.0
50+ 4.2 4.3 6.7 7.7 5.6 3.8
n 1049 907 404 338 357 391
6 David Fitzpatrick, ‘Emigration, 1871-1921,’ in W.E.Vaughan, editor, A new history of Ireland, Volume VI. Ireland under the union, II 1870-1921. Oxford, 1996, pp. 612-613.
10
Ages English/
Welsh
males
English/
Welsh
females
Scots
males
Scots
females
Irish
males
Irish
females
0-14 25.2 30.8 24.0 28.4 15.4 15.9
15-24 28.0 23.7 28.0 25.1 35.0 45.0
25-34 26.8 24.1 27.2 23.4 26.6 23.5
35-44 12.7 13.7 11.9 12.1 14.3 10.7
45+ 7.1 7.6 8.9 10.9 8.7 4.9
Ave. age 24.1 23.1 24.6 24.4 26.2 23.7
n 1049 907 404 338 357 391
Ages All males All females All 0-14 23.0 26.8 24.8 15-24 29.4 29.1 29.3 25-34 26.9 23.8 25.4 35-44 12.8 12.7 12.7 45+ 8.0 7.6 7.8
average 24.6 23.5 24.1 n 1810 1636 3446
Source: Death registers
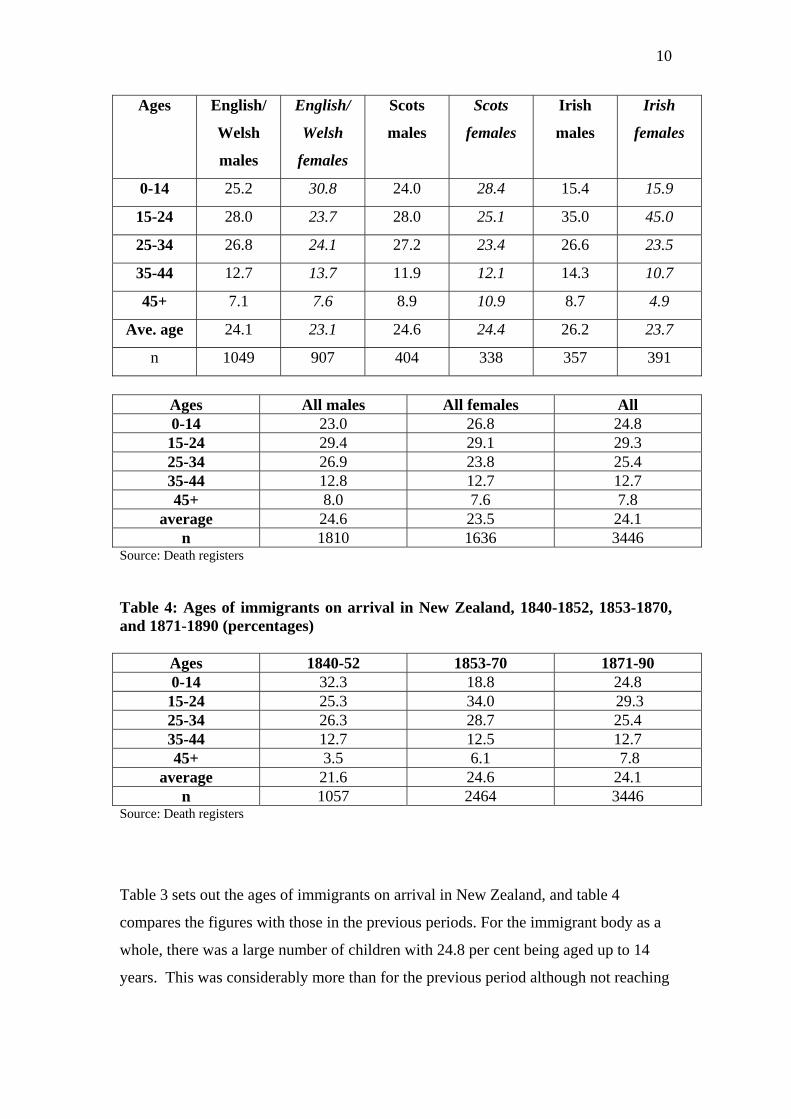
Table 4: Ages of immigrants on arrival in New Zealand, 1840-1852, 1853-1870, and 1871-1890 (percentages)
Ages 1840-52 1853-70 1871-90 0-14 32.3 18.8 24.8 15-24 25.3 34.0 29.3 25-34 26.3 28.7 25.4 35-44 12.7 12.5 12.7 45+ 3.5 6.1 7.8
average 21.6 24.6 24.1 n 1057 2464 3446
Source: Death registers
Table 3 sets out the ages of immigrants on arrival in New Zealand, and table 4
compares the figures with those in the previous periods. For the immigrant body as a
whole, there was a large number of children with 24.8 per cent being aged up to 14
years. This was considerably more than for the previous period although not reaching
11
the numbers of the 1840s. Such differences point to the influence which assisted
immigration programmes had in encouraging the migration of families with children.
For the period 1871-1890, those aged up to 34 years predominated in all three major
national groups with just a fifth of the entire immigrant body aged over 35 years. This
was slightly more than the previous period, but this may well be the result of the
sampling error created by the fact that full death registration did not begin until 1876.
But once again the low numbers above 35 point up how far migration was a young
people’s game. The pattern for the Irish was rather different from the other national
groups with a much smaller proportion (15.6 per cent) aged up to 14 years, and a
considerably larger proportion in the two age groups 15-19 and 20-24. This was
especially the case for the Irish women who clustered heavily in the 15-24 age group.
This reflected the deliberate effort to attract young unmarried Irish women as
domestic servants. The results for the Irish compare well with Fitzpatrick’s analysis
which indicated that over the period 1871-1921, emigration from Ireland was
concentrated in the 20-24 age group, that is by people who had entered the labour
market but not the marriage market and for whom emigration offered the promise of
employment followed by marriage.7
There were few major changes in age distribution through the period 1871-1890,
although during the years from 1881 to 1886 there was a marked increase in the
proportion aged up to 14 years, an increase which coincided with the foundation of
George Vesey Stewart’s Te Puke settlement, and with the re-introduction of the
nominated immigration programme in June 1881 with its provisions for the re-
unification of families and assistance for extended family members. During the
second half of the 1880s, as assistance contracted, the proportion aged up to 15 years
reverted to pre-1881 levels, while adults in the age range 15 to 24 years increased
their share of the inflow.
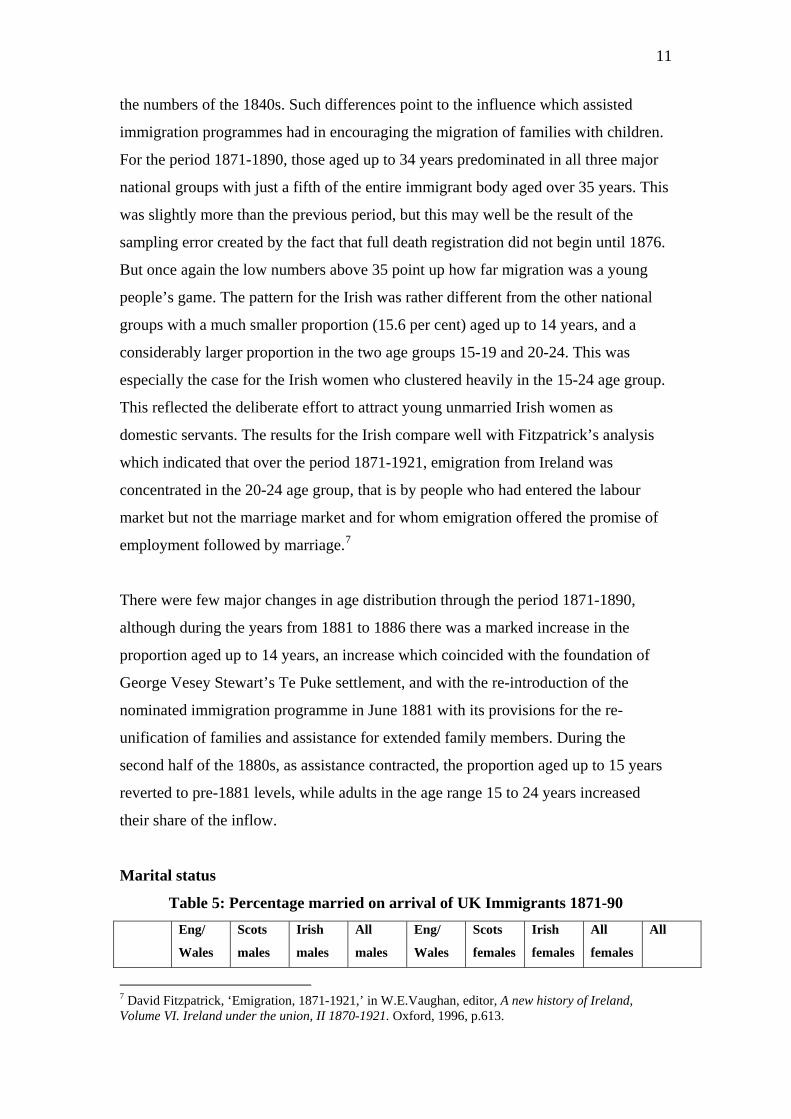
Marital status
Table 5: Percentage married on arrival of UK Immigrants 1871-90
Eng/
Wales
Scots
males
Irish
males
All
males
Eng/
Wales
Scots
females
Irish
females
All
females
All
7 David Fitzpatrick, ‘Emigration, 1871-1921,’ in W.E.Vaughan, editor, A new history of Ireland, Volume VI. Ireland under the union, II 1870-1921. Oxford, 1996, p.613.
12
males females
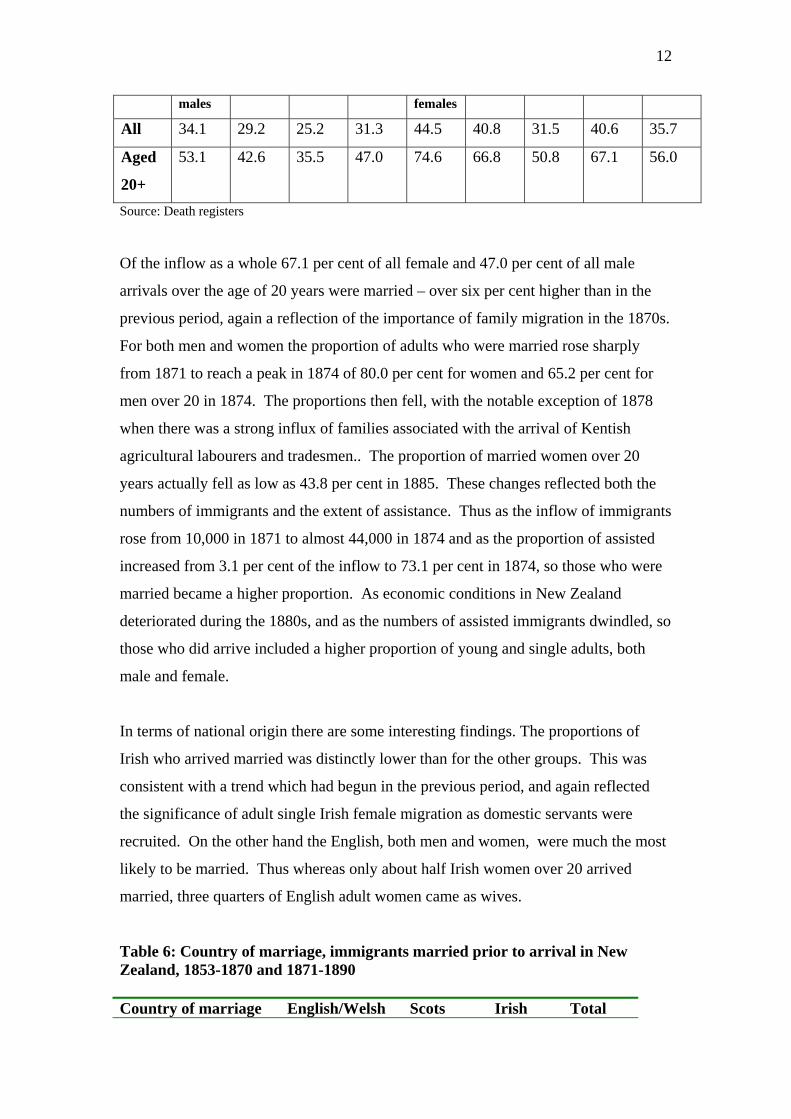
All 34.1 29.2 25.2 31.3 44.5 40.8 31.5 40.6 35.7
Aged
20+
53.1 42.6 35.5 47.0 74.6 66.8 50.8 67.1 56.0
Source: Death registers
Of the inflow as a whole 67.1 per cent of all female and 47.0 per cent of all male
arrivals over the age of 20 years were married – over six per cent higher than in the
previous period, again a reflection of the importance of family migration in the 1870s.
For both men and women the proportion of adults who were married rose sharply
from 1871 to reach a peak in 1874 of 80.0 per cent for women and 65.2 per cent for
men over 20 in 1874. The proportions then fell, with the notable exception of 1878
when there was a strong influx of families associated with the arrival of Kentish
agricultural labourers and tradesmen.. The proportion of married women over 20
years actually fell as low as 43.8 per cent in 1885. These changes reflected both the
numbers of immigrants and the extent of assistance. Thus as the inflow of immigrants
rose from 10,000 in 1871 to almost 44,000 in 1874 and as the proportion of assisted
increased from 3.1 per cent of the inflow to 73.1 per cent in 1874, so those who were
married became a higher proportion. As economic conditions in New Zealand
deteriorated during the 1880s, and as the numbers of assisted immigrants dwindled, so
those who did arrive included a higher proportion of young and single adults, both
male and female.
In terms of national origin there are some interesting findings. The proportions of
Irish who arrived married was distinctly lower than for the other groups. This was
consistent with a trend which had begun in the previous period, and again reflected
the significance of adult single Irish female migration as domestic servants were
recruited. On the other hand the English, both men and women, were much the most
likely to be married. Thus whereas only about half Irish women over 20 arrived
married, three quarters of English adult women came as wives.
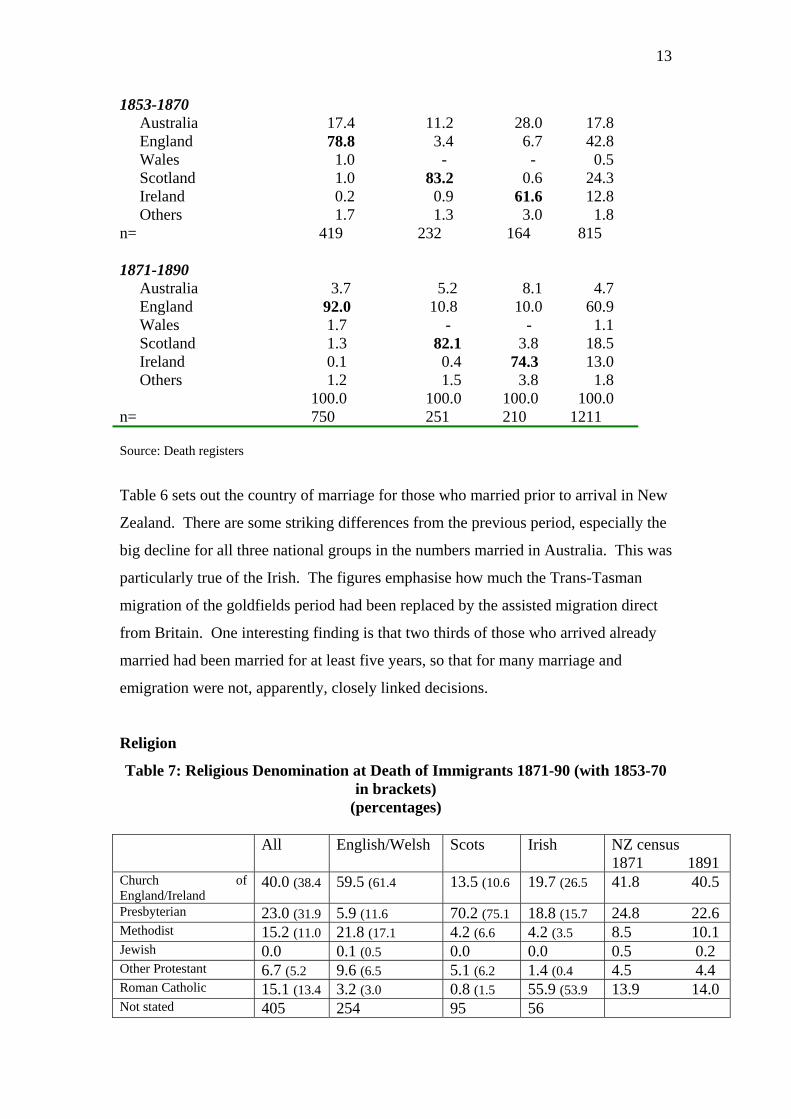
Table 6: Country of marriage, immigrants married prior to arrival in New Zealand, 1853-1870 and 1871-1890 Country of marriage English/Welsh Scots Irish Total
13
1853-1870 Australia 17.4 11.2 28.0 17.8 England 78.8 3.4 6.7 42.8 Wales 1.0 - - 0.5 Scotland 1.0 83.2 0.6 24.3 Ireland 0.2 0.9 61.6 12.8 Others 1.7 1.3 3.0 1.8 n= 419 232 164 815 1871-1890 Australia 3.7 5.2 8.1 4.7 England 92.0 10.8 10.0 60.9 Wales 1.7 - - 1.1 Scotland 1.3 82.1 3.8 18.5 Ireland 0.1 0.4 74.3 13.0 Others 1.2 1.5 3.8 1.8 100.0 100.0 100.0 100.0 n= 750 251 210 1211 Source: Death registers
Table 6 sets out the country of marriage for those who married prior to arrival in New
Zealand. There are some striking differences from the previous period, especially the
big decline for all three national groups in the numbers married in Australia. This was
particularly true of the Irish. The figures emphasise how much the Trans-Tasman
migration of the goldfields period had been replaced by the assisted migration direct
from Britain. One interesting finding is that two thirds of those who arrived already
married had been married for at least five years, so that for many marriage and
emigration were not, apparently, closely linked decisions.
Religion
Table 7: Religious Denomination at Death of Immigrants 1871-90 (with 1853-70 in brackets)
(percentages) All English/Welsh Scots Irish NZ census
1871 1891 Church of England/Ireland
40.0 (38.4 59.5 (61.4 13.5 (10.6 19.7 (26.5 41.8 40.5
Presbyterian 23.0 (31.9 5.9 (11.6 70.2 (75.1 18.8 (15.7 24.8 22.6 Methodist 15.2 (11.0 21.8 (17.1 4.2 (6.6 4.2 (3.5 8.5 10.1 Jewish 0.0 0.1 (0.5 0.0 0.0 0.5 0.2 Other Protestant 6.7 (5.2 9.6 (6.5 5.1 (6.2 1.4 (0.4 4.5 4.4 Roman Catholic 15.1 (13.4 3.2 (3.0 0.8 (1.5 55.9 (53.9 13.9 14.0 Not stated 405 254 95 56
14
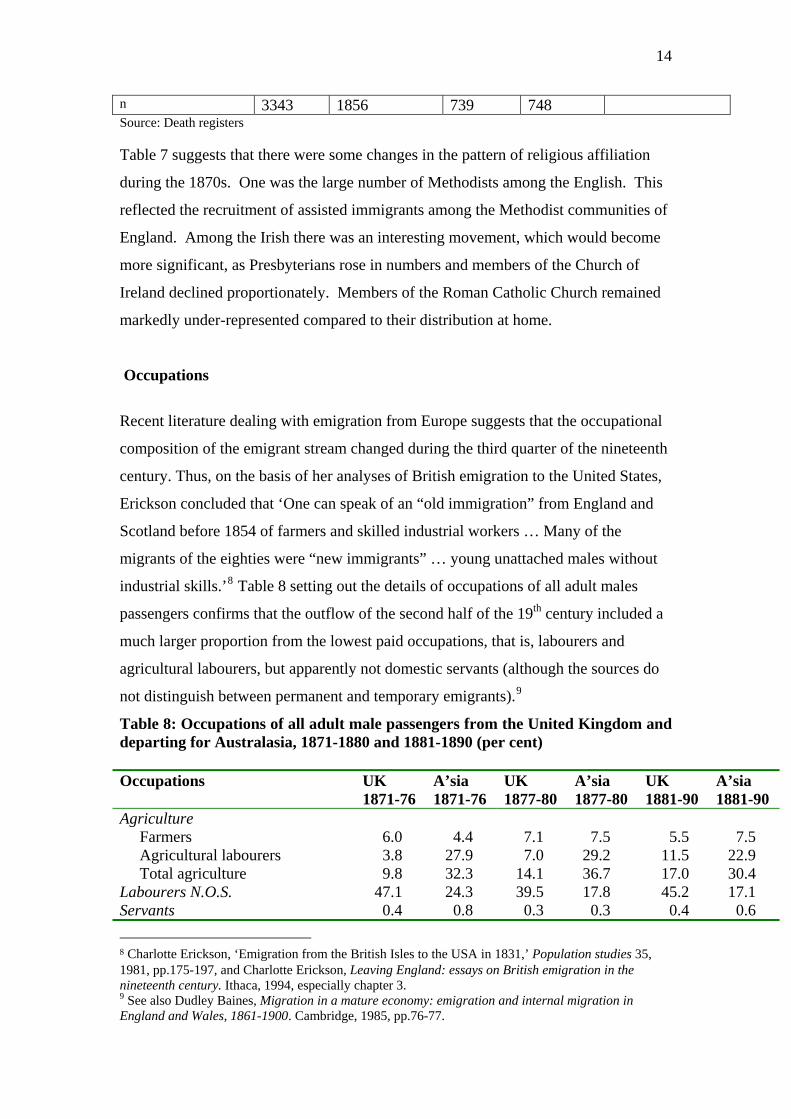
n 3343 1856 739 748 Source: Death registers Table 7 suggests that there were some changes in the pattern of religious affiliation
during the 1870s. One was the large number of Methodists among the English. This
reflected the recruitment of assisted immigrants among the Methodist communities of
England. Among the Irish there was an interesting movement, which would become
more significant, as Presbyterians rose in numbers and members of the Church of
Ireland declined proportionately. Members of the Roman Catholic Church remained
markedly under-represented compared to their distribution at home.
Occupations
Recent literature dealing with emigration from Europe suggests that the occupational
composition of the emigrant stream changed during the third quarter of the nineteenth
century. Thus, on the basis of her analyses of British emigration to the United States,
Erickson concluded that ‘One can speak of an “old immigration” from England and
Scotland before 1854 of farmers and skilled industrial workers … Many of the
migrants of the eighties were “new immigrants” … young unattached males without
industrial skills.’8 Table 8 setting out the details of occupations of all adult males
passengers confirms that the outflow of the second half of the 19th century included a
much larger proportion from the lowest paid occupations, that is, labourers and
agricultural labourers, but apparently not domestic servants (although the sources do
not distinguish between permanent and temporary emigrants).9
Table 8: Occupations of all adult male passengers from the United Kingdom and departing for Australasia, 1871-1880 and 1881-1890 (per cent) Occupations UK
1871-76 A’sia 1871-76
UK 1877-80
A’sia 1877-80
UK 1881-90
A’sia 1881-90
Agriculture Farmers 6.0 4.4 7.1 7.5 5.5 7.5 Agricultural labourers 3.8 27.9 7.0 29.2 11.5 22.9 Total agriculture 9.8 32.3 14.1 36.7 17.0 30.4 Labourers N.O.S. 47.1 24.3 39.5 17.8 45.2 17.1 Servants 0.4 0.8 0.3 0.3 0.4 0.6
8 Charlotte Erickson, ‘Emigration from the British Isles to the USA in 1831,’ Population studies 35, 1981, pp.175-197, and Charlotte Erickson, Leaving England: essays on British emigration in the nineteenth century. Ithaca, 1994, especially chapter 3. 9 See also Dudley Baines, Migration in a mature economy: emigration and internal migration in England and Wales, 1861-1900. Cambridge, 1985, pp.76-77.
15
Occupations with relatively little technical change
Building 4.5 7.4 4.6 8.2 4.5 10.1 Mining 4.0 4.8 3.6 2.7 4.1 3.6 Other pre-industrial 2.9 7.5 3.7 8.3 3.8 11.0 Total pre-industrial 11.4 19.7 11.9 19.2 12.4 24.7 Occupations with relatively great technical change
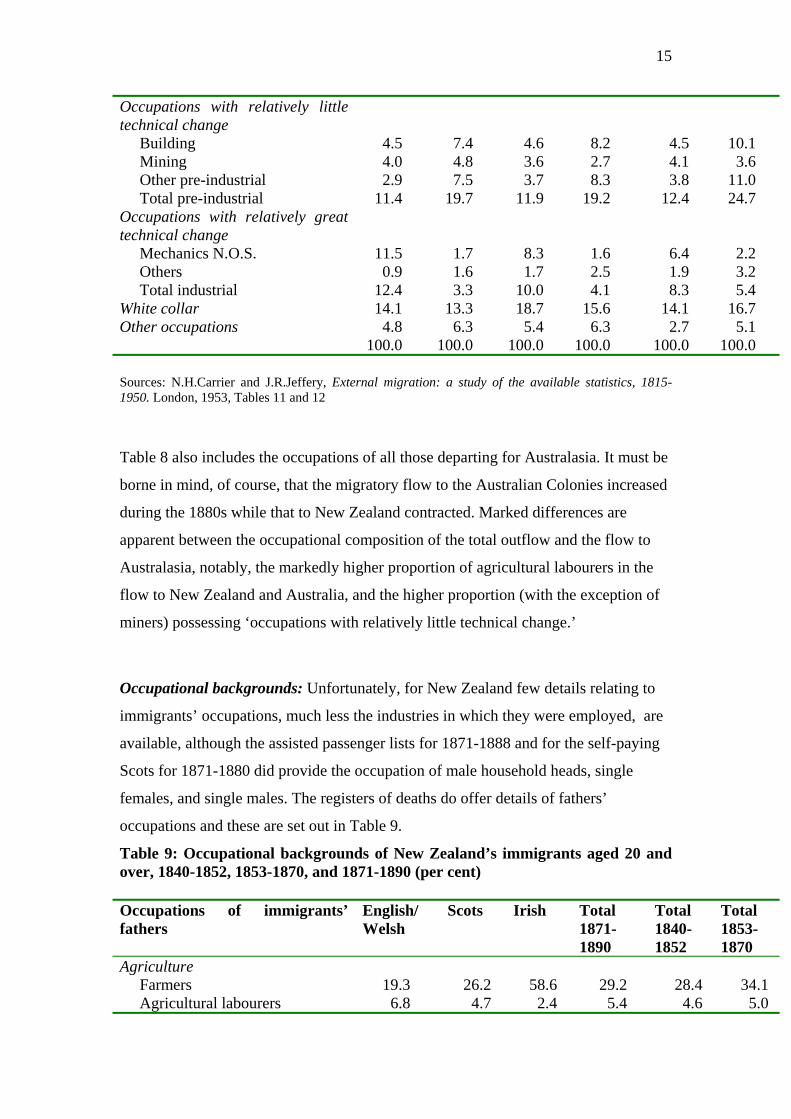
Mechanics N.O.S. 11.5 1.7 8.3 1.6 6.4 2.2 Others 0.9 1.6 1.7 2.5 1.9 3.2 Total industrial 12.4 3.3 10.0 4.1 8.3 5.4 White collar 14.1 13.3 18.7 15.6 14.1 16.7 Other occupations 4.8 6.3 5.4 6.3 2.7 5.1 100.0 100.0 100.0 100.0 100.0 100.0 Sources: N.H.Carrier and J.R.Jeffery, External migration: a study of the available statistics, 1815-1950. London, 1953, Tables 11 and 12
Table 8 also includes the occupations of all those departing for Australasia. It must be
borne in mind, of course, that the migratory flow to the Australian Colonies increased
during the 1880s while that to New Zealand contracted. Marked differences are
apparent between the occupational composition of the total outflow and the flow to
Australasia, notably, the markedly higher proportion of agricultural labourers in the
flow to New Zealand and Australia, and the higher proportion (with the exception of
miners) possessing ‘occupations with relatively little technical change.’
Occupational backgrounds: Unfortunately, for New Zealand few details relating to
immigrants’ occupations, much less the industries in which they were employed, are
available, although the assisted passenger lists for 1871-1888 and for the self-paying
Scots for 1871-1880 did provide the occupation of male household heads, single
females, and single males. The registers of deaths do offer details of fathers’
occupations and these are set out in Table 9.
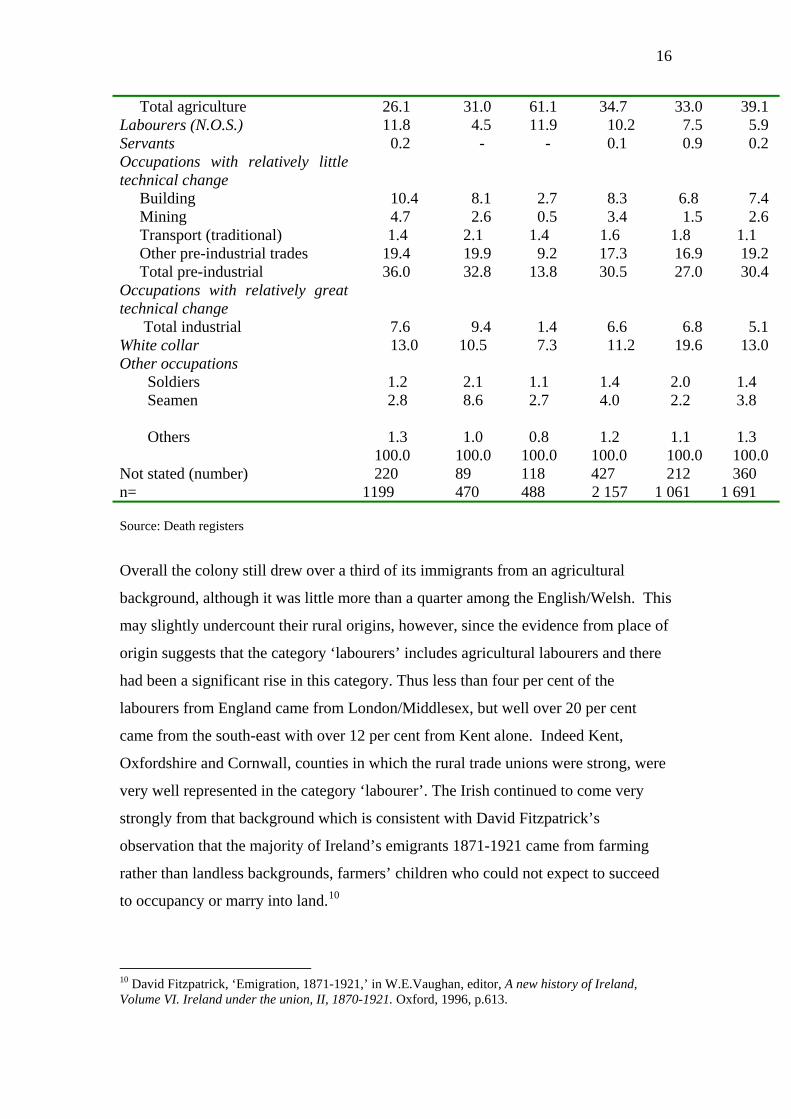
Table 9: Occupational backgrounds of New Zealand’s immigrants aged 20 and over, 1840-1852, 1853-1870, and 1871-1890 (per cent) Occupations of immigrants’ fathers
English/Welsh
Scots Irish Total 1871-1890
Total 1840-1852
Total 1853-1870
Agriculture Farmers 19.3 26.2 58.6 29.2 28.4 34.1 Agricultural labourers 6.8 4.7 2.4 5.4 4.6 5.0
16
Total agriculture 26.1 31.0 61.1 34.7 33.0 39.1 Labourers (N.O.S.) 11.8 4.5 11.9 10.2 7.5 5.9 Servants 0.2 - - 0.1 0.9 0.2 Occupations with relatively little technical change
Building 10.4 8.1 2.7 8.3 6.8 7.4 Mining 4.7 2.6 0.5 3.4 1.5 2.6 Transport (traditional) 1.4 2.1 1.4 1.6 1.8 1.1 Other pre-industrial trades 19.4 19.9 9.2 17.3 16.9 19.2 Total pre-industrial 36.0 32.8 13.8 30.5 27.0 30.4 Occupations with relatively great technical change
Total industrial 7.6 9.4 1.4 6.6 6.8 5.1 White collar 13.0 10.5 7.3 11.2 19.6 13.0 Other occupations Soldiers 1.2 2.1 1.1 1.4 2.0 1.4 Seamen
2.8 8.6 2.7 4.0 2.2 3.8
Others 1.3 1.0 0.8 1.2 1.1 1.3 100.0 100.0 100.0 100.0 100.0 100.0 Not stated (number) 220 89 118 427 212 360 n= 1199 470 488 2 157 1 061 1 691 Source: Death registers
Overall the colony still drew over a third of its immigrants from an agricultural
background, although it was little more than a quarter among the English/Welsh. This
may slightly undercount their rural origins, however, since the evidence from place of
origin suggests that the category ‘labourers’ includes agricultural labourers and there
had been a significant rise in this category. Thus less than four per cent of the
labourers from England came from London/Middlesex, but well over 20 per cent
came from the south-east with over 12 per cent from Kent alone. Indeed Kent,
Oxfordshire and Cornwall, counties in which the rural trade unions were strong, were
very well represented in the category ‘labourer’. The Irish continued to come very
strongly from that background which is consistent with David Fitzpatrick’s
observation that the majority of Ireland’s emigrants 1871-1921 came from farming
rather than landless backgrounds, farmers’ children who could not expect to succeed
to occupancy or marry into land.10
10 David Fitzpatrick, ‘Emigration, 1871-1921,’ in W.E.Vaughan, editor, A new history of Ireland, Volume VI. Ireland under the union, II, 1870-1921. Oxford, 1996, p.613.
17
As in previous periods those drawn from pre-industrial backgrounds were still highly
significant (over a quarter of the immigrants’ fathers). The significant numbers from
the pre-industrial trades among the English and the Scots included boot-makers,
blacksmiths, millers, tailors, bakers and brewers. Those whose fathers had been
engaged in industrial occupations increased slightly from the previous period, and the
numbers were highest among the Scots, mostly weavers and engineers. But the
proportions remain very low – about 1 in 15 immigrant fathers. The numbers drawn
from a white collar background continued to decline, suggesting that compared with
the immigrants of the 1840s, those thirty years later included fewer from the
‘respectable’ professions. The only other point worth noting was an increase (from
5.5 per cent in 1853-70 to 8.6 per cent in this period) in the proportions of Scots
whose fathers had been fishermen and seamen. This in part reflected a surge in
arrivals from the Shetland Isles.
In general terms, Table 9 confirms that throughout the whole period 1840-1890 New
Zealand drew its British immigrants predominantly from agricultural and pre-
industrial backgrounds. However there were some subtle and suggestive changes
during the 1870s and 80s. After the peak year of migration and assistance in 1874 the
proportions of those whose fathers had been labourers and agricultural labourers
declined, while the numbers from ‘farmer’ and white collar backgrounds increased.
Almost certainly this indicates the temporary effect which the ‘Revolt of the Field’
had in encouraging the migration of agricultural labourers.
There were also some interesting regional variations with respect to occupational
background. Among the English and Welsh over half (53.8 per cent) of those with an
agricultural background came from three regions, the south-east, the east and the
south-west. Those with fathers as miners were drawn overwhelmingly from the
Cornwall (72.7 per cent); while London-Middlesex, and to a lesser extent the
metropolitan counties of the south-east provided many of those whose fathers were
builders and a good number of those from a white collar background ( 28.8 per cent
came from London-Middlesex).
In general it seems clear that New Zealand attracted those its economy most required.
Labourers to build the railways, roads, and ports, settlers to establish new farms,
18
agricultural labourers to harvest its crops, builders to erect houses and commercial
buildings in its rapidly growing urban centres, and miners to extract the coal required
by a rapidly growing rail system, steamships, and new factories (notably in food
processing), all featured prominently amongst the arrivals of the period 1871-1890.
But also among the arrivals were the white collar workers, including independent
professionals, increasingly required by the pastoral-commercial economy emerging in
the colony. In general, the occupational character of the flow to New Zealand sharply
differentiated it from the flow to other New World destinations, in particular that to
the United States of America.
Regional Origins: the English/Welsh immigrants, 1871-90
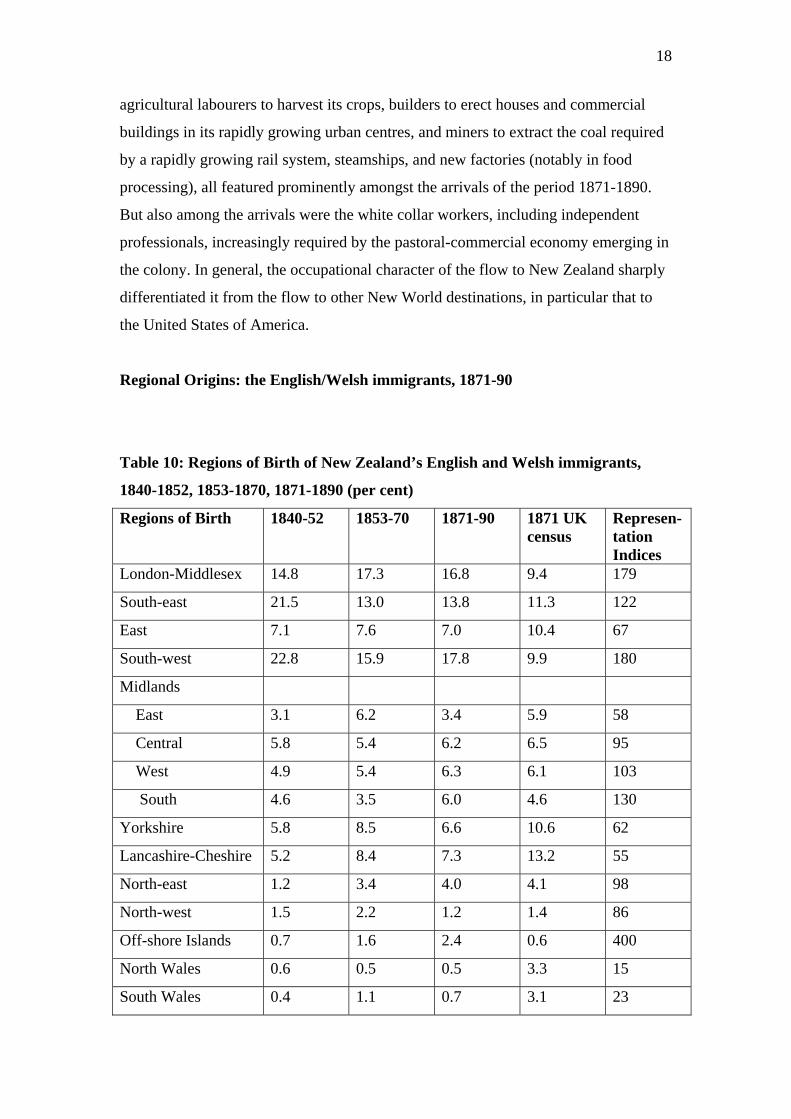
Table 10: Regions of Birth of New Zealand’s English and Welsh immigrants,
1840-1852, 1853-1870, 1871-1890 (per cent)
Regions of Birth 1840-52 1853-70 1871-90 1871 UK census
Represen- tation Indices
London-Middlesex 14.8 17.3 16.8 9.4 179
South-east 21.5 13.0 13.8 11.3 122
East 7.1 7.6 7.0 10.4 67
South-west 22.8 15.9 17.8 9.9 180
Midlands
East 3.1 6.2 3.4 5.9 58
Central 5.8 5.4 6.2 6.5 95
West 4.9 5.4 6.3 6.1 103
South 4.6 3.5 6.0 4.6 130
Yorkshire 5.8 8.5 6.6 10.6 62
Lancashire-Cheshire 5.2 8.4 7.3 13.2 55
North-east 1.2 3.4 4.0 4.1 98
North-west 1.5 2.2 1.2 1.4 86
Off-shore Islands 0.7 1.6 2.4 0.6 400
North Wales 0.6 0.5 0.5 3.3 15
South Wales 0.4 1.1 0.7 3.1 23
19
100.0 100.0 100.0 100.0
Not stated 25 35 76
N= 698 1192 1956
Source: Death registers; Census of England and Wales, 1871
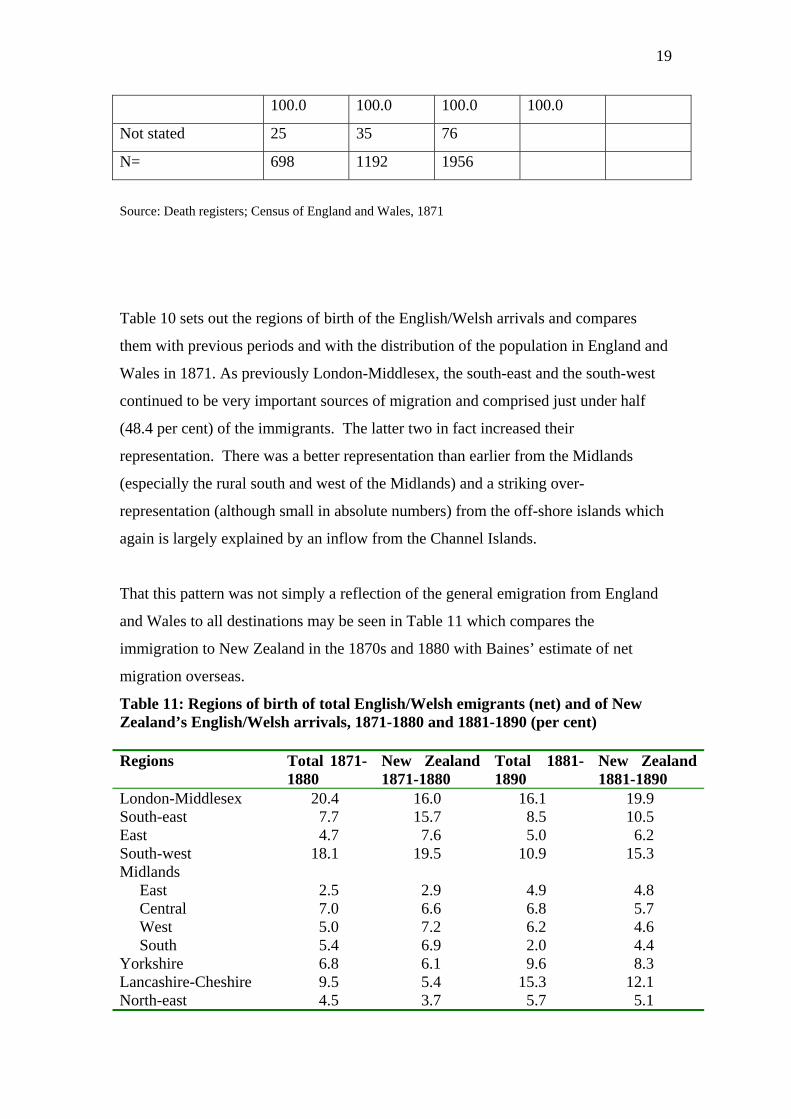
Table 10 sets out the regions of birth of the English/Welsh arrivals and compares
them with previous periods and with the distribution of the population in England and
Wales in 1871. As previously London-Middlesex, the south-east and the south-west
continued to be very important sources of migration and comprised just under half
(48.4 per cent) of the immigrants. The latter two in fact increased their
representation. There was a better representation than earlier from the Midlands
(especially the rural south and west of the Midlands) and a striking over-
representation (although small in absolute numbers) from the off-shore islands which
again is largely explained by an inflow from the Channel Islands.
That this pattern was not simply a reflection of the general emigration from England
and Wales to all destinations may be seen in Table 11 which compares the
immigration to New Zealand in the 1870s and 1880 with Baines’ estimate of net
migration overseas.
Table 11: Regions of birth of total English/Welsh emigrants (net) and of New Zealand’s English/Welsh arrivals, 1871-1880 and 1881-1890 (per cent) Regions Total 1871-
1880 New Zealand 1871-1880
Total 1881-1890
New Zealand 1881-1890
London-Middlesex 20.4 16.0 16.1 19.9 South-east 7.7 15.7 8.5 10.5 East 4.7 7.6 5.0 6.2 South-west 18.1 19.5 10.9 15.3 Midlands East 2.5 2.9 4.9 4.8 Central 7.0 6.6 6.8 5.7 West 5.0 7.2 6.2 4.6 South 5.4 6.9 2.0 4.4 Yorkshire 6.8 6.1 9.6 8.3 Lancashire-Cheshire 9.5 5.4 15.3 12.1 North-east 4.5 3.7 5.7 5.1
20
North-west 1.2 1.0 1.8 1.8 North Wales 1.9 0.6 3.7 0.5 South Wales 5.2 0.7 3.6 0.7 n= 521 600 1 271 842 300 563 Sources: Dudley Baines, Migration in a mature economy: emigration and internal migration in England and Wales, 1861-1900. Cambridge, 1985, Appendix 1; and Death registers. Note that Baines’s estimates do not include Isles in British Seas and hence the estimates for New Zealand have been adjusted accordingly.
This table shows that by comparison with the general flight to overseas destinations
those who arrived in New Zealand were significantly more likely to be from the
south-east and the south-west and also attracted disproportionate numbers from the
east and south Midlands. However the table also suggests that there were some
interesting changes in the wind. If we compare the regional distribution of
immigrants to New Zealand in the 1870s with the much reduced flow of the 1880s,
we note that there was a significant decline in those coming from the traditional
sources of the south-east and south-west (35.2 per cent of the total declined to 25.8);
while there were intriguing increases from the northern areas – Yorkshire, the north-
east, north-west and Lancashire-Cheshire whose collective proportions rose from 16.2
per cent to 27.3 per cent. This was an indication of changes that would become
stronger in the 1890s. These changes paralleled what was happening at the time with
the much larger migration to Australia. Jupp noted that the immigrant wave of the
1880s, ‘contained no convicts, it was less Irish, and it was more likely to come from
Northern England and central Scotland. It included coal miners and factory workers,
although public policy still favoured agricultural labourers and female domestic
servants.’11 From 1877 to 1887 migrants from northern England made up 20 per cent
of New South Wales’ assisted migrants, while Queensland drew large numbers from
Lancashire in 1883 and 1884, Yorkshire in 1884 and 1885, and Durham in 1885.
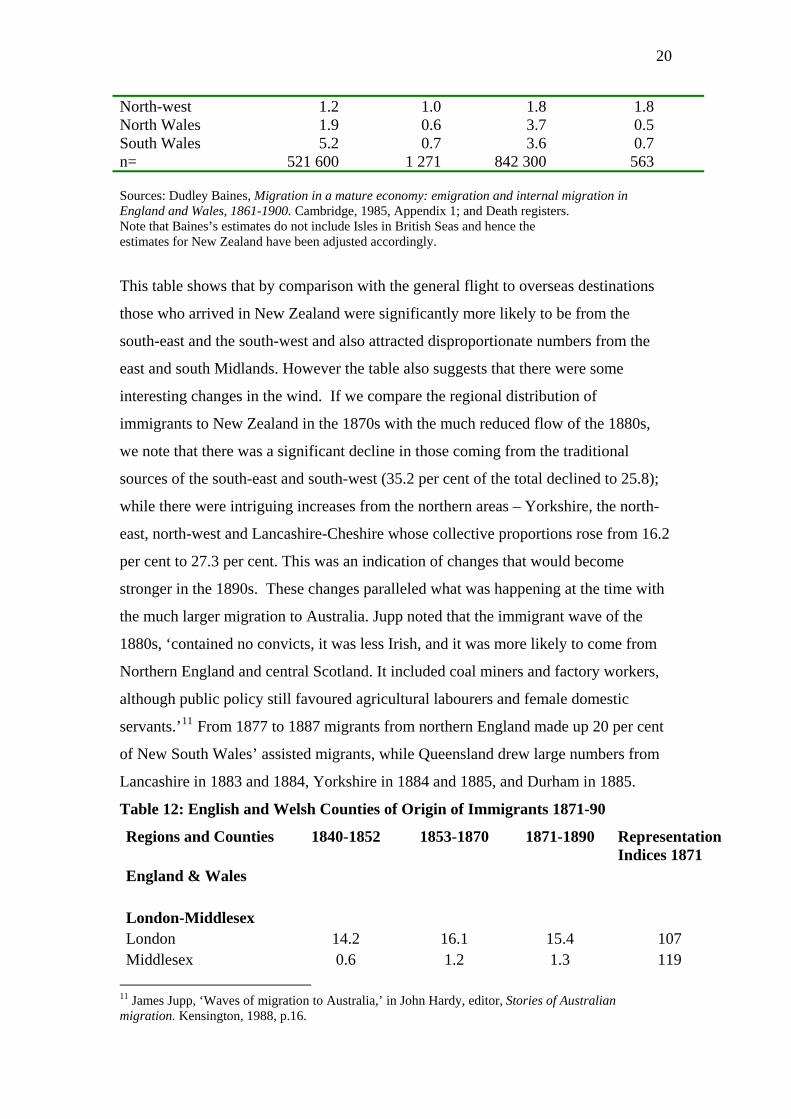
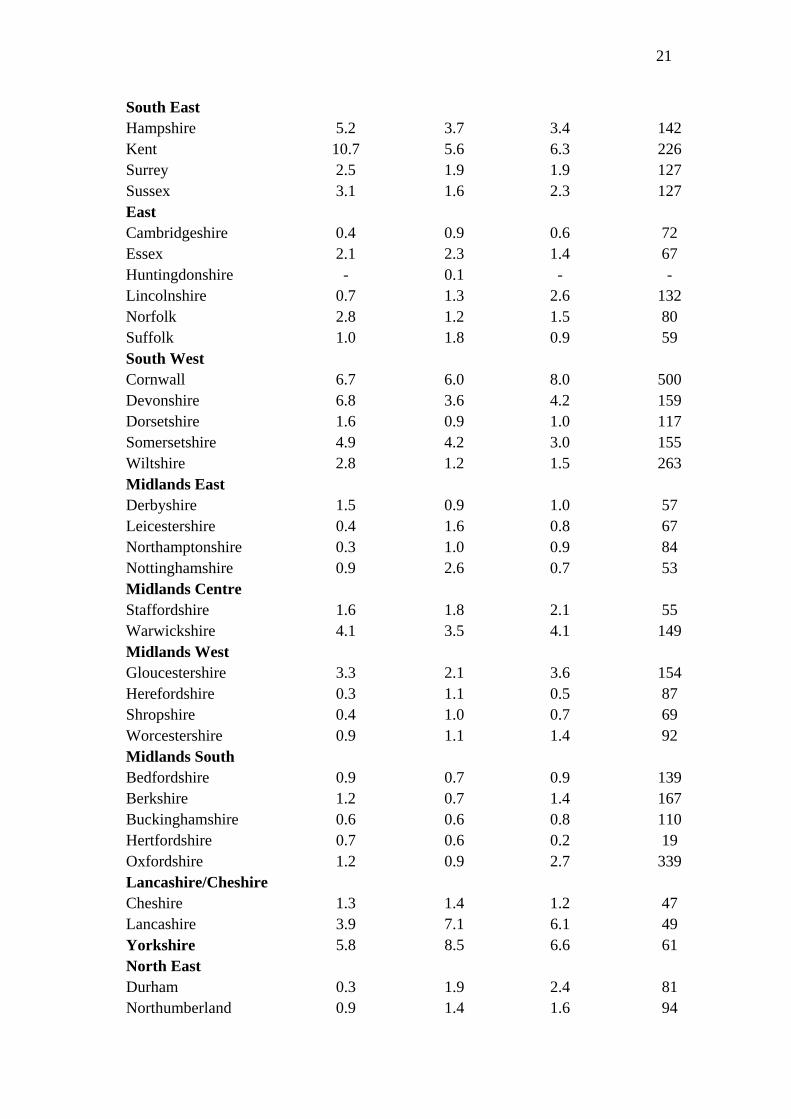
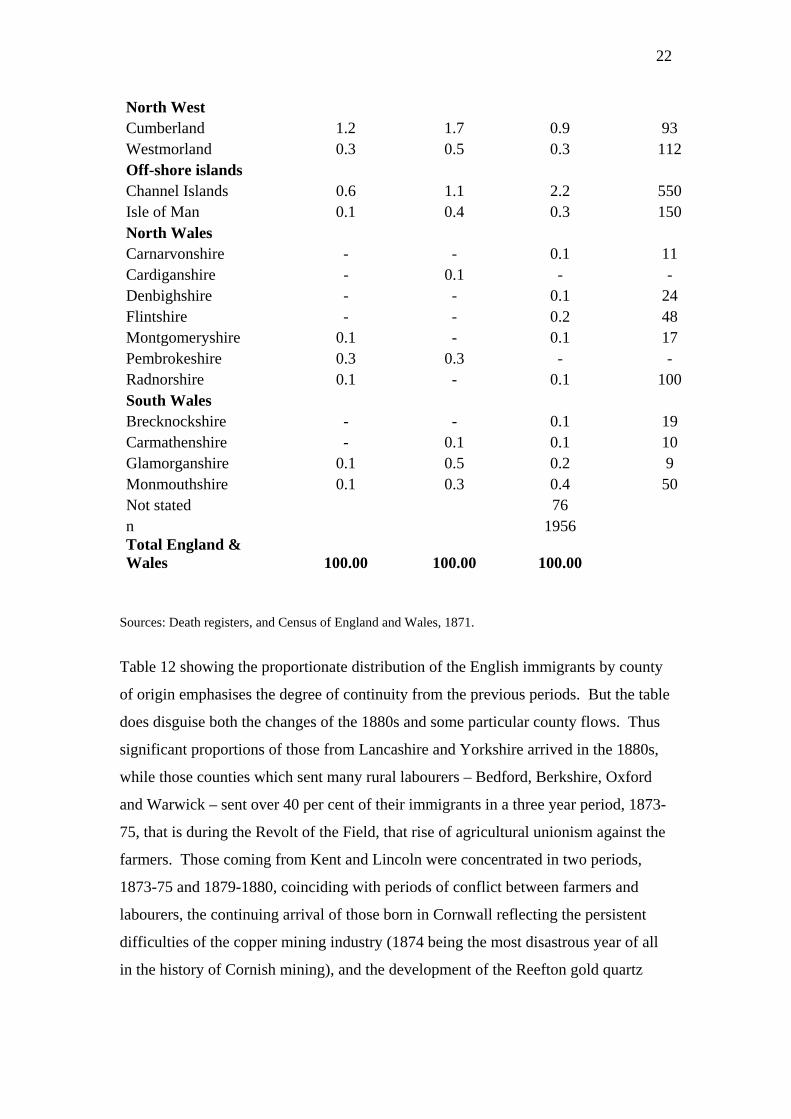
Table 12: English and Welsh Counties of Origin of Immigrants 1871-90
Regions and Counties
1840-1852
1853-1870
1871-1890
Representation Indices 1871
England & Wales London-Middlesex London 14.2 16.1 15.4 107 Middlesex 0.6 1.2 1.3 119
11 James Jupp, ‘Waves of migration to Australia,’ in John Hardy, editor, Stories of Australian migration. Kensington, 1988, p.16.
21
South East Hampshire 5.2 3.7 3.4 142 Kent 10.7 5.6 6.3 226 Surrey 2.5 1.9 1.9 127 Sussex 3.1 1.6 2.3 127 East Cambridgeshire 0.4 0.9 0.6 72 Essex 2.1 2.3 1.4 67 Huntingdonshire - 0.1 - - Lincolnshire 0.7 1.3 2.6 132 Norfolk 2.8 1.2 1.5 80 Suffolk 1.0 1.8 0.9 59 South West Cornwall 6.7 6.0 8.0 500 Devonshire 6.8 3.6 4.2 159 Dorsetshire 1.6 0.9 1.0 117 Somersetshire 4.9 4.2 3.0 155 Wiltshire 2.8 1.2 1.5 263 Midlands East Derbyshire 1.5 0.9 1.0 57 Leicestershire 0.4 1.6 0.8 67 Northamptonshire 0.3 1.0 0.9 84 Nottinghamshire 0.9 2.6 0.7 53 Midlands Centre Staffordshire 1.6 1.8 2.1 55 Warwickshire 4.1 3.5 4.1 149 Midlands West Gloucestershire 3.3 2.1 3.6 154 Herefordshire 0.3 1.1 0.5 87 Shropshire 0.4 1.0 0.7 69 Worcestershire 0.9 1.1 1.4 92 Midlands South Bedfordshire 0.9 0.7 0.9 139 Berkshire 1.2 0.7 1.4 167 Buckinghamshire 0.6 0.6 0.8 110 Hertfordshire 0.7 0.6 0.2 19 Oxfordshire 1.2 0.9 2.7 339 Lancashire/Cheshire Cheshire 1.3 1.4 1.2 47 Lancashire 3.9 7.1 6.1 49 Yorkshire 5.8 8.5 6.6 61 North East Durham 0.3 1.9 2.4 81 Northumberland 0.9 1.4 1.6 94
22
North West Cumberland 1.2 1.7 0.9 93 Westmorland 0.3 0.5 0.3 112 Off-shore islands Channel Islands 0.6 1.1 2.2 550 Isle of Man 0.1 0.4 0.3 150 North Wales Carnarvonshire - - 0.1 11 Cardiganshire - 0.1 - - Denbighshire - - 0.1 24 Flintshire - - 0.2 48 Montgomeryshire 0.1 - 0.1 17 Pembrokeshire 0.3 0.3 - - Radnorshire 0.1 - 0.1 100 South Wales Brecknockshire - - 0.1 19 Carmathenshire - 0.1 0.1 10 Glamorganshire 0.1 0.5 0.2 9 Monmouthshire 0.1 0.3 0.4 50 Not stated 76 n 1956 Total England & Wales 100.00 100.00 100.00
Sources: Death registers, and Census of England and Wales, 1871.
Table 12 showing the proportionate distribution of the English immigrants by county
of origin emphasises the degree of continuity from the previous periods. But the table
does disguise both the changes of the 1880s and some particular county flows. Thus
significant proportions of those from Lancashire and Yorkshire arrived in the 1880s,
while those counties which sent many rural labourers – Bedford, Berkshire, Oxford
and Warwick – sent over 40 per cent of their immigrants in a three year period, 1873-
75, that is during the Revolt of the Field, that rise of agricultural unionism against the
farmers. Those coming from Kent and Lincoln were concentrated in two periods,
1873-75 and 1879-1880, coinciding with periods of conflict between farmers and
labourers, the continuing arrival of those born in Cornwall reflecting the persistent
difficulties of the copper mining industry (1874 being the most disastrous year of all
in the history of Cornish mining), and the development of the Reefton gold quartz
23
mining fields during the 1880s.12 Emigration from Cornwall and Devon, in particular,
built upon earlier influxes, especially those of the 1860s. Gold miners especially used
the nomination provisions of the general government’s immigration regulations to
bring many families and relatives to New Zealand. Females in fact dominated the
inflow from Cornwall to continue a long-established pattern in which Cornish wives
and families tended to follow their menfolk to the colonies, sometimes several years
later.13
One other aspect of the English/Welsh flow to New Zealand merits attention, namely
that of regional origins and religion. Rollo Arnold suggested that there was an
association between certain types of rural parish – namely those containing many
small and independent landowners, and dispersed hamlets – the strength of
nonconformity, and a propensity to emigrate.14 There were some contrasts in the
regional pattern of religious affiliation: thus just 16.2 per cent of those born in
London-Middlesex were nonconformist, and 22.3 per cent of those from the South-
east, but 33.9 per cent of those born in the South-west and 41.7 per cent in the East.
With respect to occupational affiliation there was no real difference between
Anglicans and Methodists in the proportions of those with an agricultural background.
But a much higher proportion (42.9 per cent) of non-conformists had fathers who
were pre-industrial craftsmen compared with only 29.7 per cent of Anglicans. On
other hand, fathers of Church of England immigrants were almost twice as likely to be
from a white collar background compared with non-conformists. If there is an
association between non-conformity and emigration it is to be found particularly
among those from a craft background.
Regional Origins: The Scots immigrants, 1871-1890
Table 13: Regions of birth of New Zealand’s Scottish immigrants, 1840-1852, 1853-1870, and 1871-1890 (per cent)
12 Brian Wood, Disaster at Brunner: the coalmine tragedy at Brunnerton, New Zealand, 26 March 1896: a commemorative history. Greymouth, 1996, p.30. 13 See, for example, Rollo Arnold, The farthest promised land:: English villagers, New Zealand migrants of the 1870s. Wellington 1981, pp.229-230. See also Cyclopaedia of New Zealand, Volume 3, p.1 047. This characteristic of Cornish migration has been noted elsewhere: see, for example, John Rowe ‘Cornish,’ in Stephan Thernstrom, editor, Harvard encyclopaedia of American ethnic groups. Cambridge, Massachusetts, 1980, p.244.
24
Born in 1840-1852 1853-1870 1871-1890 Resident, native-born Scots, 1871
Representation indices
Far North 6.1 5.9 10.8 3.7 292 Highlands 10.3 16.0 9.8 10.8 91 North-east 7.9 10.2 10.4 13.3 78 Eastern Lowlands 37.1 32.7 27.9 33.5 83 Western Lowlands 36.2 26.6 33.2 29.6 112 Borders 3.3 8.6 7.9 9.1 87 100.0 100.0 100.0 100.0 Not stated (number) 6 38 47 n= 213 745 742 Source: Death registers, and Census of Scotland, 1871.
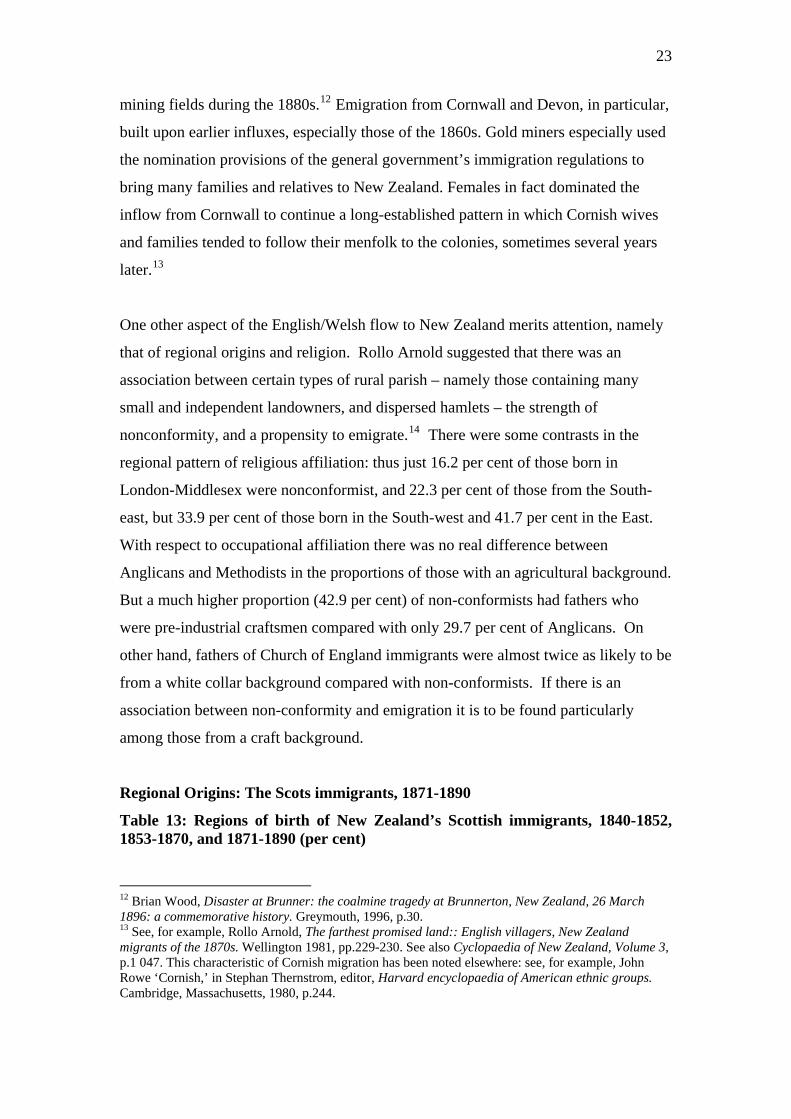
Table 13 setting out the regions of birth of New Zealand’s Scots immigrants suggests
the continuing importance of the Lowlands as the major source of migrants to New
Zealand. We note the significant rise in numbers from the Far North, among whom
males tended to be over-represented, and the relative fall in those born in the
Highlands.
Table 14: County of Birth, Scottish immigrants, 1840-1852, 1853-1870, and 1871-1890 (per cent) Regions and counties 1840-1852 1853-1870 1871-1890 Representation
indices, 1871-1890 Far North Caithness 4.2 3.1 1.6 132 Orkney 0.5 0.9 1.2 125 Shetland 1.4 2.0 8.1 845 Highlands Argyll 1.9 3.1 1.6 70 Bute 1.9 2.0 1.3 256 Inverness 2.8 4.0 3.6 137 Ross 1.9 4.7 2.4 102 Sutherland 1.9 2.3 0.9 121 North-east Aberdeen 5.6 7.8 8.2 112 Banff 0.0 0.7 1.2 63 Moray 1.4 1.3 1.0 77 Nairn - 0.1 0.0 0.0 Eastern Lowlands Angus 5.2 5.4 5.6 79 Clackmannan 0.5 0.6 0.4 60
14 Rollo Arnold, The farthest promised land: English villagers, New Zealand immigrants of the 1870s. Wellington, 1981, especially pp.164-165.
25
Dunbarton 1.9 1.4 1.6 90 East Lothian 0.9 0.4 0.1 12 Fife 3.8 4.0 5.0 105 Kincardine - 0.4 0.9 83 Kinross - 0.3 0.4 207 Mid Lothian (Edinburgh) 16.9 9.5 8.1 87 Perth 2.8 6.2 2.9 76 Stirling 3.8 3.5 2.4 84 West Lothian 1.4 0.7 0.4 35 West Lowlands Ayr 8.9 7.9 8.5 136 Lanark 18.8 15.0 20.4 90 Renfrew 8.5 3.4 4.3 67 Borders Berwick 1.4 2.0 1.3 121 Dumfries 0.5 2.5 2.4 110 Kirkcudbright 0.0 0.7 0.1 11 Peebles 0.0 0.7 0.7 202 Roxburgh 0.9 1.7 1.0 62 Selkirk 0.0 0.3 0.9 207 Wigtown 0.5 0.7 1.4 124 Total Scotland 100.0 100.0 100.0 Sources: Death registers, and Census of Scotland, 1871
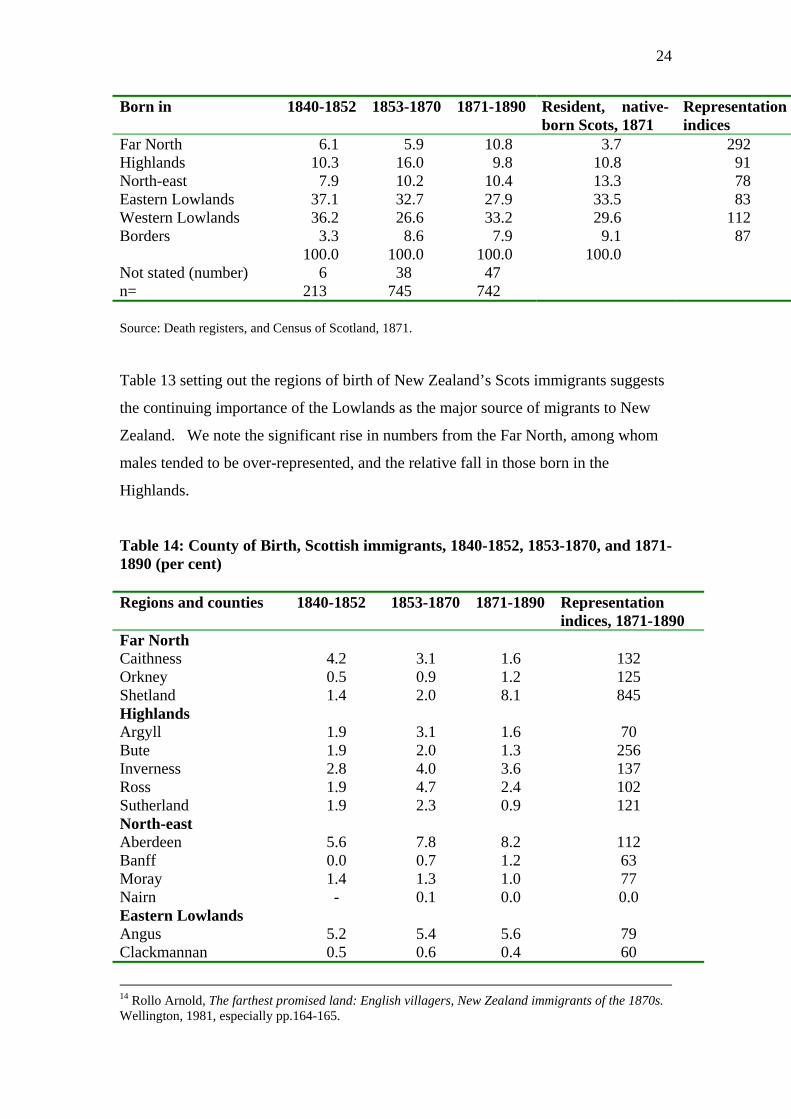
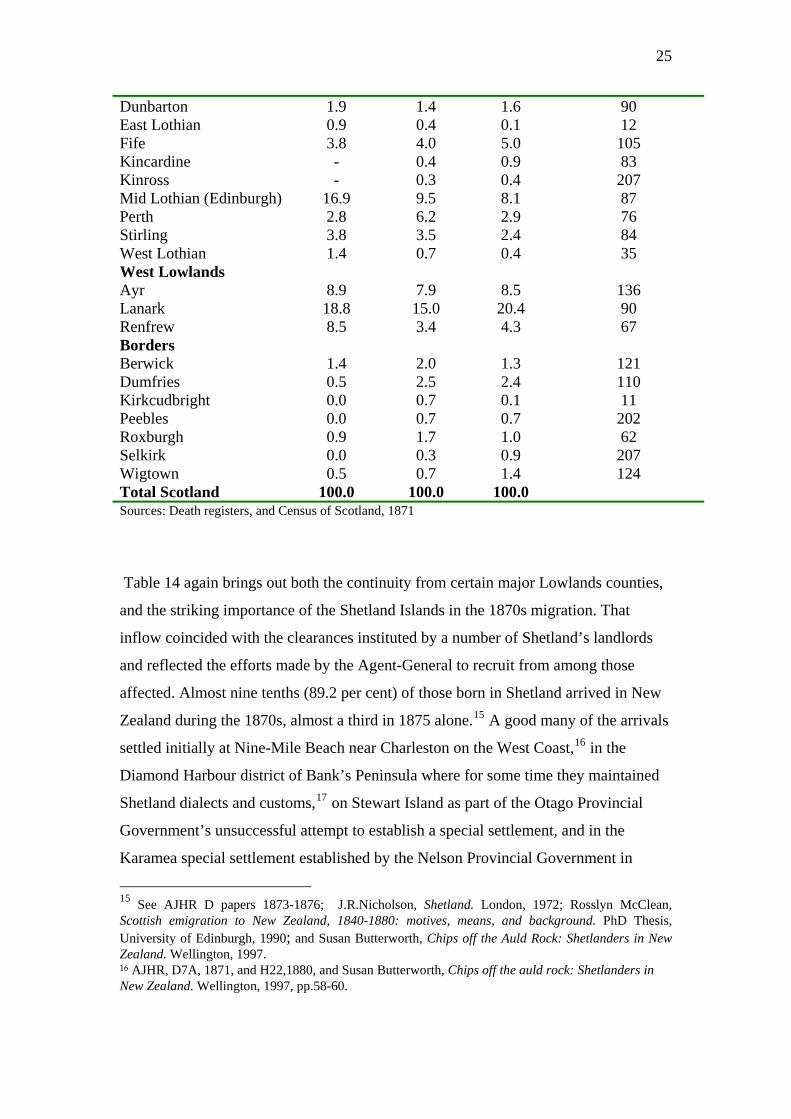
Table 14 again brings out both the continuity from certain major Lowlands counties,
and the striking importance of the Shetland Islands in the 1870s migration. That
inflow coincided with the clearances instituted by a number of Shetland’s landlords
and reflected the efforts made by the Agent-General to recruit from among those
affected. Almost nine tenths (89.2 per cent) of those born in Shetland arrived in New
Zealand during the 1870s, almost a third in 1875 alone.15 A good many of the arrivals
settled initially at Nine-Mile Beach near Charleston on the West Coast,16 in the
Diamond Harbour district of Bank’s Peninsula where for some time they maintained
Shetland dialects and customs,17 on Stewart Island as part of the Otago Provincial
Government’s unsuccessful attempt to establish a special settlement, and in the
Karamea special settlement established by the Nelson Provincial Government in
15 See AJHR D papers 1873-1876; J.R.Nicholson, Shetland. London, 1972; Rosslyn McClean, Scottish emigration to New Zealand, 1840-1880: motives, means, and background. PhD Thesis, University of Edinburgh, 1990; and Susan Butterworth, Chips off the Auld Rock: Shetlanders in New Zealand. Wellington, 1997. 16 AJHR, D7A, 1871, and H22,1880, and Susan Butterworth, Chips off the auld rock: Shetlanders in New Zealand. Wellington, 1997, pp.58-60.
26
1874. It should also be noted that Orkney Islanders were among those who arrived
from the Far North of Scotland, and that a small inflow continued during the 1880s,
often building upon the earlier arrival of wider family members.18
Regional Origins: Irish Immigrants, 1871-1890.
Table 15: Provinces of birth, New Zealand’s Irish immigrants, 1840-1852, 1853-1870 and 1871-1890 (per cent) Provinces of birth 1840-1852 1853-1870 1871-1890 Resident
native-born Irish 1871
Representation indices
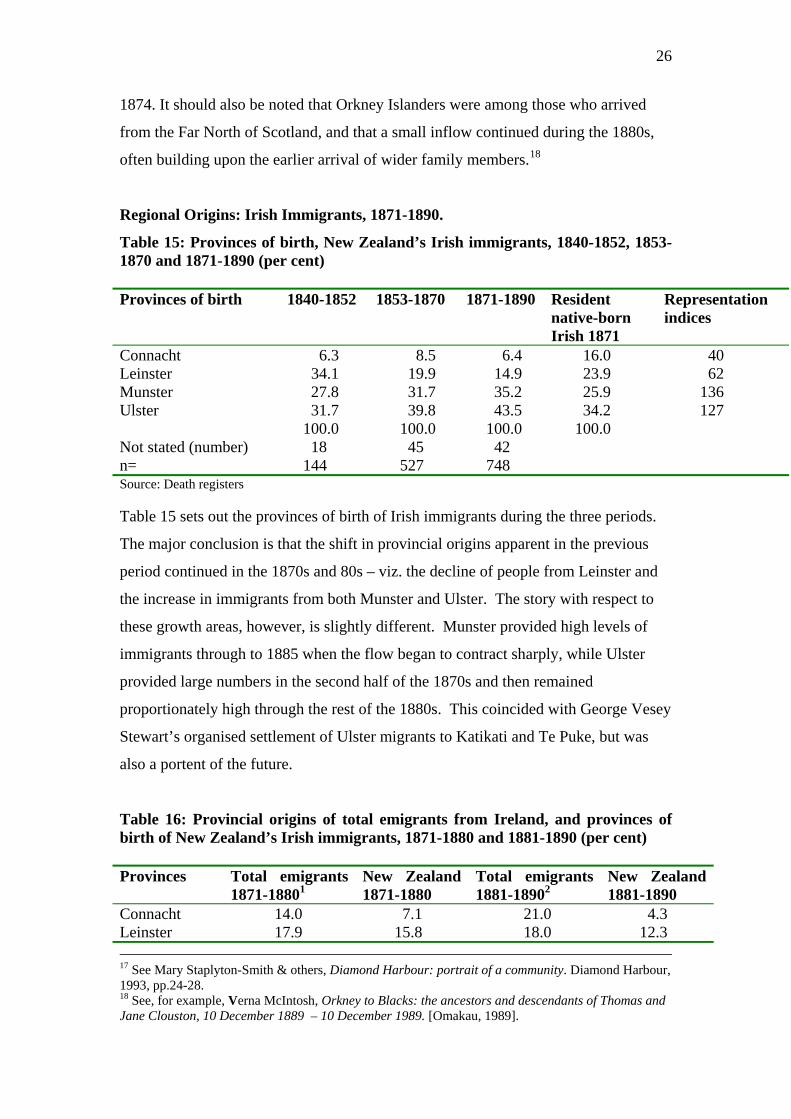
Connacht 6.3 8.5 6.4 16.0 40 Leinster 34.1 19.9 14.9 23.9 62 Munster 27.8 31.7 35.2 25.9 136 Ulster 31.7 39.8 43.5 34.2 127 100.0 100.0 100.0 100.0 Not stated (number) 18 45 42 n= 144 527 748 Source: Death registers Table 15 sets out the provinces of birth of Irish immigrants during the three periods.
The major conclusion is that the shift in provincial origins apparent in the previous
period continued in the 1870s and 80s – viz. the decline of people from Leinster and
the increase in immigrants from both Munster and Ulster. The story with respect to
these growth areas, however, is slightly different. Munster provided high levels of
immigrants through to 1885 when the flow began to contract sharply, while Ulster
provided large numbers in the second half of the 1870s and then remained
proportionately high through the rest of the 1880s. This coincided with George Vesey
Stewart’s organised settlement of Ulster migrants to Katikati and Te Puke, but was
also a portent of the future.
Table 16: Provincial origins of total emigrants from Ireland, and provinces of birth of New Zealand’s Irish immigrants, 1871-1880 and 1881-1890 (per cent) Provinces Total emigrants
1871-18801 New Zealand 1871-1880
Total emigrants 1881-18902
New Zealand 1881-1890
Connacht 14.0 7.1 21.0 4.3 Leinster 17.9 15.8 18.0 12.3 17 See Mary Staplyton-Smith & others, Diamond Harbour: portrait of a community. Diamond Harbour, 1993, pp.24-28. 18 See, for example, Verna McIntosh, Orkney to Blacks: the ancestors and descendants of Thomas and Jane Clouston, 10 December 1889 – 10 December 1989. [Omakau, 1989].
27
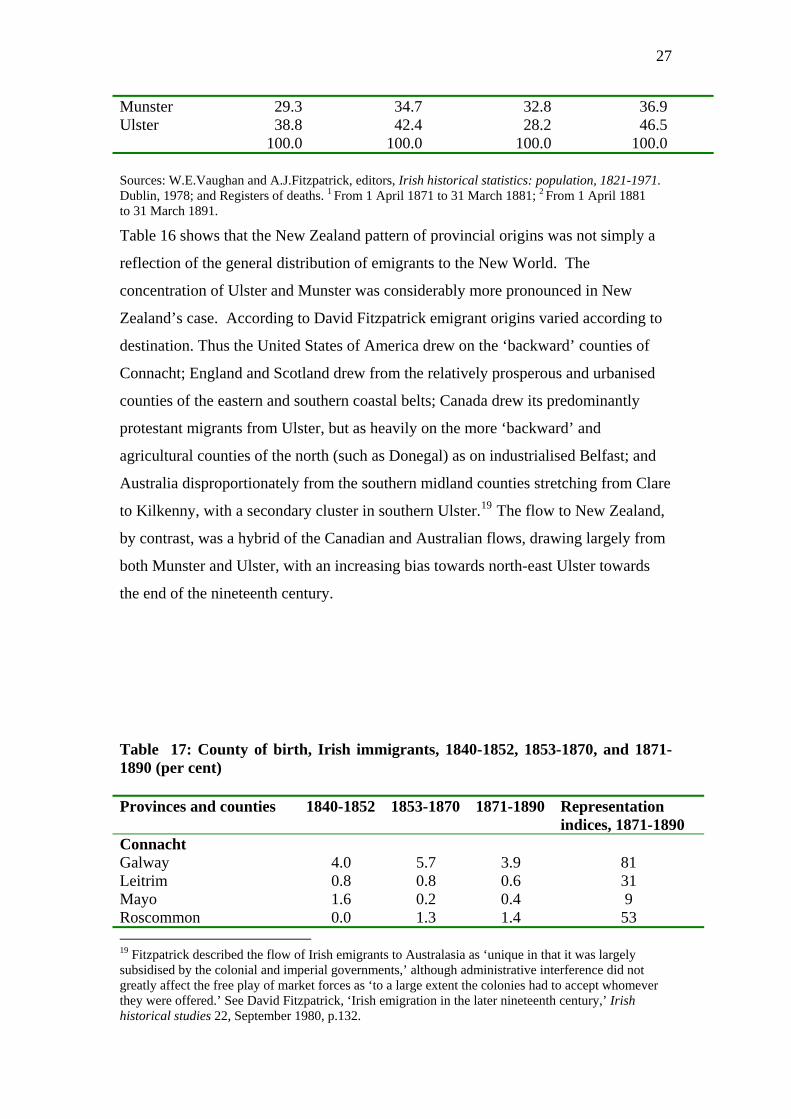
Munster 29.3 34.7 32.8 36.9 Ulster 38.8 42.4 28.2 46.5 100.0 100.0 100.0 100.0 Sources: W.E.Vaughan and A.J.Fitzpatrick, editors, Irish historical statistics: population, 1821-1971. Dublin, 1978; and Registers of deaths. 1 From 1 April 1871 to 31 March 1881; 2 From 1 April 1881 to 31 March 1891. Table 16 shows that the New Zealand pattern of provincial origins was not simply a
reflection of the general distribution of emigrants to the New World. The
concentration of Ulster and Munster was considerably more pronounced in New
Zealand’s case. According to David Fitzpatrick emigrant origins varied according to
destination. Thus the United States of America drew on the ‘backward’ counties of
Connacht; England and Scotland drew from the relatively prosperous and urbanised
counties of the eastern and southern coastal belts; Canada drew its predominantly
protestant migrants from Ulster, but as heavily on the more ‘backward’ and
agricultural counties of the north (such as Donegal) as on industrialised Belfast; and
Australia disproportionately from the southern midland counties stretching from Clare
to Kilkenny, with a secondary cluster in southern Ulster.19 The flow to New Zealand,
by contrast, was a hybrid of the Canadian and Australian flows, drawing largely from
both Munster and Ulster, with an increasing bias towards north-east Ulster towards
the end of the nineteenth century.
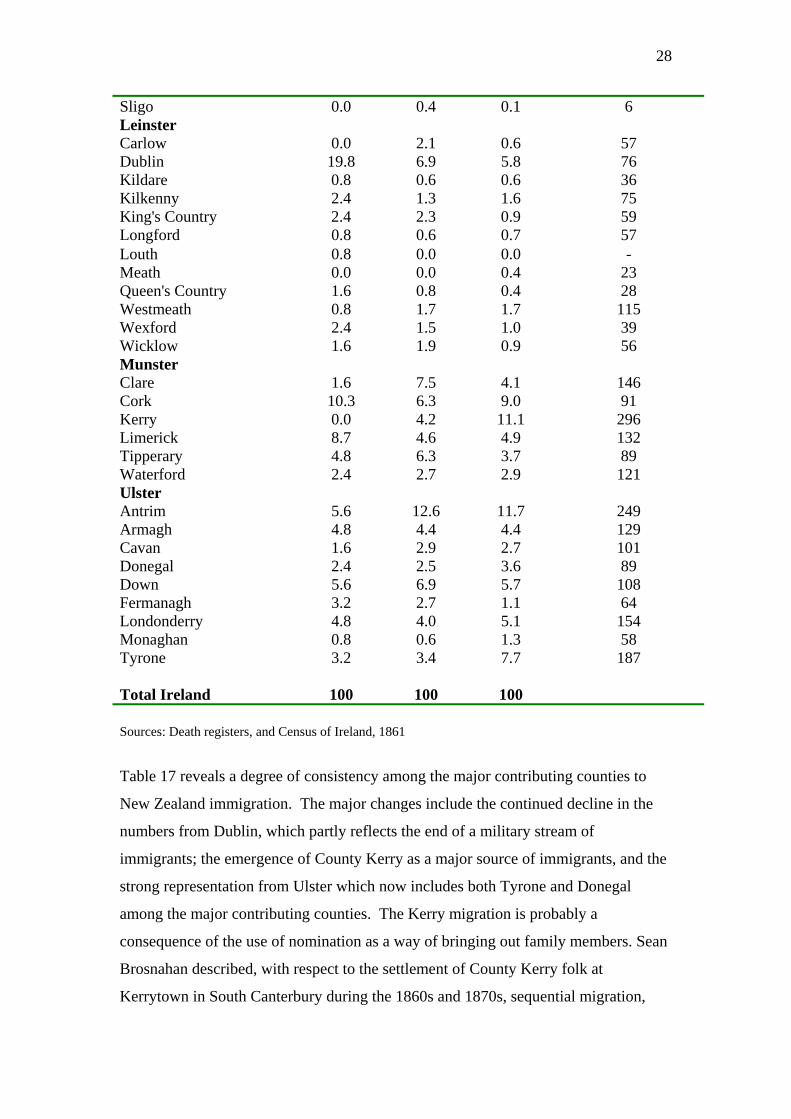
Table 17: County of birth, Irish immigrants, 1840-1852, 1853-1870, and 1871-1890 (per cent) Provinces and counties 1840-1852 1853-1870 1871-1890 Representation
indices, 1871-1890 Connacht Galway 4.0 5.7 3.9 81 Leitrim 0.8 0.8 0.6 31 Mayo 1.6 0.2 0.4 9 Roscommon 0.0 1.3 1.4 53 19 Fitzpatrick described the flow of Irish emigrants to Australasia as ‘unique in that it was largely subsidised by the colonial and imperial governments,’ although administrative interference did not greatly affect the free play of market forces as ‘to a large extent the colonies had to accept whomever they were offered.’ See David Fitzpatrick, ‘Irish emigration in the later nineteenth century,’ Irish historical studies 22, September 1980, p.132.
28
Sligo 0.0 0.4 0.1 6 Leinster Carlow 0.0 2.1 0.6 57 Dublin 19.8 6.9 5.8 76 Kildare 0.8 0.6 0.6 36 Kilkenny 2.4 1.3 1.6 75 King's Country 2.4 2.3 0.9 59 Longford 0.8 0.6 0.7 57 Louth 0.8 0.0 0.0 - Meath 0.0 0.0 0.4 23 Queen's Country 1.6 0.8 0.4 28 Westmeath 0.8 1.7 1.7 115 Wexford 2.4 1.5 1.0 39 Wicklow 1.6 1.9 0.9 56 Munster Clare 1.6 7.5 4.1 146 Cork 10.3 6.3 9.0 91 Kerry 0.0 4.2 11.1 296 Limerick 8.7 4.6 4.9 132 Tipperary 4.8 6.3 3.7 89 Waterford 2.4 2.7 2.9 121 Ulster Antrim 5.6 12.6 11.7 249 Armagh 4.8 4.4 4.4 129 Cavan 1.6 2.9 2.7 101 Donegal 2.4 2.5 3.6 89 Down 5.6 6.9 5.7 108 Fermanagh 3.2 2.7 1.1 64 Londonderry 4.8 4.0 5.1 154 Monaghan 0.8 0.6 1.3 58 Tyrone 3.2 3.4 7.7 187 Total Ireland 100 100 100 Sources: Death registers, and Census of Ireland, 1861
Table 17 reveals a degree of consistency among the major contributing counties to
New Zealand immigration. The major changes include the continued decline in the
numbers from Dublin, which partly reflects the end of a military stream of
immigrants; the emergence of County Kerry as a major source of immigrants, and the
strong representation from Ulster which now includes both Tyrone and Donegal
among the major contributing counties. The Kerry migration is probably a
consequence of the use of nomination as a way of bringing out family members. Sean
Brosnahan described, with respect to the settlement of County Kerry folk at
Kerrytown in South Canterbury during the 1860s and 1870s, sequential migration,
29
facilitated by government assistance, which saw the transplantation of ‘a whole
section of East Kerry society.’20
Irish Religious Denominations
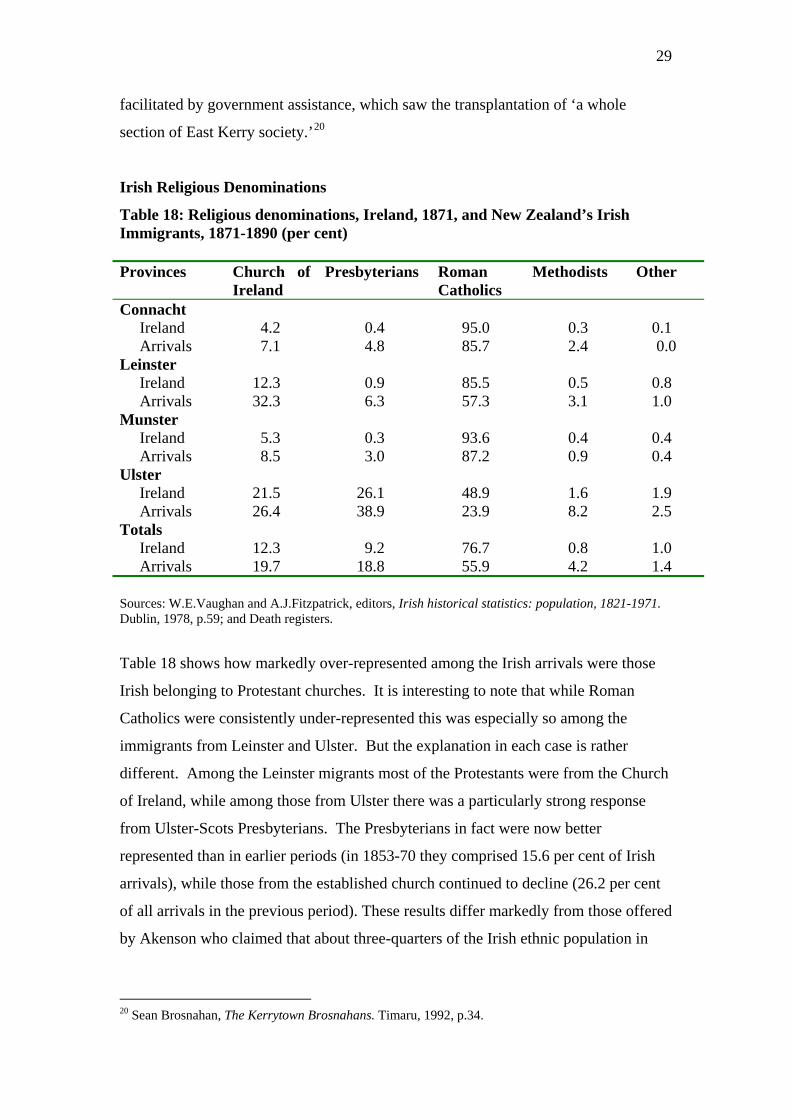
Table 18: Religious denominations, Ireland, 1871, and New Zealand’s Irish Immigrants, 1871-1890 (per cent) Provinces Church of
Ireland Presbyterians Roman
Catholics Methodists Other
Connacht Ireland 4.2 0.4 95.0 0.3 0.1 Arrivals 7.1 4.8 85.7 2.4 0.0 Leinster Ireland 12.3 0.9 85.5 0.5 0.8 Arrivals 32.3 6.3 57.3 3.1 1.0 Munster Ireland 5.3 0.3 93.6 0.4 0.4 Arrivals 8.5 3.0 87.2 0.9 0.4 Ulster Ireland 21.5 26.1 48.9 1.6 1.9 Arrivals 26.4 38.9 23.9 8.2 2.5 Totals Ireland 12.3 9.2 76.7 0.8 1.0 Arrivals 19.7 18.8 55.9 4.2 1.4 Sources: W.E.Vaughan and A.J.Fitzpatrick, editors, Irish historical statistics: population, 1821-1971. Dublin, 1978, p.59; and Death registers.
Table 18 shows how markedly over-represented among the Irish arrivals were those
Irish belonging to Protestant churches. It is interesting to note that while Roman
Catholics were consistently under-represented this was especially so among the
immigrants from Leinster and Ulster. But the explanation in each case is rather
different. Among the Leinster migrants most of the Protestants were from the Church
of Ireland, while among those from Ulster there was a particularly strong response
from Ulster-Scots Presbyterians. The Presbyterians in fact were now better
represented than in earlier periods (in 1853-70 they comprised 15.6 per cent of Irish
arrivals), while those from the established church continued to decline (26.2 per cent
of all arrivals in the previous period). These results differ markedly from those offered
by Akenson who claimed that about three-quarters of the Irish ethnic population in
20 Sean Brosnahan, The Kerrytown Brosnahans. Timaru, 1992, p.34.
30
New Zealand was Roman Catholic, that is, about the same as in Ireland itself.21 On
the other hand, they accord more closely with Galbraith’s conclusion that ‘the
Protestant Irish were … a much larger portion of the Irish cohort in New Zealand than
has been generally assumed …’22 He went on to attribute the presence of Ulster
Protestants to a widespread prejudice against Irish Catholics, the efforts of influential
groups in ‘the higher echelons of provincial and central government in New Zealand’
in the 1860s and 1870s - aided by ‘prominent Protestant Irish businessmen and
interest groups, including the Orange Order,’ and to ‘an Ulster-bias in the colony’s
recruitment efforts.’ As a result, New Zealand drew ‘as much as half of the entire
Irish emigrant flow’ from Ulster and then largely from its Protestant communities.
Place of death
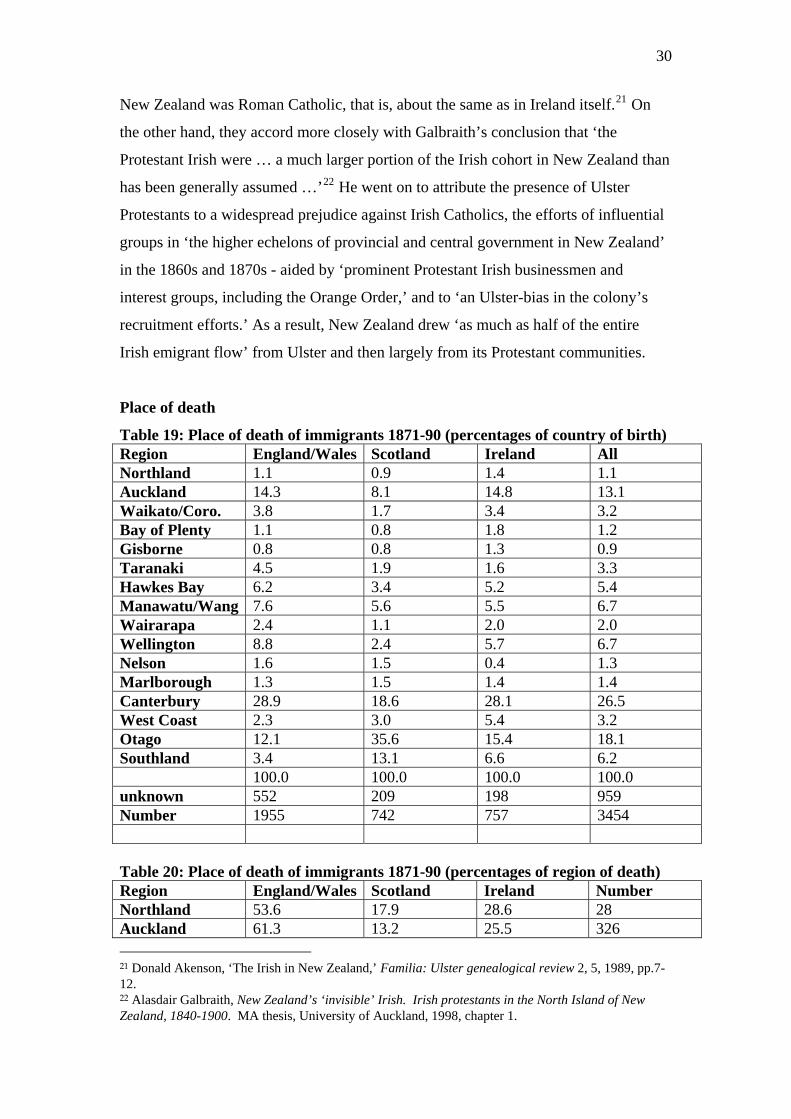
Table 19: Place of death of immigrants 1871-90 (percentages of country of birth) Region England/Wales Scotland Ireland All Northland 1.1 0.9 1.4 1.1 Auckland 14.3 8.1 14.8 13.1 Waikato/Coro. 3.8 1.7 3.4 3.2 Bay of Plenty 1.1 0.8 1.8 1.2 Gisborne 0.8 0.8 1.3 0.9 Taranaki 4.5 1.9 1.6 3.3 Hawkes Bay 6.2 3.4 5.2 5.4 Manawatu/Wang 7.6 5.6 5.5 6.7 Wairarapa 2.4 1.1 2.0 2.0 Wellington 8.8 2.4 5.7 6.7 Nelson 1.6 1.5 0.4 1.3 Marlborough 1.3 1.5 1.4 1.4 Canterbury 28.9 18.6 28.1 26.5 West Coast 2.3 3.0 5.4 3.2 Otago 12.1 35.6 15.4 18.1 Southland 3.4 13.1 6.6 6.2 100.0 100.0 100.0 100.0 unknown 552 209 198 959 Number 1955 742 757 3454 Table 20: Place of death of immigrants 1871-90 (percentages of region of death) Region England/Wales Scotland Ireland Number Northland 53.6 17.9 28.6 28 Auckland 61.3 13.2 25.5 326 21 Donald Akenson, ‘The Irish in New Zealand,’ Familia: Ulster genealogical review 2, 5, 1989, pp.7-12. 22 Alasdair Galbraith, New Zealand’s ‘invisible’ Irish. Irish protestants in the North Island of New Zealand, 1840-1900. MA thesis, University of Auckland, 1998, chapter 1.
31
Waikato/Coro. 65.4 11.1 23.5 81 Bay of Plenty 51.7 13.8 34.5 29 Gisborne 50.0 18.2 31.8 22 Taranaki 76.8 12.2 11.0 82 Hawkes Bay 64.9 13.4 21.6 134 Manawatu/Wang 63.5 18.0 18.6 167 Wairarapa 66.7 11.8 21.6 51 Wellington 73.2 7.7 19.0 168 Nelson 68.8 25.0 6.3 32 Marlborough 52.9 23.5 23.5 34 Canterbury 61.3 15.0 23.8 661 West Coast 41.8 20.3 38.0 79 Otago 38.1 42.6 19.3 446 Southland 31.0 45.2 23.9 155 ALL 56.2 21.4 22.4 2495 unknown 552 209 198 959 Number 1955 742 757 3454 Source: Death registers
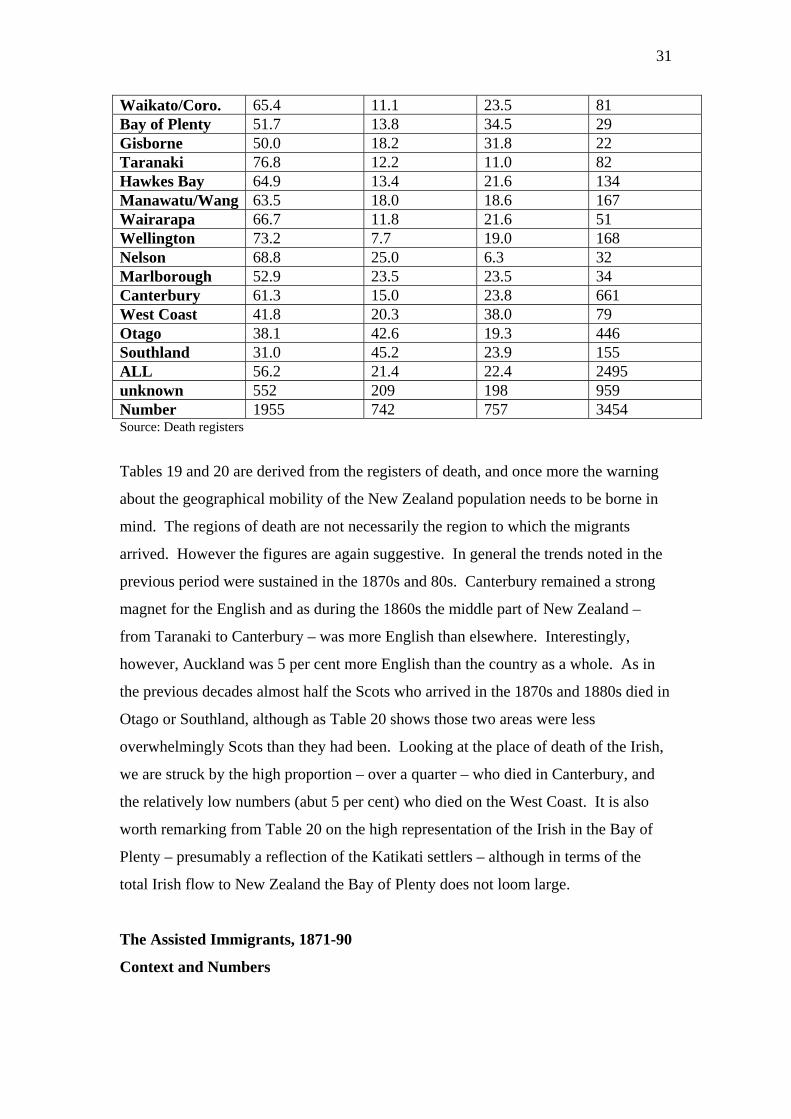
Tables 19 and 20 are derived from the registers of death, and once more the warning
about the geographical mobility of the New Zealand population needs to be borne in
mind. The regions of death are not necessarily the region to which the migrants
arrived. However the figures are again suggestive. In general the trends noted in the
previous period were sustained in the 1870s and 80s. Canterbury remained a strong
magnet for the English and as during the 1860s the middle part of New Zealand –
from Taranaki to Canterbury – was more English than elsewhere. Interestingly,
however, Auckland was 5 per cent more English than the country as a whole. As in
the previous decades almost half the Scots who arrived in the 1870s and 1880s died in
Otago or Southland, although as Table 20 shows those two areas were less
overwhelmingly Scots than they had been. Looking at the place of death of the Irish,
we are struck by the high proportion – over a quarter – who died in Canterbury, and
the relatively low numbers (abut 5 per cent) who died on the West Coast. It is also
worth remarking from Table 20 on the high representation of the Irish in the Bay of
Plenty – presumably a reflection of the Katikati settlers – although in terms of the
total Irish flow to New Zealand the Bay of Plenty does not loom large.
The Assisted Immigrants, 1871-90
Context and Numbers
32
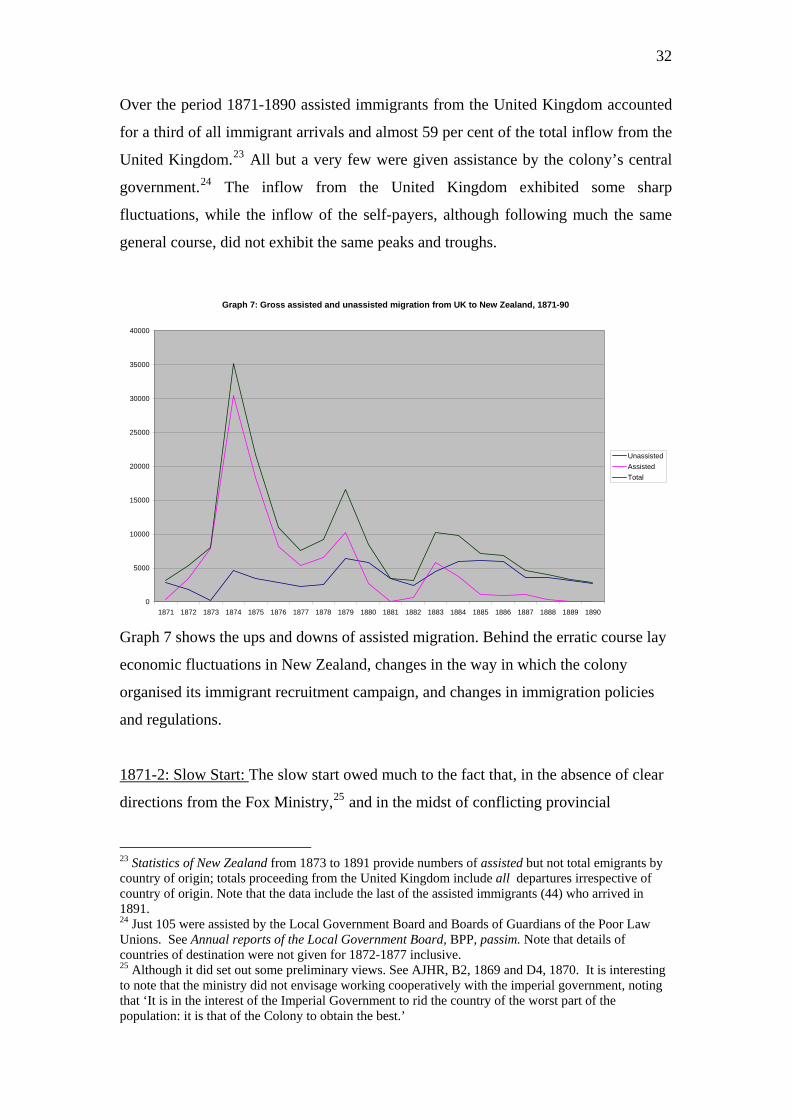
Over the period 1871-1890 assisted immigrants from the United Kingdom accounted
for a third of all immigrant arrivals and almost 59 per cent of the total inflow from the
United Kingdom.23 All but a very few were given assistance by the colony’s central
government.24 The inflow from the United Kingdom exhibited some sharp
fluctuations, while the inflow of the self-payers, although following much the same
general course, did not exhibit the same peaks and troughs.
Graph 7: Gross assisted and unassisted migration from UK to New Zealand, 1871-90
0
5000
10000
15000
20000
25000
30000
35000
40000
1871 1872 1873 1874 1875 1876 1877 1878 1879 1880 1881 1882 1883 1884 1885 1886 1887 1888 1889 1890
UnassistedAssistedTotal
Graph 7 shows the ups and downs of assisted migration. Behind the erratic course lay
economic fluctuations in New Zealand, changes in the way in which the colony
organised its immigrant recruitment campaign, and changes in immigration policies
and regulations.
1871-2: Slow Start: The slow start owed much to the fact that, in the absence of clear
directions from the Fox Ministry,25 and in the midst of conflicting provincial
23 Statistics of New Zealand from 1873 to 1891 provide numbers of assisted but not total emigrants by country of origin; totals proceeding from the United Kingdom include all departures irrespective of country of origin. Note that the data include the last of the assisted immigrants (44) who arrived in 1891. 24 Just 105 were assisted by the Local Government Board and Boards of Guardians of the Poor Law Unions. See Annual reports of the Local Government Board, BPP, passim. Note that details of countries of destination were not given for 1872-1877 inclusive. 25 Although it did set out some preliminary views. See AJHR, B2, 1869 and D4, 1870. It is interesting to note that the ministry did not envisage working cooperatively with the imperial government, noting that ‘It is in the interest of the Imperial Government to rid the country of the worst part of the population: it is that of the Colony to obtain the best.’
33
regulations and competing provincial immigration agents, the Agent-General was
compelled to devise a uniform set of regulations, create an appropriately staffed
agency, and devise an effective recruitment strategy. Once the general government
assumed full control of the immigration programme, the Agent-General, in December
1871, drew up a uniform set of regulations, while in January 1872 regulations for
nominated immigration were issued in New Zealand. Under these regulations,
selected categories of immigrants were offered assisted (but not free) passages. In the
Agency-General an immigration office was established, staff numbers expanded
rapidly (to reach a peak of 29 in June 1875), while a large army of immigration sub-
agents who worked on a commission basis was recruited.26
At first, a buoyant British labour market and more liberal immigration assistance
offered by the United States, Canada, and Australia, combined to ensure that the
Agent-General experienced difficulties (and mounting criticism at home) over
recruiting the numbers of immigrants demanded in New Zealand.
1873-75: Major influx: It was the so-called, ‘Revolt of the Field’, rising discontent
among England’s rural labourers expressed most dramatically in the formation in
1872 of the National Agricultural Labourers’ Union, which came to the Agent-
General’s aid.27 The union experienced explosive growth and by the end of 1873 had
over 1 000 branches and a membership of almost 72 000.28 Membership was
concentrated largely in those regions in which ‘outdoor’ labour had emerged, that is,
in the East (especially in Lincoln), in Midlands Central (especially Warwick),
26 See AJHR, D2, 1873. 27 The ‘Revolt of the Field’ and emigration to New Zealand are explored in Rollo Arnold, The farthest promised land: English villagers, New Zealand immigrants of the 1870s. Wellington, 1981. It is worthwhile noting that not all agricultural labourer immigrants were union members. Predecessors of the NALU included the West of England Labourers’ Improvement Association (known as the Herefordshire Union) was formed in 1870 with the motto ‘Emigration, migration, but not Strikes.’ See Donald O.Wagner, The Church of England and social reform since 1854. New York, 1930, pp.151-154. It is worthwhile noting that the Joseph Arch, the NALU leader, was a local Primitive Methodist preacher, and that there were strong links between nonconformity and the leadership of the new union. See P.L.R.Horn, Joseph Arch (1826-1919): farm workers’ leader. Kineton, 1971. On the influence of Methodism, see Pamela R.Horn, ‘Methodism and agricultural trade unionism in Oxfordshire: the 1870s,’ in Proceedings of the Wesley historical society XXXVII, Part 3, October 1969, pp.67-71. 28 Nigel Scotland, ‘The National Agricultural Labourers’ Union and the demand for a stake in the soil, 1872-1896,’ in E.F.Biagini, editor, Citizenship and community. Cambridge, 1996, pp.151-167. Scotland indicated that numbers rose to 80 000, although Dunbabin had suggested 100 000. See John P.D.Dunbabin, ‘Agricultural trade unionism in England 1872-1894,’ in Andrew Charlesworth, editor, An atlas of rural protest in Britain 1548-1900. London, 1983, pp.171-173. See also J.P.D.Dunbabin, editor, Rural discontent in nineteenth century Britain. London, 1974.
34
Midlands South, and the South-east. The union movement made little headway in
northern England, Wales, or Scotland, that is, where farm service persisted and where
annual hiring fairs regulated the labour market.29 Although the union was chiefly
concerned with improving wages and conditions, it also set out to assist ‘deserving
and suitable labourers to migrate and emigrate,’30 while smaller unions also
sponsored emigration.31 In response, farmers locked out union members, prompting
the union, in May 1873, to memorialise the New Zealand Parliament.32 With a se
labour shortage still threatening both the public works programme, in October 18
the government instructed Featherston to offer free passages, while New Zeala
residents could nominate friends or relatives for a free passage. In 1874 a further
lockout in southern and eastern England rendered some 10 000 men idle. Failing to
secure any wage rise and losing support, the union decided, in July 1874, decided to
promote emigration in lieu of the wage claim. The Federal Union of Labourers
followed suit a few days later and the resulting efflux included not only large numbers
from National Union’s districts and from Kent, but also the first trickle from Lincoln
where the Lincolnshire Labour League had been established in 1872.
rious
73
nd
33 Agricultural
labourers and rural tradesmen and craftsmen responded eagerly to the offer of free
29 John P.D.Dunbabin, ‘Agricultural trade unionism in England 1872-1894,’ in Andrew Charlesworth, editor, An atlas of rural protest in Britain 1548-1900. London, 1983, pp.171-173. It should be noted that even within the regions and counties affected, membership varied from village to village. See Alan Armstrong, Farmworkers in England and Wales: a social and economic history, 1770-1980. Ames, 1988, p.125; W.A.Armstrong, ‘The flight from the land,’ in G.E.Mingay, editor, The Victorian countryside, Volume 1. London, 1981, pp.118-135; and W.A.Armstrong, ‘The flight from the land,’ in G.E.Mingay, editor, The vanishing countryman. London, 1989, pp.57-75. Newby indicated that the Federal Union of Labourers also expanded rapidly, and that by 1873 among them the various unions could muster 120 000 members. See Howard Newby, Country life: a social history of rural England. London, 1987, pp.123 and 125. 30 ‘Constitution and Rules of the National Agricultural Labourers’ Union Revised at the annual May Council 1874,’ quoted in Nigel Scotland, ‘The National Agricultural Labourers’ Union and the demand for a stake in the soil 1872-1896,’ in E.F.Biagini, editor, Citizenship and community. Cambridge, 1996, pp.151-167. 31 Including the Lincolnshire Amalgamated Labour League, the Peterborough District Union, the Kent and Sussex Union, and the North Herefordshire and South Shropshire Agricultural Labourers’ Improvement Society. See Pamela Horn, ‘Agricultural trade unionism and emigration, 1872-1881,’ Historical journal 15, 1, 1972, pp.87-102. The first sizeable efflux of agricultural labourers involved some 1 000, largely from Warwick, Gloucester, Oxford, Dorset, and Wiltshire, and who departed for Brazil between May 1872 and February 1873. 32 AJHR D1A, 1873, p.6. On farmers’ defence associations, see P.L.R.Horn ‘Farmers’ defence associations in Oxfordshire, 1872-1874,’ History studies 1, 1, 1968, pp.63-70. 33 On rural trade unionism and emigration, see R.Arnold, ‘English rural unionism and Taranaki immigration,’ New Zealand journal of history 6,1, April, 1972, pp.20-41; Pamela Horn, ‘Agricultural trade unionism and emigration, 1872-1881,’ Historical journal 15,1, 1972, pp.87-102; and Pamela Horn, ‘Agricultural trade unionism in Oxfordshire,’ in J.P.D.Dunbabin, editor, Rural discontent in nineteenth century Britain. London, 1974, pp.85-129. See also Howard Newby, Country life: a social history of rural England. London, 1987, p.131.
35
passages to New Zealand. The numbers of assisted arrivals thus increased rapidly
through 1873 to reach a decadal peak of over 32 000 in 1874, with a further 20 370
following in 1875.
1876-77: Trough: Deteriorating economic conditions during 1875, including rising
unemployment, prompted, by January 1876, a suspension of all assisted immigration
(with the exception of single women), while the Agent-General was instructed to
implement increasingly severe reductions in the Agency’s recruitment infrastructure
and costs.34
1878-79: Small Influx: A short-lived improvement in the colony’s economic fortunes
in 1878 encouraged the government to resume borrowing, and order more
immigrants, while the Agent-General was also instructed to assist a number of
colonial employers, including the Westport Colliery Company and the Mosgiel
Woollen Company, who had asked that free passages be granted to selected
occupations,35 and to capitalise upon the lock-out instituted in the northern winter of
1878-1879 of 1 000 members of the Kent and Sussex Labourers’ Union.36 In
February 1879 some 400 agricultural labourers and their families, drawn mainly fro
north Kent and the Lamberhurst area, left for New Zealand.
m
r members.
37 After 1881 the
agricultural unions, facing declining membership and dwindling financial resources,
played little part in fostering or supporting the emigration of thei
1880-85: Decline: The numbers of assisted immigrants arriving in New Zealand fell
sharply after 1879. The Scottish Agency was closed and by July 1879 the services of
117 of a total of 159 local agents had been terminated, just two being retained in (the
34 AJHR D1, 1876, pp.17-18; and D1, 1878, p.5, and D2B, 1878, p.1. 35 See AJHR Session 1, D1, 1879, pp.14 and 16; and AJHR Session 1, D2, 1879, p.3. 36 Felicity Carlton, ‘The Kent and Sussex Labourers’ Union 1872-95,’ in Andrew Charlesworth, editor, An atlas of rural protest in Britain 1548-1900. London, 1983, pp.173-177; and AJHR Session 1, D1, 1879, p.8. 37 Rollo Arnold, The farthest promised land: English villagers, New Zealand immigrants of the 1870s. Wellington, 1981, p.206. See also Rollo D.Arnold, ‘The “Revolt of the Field” in Kent, 1872-1879,’ Past and present 64, 1974, pp.71-95. Alfred Simmons, the secretary of the Kent & Sussex Labourers’ Union accompanied a party of Kent emigrants on the Stad Haarlem which arrived at Lyttelton on 14 April 1879. Simmons, who gave the number in the party as 500, toured New Zealand before returning to Kent and writing his book Old England and New Zealand, published in London in 1879. Interestingly, Simmons observed (p.58) that ‘The time must come when free emigration [to New Zealand] should be permanently discontinued, and when the flow of people to the colony must be left
36
north of) Ireland, 16 in England and Wales, and 26 in Scotland.38 Further reductions
followed. From 1 September 1880 male ‘government emigrants’ were required to pay
£5 in advance,39 and emigrants were to be selected from the nominated list and from
other applications lodged. As unemployment and the numbers of men placed on
public works continued to rise, both assisted and nominated immigration were
suspended early in 1880 and the government looked increasingly to ‘spontaneous
emigration from the Home country’ to meet the colony’s needs. A modest
improvement in the colony’s economy during 1881-1882 did encourage the
government, in June 1881, re-introduce a limited system of nominated immigration,
and nominations for assistance grew sharply during the period from August 1882 to
June 1883. But as unemployment rose again during 1883 and popular feeling against
all assisted immigration strengthened,40 the government, increasingly anxious to try to
regulate the labour market, suspended, from 12 March 1884, nominated immigration.
The number of assisted immigrants arriving in New Zealand again fell to low levels,
while a major casualty was a proposed settlement of Scottish crofters, promoted as a
solution to the ‘Crofters’ War.’41
to their own resources’. See also Peter Brandon and Brian Short, The south east from AD 1000. London, 1990, pp.334-335. 38 AJHR D2, 1880, p.5. 39 AJHR D1, 1880, p.2. 40 See, for example, Otago Daily Times 5 January 1884 and 23 May 1884. See also C.B.K.Smithyman , Attitudes to immigration in New Zealand 1870-1900. MA Thesis, University of Auckland, 1971. p.70. In 1887, Walter Hazell (a member of the committee of the Self-Help Emigration Society) and Howard Hodgkin who, together with Hazell served on the committee of management of the Emigrants’ Information Office, visited New Zealand and were left in no doubt about the enduring opposition of trades unions to immigration. See Walter Hazell and Howard Hodgkin, The Australasian Colonies: emigration and colonisation. London, 1887, pp.16 and 29-31. Arthur Clayden, who lectured on emigration to New Zealand throughout the United Kingdom in 1879, noted that on his return to New Zealand in 1880 ‘I found myself the object of bitter attack on account of my efforts to promote English emigration. A portion of the press lent itself to the anti-immigration cry, and I could scarcely believe that that I have not done something unpatriotic in my emigration zeal.’ See Arthur Clayden, A popular handbook to New Zealand, its resources and industries. London, 1885, pp.7-8. 41 The origins of the Crofters’ War are discussed by H.J.Hanham, ‘The problem of Highland discontent, 1880-1885,’ Transactions of the Royal Historical Society, fifth series, 19, 1969, pp.21-65; J.P.D.Dunbabin, Rural discontent in nineteenth century Britain, London, 1974; and James Hunter, The making of the crofter community, Edinburgh, 1976. On the crofters and emigration, see Stuart Macdonald, ‘Crofter colonisation in Canada 1886-1892: the Scottish political background,’ Northern Scotland 7,1, 1986, pp.47-59; and Wayne Norton, ‘Malcolm MacNeill and the emigrationist alternative to Highland land reform, 1886-1893,’ Scottish historical review LXX,1, 188, April 1991, pp.16-30. For the New Zealand attempts to recruit crofters, see IM 1 1883/508, and IM 1 1884/53, and for examples of local opposition Otago Daily Times 27 February, 1 June, and 6 October 1885. The proposal was raised again on a number of occasions. See, for example, NZPD 53, 1885, p.869; AJHR D4, 1886, pp.7-8; IM 1, 1886/319; IM 1, 1887/77; Hansard CCCIII, 1886, columns 169-170; Otago Daily Times 18 September 1886; Report from the select committee on colonisation, BPP 1889.x.1; Report from the select committee on colonisation, BPP 1890.xii.1; Scottish Record Office AF 51/158, 1886-1889; New Zealand Herald 16 October 1888; Report from the select committee on colonisation, BPP 1890.xii.1;
37
1885-90: End of Assistance: While the New Zealand government faced mounting
pressure to restrict assisted immigration, in the United Kingdom a campaign for large-
scale state-financed emigration gathered momentum, especially during the second half
of the 1880s as recession deepened and unemployment rose alarmingly. In England,
numerous emigration associations were established to assist various categories of
persons to emigrate, while a number of trade unions actively assisted members to
emigrate.42 Always wary of ‘pauper emigration,’ New Zealand’s response to
proposals to assist the unemployed to emigrate was distinctly cool, as was its response
to ‘a well-considered and practicable scheme’ of state colonisation prepared by a
‘Colonisation Committee’ made up of members from both houses of the imperial
parliament.43 The New Zealand government also made it clear that, despite the
support of the Governor, it would not endorse emigration proposals advanced in 1891
by the founder of the Salvation Army.44 Rather, it moved further to restrict
immigration, issuing new regulations governing nominated immigration which raised
advance payments to £10 per adult, and restricting nominations ‘to agricultural
labourers and single women suitable for domestic service.’ At the same time, passages
were made available for ‘a limited number of persons who may be desirous of taking
up land in New Zealand,’ but applicants had to possess at least £100 in cash, plus a
further £50 for every member of his family over 14 years of age. By the time the latter
scheme ended in January 1888, 395 persons – farmers and their families – had arrived
in New Zealand, together with an estimated £44 000 in capital.45 Nominated
Report from the select committee on colonisation, BPP 1890-1891.xi.571; and W.A.Carrothers, Emigration from the British Isles, with special reference to the development of the overseas dominions. London, 1929, p.228. 42 Howard L.Malchow, Population pressures: emigration and government in late nineteenth-century Britain. Palo Alto, 1979, p.131. On the trade unions and emigration, see Charlotte Erickson, ‘The encouragement of emigration by British trade unions, 1850-1900,’ Population studies 3, 1949, 248-273; R.V.Clements, Trade unions and emigration, 1840-1880,’ Population studies 9, 1955, 167-180; Pamela Horn, ‘Agricultural trade unionism and emigration, 1872-1881,’ Historical journal 15, March 1972, 87-102; and Howard L.Malchow, ‘Trade unions and emigration in late Victorian England: a national lobby for state aid,’ Journal of British studies 15, 2, 1976, pp.92-116. 43 See AJHR A1 and A2, 1888, and A1, 1889; Copy of the correspondence from colonial governments in answer to the memorandum by the parliamentary colonisation committee of the 1st day of May 1888, and sent to colonial governments for their consideration and opinion through Lord Knutsford, during the session of 1888, BPP 1889.lv.1; Report from the select committee on colonisation BPP 1890.xii.1; and Report from the select committee on colonisation BPP 1890-91.xi.571. 44 AJHR H26, 1892, p.1. See also New Zealand Times 15 February 1892; and Press 15, 18 and 27 February and 31 May 1892. 45 AJHR D7, 1893, p.2.
38
immigration was discontinued on 22 December 1887,46 and in May 1888 nominees
were informed that their nominations would lapse if not acted on by 17 August of that
year. On 16 December 1890, the new Liberal Ministry announced that the
immigration vote had been expended and that no further liabilities for assisted
passages would be undertaken,47 thus finally bringing to an end the third major wave
of British immigrants to arrive in New Zealand.
The following discussion focuses on the assisted migrant flow from England and
Wales during the period 1871-1888, that is, the years for which assisted passenger
lists are available, and is based on three random samples drawn from those lists, of
family groups, single men and single women.48 Reflecting the changes in the
provision of assistance, the assisted immigrants arrived in three influxes of decreasing
magnitude, the first and largest in 1874-1875, the second in 1878-1879, and the third
and smallest in 1883-1884. The arrival of families and single men followed the same
pattern: thus 52.6 per cent of all families and 43.5 per cent of single men arrived in
the two years 1874 and 1875. On the other hand, the arrival of single women was
rather more evenly spread through the entire period 1871-1888, a considerably larger
proportion arriving during the years of the last sizeable influx, 1883-1884.
Nomination:
Table 21: Persons nominated and arrived in New Zealand, 1871 - 1881 Period Persons
nominated Nominees who arrived
Proportion
To 30 June 1873 4 335 1 166 26.9 Year to 30 June 1874 16 572 1 729 10.4 Year to 30 June 1875 9 870 3 451 35.0 46 See NZPD 43, 1888, pp.188-189. 47 Press 19 December 1890. 48 Single men and women travelling as members of their families are included for the purposes of this analysis in their family groups. The categories ‘single men’ and ‘single women’ thus include those who were travelling alone or with a sibling or siblings or other relatives, but not with parents. It is worthwhile noting that there is evidence to suggest that assisted immigrants, anxious to meet the qualifying criteria, did not always represent accurately details of occupation and age. Australian historians of immigration encounter the same problem. See, for example, Patricia Lay, ‘Not what they seemed? Cornish assisted immigrants in New South Wales 1833-77,’ Cornish studies, series 2, (No.3), 1995, pp.33-59. Lay drew a sample of 390 assisted Cornish immigrants who arrived in New South Wales between 1838 and 1857 and, after comparing reported with actual backgrounds, concluded that many had falsified or exaggerated their occupations and ages, and, occasionally, religious affiliation.
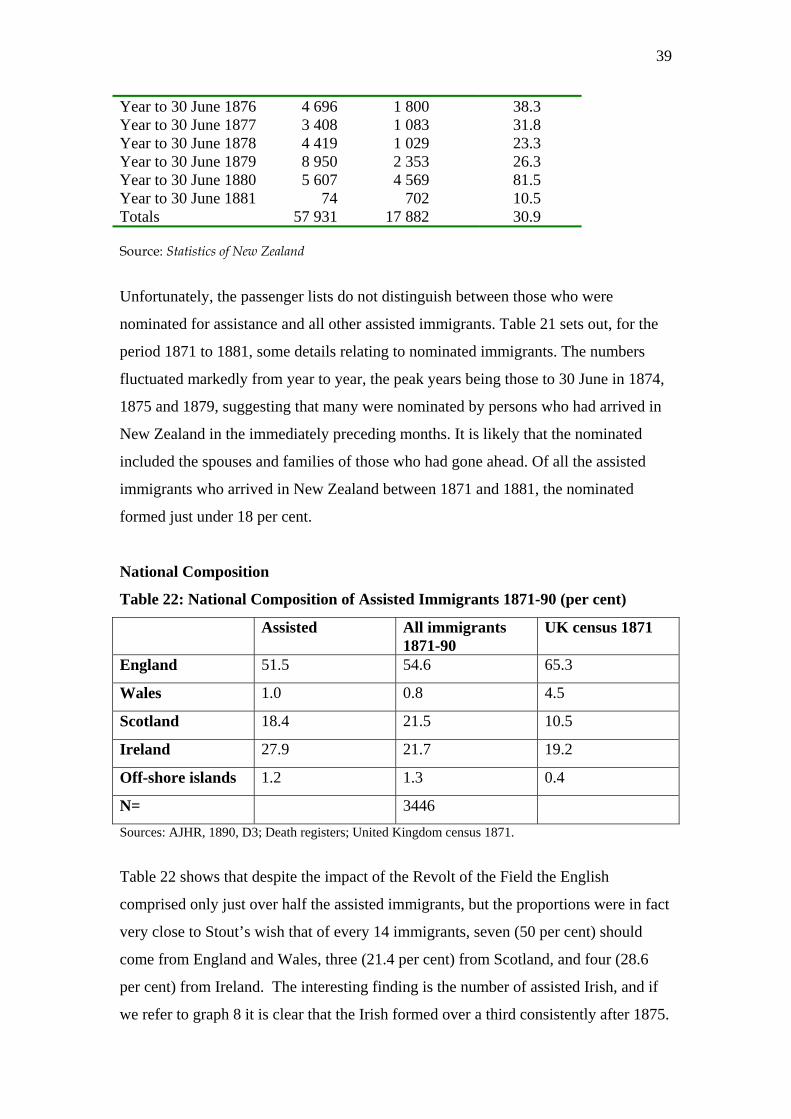
39
Year to 30 June 1876 4 696 1 800 38.3 Year to 30 June 1877 3 408 1 083 31.8 Year to 30 June 1878 4 419 1 029 23.3 Year to 30 June 1879 8 950 2 353 26.3 Year to 30 June 1880 5 607 4 569 81.5 Year to 30 June 1881 74 702 10.5 Totals 57 931 17 882 30.9 Source: Statistics of New Zealand
Unfortunately, the passenger lists do not distinguish between those who were
nominated for assistance and all other assisted immigrants. Table 21 sets out, for the
period 1871 to 1881, some details relating to nominated immigrants. The numbers
fluctuated markedly from year to year, the peak years being those to 30 June in 1874,
1875 and 1879, suggesting that many were nominated by persons who had arrived in
New Zealand in the immediately preceding months. It is likely that the nominated
included the spouses and families of those who had gone ahead. Of all the assisted
immigrants who arrived in New Zealand between 1871 and 1881, the nominated
formed just under 18 per cent.
National Composition
Table 22: National Composition of Assisted Immigrants 1871-90 (per cent)
Assisted All immigrants 1871-90
UK census 1871
England 51.5 54.6 65.3
Wales 1.0 0.8 4.5
Scotland 18.4 21.5 10.5
Ireland 27.9 21.7 19.2
Off-shore islands 1.2 1.3 0.4
N= 3446 Sources: AJHR, 1890, D3; Death registers; United Kingdom census 1871.
Table 22 shows that despite the impact of the Revolt of the Field the English
comprised only just over half the assisted immigrants, but the proportions were in fact
very close to Stout’s wish that of every 14 immigrants, seven (50 per cent) should
come from England and Wales, three (21.4 per cent) from Scotland, and four (28.6
per cent) from Ireland. The interesting finding is the number of assisted Irish, and if
we refer to graph 8 it is clear that the Irish formed over a third consistently after 1875.
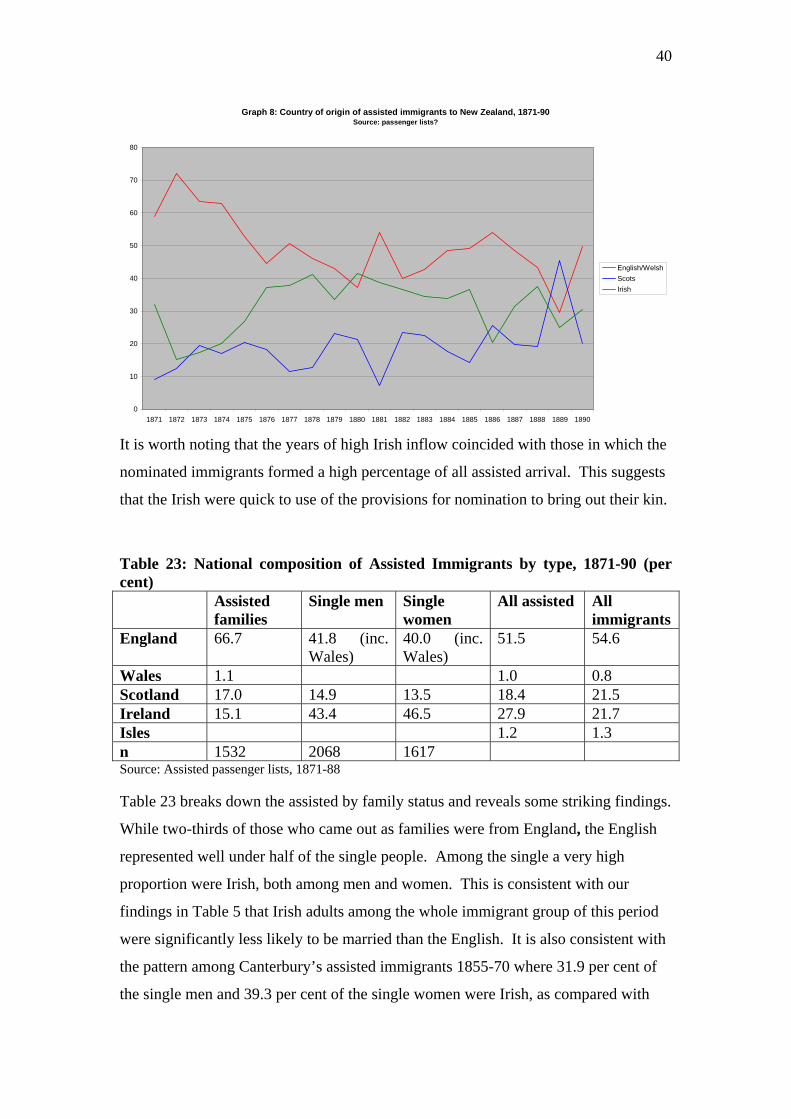
40
Graph 8: Country of origin of assisted immigrants to New Zealand, 1871-90Source: passenger lists?
0
10
20
30
40
50
60
70
80
1871 1872 1873 1874 1875 1876 1877 1878 1879 1880 1881 1882 1883 1884 1885 1886 1887 1888 1889 1890
English/WelshScotsIrish
It is worth noting that the years of high Irish inflow coincided with those in which the
nominated immigrants formed a high percentage of all assisted arrival. This suggests
that the Irish were quick to use of the provisions for nomination to bring out their kin.
Table 23: National composition of Assisted Immigrants by type, 1871-90 (per cent) Assisted
families Single men Single
women All assisted All
immigrants England 66.7 41.8 (inc.
Wales) 40.0 (inc. Wales)
51.5 54.6
Wales 1.1 1.0 0.8 Scotland 17.0 14.9 13.5 18.4 21.5 Ireland 15.1 43.4 46.5 27.9 21.7 Isles 1.2 1.3 n 1532 2068 1617 Source: Assisted passenger lists, 1871-88 Table 23 breaks down the assisted by family status and reveals some striking findings.
While two-thirds of those who came out as families were from England, the English
represented well under half of the single people. Among the single a very high
proportion were Irish, both among men and women. This is consistent with our
findings in Table 5 that Irish adults among the whole immigrant group of this period
were significantly less likely to be married than the English. It is also consistent with
the pattern among Canterbury’s assisted immigrants 1855-70 where 31.9 per cent of
the single men and 39.3 per cent of the single women were Irish, as compared with
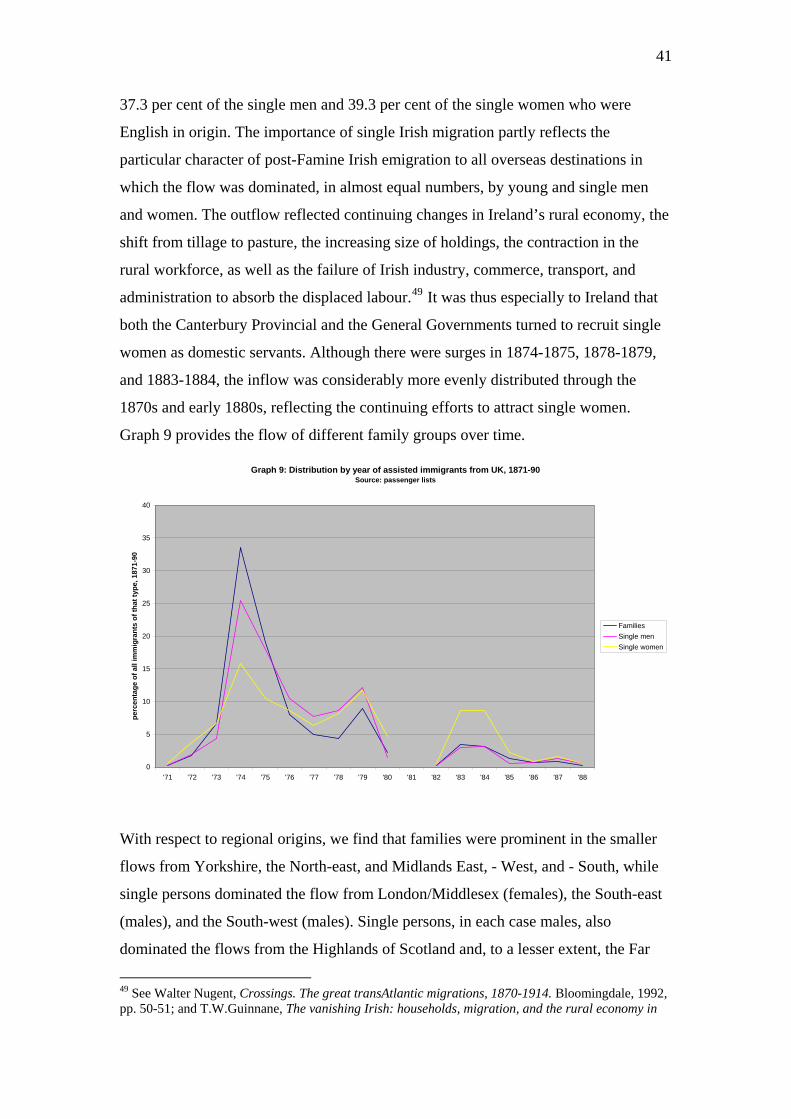
41
37.3 per cent of the single men and 39.3 per cent of the single women who were
English in origin. The importance of single Irish migration partly reflects the
particular character of post-Famine Irish emigration to all overseas destinations in
which the flow was dominated, in almost equal numbers, by young and single men
and women. The outflow reflected continuing changes in Ireland’s rural economy, the
shift from tillage to pasture, the increasing size of holdings, the contraction in the
rural workforce, as well as the failure of Irish industry, commerce, transport, and
administration to absorb the displaced labour.49 It was thus especially to Ireland that
both the Canterbury Provincial and the General Governments turned to recruit single
women as domestic servants. Although there were surges in 1874-1875, 1878-1879,
and 1883-1884, the inflow was considerably more evenly distributed through the
1870s and early 1880s, reflecting the continuing efforts to attract single women.
Graph 9 provides the flow of different family groups over time.
Graph 9: Distribution by year of assisted immigrants from UK, 1871-90Source: passenger lists
0
5
10
15
20
25
30
35
40
'71 '72 '73 '74 '75 '76 '77 '78 '79 '80 '81 '82 '83 '84 '85 '86 '87 '88
perc
enta
ge o
f all
imm
igra
nts
of th
at ty
pe, 1
871-
90
FamiliesSingle menSingle women
With respect to regional origins, we find that families were prominent in the smaller
flows from Yorkshire, the North-east, and Midlands East, - West, and - South, while
single persons dominated the flow from London/Middlesex (females), the South-east
(males), and the South-west (males). Single persons, in each case males, also
dominated the flows from the Highlands of Scotland and, to a lesser extent, the Far
49 See Walter Nugent, Crossings. The great transAtlantic migrations, 1870-1914. Bloomingdale, 1992, pp. 50-51; and T.W.Guinnane, The vanishing Irish: households, migration, and the rural economy in
42
North. Among the Irish, the inflows from Connacht and Munster were dominated by
single males and single females. The inflow from Ulster contained a considerably
higher proportion who were married, and indeed over half (55.9 per cent) of all
assisted Irish families came from Ulster. Such results accord with Fitzpatrick’s
observation that the Ulster emigrant stream of the period 1871-1921 was
distinguished, in part, by ‘its frequent organisation in family groups.’50
Assisted – Family Type
Table 24: Distribution of family types, assisted family arrivals, 1871-1888, and Canterbury assisted families, 1855-1870 Family type English/
Welsh Scots Irish Total Canterbury
1855-1870 Married, without children 20.0 17.2 27.2 20.6 28.8 Married, with children 75.5 77.4 65.5 74.3 68.2 Married, with children, spouse absent 4.5 5.4 7.3 5.1 3.0 100.0 100.0 100.0 100.0 100.0 n= 1 039 261 232 1 532 1 014 Source: Canterbury assisted passenger lists, 1855-1870, and New Zealand assisted passenger lists, 1871-1888. Table 24 makes clear that childless couples were not a hugely significant part of the
flow, and considerably less so than in the case of Canterbury’s assisted. Recruitment
was particularly of established families. Interestingly the Irish had a higher number of
childless couples than the other nationalities, while the Scots were most likely to have
children. The 5.1 per cent classified as ‘married, with children, spouse absent,’
consisted largely of wives and children joining husbands who had previously
migrated to New Zealand, including some who had arrived on the goldfields during
the 1860s.
Table 25: Stages in the family life cycle, assisted families, 1871-1888, and Canterbury assisted families, 1855-1870. Family life cycle stages English/
Welsh Scots Irish Total Total
Canterbury 1855-1870
Ireland, 1850-1914. Princeton, 1997. 50 David Fitzpatrick, ‘Emigration 1871-1921,’ in W.E.Vaughan, editor, A new history of Ireland, Volume VI. Ireland under the union II, 1870-1921. Oxford, 1996, p. 614.
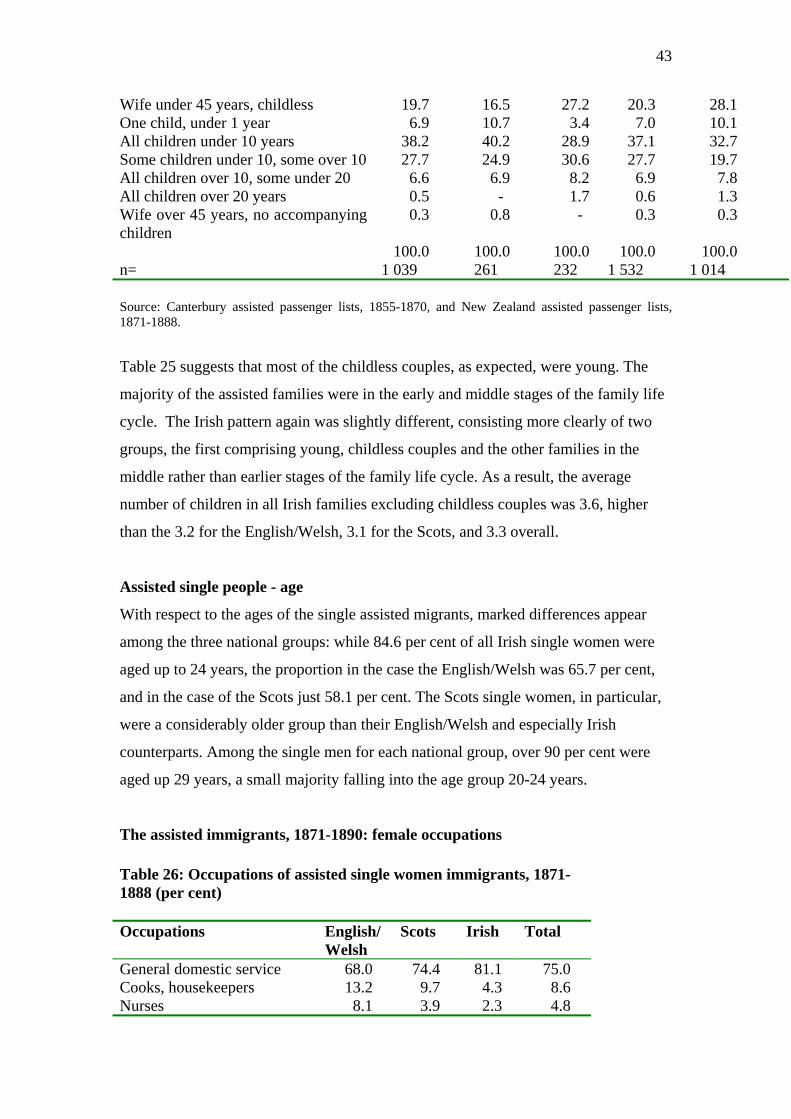
43
Wife under 45 years, childless 19.7 16.5 27.2 20.3 28.1 One child, under 1 year 6.9 10.7 3.4 7.0 10.1 All children under 10 years 38.2 40.2 28.9 37.1 32.7 Some children under 10, some over 10 27.7 24.9 30.6 27.7 19.7 All children over 10, some under 20 6.6 6.9 8.2 6.9 7.8 All children over 20 years 0.5 - 1.7 0.6 1.3 Wife over 45 years, no accompanying children
0.3 0.8 - 0.3 0.3
100.0 100.0 100.0 100.0 100.0 n= 1 039 261 232 1 532 1 014 Source: Canterbury assisted passenger lists, 1855-1870, and New Zealand assisted passenger lists, 1871-1888.
Table 25 suggests that most of the childless couples, as expected, were young. The
majority of the assisted families were in the early and middle stages of the family life
cycle. The Irish pattern again was slightly different, consisting more clearly of two
groups, the first comprising young, childless couples and the other families in the
middle rather than earlier stages of the family life cycle. As a result, the average
number of children in all Irish families excluding childless couples was 3.6, higher
than the 3.2 for the English/Welsh, 3.1 for the Scots, and 3.3 overall.
Assisted single people - age
With respect to the ages of the single assisted migrants, marked differences appear
among the three national groups: while 84.6 per cent of all Irish single women were
aged up to 24 years, the proportion in the case the English/Welsh was 65.7 per cent,
and in the case of the Scots just 58.1 per cent. The Scots single women, in particular,
were a considerably older group than their English/Welsh and especially Irish
counterparts. Among the single men for each national group, over 90 per cent were
aged up 29 years, a small majority falling into the age group 20-24 years.
The assisted immigrants, 1871-1890: female occupations Table 26: Occupations of assisted single women immigrants, 1871- 1888 (per cent) Occupations English/
Welsh Scots Irish Total
General domestic service 68.0 74.4 81.1 75.0 Cooks, housekeepers 13.2 9.7 4.3 8.6 Nurses 8.1 3.9 2.3 4.8
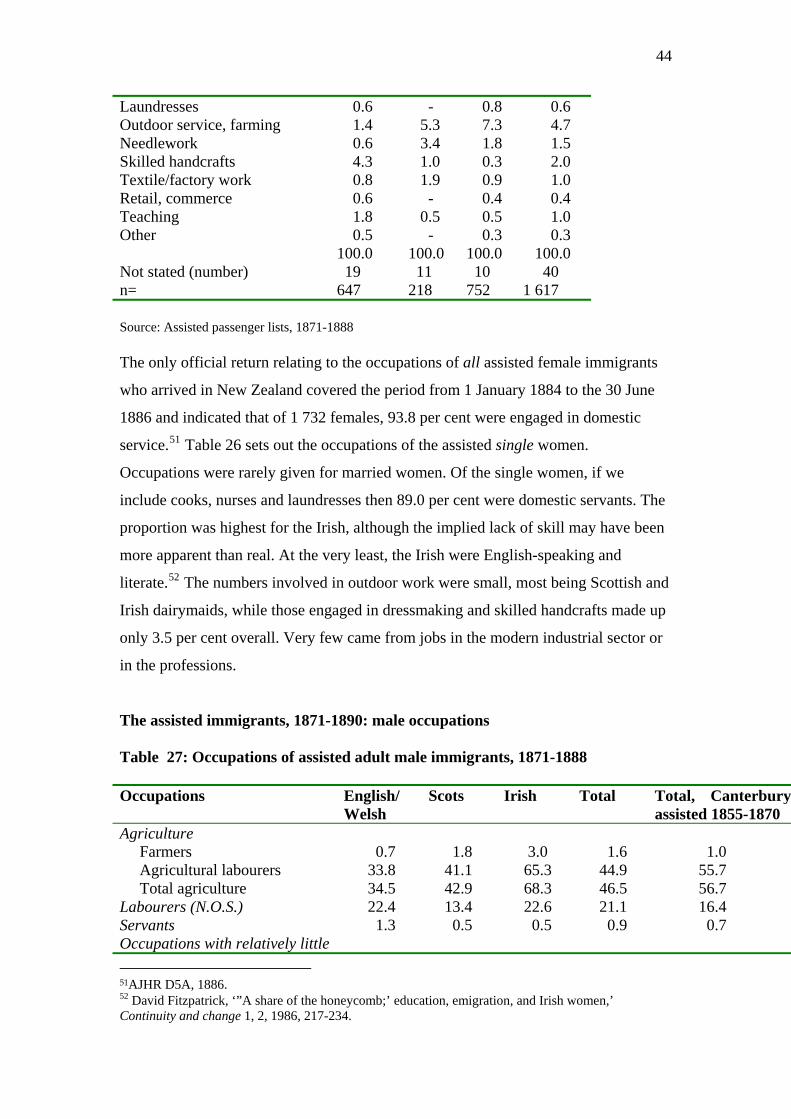
44
Laundresses 0.6 - 0.8 0.6 Outdoor service, farming 1.4 5.3 7.3 4.7 Needlework 0.6 3.4 1.8 1.5 Skilled handcrafts 4.3 1.0 0.3 2.0 Textile/factory work 0.8 1.9 0.9 1.0 Retail, commerce 0.6 - 0.4 0.4 Teaching 1.8 0.5 0.5 1.0 Other 0.5 - 0.3 0.3 100.0 100.0 100.0 100.0 Not stated (number) 19 11 10 40 n= 647 218 752 1 617 Source: Assisted passenger lists, 1871-1888 The only official return relating to the occupations of all assisted female immigrants
who arrived in New Zealand covered the period from 1 January 1884 to the 30 June
1886 and indicated that of 1 732 females, 93.8 per cent were engaged in domestic
service.51 Table 26 sets out the occupations of the assisted single women.
Occupations were rarely given for married women. Of the single women, if we
include cooks, nurses and laundresses then 89.0 per cent were domestic servants. The
proportion was highest for the Irish, although the implied lack of skill may have been
more apparent than real. At the very least, the Irish were English-speaking and
literate.52 The numbers involved in outdoor work were small, most being Scot
Irish dairymaids, while those engaged in dressmaking and skilled handcrafts made up
only 3.5 per cent overall. Very few came from jobs in the modern industrial sector or
in the profess
tish and
ions.
The assisted immigrants, 1871-1890: male occupations Table 27: Occupations of assisted adult male immigrants, 1871-1888 Occupations English/
Welsh Scots Irish Total Total, Canterbury
assisted 1855-1870 Agriculture Farmers 0.7 1.8 3.0 1.6 1.0 Agricultural labourers 33.8 41.1 65.3 44.9 55.7 Total agriculture 34.5 42.9 68.3 46.5 56.7 Labourers (N.O.S.) 22.4 13.4 22.6 21.1 16.4 Servants 1.3 0.5 0.5 0.9 0.7 Occupations with relatively little 51AJHR D5A, 1886. 52 David Fitzpatrick, ‘”A share of the honeycomb;’ education, emigration, and Irish women,’ Continuity and change 1, 2, 1986, 217-234.
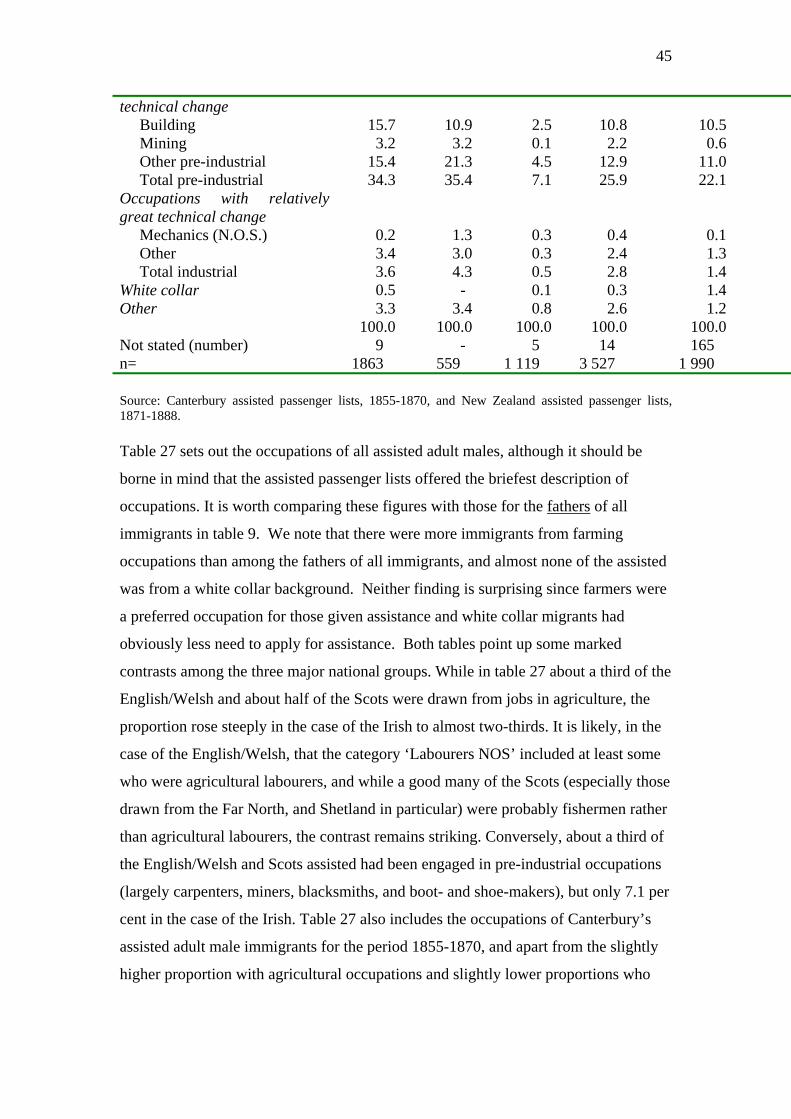
45
technical change Building 15.7 10.9 2.5 10.8 10.5 Mining 3.2 3.2 0.1 2.2 0.6 Other pre-industrial 15.4 21.3 4.5 12.9 11.0 Total pre-industrial 34.3 35.4 7.1 25.9 22.1 Occupations with relatively great technical change
Mechanics (N.O.S.) 0.2 1.3 0.3 0.4 0.1 Other 3.4 3.0 0.3 2.4 1.3 Total industrial 3.6 4.3 0.5 2.8 1.4 White collar 0.5 - 0.1 0.3 1.4 Other 3.3 3.4 0.8 2.6 1.2 100.0 100.0 100.0 100.0 100.0 Not stated (number) 9 - 5 14 165 n= 1863 559 1 119 3 527 1 990 Source: Canterbury assisted passenger lists, 1855-1870, and New Zealand assisted passenger lists, 1871-1888. Table 27 sets out the occupations of all assisted adult males, although it should be
borne in mind that the assisted passenger lists offered the briefest description of
occupations. It is worth comparing these figures with those for the fathers of all
immigrants in table 9. We note that there were more immigrants from farming
occupations than among the fathers of all immigrants, and almost none of the assisted
was from a white collar background. Neither finding is surprising since farmers were
a preferred occupation for those given assistance and white collar migrants had
obviously less need to apply for assistance. Both tables point up some marked
contrasts among the three major national groups. While in table 27 about a third of the
English/Welsh and about half of the Scots were drawn from jobs in agriculture, the
proportion rose steeply in the case of the Irish to almost two-thirds. It is likely, in the
case of the English/Welsh, that the category ‘Labourers NOS’ included at least some
who were agricultural labourers, and while a good many of the Scots (especially those
drawn from the Far North, and Shetland in particular) were probably fishermen rather
than agricultural labourers, the contrast remains striking. Conversely, about a third of
the English/Welsh and Scots assisted had been engaged in pre-industrial occupations
(largely carpenters, miners, blacksmiths, and boot- and shoe-makers), but only 7.1 per
cent in the case of the Irish. Table 27 also includes the occupations of Canterbury’s
assisted adult male immigrants for the period 1855-1870, and apart from the slightly
higher proportion with agricultural occupations and slightly lower proportions who
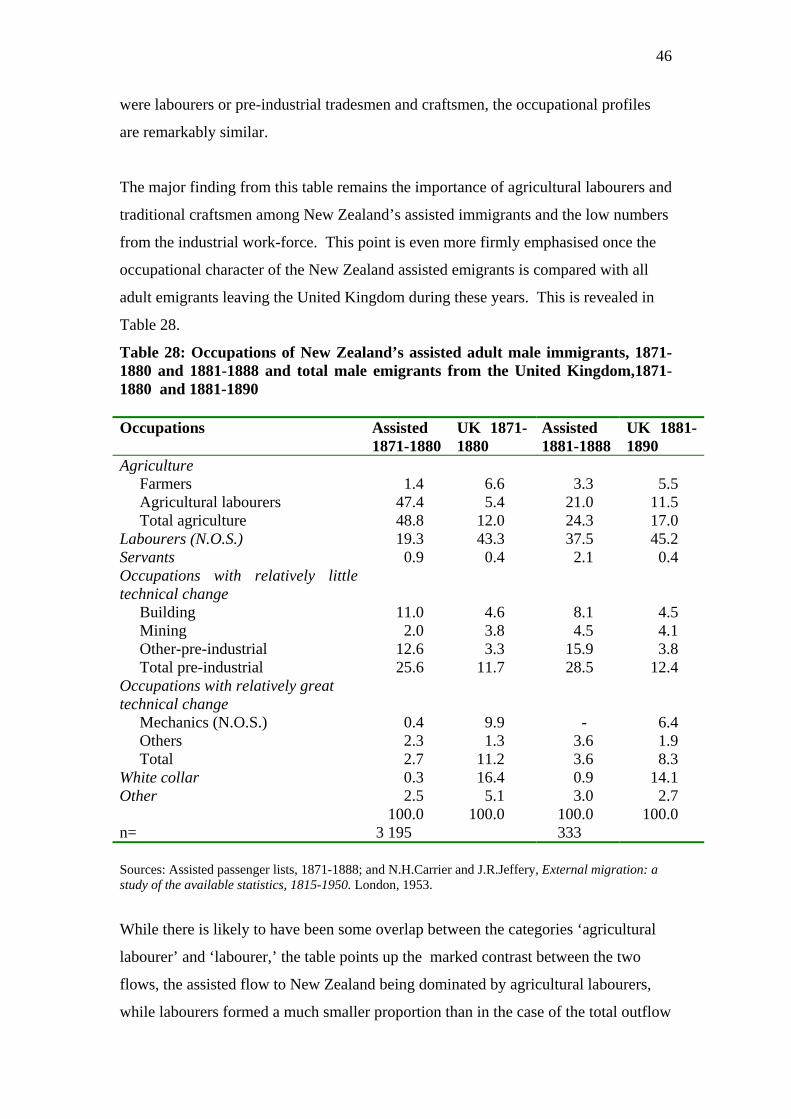
46
were labourers or pre-industrial tradesmen and craftsmen, the occupational profiles
are remarkably similar.
The major finding from this table remains the importance of agricultural labourers and
traditional craftsmen among New Zealand’s assisted immigrants and the low numbers
from the industrial work-force. This point is even more firmly emphasised once the
occupational character of the New Zealand assisted emigrants is compared with all
adult emigrants leaving the United Kingdom during these years. This is revealed in
Table 28.
Table 28: Occupations of New Zealand’s assisted adult male immigrants, 1871-1880 and 1881-1888 and total male emigrants from the United Kingdom,1871-1880 and 1881-1890 Occupations Assisted
1871-1880 UK 1871-1880
Assisted 1881-1888
UK 1881-1890
Agriculture Farmers 1.4 6.6 3.3 5.5 Agricultural labourers 47.4 5.4 21.0 11.5 Total agriculture 48.8 12.0 24.3 17.0 Labourers (N.O.S.) 19.3 43.3 37.5 45.2 Servants 0.9 0.4 2.1 0.4 Occupations with relatively little technical change
Building 11.0 4.6 8.1 4.5 Mining 2.0 3.8 4.5 4.1 Other-pre-industrial 12.6 3.3 15.9 3.8 Total pre-industrial 25.6 11.7 28.5 12.4 Occupations with relatively great technical change Mechanics (N.O.S.) 0.4 9.9 - 6.4 Others 2.3 1.3 3.6 1.9 Total 2.7 11.2 3.6 8.3 White collar 0.3 16.4 0.9 14.1 Other 2.5 5.1 3.0 2.7 100.0 100.0 100.0 100.0 n= 3 195 333 Sources: Assisted passenger lists, 1871-1888; and N.H.Carrier and J.R.Jeffery, External migration: a study of the available statistics, 1815-1950. London, 1953.
While there is likely to have been some overlap between the categories ‘agricultural
labourer’ and ‘labourer,’ the table points up the marked contrast between the two
flows, the assisted flow to New Zealand being dominated by agricultural labourers,
while labourers formed a much smaller proportion than in the case of the total outflow
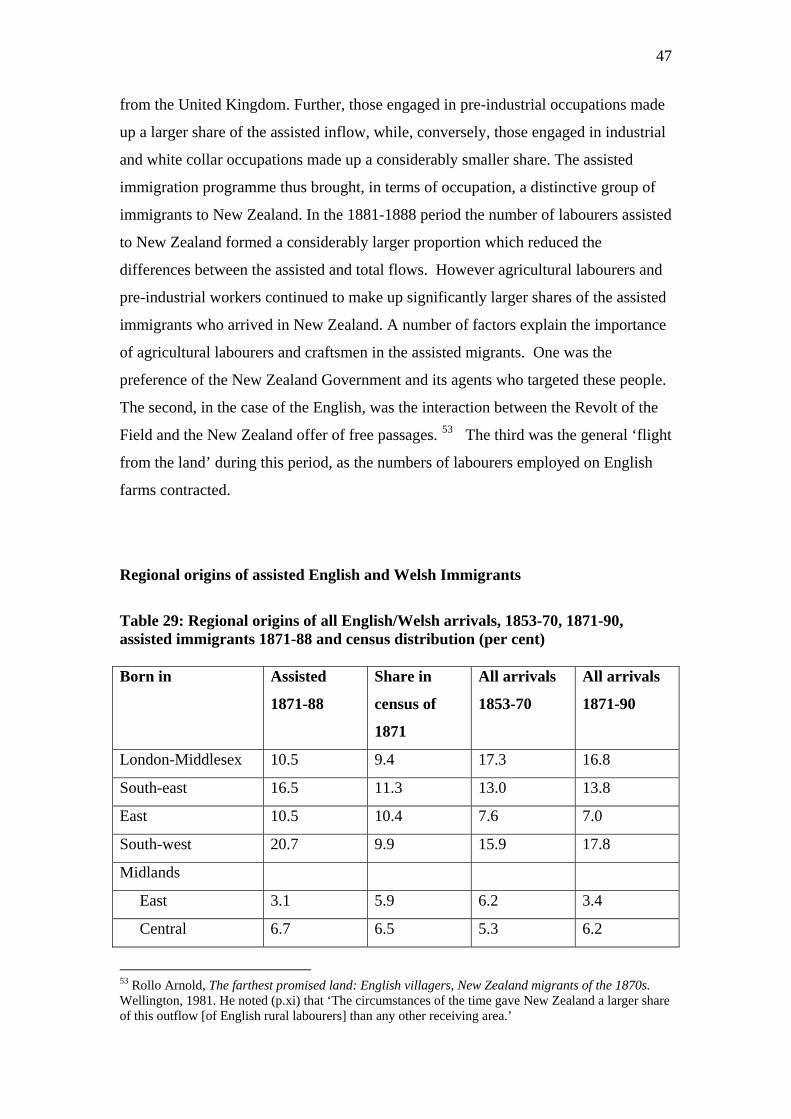
47
from the United Kingdom. Further, those engaged in pre-industrial occupations made
up a larger share of the assisted inflow, while, conversely, those engaged in industrial
and white collar occupations made up a considerably smaller share. The assisted
immigration programme thus brought, in terms of occupation, a distinctive group of
immigrants to New Zealand. In the 1881-1888 period the number of labourers assisted
to New Zealand formed a considerably larger proportion which reduced the
differences between the assisted and total flows. However agricultural labourers and
pre-industrial workers continued to make up significantly larger shares of the assisted
immigrants who arrived in New Zealand. A number of factors explain the importance
of agricultural labourers and craftsmen in the assisted migrants. One was the
preference of the New Zealand Government and its agents who targeted these people.
The second, in the case of the English, was the interaction between the Revolt of the
Field and the New Zealand offer of free passages. 53 The third was the general ‘flight
from the land’ during this period, as the numbers of labourers employed on English
farms contracted.
Regional origins of assisted English and Welsh Immigrants
Table 29: Regional origins of all English/Welsh arrivals, 1853-70, 1871-90, assisted immigrants 1871-88 and census distribution (per cent) Born in Assisted
1871-88
Share in
census of
1871
All arrivals
1853-70
All arrivals
1871-90
London-Middlesex 10.5 9.4 17.3 16.8
South-east 16.5 11.3 13.0 13.8
East 10.5 10.4 7.6 7.0
South-west 20.7 9.9 15.9 17.8
Midlands
East 3.1 5.9 6.2 3.4
Central 6.7 6.5 5.3 6.2
53 Rollo Arnold, The farthest promised land: English villagers, New Zealand migrants of the 1870s. Wellington, 1981. He noted (p.xi) that ‘The circumstances of the time gave New Zealand a larger share of this outflow [of English rural labourers] than any other receiving area.’
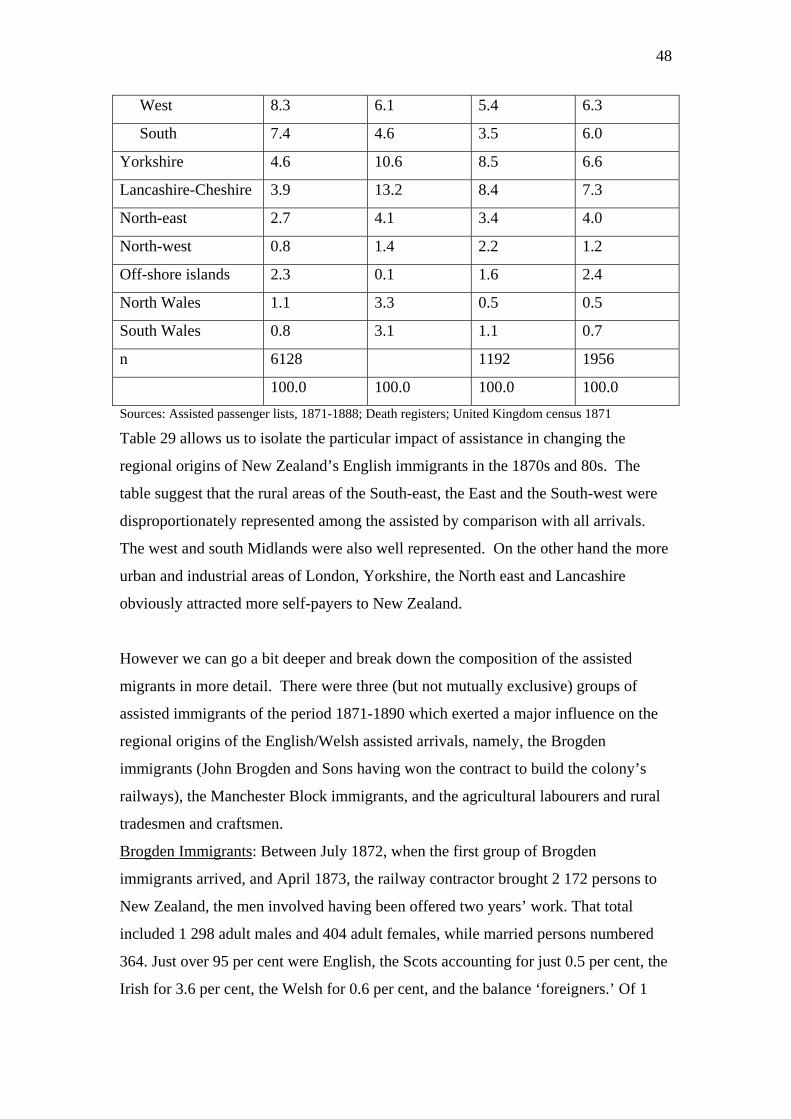
48
West 8.3 6.1 5.4 6.3
South 7.4 4.6 3.5 6.0
Yorkshire 4.6 10.6 8.5 6.6
Lancashire-Cheshire 3.9 13.2 8.4 7.3
North-east 2.7 4.1 3.4 4.0
North-west 0.8 1.4 2.2 1.2
Off-shore islands 2.3 0.1 1.6 2.4
North Wales 1.1 3.3 0.5 0.5
South Wales 0.8 3.1 1.1 0.7
n 6128 1192 1956
100.0 100.0 100.0 100.0 Sources: Assisted passenger lists, 1871-1888; Death registers; United Kingdom census 1871 Table 29 allows us to isolate the particular impact of assistance in changing the
regional origins of New Zealand’s English immigrants in the 1870s and 80s. The
table suggest that the rural areas of the South-east, the East and the South-west were
disproportionately represented among the assisted by comparison with all arrivals.
The west and south Midlands were also well represented. On the other hand the more
urban and industrial areas of London, Yorkshire, the North east and Lancashire
obviously attracted more self-payers to New Zealand.
However we can go a bit deeper and break down the composition of the assisted
migrants in more detail. There were three (but not mutually exclusive) groups of
assisted immigrants of the period 1871-1890 which exerted a major influence on the
regional origins of the English/Welsh assisted arrivals, namely, the Brogden
immigrants (John Brogden and Sons having won the contract to build the colony’s
railways), the Manchester Block immigrants, and the agricultural labourers and rural
tradesmen and craftsmen.
Brogden Immigrants: Between July 1872, when the first group of Brogden
immigrants arrived, and April 1873, the railway contractor brought 2 172 persons to
New Zealand, the men involved having been offered two years’ work. That total
included 1 298 adult males and 404 adult females, while married persons numbered
364. Just over 95 per cent were English, the Scots accounting for just 0.5 per cent, the
Irish for 3.6 per cent, the Welsh for 0.6 per cent, and the balance ‘foreigners.’ Of 1

49
212 adult males, most were drawn from the south and south-west of England, 30.5
per cent from London-Middlesex, 16.9 per cent from Cornwall, 11.4 per cent from
Warwickshire, and 11.1 per cent from Sussex, with smaller groups from Devon,
Wiltshire, Cumberland, and Berkshire. Preference was given to men who had been
brought up to farming work: 444 were farm labourers while a further 339 were
‘labourers mostly brought up to farm work.’ Only 284 were navvies, while 64 were
miners and quarrymen, 58 were drawn from the building trades, and 49 were
described as ‘general labourers.’54
Manchester Block settlers: The second group comprised those who were settled on the
Manchester Block in the Feilding district by the Emigrants’ and Colonists’ Aid
Corporation, one of a number of ‘special settlements’ established during the period.55
Formed in England in 1867, the corporation, an English association under the
patronage of the Duke of Manchester, set out to relieve distress in Britain by fostering
emigration to the colonies.56 By terms of an agreement concluded with the New
Zealand government in December 1871, the corporation purchased 106 000 acres in
the Manawatu, eventually known as the Manchester Block. It also undertook to place
upon the land 2 000 settlers before 1 April 1877, while the government meeting
passage costs of up to £15 per immigrant from the port of embarkation and providing
initial employment on public works.57 The first party reached New Zealand by the
Duke of Edinburgh in January 1874, and so began what Davies and Clevely described
54 See AJHR D1B, 1872; D2D, 1873; and AJHR D4, 1873. The last indicates that 14 ships brought 2 118 Brogden immigrants to New Zealand, among them 1 295 adult males and just 370 adult females. It is interesting to note that it was once contemplated that Brogdens would introduce at least 10 000 immigrants in ten years. See AJHR D2C, 1873, pp.4-6. 55 The other settlements included one on Stewart Island, but while Macandrew, sought 1 000 families, an advance party numbered just 24 Shetland Islanders, and by August 1874 they had all departed. Settlements were established at Karamea in 1874 and at Jackson’s Bay in 1875, the latter in particular being used largely as a dumping-ground for arrivals of various nationalities who were otherwise proving difficult to absorb. 56 In 1888 renamed the Colonists’ Land and Loan Corporation. For general background, see T.A.Gibson, The purchase and settlement of the Manchester Block: an account of the development of the Feilding district, New Zealand. Feilding, 1936; and D.A.Davies and R.E. Clevely, Pioneering to prosperity 1874-1974: a centennial history of the Manchester Block. Feilding, 1981. See also Rollo Arnold, The farthest promised land: English villagers, New Zealand immigrants of the 1870s. Wellington, 1981, pp.87 and 158. 57 A copy of the Deed of Agreement was published in AJHR D11,1872, pp.5-6. See also AJHR D11A, 1872. See also Report by Mr Halcombe on the progress made by the Emigrants’ and Colonists’ Aid Corporation in the colonisation of the Manchester Block, Manawatu, in Journals, Wellington Provincial Council, Session 27, 1874, Council Paper C.No.7. See also Pamela Matthews, The Halcombes and the early settlement of Feilding. MA Thesis, Massey University, 1987, p.43. On Halcombe, the corporation’s New Zealand agent, see The dictionary of New Zealand biography, Volume II, 1870-1900. Wellington, 1993, pp.184.
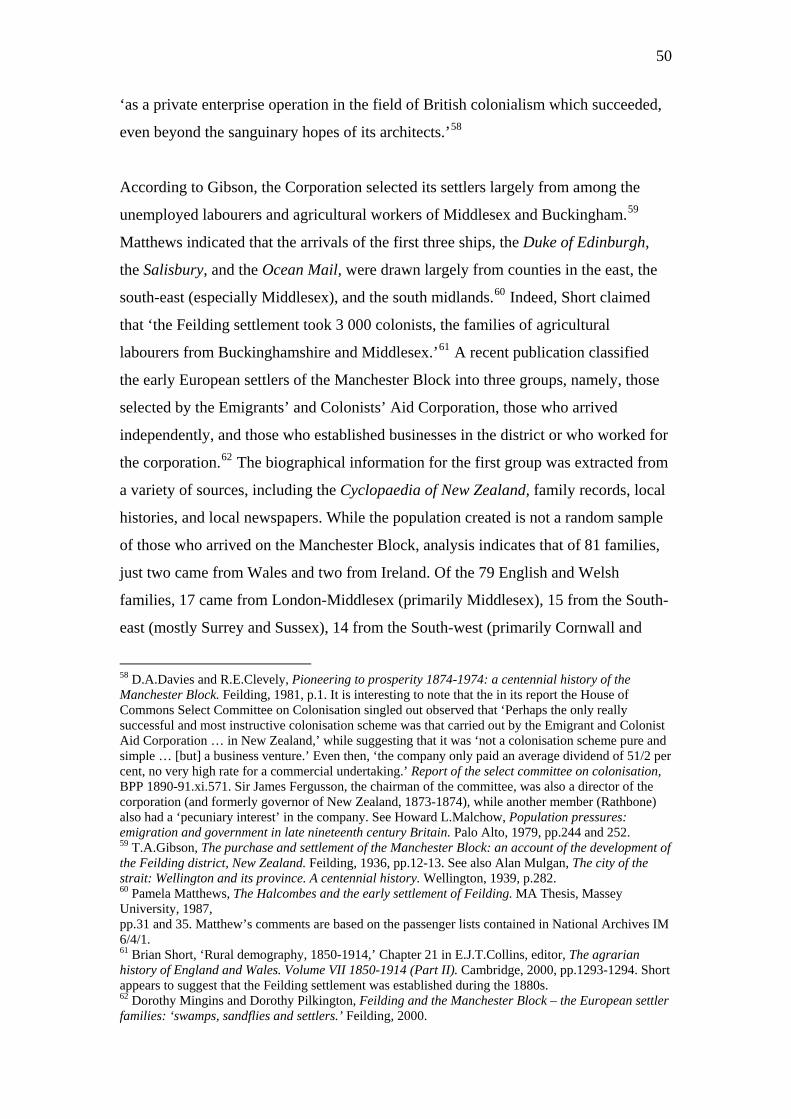
50
‘as a private enterprise operation in the field of British colonialism which succeeded,
even beyond the sanguinary hopes of its architects.’58
According to Gibson, the Corporation selected its settlers largely from among the
unemployed labourers and agricultural workers of Middlesex and Buckingham.59
Matthews indicated that the arrivals of the first three ships, the Duke of Edinburgh,
the Salisbury, and the Ocean Mail, were drawn largely from counties in the east, the
south-east (especially Middlesex), and the south midlands.60 Indeed, Short claimed
that ‘the Feilding settlement took 3 000 colonists, the families of agricultural
labourers from Buckinghamshire and Middlesex.’61 A recent publication classified
the early European settlers of the Manchester Block into three groups, namely, tho
selected by the Emigrants’ and Colonists’ Aid Corporation, those who arrived
independently, and those who established businesses in the district or who worked for
the corporation.
se
62 The biographical information for the first group was extracted from
a variety of sources, including the Cyclopaedia of New Zealand, family records, local
histories, and local newspapers. While the population created is not a random sample
of those who arrived on the Manchester Block, analysis indicates that of 81 families,
just two came from Wales and two from Ireland. Of the 79 English and Welsh
families, 17 came from London-Middlesex (primarily Middlesex), 15 from the South-
east (mostly Surrey and Sussex), 14 from the South-west (primarily Cornwall and
58 D.A.Davies and R.E.Clevely, Pioneering to prosperity 1874-1974: a centennial history of the Manchester Block. Feilding, 1981, p.1. It is interesting to note that the in its report the House of Commons Select Committee on Colonisation singled out observed that ‘Perhaps the only really successful and most instructive colonisation scheme was that carried out by the Emigrant and Colonist Aid Corporation … in New Zealand,’ while suggesting that it was ‘not a colonisation scheme pure and simple … [but] a business venture.’ Even then, ‘the company only paid an average dividend of 51/2 per cent, no very high rate for a commercial undertaking.’ Report of the select committee on colonisation, BPP 1890-91.xi.571. Sir James Fergusson, the chairman of the committee, was also a director of the corporation (and formerly governor of New Zealand, 1873-1874), while another member (Rathbone) also had a ‘pecuniary interest’ in the company. See Howard L.Malchow, Population pressures: emigration and government in late nineteenth century Britain. Palo Alto, 1979, pp.244 and 252. 59 T.A.Gibson, The purchase and settlement of the Manchester Block: an account of the development of the Feilding district, New Zealand. Feilding, 1936, pp.12-13. See also Alan Mulgan, The city of the strait: Wellington and its province. A centennial history. Wellington, 1939, p.282. 60 Pamela Matthews, The Halcombes and the early settlement of Feilding. MA Thesis, Massey University, 1987, pp.31 and 35. Matthew’s comments are based on the passenger lists contained in National Archives IM 6/4/1. 61 Brian Short, ‘Rural demography, 1850-1914,’ Chapter 21 in E.J.T.Collins, editor, The agrarian history of England and Wales. Volume VII 1850-1914 (Part II). Cambridge, 2000, pp.1293-1294. Short appears to suggest that the Feilding settlement was established during the 1880s. 62 Dorothy Mingins and Dorothy Pilkington, Feilding and the Manchester Block – the European settler families: ‘swamps, sandflies and settlers.’ Feilding, 2000.

51
Devon), ten from the Midlands South, and eight from the East. The company thus
appears to have recruited chiefly in the south-western, southern, and south-eastern
counties of England. Most male and female household heads were aged from 25 to 39
years, and most families therefore were in the early and middle stages of the family
life cycle.
Agricultural labourers and craftsmen: The third group comprised the assisted
agricultural labourers, labourers, and pre-industrial craftsmen and tradesmen of
England and Wales, and Table 30 sets out their regional origins.
Table 30: Regional origins of assisted English/Welsh agricultural labourers, labourers, and pre-industrial craftsmen, 1871-1888 Regions Agricultural
labourers1 Labourers Pre-industrial
craftsmen London-Middlesex 3.3 10.4 15.4 South-east 16.9 18.8 17.2 East 12.2 11.4 7.3 South-west 34.1 16.7 20.5 Midlands East 1.9 2.7 4.0 Central 3.0 8.9 5.7 West 8.6 10.6 6.5 South 6.1 8.9 4.3 Yorks 4.2 2.4 4.1 Lancashire-Cheshire 2.8 4.1 4.5 North-east 2.2 1.2 3.3 North-west 0.9 0.2 0.8 Off-shore islands 2.3 1.4 4.0 North Wales 0.3 0.5 1.3 South Wales 1.3 1.7 1.1 n= 640 414 632 Source: Assisted passenger lists, 1871-1888. 1 Includes the small number listed as ‘farmers.’ As expected, London-Middlesex supplied a small proportion of the agricultural
labourers, but the three regions which were over-represented among the assisted
generally, namely the South-east, East and South-west were significantly well
represented among both the agricultural labourers and the labourers. It is at least
possible that a good many of those coming from the South-west combined mining and
the cultivation of small holdings, and chose to describe themselves as agricultural
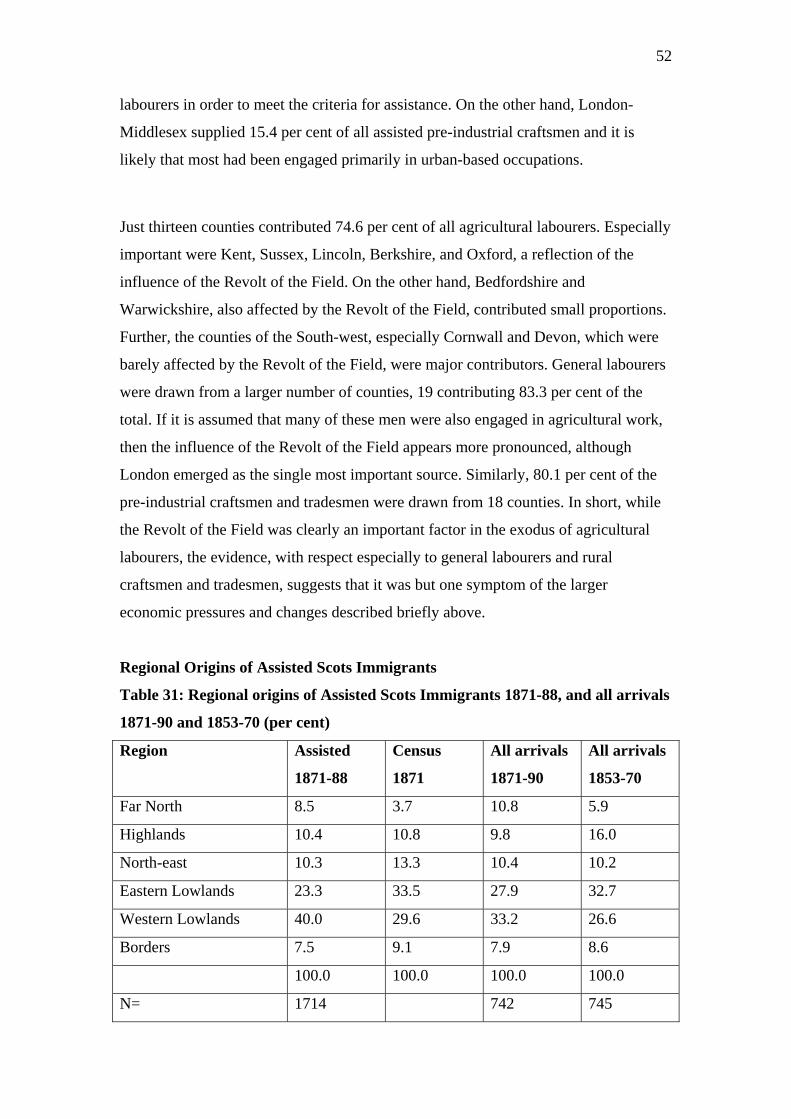
52
labourers in order to meet the criteria for assistance. On the other hand, London-
Middlesex supplied 15.4 per cent of all assisted pre-industrial craftsmen and it is
likely that most had been engaged primarily in urban-based occupations.
Just thirteen counties contributed 74.6 per cent of all agricultural labourers. Especially
important were Kent, Sussex, Lincoln, Berkshire, and Oxford, a reflection of the
influence of the Revolt of the Field. On the other hand, Bedfordshire and
Warwickshire, also affected by the Revolt of the Field, contributed small proportions.
Further, the counties of the South-west, especially Cornwall and Devon, which were
barely affected by the Revolt of the Field, were major contributors. General labourers
were drawn from a larger number of counties, 19 contributing 83.3 per cent of the
total. If it is assumed that many of these men were also engaged in agricultural work,
then the influence of the Revolt of the Field appears more pronounced, although
London emerged as the single most important source. Similarly, 80.1 per cent of the
pre-industrial craftsmen and tradesmen were drawn from 18 counties. In short, while
the Revolt of the Field was clearly an important factor in the exodus of agricultural
labourers, the evidence, with respect especially to general labourers and rural
craftsmen and tradesmen, suggests that it was but one symptom of the larger
economic pressures and changes described briefly above.
Regional Origins of Assisted Scots Immigrants
Table 31: Regional origins of Assisted Scots Immigrants 1871-88, and all arrivals
1871-90 and 1853-70 (per cent)
Region Assisted
1871-88
Census
1871
All arrivals
1871-90
All arrivals
1853-70
Far North 8.5 3.7 10.8 5.9
Highlands 10.4 10.8 9.8 16.0
North-east 10.3 13.3 10.4 10.2
Eastern Lowlands 23.3 33.5 27.9 32.7
Western Lowlands 40.0 29.6 33.2 26.6
Borders 7.5 9.1 7.9 8.6
100.0 100.0 100.0 100.0
N= 1714 742 745
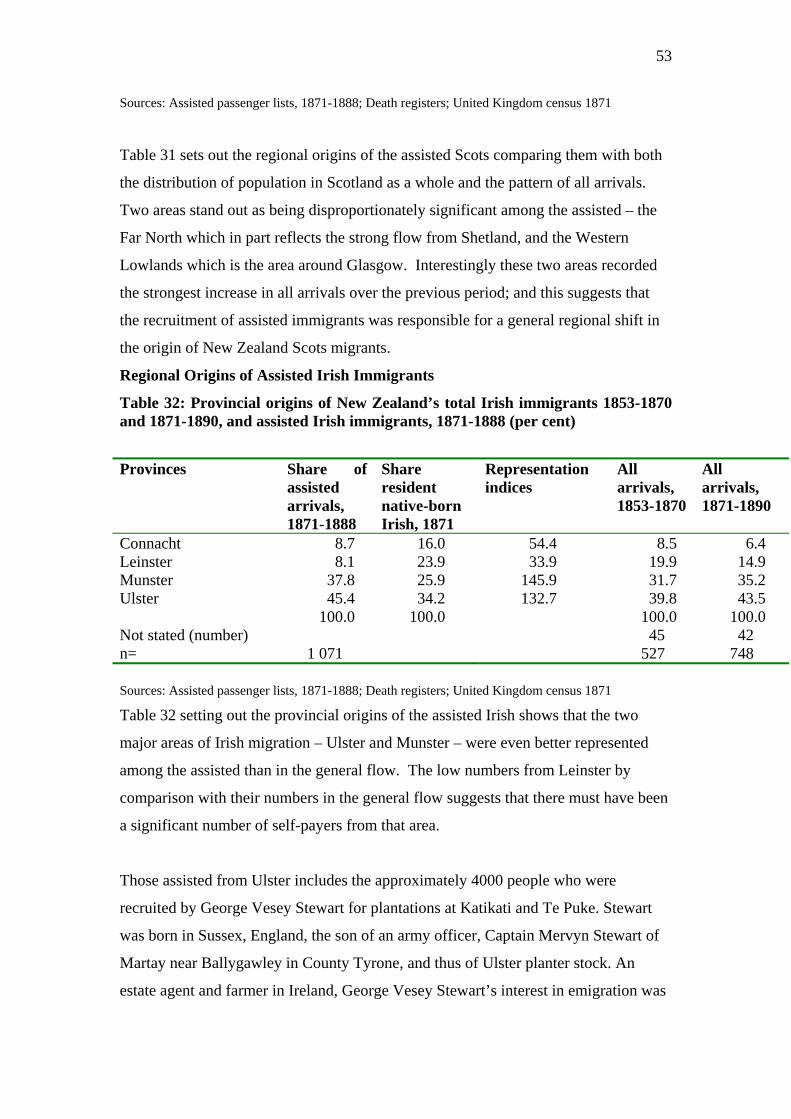
53
Sources: Assisted passenger lists, 1871-1888; Death registers; United Kingdom census 1871
Table 31 sets out the regional origins of the assisted Scots comparing them with both
the distribution of population in Scotland as a whole and the pattern of all arrivals.
Two areas stand out as being disproportionately significant among the assisted – the
Far North which in part reflects the strong flow from Shetland, and the Western
Lowlands which is the area around Glasgow. Interestingly these two areas recorded
the strongest increase in all arrivals over the previous period; and this suggests that
the recruitment of assisted immigrants was responsible for a general regional shift in
the origin of New Zealand Scots migrants.
Regional Origins of Assisted Irish Immigrants
Table 32: Provincial origins of New Zealand’s total Irish immigrants 1853-1870 and 1871-1890, and assisted Irish immigrants, 1871-1888 (per cent)
Provinces Share of assisted arrivals, 1871-1888
Share resident native-born Irish, 1871
Representation indices
All arrivals, 1853-1870
All arrivals, 1871-1890
Connacht 8.7 16.0 54.4 8.5 6.4 Leinster 8.1 23.9 33.9 19.9 14.9 Munster 37.8 25.9 145.9 31.7 35.2 Ulster 45.4 34.2 132.7 39.8 43.5 100.0 100.0 100.0 100.0 Not stated (number) 45 42 n= 1 071 527 748 Sources: Assisted passenger lists, 1871-1888; Death registers; United Kingdom census 1871 Table 32 setting out the provincial origins of the assisted Irish shows that the two
major areas of Irish migration – Ulster and Munster – were even better represented
among the assisted than in the general flow. The low numbers from Leinster by
comparison with their numbers in the general flow suggests that there must have been
a significant number of self-payers from that area.
Those assisted from Ulster includes the approximately 4000 people who were
recruited by George Vesey Stewart for plantations at Katikati and Te Puke. Stewart
was born in Sussex, England, the son of an army officer, Captain Mervyn Stewart of
Martay near Ballygawley in County Tyrone, and thus of Ulster planter stock. An
estate agent and farmer in Ireland, George Vesey Stewart’s interest in emigration was
54
fostered by the failure of a linen mill in County Tyrone and a desire to restore his
fortunes, and Ulster’s land troubles.63 In 1874, in New Zealand, intent upon
establishing a settlement of Ulster gentry and tenant farmers, he entered an agreement
with the general government under which he secured 10 000 acres at Katikati, with a
further 10 000 acres (this time at a cost of £10 000) added in 1877.64 In addition the
colonial government agreed to provide subsidised passages. His aim was to establish a
settlement of Ulster protestants or least of Irish ‘loyal to the British Constitution,’ and
advised ‘Irish Fenians, rebels, and Home Rulers to emigrate to the United States
where they might find a more sympathetic atmosphere.’ Roman Catholics could join
his party provided they dispensed with ‘feelings of bigotry and religious discord’!65
In Ireland he distributed a pamphlet among Orange lodges (increasingly concerned
over Gladstone’s proposals for church and land reform in Ireland and the growing
pressure for Irish home rule), and expressed the hope that members and ‘Protestant
neighbours’ would join the first party to emigrate to New Zealand.66 The party would
be led by a Presbyterian cleric and members of the party would comprise those of the
‘upper respectable’ class of yeomen farmers.67 Interestingly, Vogel insisted that the
Stewart’s settlers must not be connected to any political organisation,68 although
Stewart remained determined to establish ‘country gentlemen’ of ‘considerable
means’ and tenant farmers who would supply the ‘bone and sinew’ in a unified, self-
63 The dictionary of New Zealand biography. Volume Two, 1870-1900. Wellington, 1993, p.481. See also Arthur Gray, ‘The story of Katikati,’ Journal of the Auckland-Waikato historical societies No.19, September 1971, pp.33-35; Ernest E.Bush compiler and editor, ‘The Katikati story,’ Tauranga Historical Society journal, No.53, Tauranga, 1975; N.C.Mitchel, ‘Katikati: an Ulster settlement in New Zealand,’ Ulster folklife, Volume 15/16, 1970, 203-215; Adela B.Stewart, My simple life in New Zealand. London, 1908; George Vesey Stewart, Notes on the origin and prospects of the Stewart special settlement, Kati-Kati, New Zealand and notes on New Zealand as a field for emigration. Omagh, 1877; George Vesey Stewart, Sequel to the notes on the origin and prospects of the Stewart special settlement, Kati-Kati, New Zealand. Omagh, 1878; George Vesey Stewart, Notes on the Stewart special settlement, No.3, at Te Puke, Bay of Plenty, New Zealand … London, 1880; George Vesey Stewart, Notes on the Stewart Special Settlement, No.4, Bay of Plenty, New Zealand … London, 1883; Evelyn Stokes, A history of Tauranga county. Palmerston North, 1980; and Anna Rogers, A lucky landing: the story of the Irish in New Zealand. Auckland, 1996. 64 On the initial approach made by Stewart to Featherston, see AJHR D3, 1874, p.53. On the selection of and negotiations over a site, see National Archives IM 6/11/2; AJHR 5A, 1874; and Auckland Provincial Council, Votes and Proceedings, A.No.23 and A.No.36, 1874. A copy of the final agreement is set out in AJHR D5A, 1874, pp.10-12. 65 George Vesey Stewart, Notes on the origins and prospects of the Stewart special settlement, Kati-Kati, New Zealand, and on New Zealand as a field for emigration. Omagh, 1877, pp.115. 66 AJHR, D3, pp.6-7. 67 G.V.Stewart to T.B.Gillies, 13 August 1873, National Archives IM 6/11/2. 68 AJHR D1A, 1874, p.7 and D3, 1874, pp.6-7. See also R.P.Davis, Irish issues in New Zealand politics, 1868-1922. Dunedin, 1974, p.35. Vogel, as agent-general, appears to have tried to sabotage the settlement of the second block. See Donald Harman Akenson, Half the world from home: perspectives on the Irish in New Zealand 1860-1950. Wellington, 1990, p.138-139.
55
sufficient community tied by a bond of ‘Ulster kinship.’69 In the colony he secured
the support of the Auckland banker and timber merchant Joseph McMullen
Dargaville, a native of Cork, son of a physician, a descendant of Huguenots, a
member of the Auckland Provincial Council (1873-1876), and grandmaster of the
Loyal Orange Lodge of New Zealand.70 G.M.O’Rorke, son of a Galway landowner
and Anglican clergyman, a member of both the House of Representatives and the
Auckland Provincial Council, and Minister of Immigration and Secretary for Crown
lands (1871-1874), also lent his support,71 as did H.W.Farnall, the colony’s
emigration agent in Belfast from 1872 until his return to New Zealand with the first
party of Katikati settlers in 1875.72
Over the period 1875-1878, four ships brought immigrants to what became known as
the Stewart Special Settlement. The first ship, the Carisbrooke Castle, carrying 238
settlers, arrived in Auckland in September 1875, the new arrivals being praised by the
colonial press as frugal, sober, and industrious, a class of which New Zealand could
scarcely have too many.73 Unfortunately, the passenger list for the Carisbrooke Castle
did not include the usual details relating to occupation or county of birth or last
residence, but Stevenson indicated that among the 28 heads-of-household in this first
party only seven were tenant farmers and seven were professional men, the remainder
being townsmen of unknown background.74 Akenson suggests that of 28 of the 34
heads-of-household in this ‘No.1 party’, 14 came from Ulster’s border counties and
69 GeorgeVesey Stewart, Notes on origins and prospects of the Stewart special settlement, Kati-Kati, New Zealand and notes on New Zealand as a field for emigration. Omagh, 1877, Introduction. 70 The dictionary of New Zealand biography. Volume Two, 1870-1900. Wellington, 1993, pp.110-111. 71 A.H.McLintock, editor, An encyclopaedia of New Zealand. Volume 2. Wellington, 1966, pp.717-718; The dictionary of New Zealand biography. Volume Two, 1870-1900. Wellington, 1993, pp.368-139; and Jasmine Rebecca Rogers, A little corner of Ulster in New Zealand: the Katikati special settlement, 1875-1900. MA Dissertation, University of Auckland, 1998, p.2. 72 The dictionary of New Zealand biography. Volume Two, 1870-1900. Wellington, 1993, pp.137-138. On colonial government views of Irish immigrants, see Rory Sweetman, ‘The Irish in nineteenth century New Zealand,’ in A.J.Jones, editor, Under the southern cross: papers to be presented at the third Australasian congress on genealogy and heraldry, University of Waikato, Hamilton, New Zealand. Hamilton, 1983, pp.266-271. 73 Bay of Plenty Times 15 September 1875 and New Zealand Herald 9 September 1875, quoted in Thomas L.Stevenson, The Katikati special settlement, 1875-1880. MA Thesis, University of Otago, 1975, p.43. 74 Thomas L.Stevenson, The Katikati special settlement, 1875-1880. MA Thesis, University of Otago, 1975, p.46. It is worthwhile noting that ten families were later found to have included individuals who had been passed off as family members. See Donald Harman Akenson, Half the world from home: perspectives on the Irish in New Zealand 1860-1950. Wellington, 1990, pp.136-137.
56
eight from Counties Antrim and Down, that three were members of the rural gentry,
nine were small tenant farmers and rural labourers, and eight were professionals.75
A second party, of 378 settlers departed on the Lady Jocelyn in May 1878. A rather
different group, this party included several retired army officers, two doctors, and
‘numerous country gentlemen,’ but few experienced farmers.76 In his 1877 pamphlet,
Stewart included a statement signed by a number of Katikati settlers, and it indicates
that most were drawn from Counties Antrim and Tyrone, although others gave as their
homes Dublin and Counties Cork and Mayo.77 Stewart went on to organise another
settlement, this time at Te Puke, on 16 000 acres purchased for just under £20 000.
Four more vessels delivered immigrants over the years from 1880 to 1883. Additional
settlers arrived in 1884, and in all, as noted, Stewart is credited with having brought
some 4 000 emigrants to the colony.78
Self-paying immigrants: sources
While considerable information exists with respect to the assisted immigrants of the
1870s and 1880s, that relating to self-paying immigrants is scarce. Very little is
known, for example, about the farmers whom the Agent-General encouraged to
emigrate to New Zealand, and which included 225 intending farmers who were
offered passages for £25 in 187979; and another 395 persons – farmers and their
families – who arrived in New Zealand, together with an estimated £44 000 in capital
between 1885 and 1888.80
75 Donald Harman Akenson, Half the world from home: perspectives on the Irish in New Zealand 1860-1950. Wellington, 1990, p.135. 76 Thomas L.Stevenson, The Katikati special settlement, 1875-1880. MA Thesis, University of Otago, 1975, p.114. 77 See George Vesey Stewart, Notes on the origins and prospects of the Stewart special settlement, Kati-Kati, New Zealand and nots on New Zealand as a field for emigration. Omagh, 1877, p.4. 78 Arthur J.Gray, An Ulster plantation: the story of the Katikati settlement. Dunedin, 1938. See also Alan Mulgan, ‘Two worlds: a chapter of autobiography,’ Landfall 7, September 1948, p.181 – in which he describes Stewart as “Edward Gibbon Wakefield on a small scale;’ W.P.Morrell, ‘Vogel and his public works policy,’ Post-primary school bulletin 7 (10), Wellington, 1953, p.21; and A.H.McLintock, editor, An encyclopaedia of New Zealand. Volume 3. Wellington, 1966, 313-314. It is interesting to note that Stewart transferred his interests in Te Puke to a specially formed company, the New Zealand Land Corporation, but it quickly folded and Stewart took over the unsold land. 79 It should be noted that some received a measure of assistance. Contrary to explicit instructions, Vogel contributed almost £439 to assist eight families ‘to pay part of the passage-money, so as not to interfere with the capital they were able to realize here to take with them for investment in their new home ...’ See AJHR D2A, 1880, p.2. 80 AJHR D7, 1893, p.2. See also Arthur Clayden, A popular handbook to New Zealand, its resources and industries. London, 1885, pp.43 and 45. Clayden urged tenant farmers, those with capital of £300
57
A more comprehensive source relates to all Scottish paying passengers brought out to
New Zealand from 1871-80 by Patrick Henderson’s Albion Line.81 Many of these
passengers were sponsored, of course, not by the provincial or general governments,
but by relatives and friends many of whom were already in New Zealand, and may
have received some assistance from such sources. The information recorded for each
individual varies considerably, but could include name, gender, age, marital status,
and year of departure, and often occupation, while family type and family life cycle
stage can generally be deduced. The handwritten sheets from which this information
was derived also included for some individuals details relating to home addresses,
although whether ‘home address’ implied place of birth or meant place of last
residence is not clear. Where possible, that information has also been analysed. The
self-payers included 452 families, 1 533 single men, and 260 single women. In
contrast to the assisted Scots immigrants of the comparable period of 1871-1880,
most of the self-paying immigrants – 51.7 per cent of the families, 42.1 per cent of the
single men, and 42.7 per cent of the single women – arrived in New Zealand in 1879
and 1880.
Self-payers: marital status and gender
Another contrast between the assisted and self-payers emerges with respect to marital
status. The payers were far more likely to be single than the assisted. Among the
assisted Scots, the single accounted for 48.3 per cent of all adults (54.5 per cent of the
males, and 40.2 per cent of the females), while among the self paying, the single
accounted for 69.5 per cent (81.8 per cent of all adult males, and 36.9 per cent of all
females). It is likely that passage costs deterred more-self-paying families from
making the comparatively expensive journey to New Zealand. Furthermore far more
to £1 000, to follow the example set by agricultural labourers and emigrate to New Zealand where they could take up land on perpetual lease and devote their capital to development. He could discern ‘no limits to … [the] revolutionary discovery [of refrigeration].’ Interestingly, he also saw (p.25) in emigration ‘the final and complete redemption of the English agricultural labourer from his social bondage.’ 81 The first edition of this list, published in 1982, offered details relating to passengers arriving in Otago. A revised edition, published in 1993, expanded the original list to include migrants who landed at Auckland, Bluff, Lyttelton and Wellington, although the bulk of the arrivals still disembarked at Port Chalmers. The revised list thus included all paying passengers brought to New Zealand over the period 1871-1880 by the Albion Line, the company’s ships all departing from Greenock, Glasgow and London. See Vera Mossong, Index: Patrick Henderson Shipping Company paying passengers to Otago
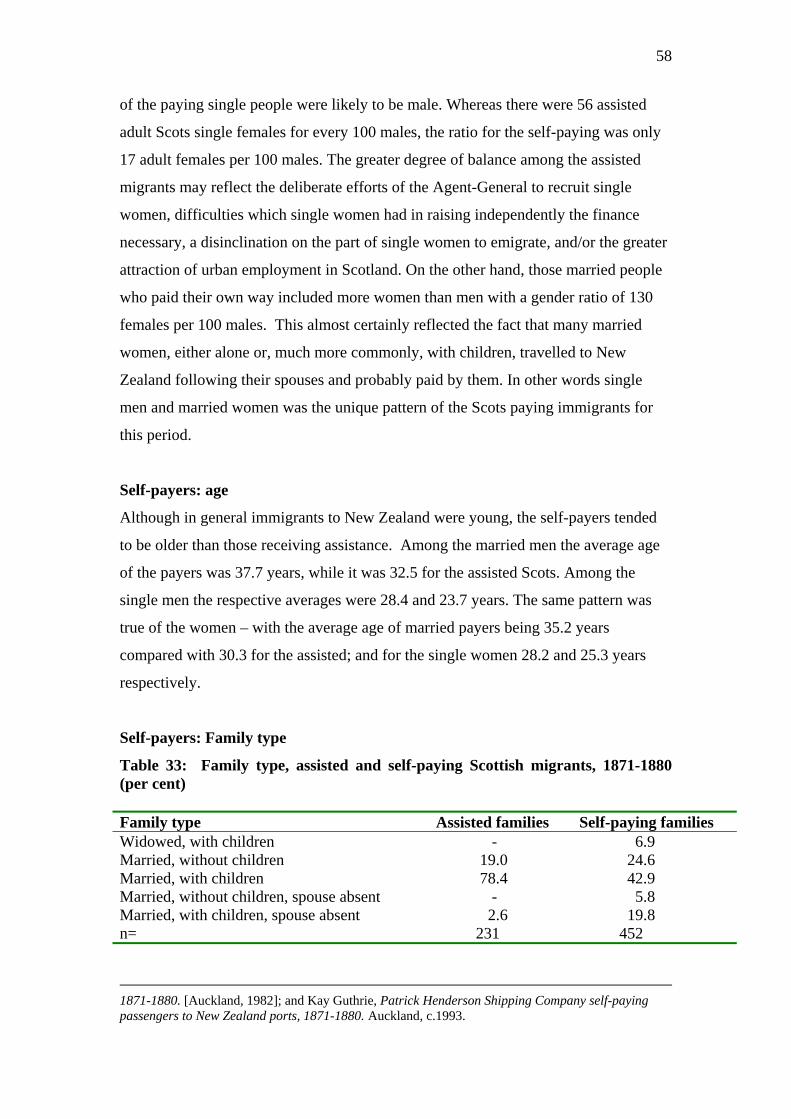
58
of the paying single people were likely to be male. Whereas there were 56 assisted
adult Scots single females for every 100 males, the ratio for the self-paying was only
17 adult females per 100 males. The greater degree of balance among the assisted
migrants may reflect the deliberate efforts of the Agent-General to recruit single
women, difficulties which single women had in raising independently the finance
necessary, a disinclination on the part of single women to emigrate, and/or the greater
attraction of urban employment in Scotland. On the other hand, those married people
who paid their own way included more women than men with a gender ratio of 130
females per 100 males. This almost certainly reflected the fact that many married
women, either alone or, much more commonly, with children, travelled to New
Zealand following their spouses and probably paid by them. In other words single
men and married women was the unique pattern of the Scots paying immigrants for
this period.
Self-payers: age
Although in general immigrants to New Zealand were young, the self-payers tended
to be older than those receiving assistance. Among the married men the average age
of the payers was 37.7 years, while it was 32.5 for the assisted Scots. Among the
single men the respective averages were 28.4 and 23.7 years. The same pattern was
true of the women – with the average age of married payers being 35.2 years
compared with 30.3 for the assisted; and for the single women 28.2 and 25.3 years
respectively.
Self-payers: Family type
Table 33: Family type, assisted and self-paying Scottish migrants, 1871-1880 (per cent) Family type Assisted families Self-paying families Widowed, with children - 6.9 Married, without children 19.0 24.6 Married, with children 78.4 42.9 Married, without children, spouse absent - 5.8 Married, with children, spouse absent 2.6 19.8 n= 231 452
1871-1880. [Auckland, 1982]; and Kay Guthrie, Patrick Henderson Shipping Company self-paying passengers to New Zealand ports, 1871-1880. Auckland, c.1993.
59
Sources: Assisted passenger lists 1871-1880, and Kay Guthrie, Patrick Henderson Shipping Company self-paying passenger to New Zealand ports, 1871-1880. Auckland. c.1993.
Table 33 classifies the assisted and self-paying families into five categories, and again
contrasts are apparent. Although similar proportions were classified as ‘married,
without children,’ a significantly higher proportion of the assisted migrants consisted
of married couples and their children. While just 2.6 per cent of the assisted families
were described as ‘married, with children, spouse absent,’ a very much higher
proportion of the self-paying fell into that category. Again this reflects the pattern of
married women arriving in New Zealand with their children to join spouses who had
arrived some time previously. A migration strategy in which the male head of the
household travelled ahead to secure employment and accommodation and to remit
money so that the wife and children might follow in some cases, several years, later,
was a strategy commonly employed by self-paying migrants. That the assisted
families included a much higher proportion of married couples with children
emphasises the influence which the provision of assistance had upon the demographic
character of that inflow. Further differences emerge with respect to stage in the family
life cycle: a larger proportion of the assisted families were in the earlier stages of the
family life cycle, with 50.6 per cent falling into the categories ‘one child under 10’
and ‘all children under 10,’ compared with 38.1 per cent of the self-paying families. A
considerably larger proportion of the self-paying families were in the later stages of
the family life cycle, 23.7 per cent, compared with just seven per cent of the assisted
families. The average number of children per assisted family was 2.5 (or 3.1
excluding childless families), compared with 1.8 per self-paying family (or 2.7
excluding childless families), suggesting, given that the self-payers were in the later
stages of the family life cycle, that not all children emigrated with their families.
Self-payers: Occupations
Of the 260 single women self-payers, occupations were given for only 45: 33 were
described as servants, four as cooks, and three as nurses, two as teachers, two as
governesses, and one as a dairy maid.
Table 34: Occupations of assisted and self-paying Scottish adult single and married male arrivals 1871-1880 (per cent)
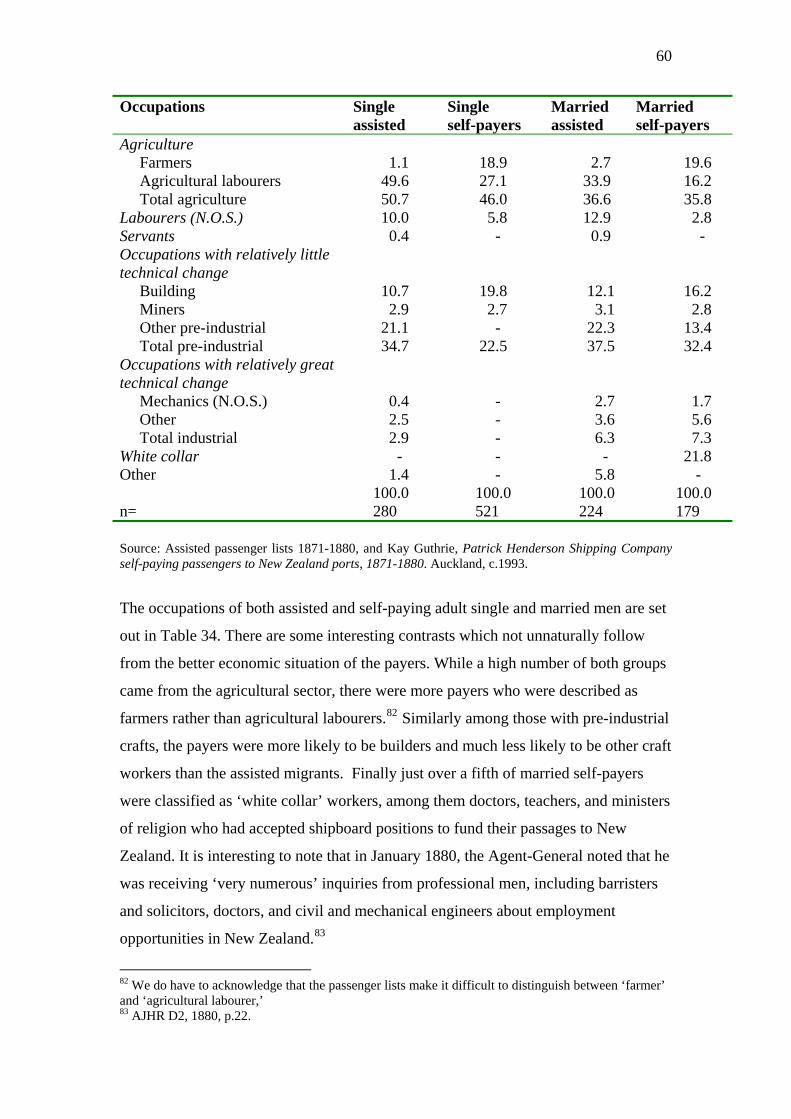
60
Occupations Single assisted
Single self-payers
Married assisted
Married self-payers
Agriculture Farmers 1.1 18.9 2.7 19.6 Agricultural labourers 49.6 27.1 33.9 16.2 Total agriculture 50.7 46.0 36.6 35.8 Labourers (N.O.S.) 10.0 5.8 12.9 2.8 Servants 0.4 - 0.9 - Occupations with relatively little technical change
Building 10.7 19.8 12.1 16.2 Miners 2.9 2.7 3.1 2.8 Other pre-industrial 21.1 - 22.3 13.4 Total pre-industrial 34.7 22.5 37.5 32.4 Occupations with relatively great technical change
Mechanics (N.O.S.) 0.4 - 2.7 1.7 Other 2.5 - 3.6 5.6 Total industrial 2.9 - 6.3 7.3 White collar - - - 21.8 Other 1.4 - 5.8 - 100.0 100.0 100.0 100.0 n= 280 521 224 179 Source: Assisted passenger lists 1871-1880, and Kay Guthrie, Patrick Henderson Shipping Company self-paying passengers to New Zealand ports, 1871-1880. Auckland, c.1993.
The occupations of both assisted and self-paying adult single and married men are set
out in Table 34. There are some interesting contrasts which not unnaturally follow
from the better economic situation of the payers. While a high number of both groups
came from the agricultural sector, there were more payers who were described as
farmers rather than agricultural labourers.82 Similarly among those with pre-industrial
crafts, the payers were more likely to be builders and much less likely to be other craft
workers than the assisted migrants. Finally just over a fifth of married self-payers
were classified as ‘white collar’ workers, among them doctors, teachers, and ministers
of religion who had accepted shipboard positions to fund their passages to New
Zealand. It is interesting to note that in January 1880, the Agent-General noted that he
was receiving ‘very numerous’ inquiries from professional men, including barristers
and solicitors, doctors, and civil and mechanical engineers about employment
opportunities in New Zealand.83
82 We do have to acknowledge that the passenger lists make it difficult to distinguish between ‘farmer’ and ‘agricultural labourer,’ 83 AJHR D2, 1880, p.22.
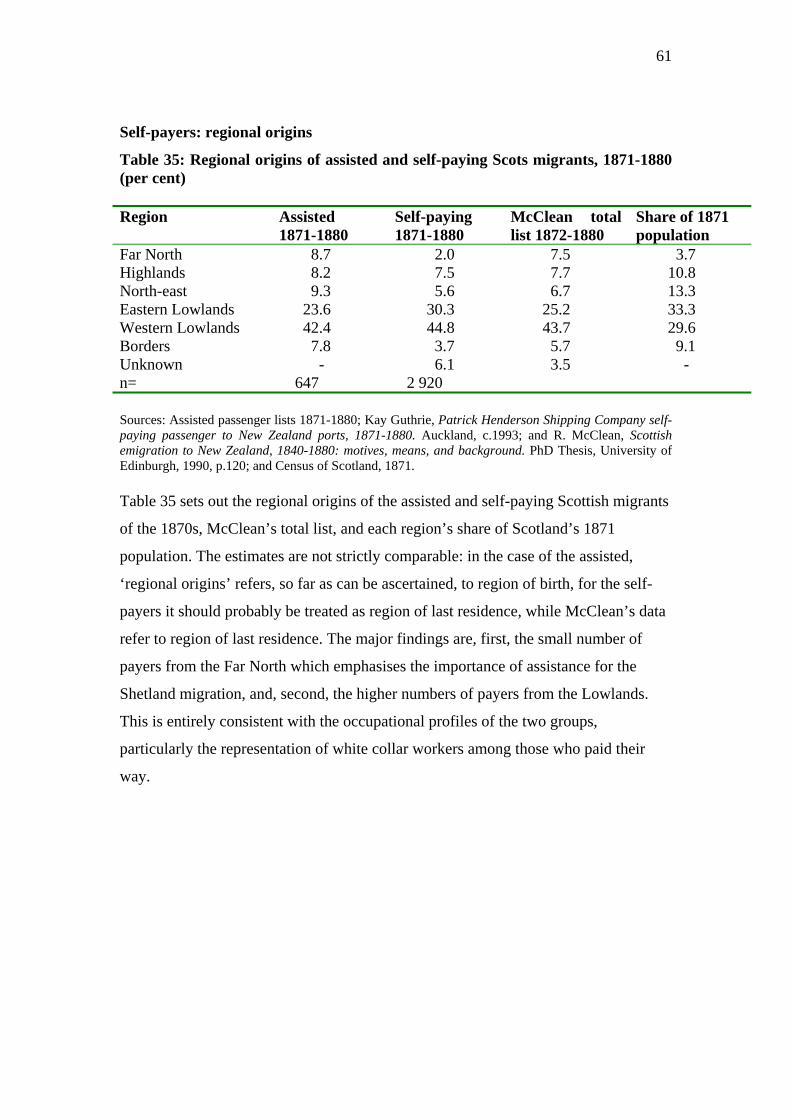
61
Self-payers: regional origins
Table 35: Regional origins of assisted and self-paying Scots migrants, 1871-1880 (per cent) Region Assisted
1871-1880 Self-paying 1871-1880
McClean total list 1872-1880
Share of 1871 population
Far North 8.7 2.0 7.5 3.7 Highlands 8.2 7.5 7.7 10.8 North-east 9.3 5.6 6.7 13.3 Eastern Lowlands 23.6 30.3 25.2 33.3 Western Lowlands 42.4 44.8 43.7 29.6 Borders 7.8 3.7 5.7 9.1 Unknown - 6.1 3.5 - n= 647 2 920 Sources: Assisted passenger lists 1871-1880; Kay Guthrie, Patrick Henderson Shipping Company self-paying passenger to New Zealand ports, 1871-1880. Auckland, c.1993; and R. McClean, Scottish emigration to New Zealand, 1840-1880: motives, means, and background. PhD Thesis, University of Edinburgh, 1990, p.120; and Census of Scotland, 1871. Table 35 sets out the regional origins of the assisted and self-paying Scottish migrants
of the 1870s, McClean’s total list, and each region’s share of Scotland’s 1871
population. The estimates are not strictly comparable: in the case of the assisted,
‘regional origins’ refers, so far as can be ascertained, to region of birth, for the self-
payers it should probably be treated as region of last residence, while McClean’s data
refer to region of last residence. The major findings are, first, the small number of
payers from the Far North which emphasises the importance of assistance for the
Shetland migration, and, second, the higher numbers of payers from the Lowlands.
This is entirely consistent with the occupational profiles of the two groups,
particularly the representation of white collar workers among those who paid their
way.

62