Embed Size (px)
Citation preview

Today• 4/5/11 Physics 262 Lecture 10• Questions about Exams• Homework
– Review your exams and review practice exam again.• Lab: Continue project
– Do pre-lab before lab. See last weeks handout. • Requires use of excel/matlab and some thought
– See handout for more detail.• Lecture
– Labview Intro
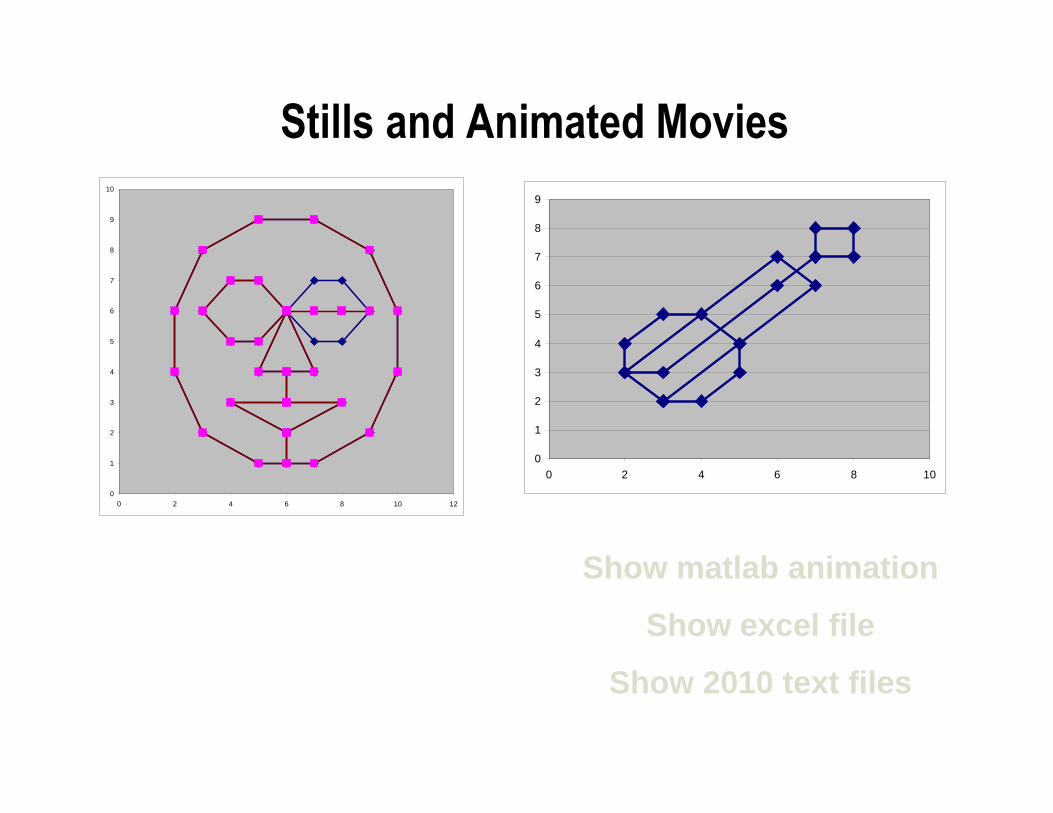
Stills and Animated Movies
0
1
2
3
4
5
6
7
8
9
0 2 4 6 8 100
1
2
3
4
5
6
7
8
9
10
0 2 4 6 8 10 12
Show matlab animation
Show excel file
Show 2010 text files
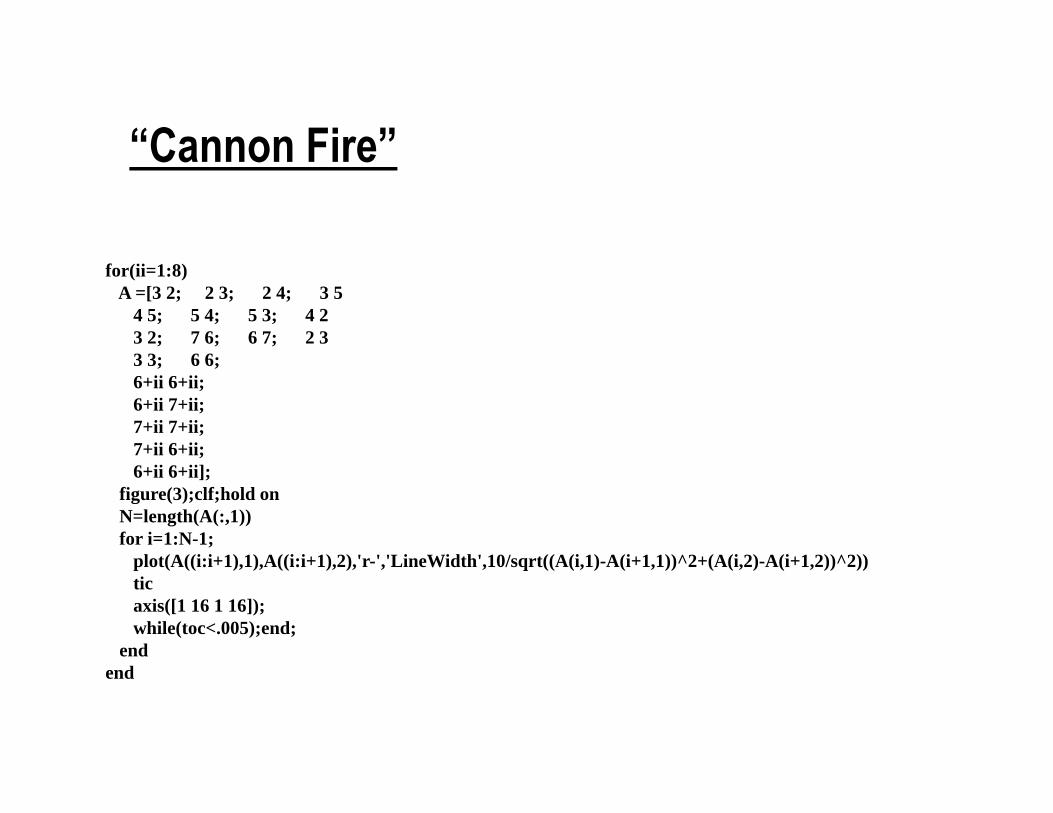
for(ii=1:8)A =[3 2; 2 3; 2 4; 3 5
4 5; 5 4; 5 3; 4 23 2; 7 6; 6 7; 2 33 3; 6 6;6+ii 6+ii;6+ii 7+ii;7+ii 7+ii;7+ii 6+ii;6+ii 6+ii];
figure(3);clf;hold onN=length(A(:,1))for i=1:N-1;
plot(A((i:i+1),1),A((i:i+1),2),'r-','LineWidth',10/sqrt((A(i,1)-A(i+1,1))^2+(A(i,2)-A(i+1,2))^2))ticaxis([1 16 1 16]);while(toc<.005);end;
endend
“Cannon Fire”
Nearly all test, measurement, and control applications can be divided into 3 main components: the ability to
1. Acquire data with controlled conditions.2. Analyze data.3. Present data.
National Instruments Labview has been around for over 20 years:
1986 LabVIEW 1.0 for Macintosh
1990 LabVIEW 2.0 for Macintosh
1992 LabVIEW for Windows
Labview is a widely used tool in Physics and Engineering labs
LabVIEW
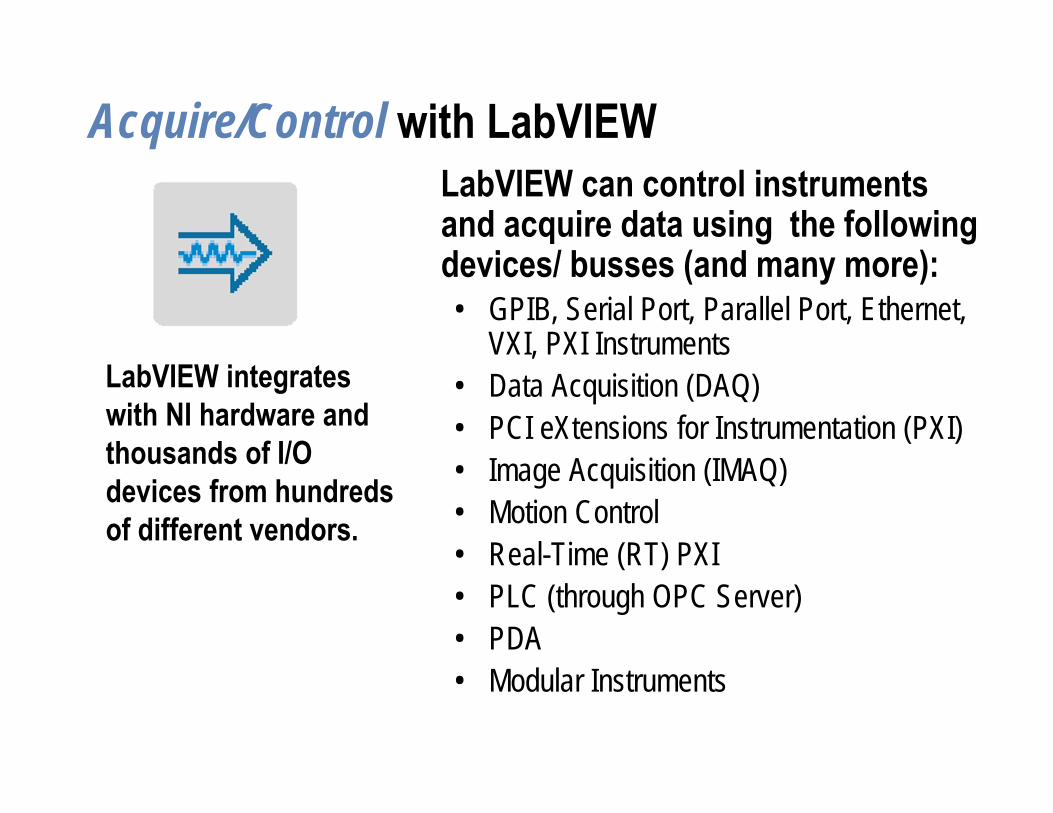
Acquire/Control with LabVIEWLabVIEW can control instruments and acquire data using the following devices/ busses (and many more):• GPIB, Serial Port, Parallel Port, Ethernet,
VXI, PXI Instruments• Data Acquisition (DAQ)• PCI eXtensions for Instrumentation (PXI)• Image Acquisition (IMAQ)• Motion Control• Real-Time (RT) PXI• PLC (through OPC Server)• PDA• Modular Instruments
LabVIEW integrates with NI hardware and thousands of I/O devices from hundreds of different vendors.
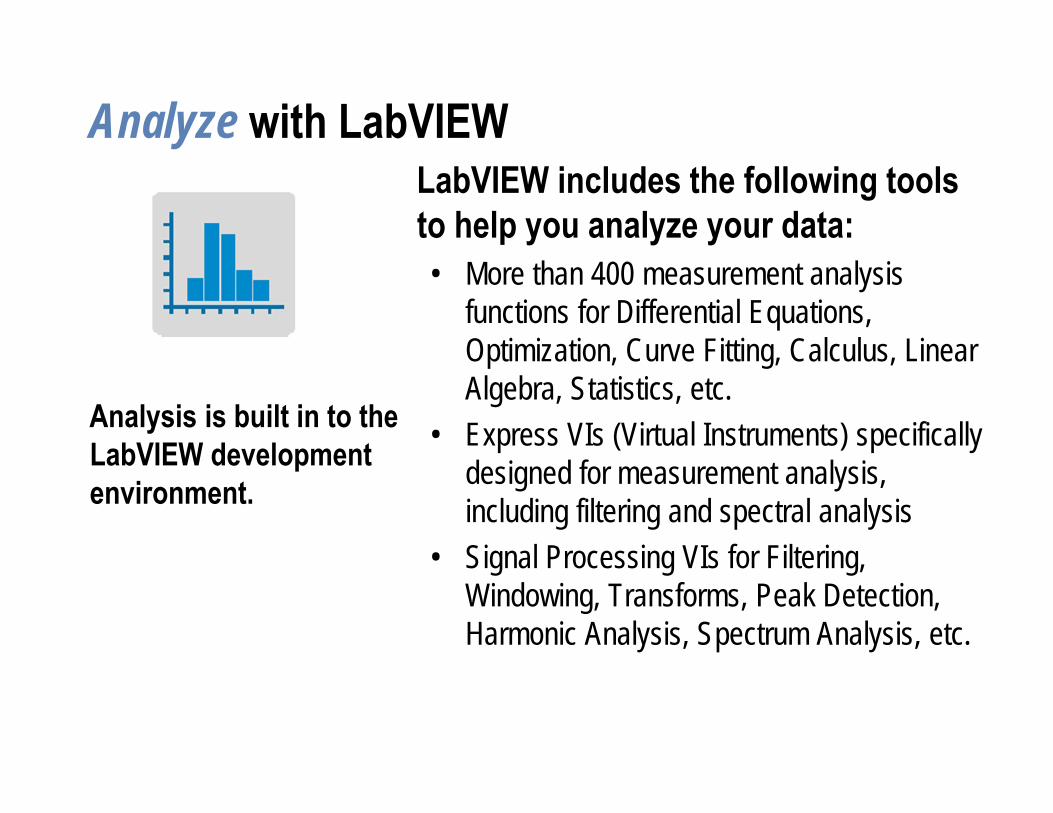
Analyze with LabVIEWLabVIEW includes the following tools to help you analyze your data:• More than 400 measurement analysis
functions for Differential Equations, Optimization, Curve Fitting, Calculus, Linear Algebra, Statistics, etc.
• Express VIs (Virtual Instruments) specifically designed for measurement analysis, including filtering and spectral analysis
• Signal Processing VIs for Filtering, Windowing, Transforms, Peak Detection, Harmonic Analysis, Spectrum Analysis, etc.
Analysis is built in to the LabVIEW development environment.
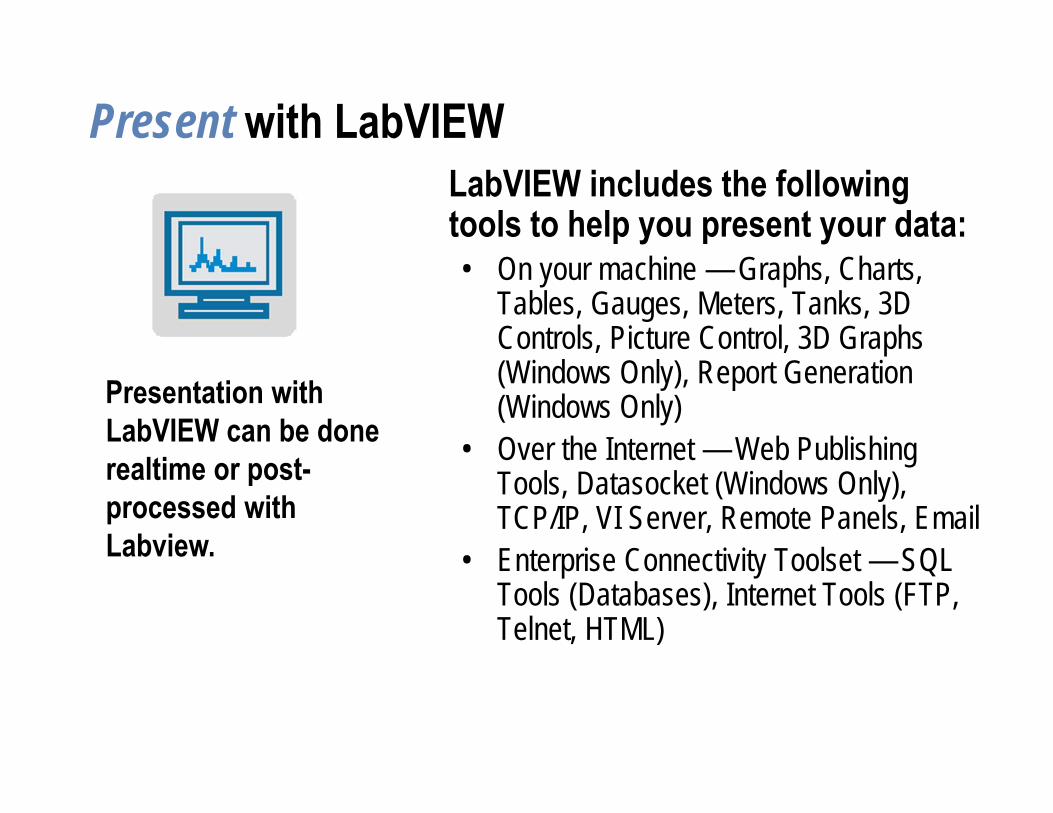
Present with LabVIEWLabVIEW includes the following tools to help you present your data:• On your machine — Graphs, Charts,
Tables, Gauges, Meters, Tanks, 3D Controls, Picture Control, 3D Graphs (Windows Only), Report Generation (Windows Only)
• Over the Internet — Web Publishing Tools, Datasocket (Windows Only), TCP/IP, VI Server, Remote Panels, Email
• Enterprise Connectivity Toolset — SQL Tools (Databases), Internet Tools (FTP, Telnet, HTML)
Presentation with LabVIEW can be done realtime or post-processed with Labview.
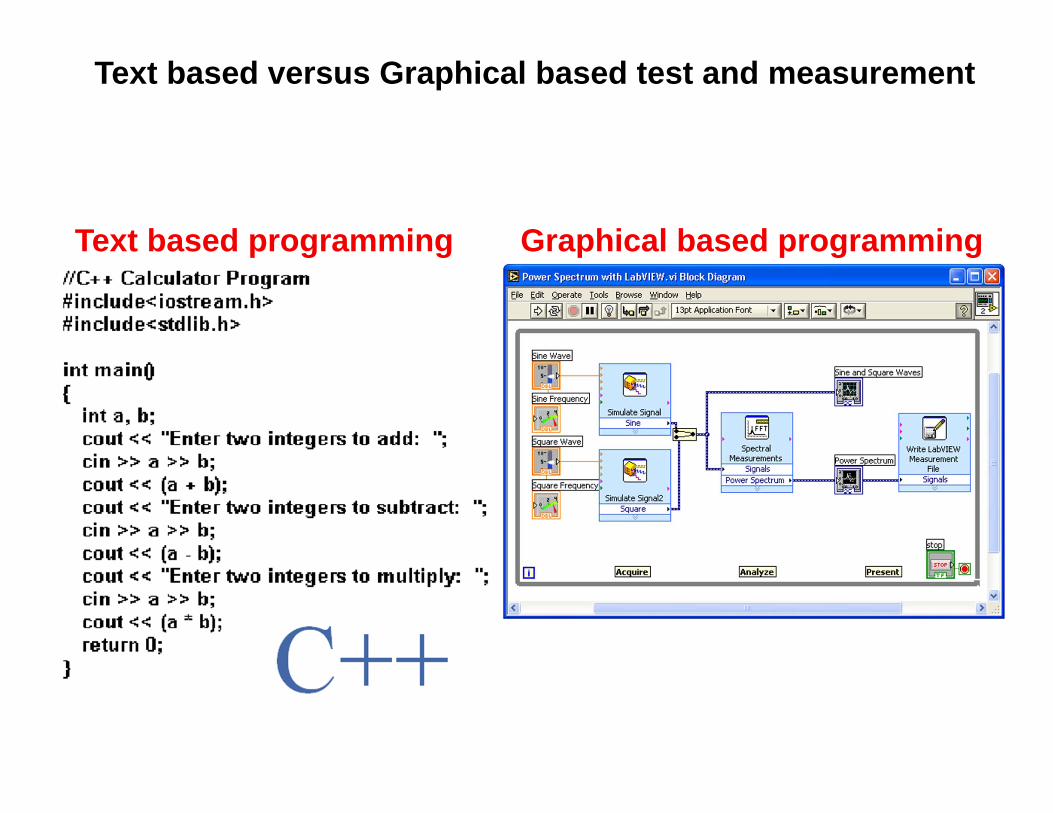
Text based versus Graphical based test and measurement
Text based programming Graphical based programming
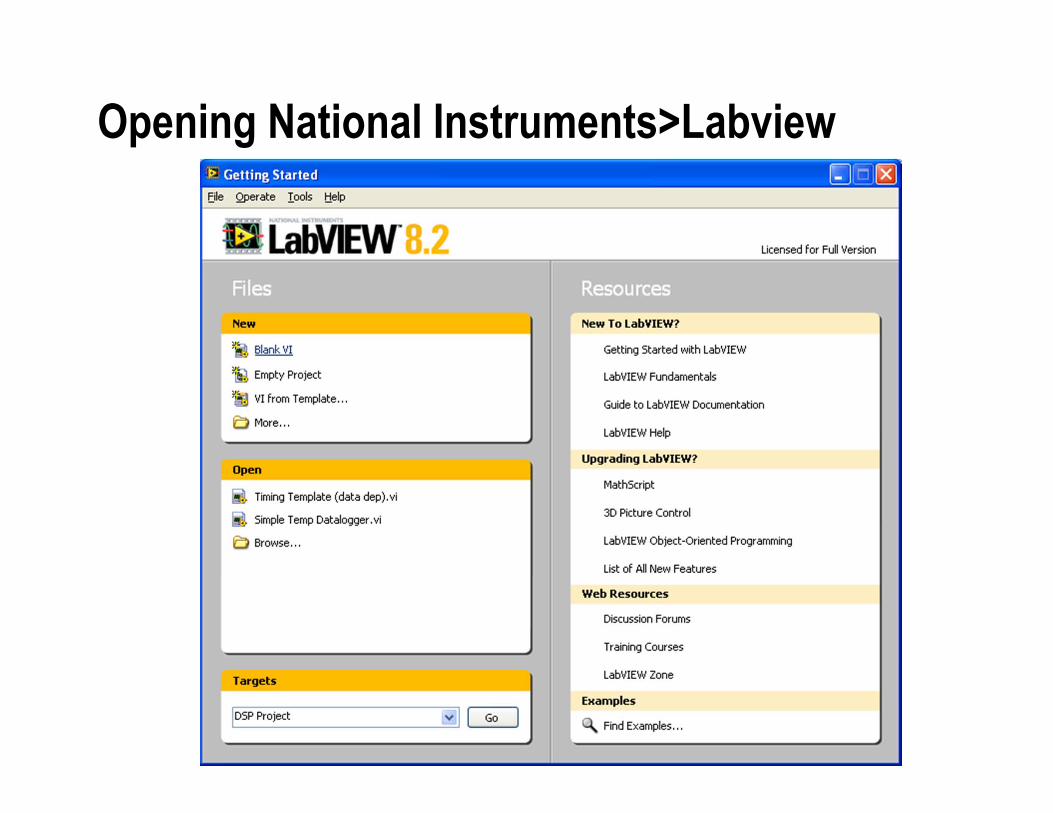
Opening National Instruments>Labview
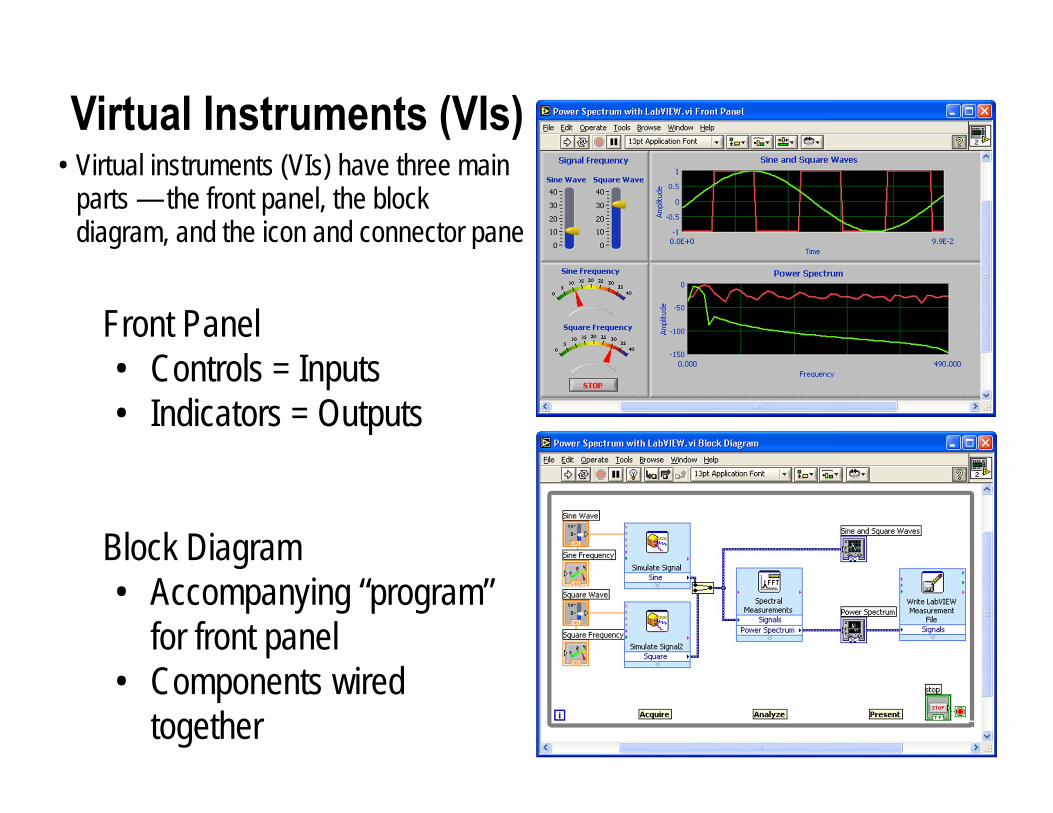
Virtual Instruments (VIs)
Front Panel• Controls = Inputs• Indicators = Outputs
Block Diagram• Accompanying “program”
for front panel• Components wired
together
• Virtual instruments (VIs) have three main parts — the front panel, the block diagram, and the icon and connector pane
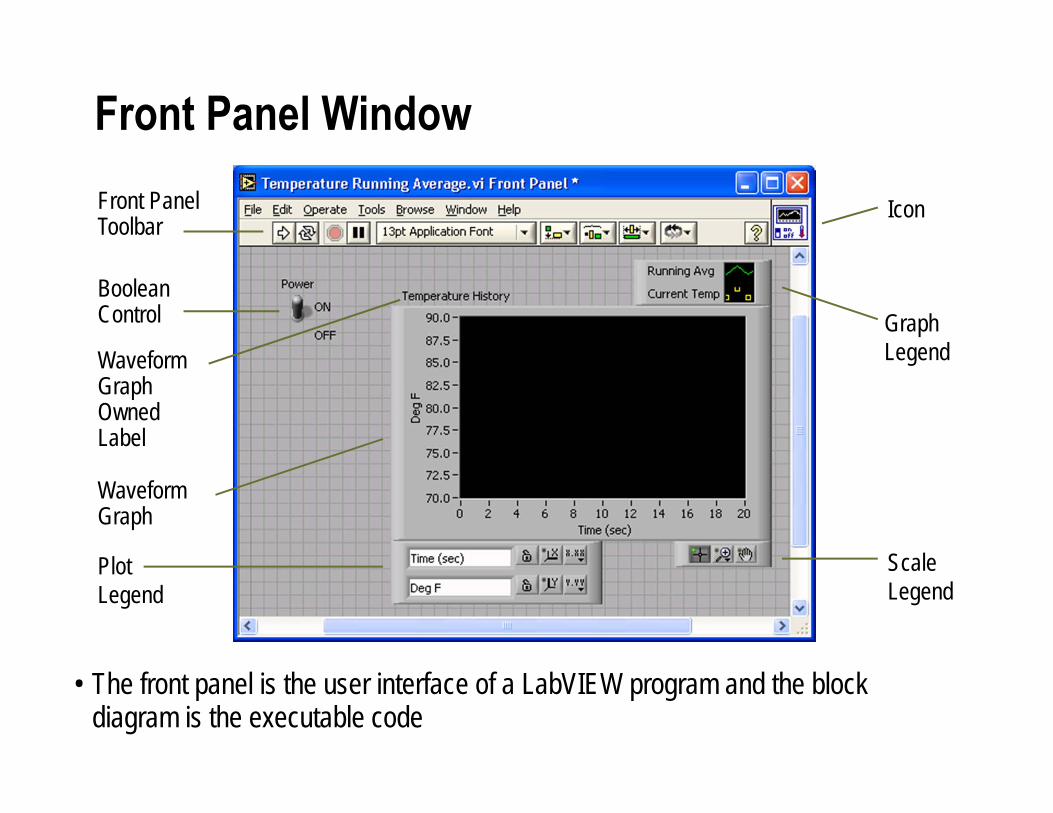
Front Panel WindowFront Panel Toolbar
GraphLegend
BooleanControl
WaveformGraph
Icon
PlotLegend
ScaleLegend
WaveformGraphOwned Label
• The front panel is the user interface of a LabVIEW program and the block diagram is the executable code
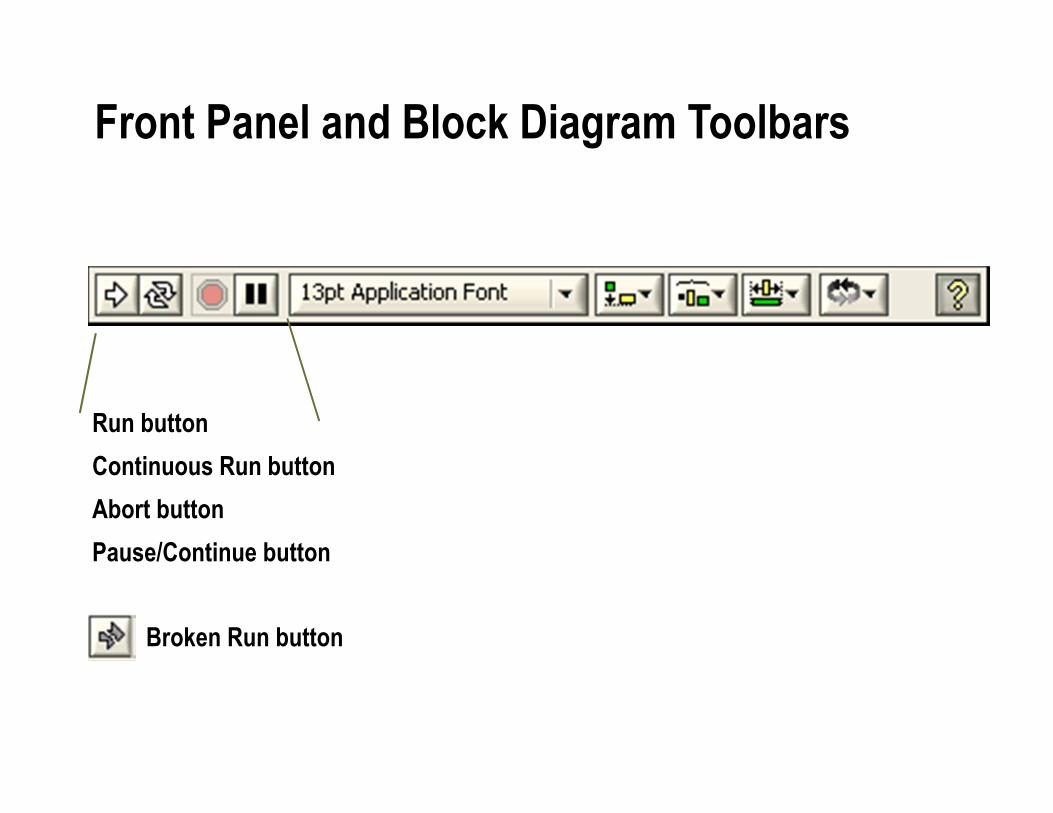
Front Panel and Block Diagram Toolbars
Run button Continuous Run buttonAbort buttonPause/Continue button
Broken Run button
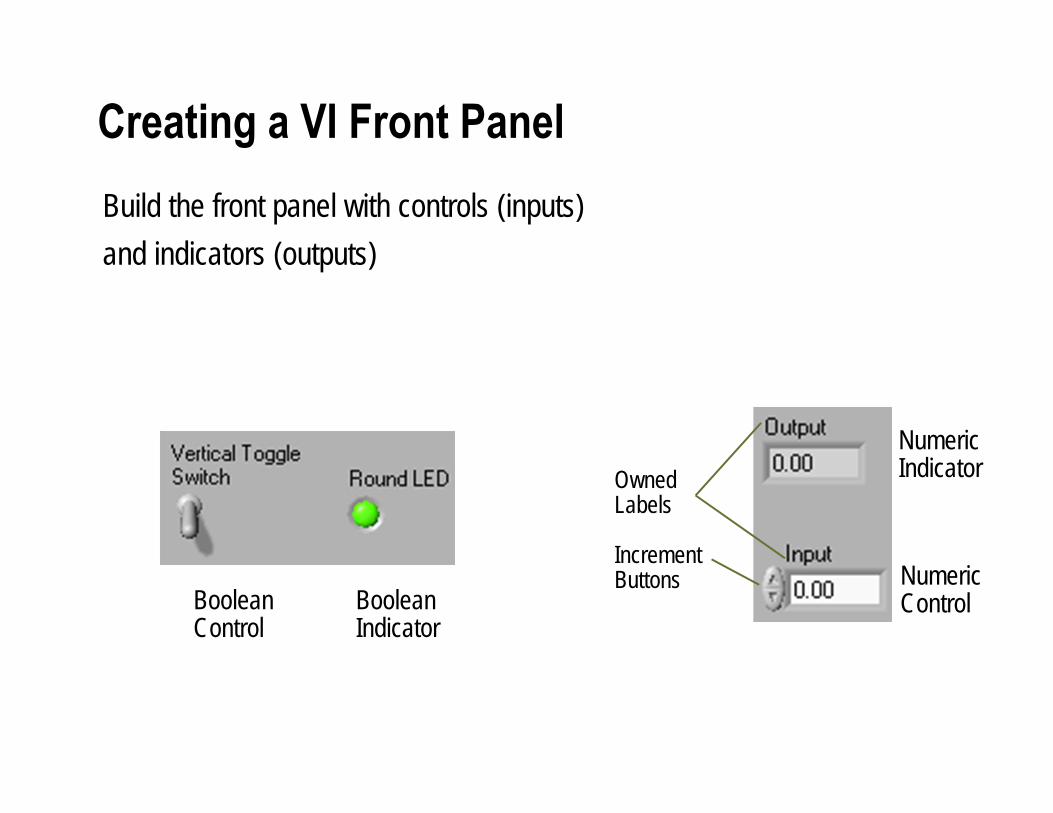
Build the front panel with controls (inputs) and indicators (outputs)
NumericControl
NumericIndicator Owned
Labels
IncrementButtons
BooleanControl
BooleanIndicator
Creating a VI Front Panel
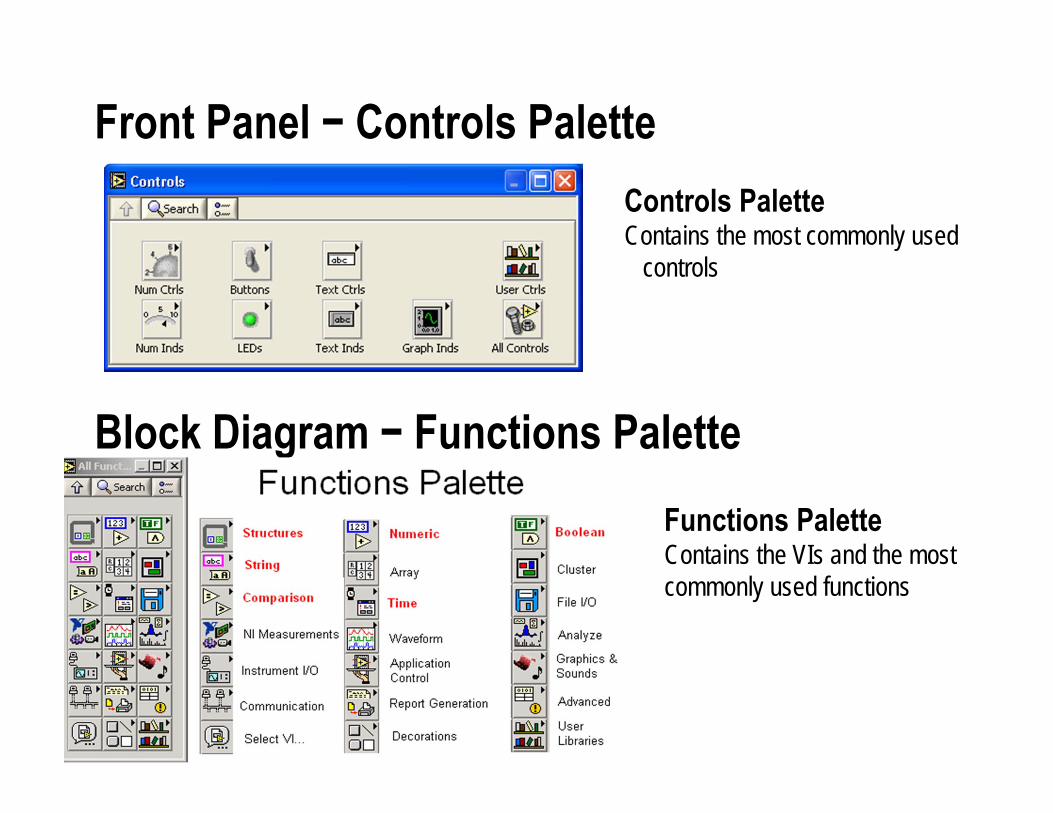
Front Panel − Controls PaletteControls PaletteContains the most commonly used
controls
Block Diagram − Functions PaletteFunctions PaletteContains the VIs and the most commonly used functions
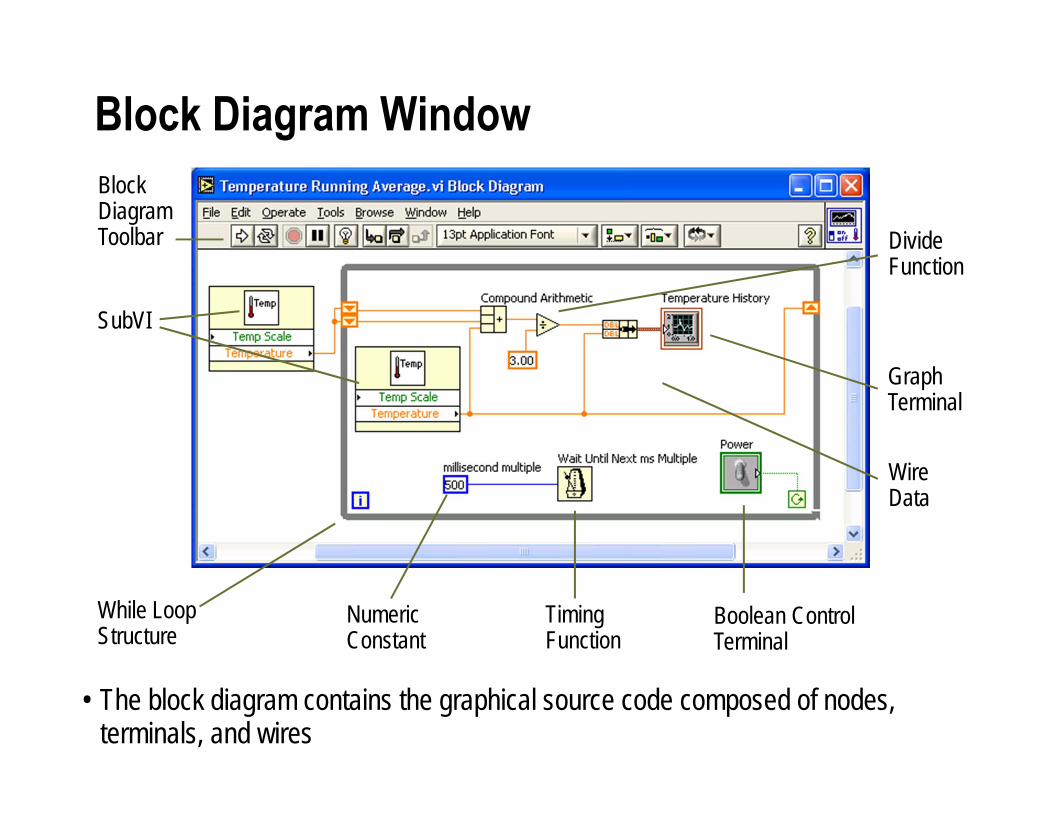
Block Diagram Window
Wire Data
GraphTerminal
SubVI
While LoopStructure
Block Diagram Toolbar Divide
Function
Numeric Constant
Timing Function
Boolean Control Terminal
• The block diagram contains the graphical source code composed of nodes, terminals, and wires
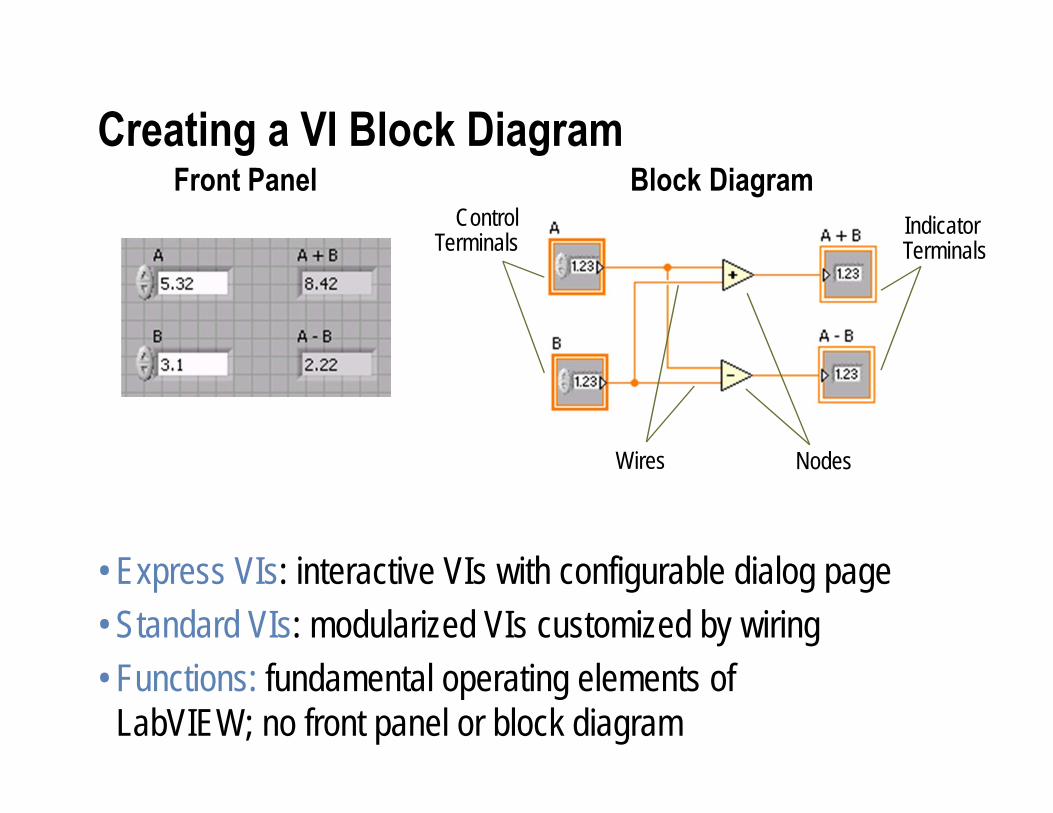
NodesWires
ControlTerminals
Block DiagramFront PanelIndicator Terminals
Creating a VI Block Diagram
• Express VIs: interactive VIs with configurable dialog page• Standard VIs: modularized VIs customized by wiring• Functions: fundamental operating elements of
LabVIEW; no front panel or block diagram

Context Help• To display the Context Help window, select
Help»Show Context Help, press the <Ctrl-H> keys• Move cursor over object to display help• Connections:
Required – bold, Recommended – normal, Optional - dimmed
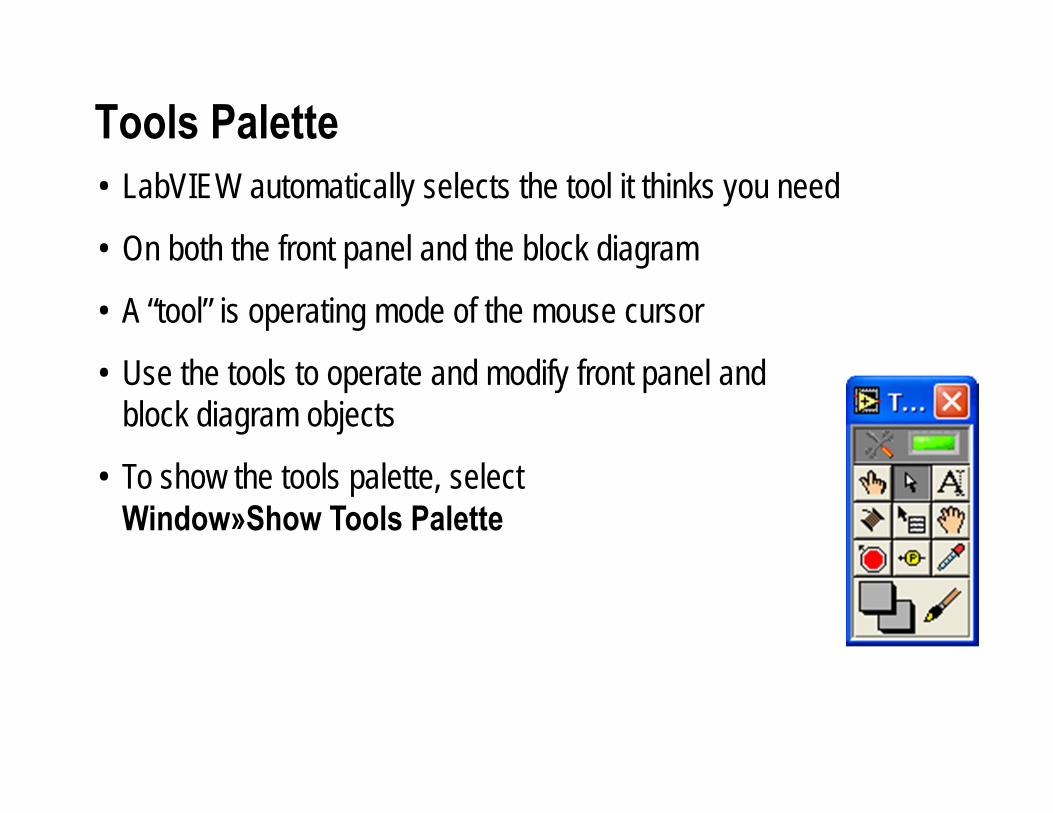
Tools Palette• LabVIEW automatically selects the tool it thinks you need
• On both the front panel and the block diagram
• A “tool” is operating mode of the mouse cursor
• Use the tools to operate and modify front panel and block diagram objects
• To show the tools palette, select Window»Show Tools Palette
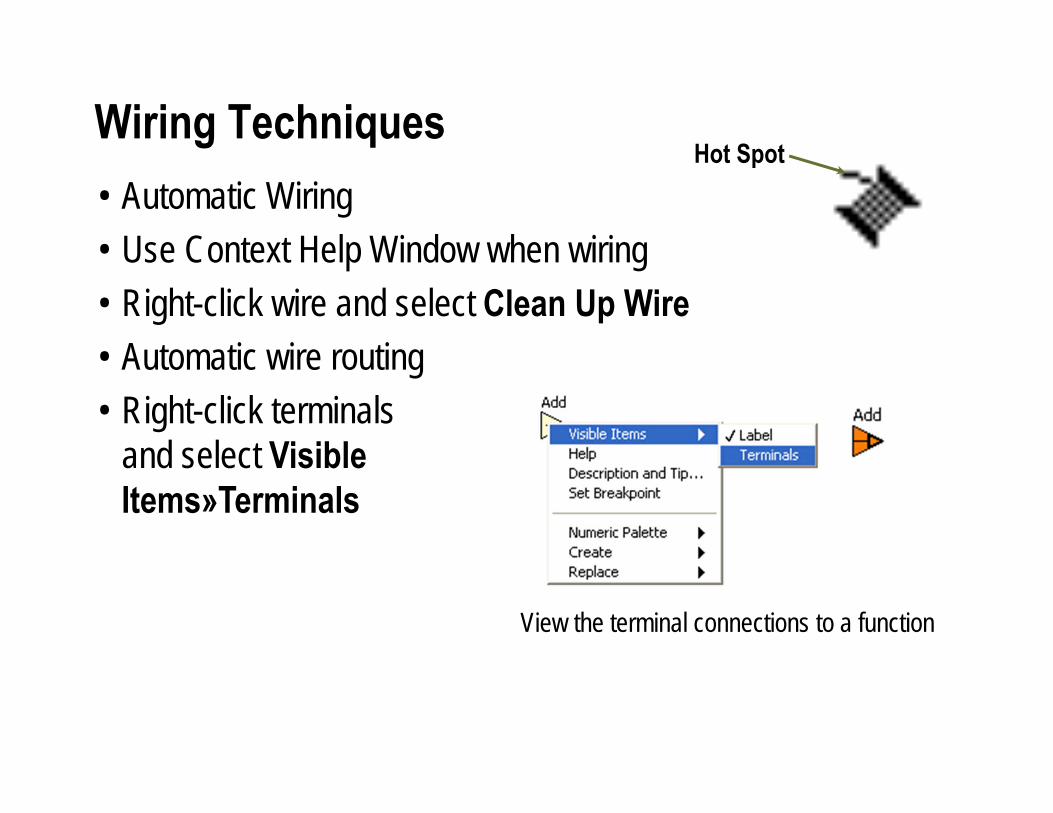
Wiring Techniques Hot Spot
• Automatic Wiring• Use Context Help Window when wiring• Right-click wire and select Clean Up Wire• Automatic wire routing• Right-click terminals
and select Visible Items»Terminals
View the terminal connections to a function
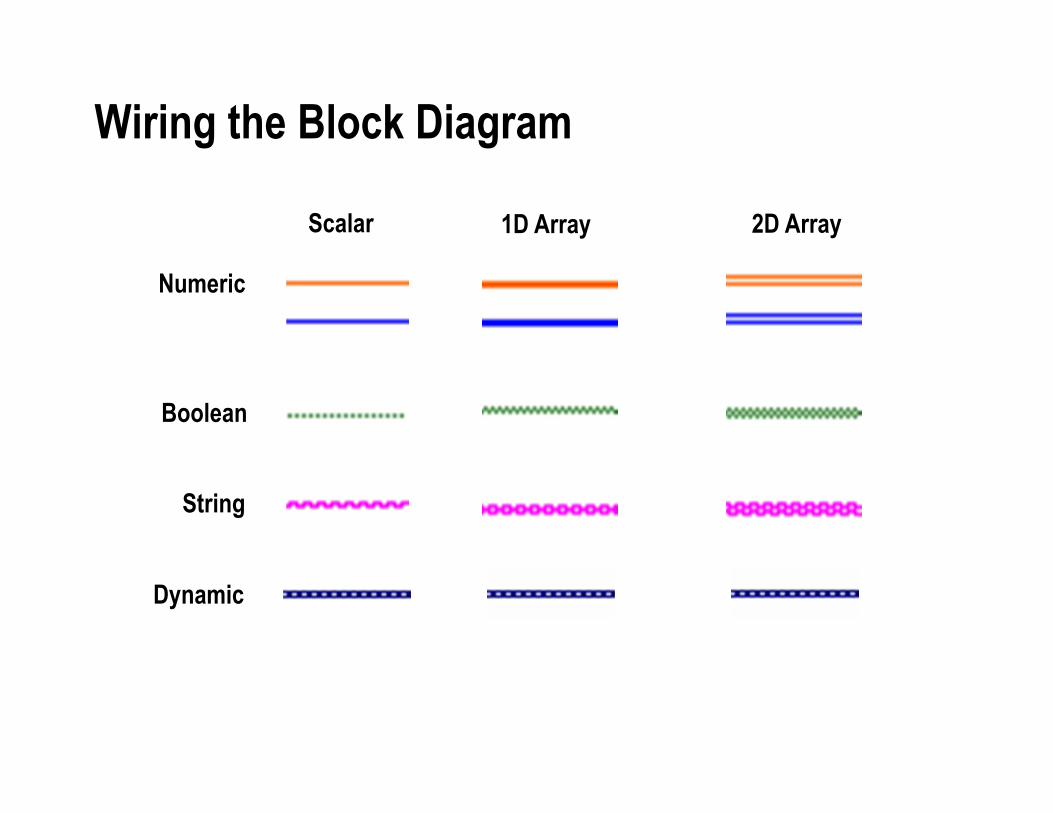
Wiring the Block Diagram
Scalar
Numeric
Boolean
String
2D Array1D Array
Dynamic
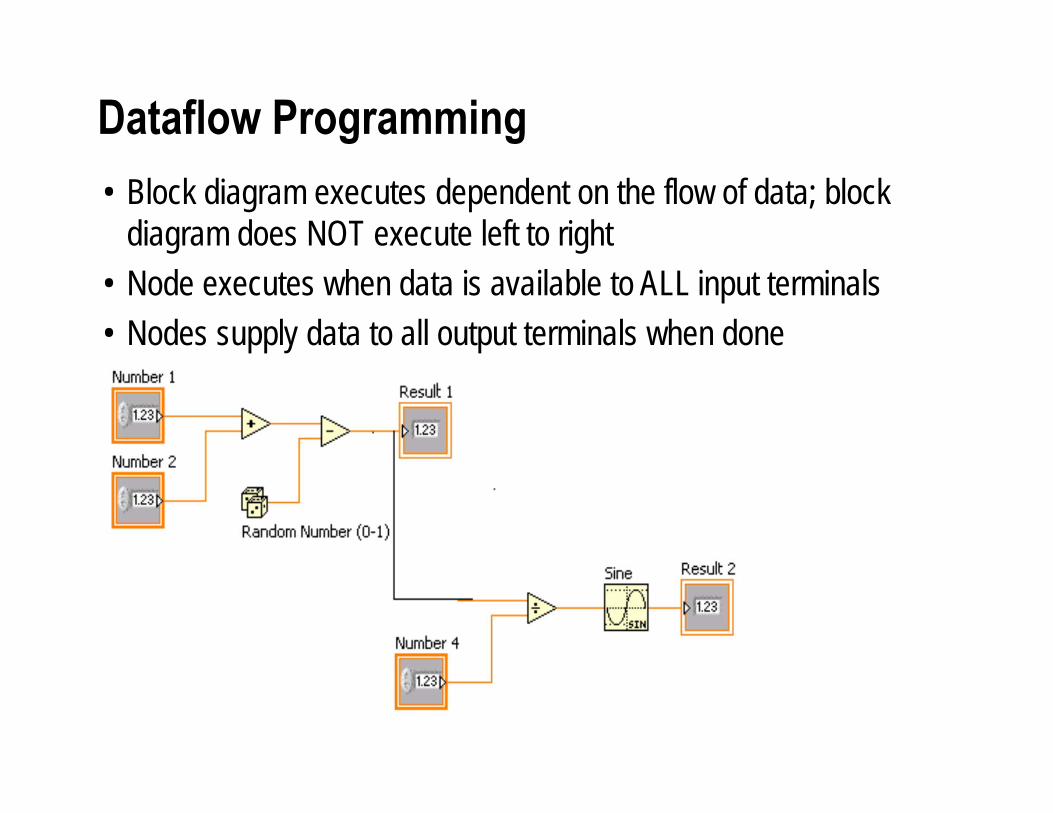
• Block diagram executes dependent on the flow of data; block diagram does NOT execute left to right
• Node executes when data is available to ALL input terminals• Nodes supply data to all output terminals when done
Dataflow Programming
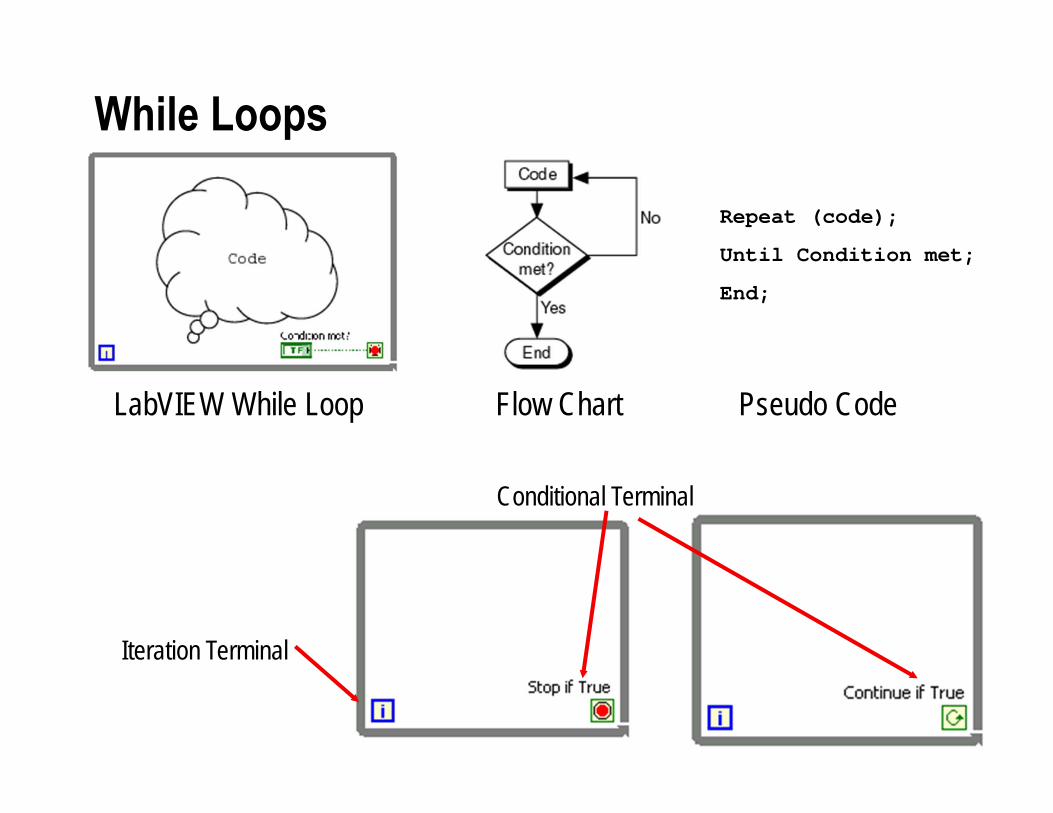
While Loops
LabVIEW While Loop Flow Chart Pseudo Code
Repeat (code);
Until Condition met;
End;
Iteration Terminal
Conditional Terminal
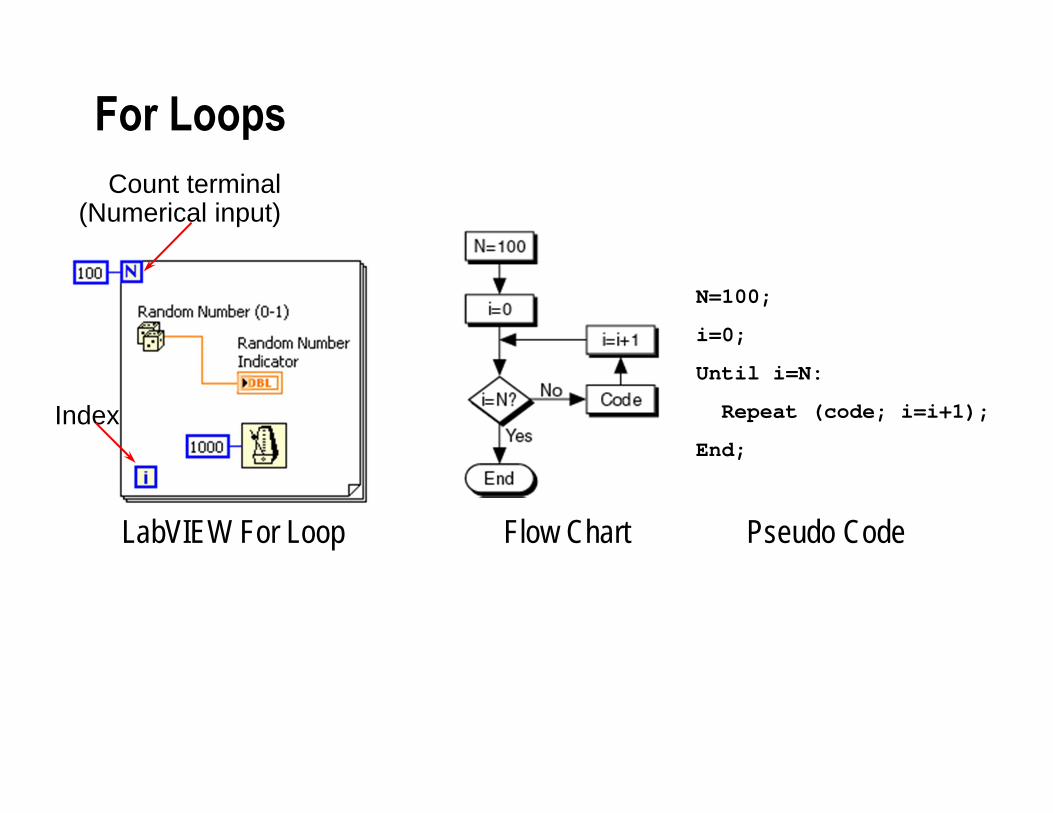
For Loops
LabVIEW For Loop Flow Chart Pseudo Code
N=100;
i=0;
Until i=N:
Repeat (code; i=i+1);
End;
Count terminal(Numerical input)
Index
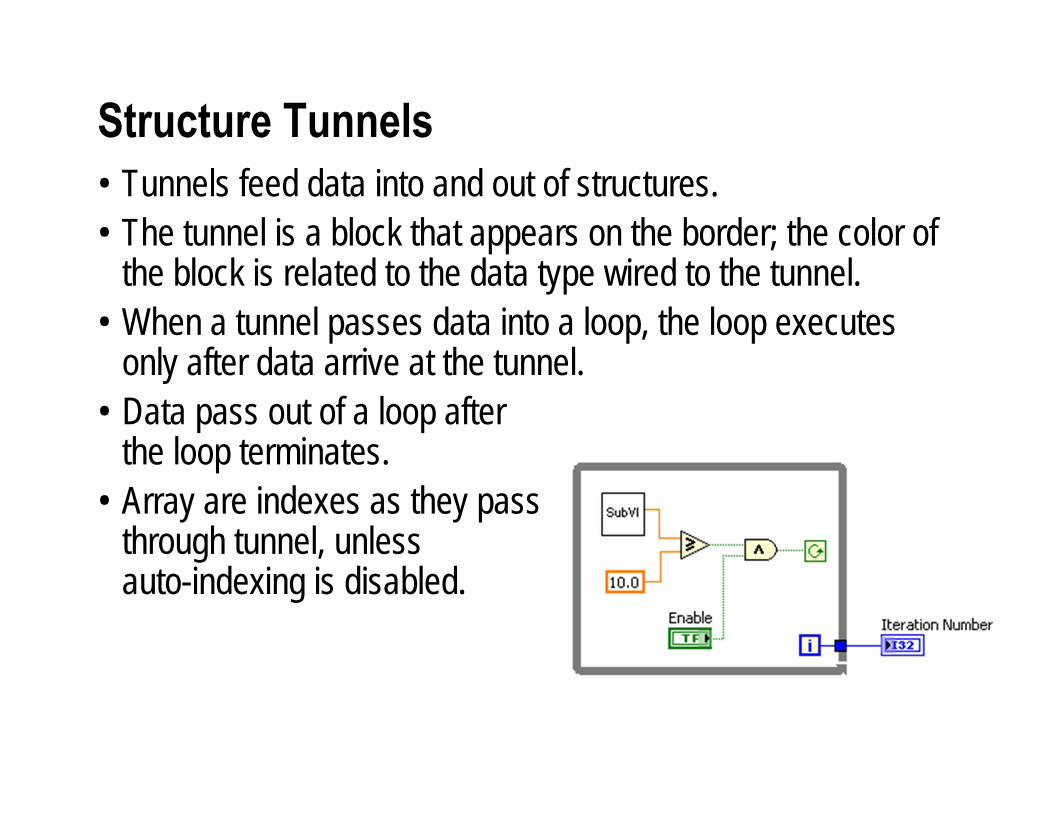
Structure Tunnels• Tunnels feed data into and out of structures. • The tunnel is a block that appears on the border; the color of
the block is related to the data type wired to the tunnel. • When a tunnel passes data into a loop, the loop executes
only after data arrive at the tunnel.• Data pass out of a loop after
the loop terminates. • Array are indexes as they pass
through tunnel, unless auto-indexing is disabled.
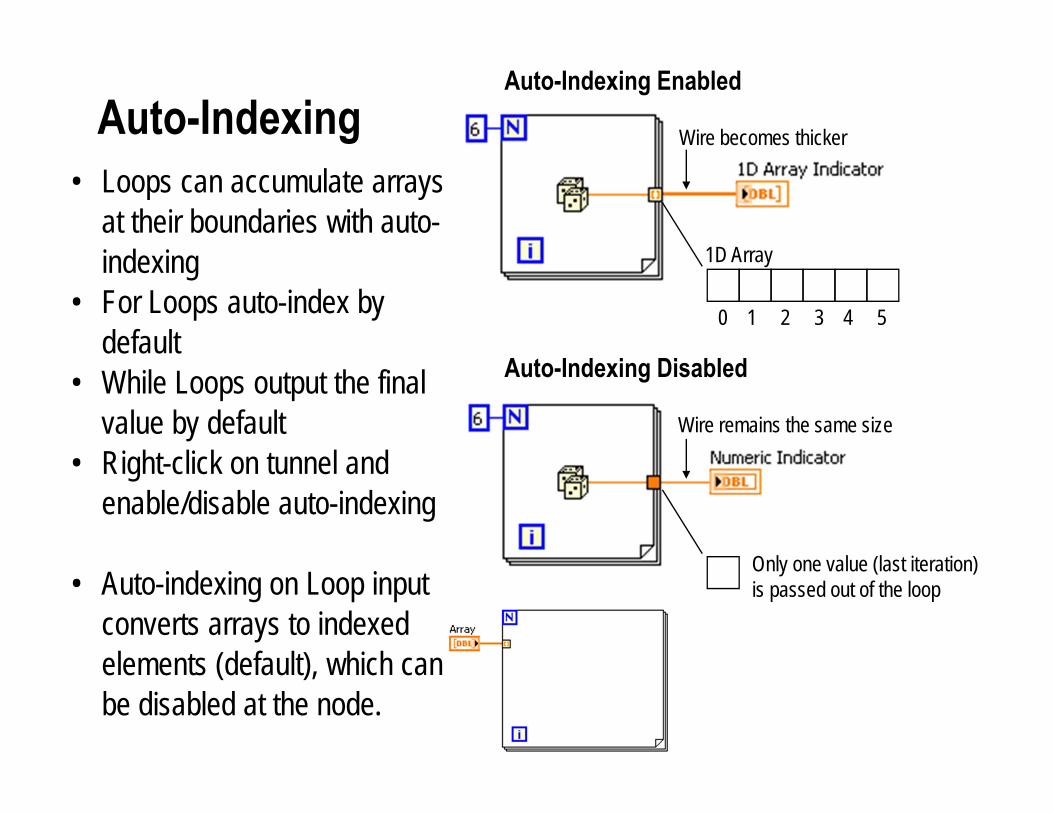
• Loops can accumulate arrays at their boundaries with auto-indexing
• For Loops auto-index by default
• While Loops output the final value by default
• Right-click on tunnel and enable/disable auto-indexing
• Auto-indexing on Loop input converts arrays to indexed elements (default), which can be disabled at the node.
Auto-Indexing Wire becomes thicker
Wire remains the same size
Auto-Indexing Disabled
Auto-Indexing Enabled
Only one value (last iteration) is passed out of the loop
1D Array
0 1 2 3 4 5
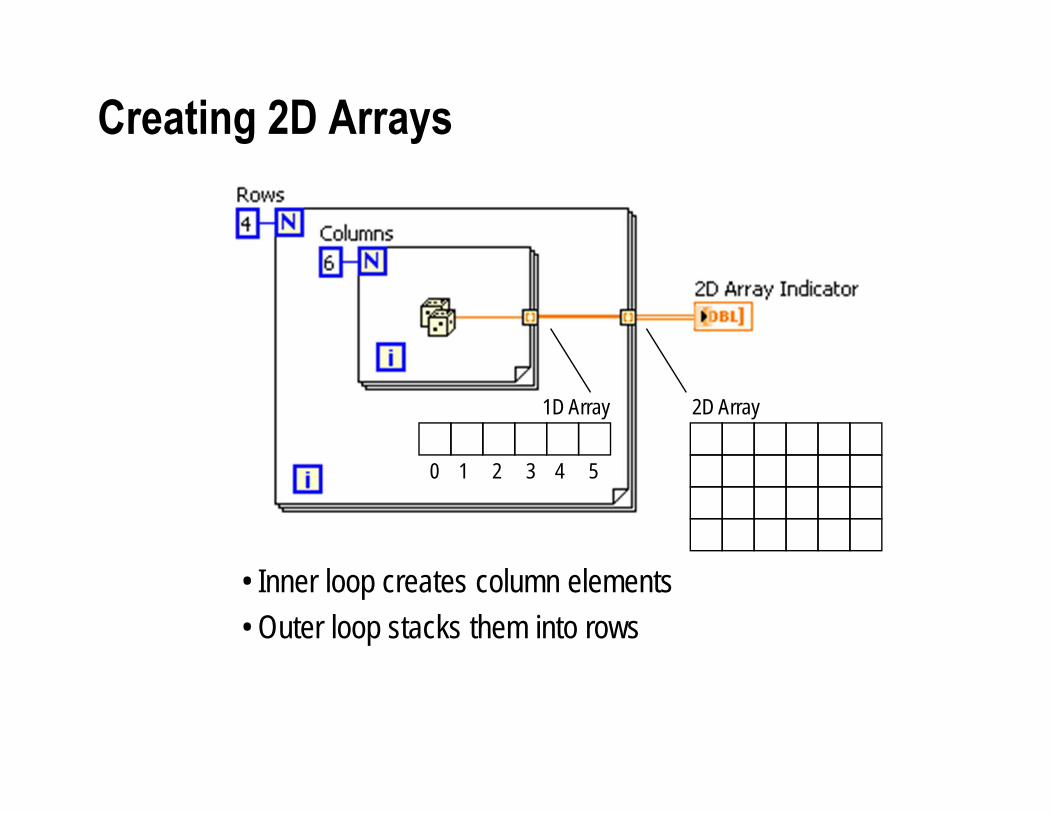
• Inner loop creates column elements• Outer loop stacks them into rows
Creating 2D Arrays
1D Array
0 1 2 3 4 5
2D Array