Embed Size (px)
Citation preview
Based with permission on lectures by John GettyPHSX 262 Spring 2011 Lecture 5 Page 1
Today2/15/11 Lecture 5Fourier Series
• Time-Frequency Decomposition/Superposition• Fourier Components (Ex. Square wave)• Filtering• Spectrum Analysis
– Windowing– Fast Fourier Transform– Sweep Frequency Analyzer
Homework: (due next Tuesday)1) Write down the expected powers and dBVs for the 3rd harmonic of all four functions in the lab if
they were 2 Vpp functions (versus 1Vpp functions).2) For a square wave of period 300 microseconds that goes from -1 volts to +1 volts into 50 ohms,
what are the frequencies and powers in the 4 strongest frequency components? Does it matter how square wave is centered in time (i.e. odd or even with respect to t=0)?
3) How much power in watts is dissipated into a 50 ohm resistor by a -13dBV signal?4) What is the ratio of the powers and the voltages of a -27dBV signal and a -33dBV signal?
Reading• See Prelab• Horowitz and Hill 2nd Ed., pages 1025-1038.• Optional: see references at end of lecture.
LabFourier AnalysisDo prelab before lab starts.
Based with permission on lectures by John GettyPHSX 262 Spring 2011 Lecture 5 Page 2
Fourier’s TheoremFrench mathematician Joseph Fourier
(1768-1830), discovered that he could represent any real functions with a series of weighted sines and cosines.
In circuit analysis we use Fourier’s Theorem to “decompose” a complex time domain signal into its discrete sinusoidal parts (the frequency domain.) Superposition of these frequency component returns the signal to the time domain.
Based with permission on lectures by John GettyPHSX 262 Spring 2011 Lecture 5 Page 3
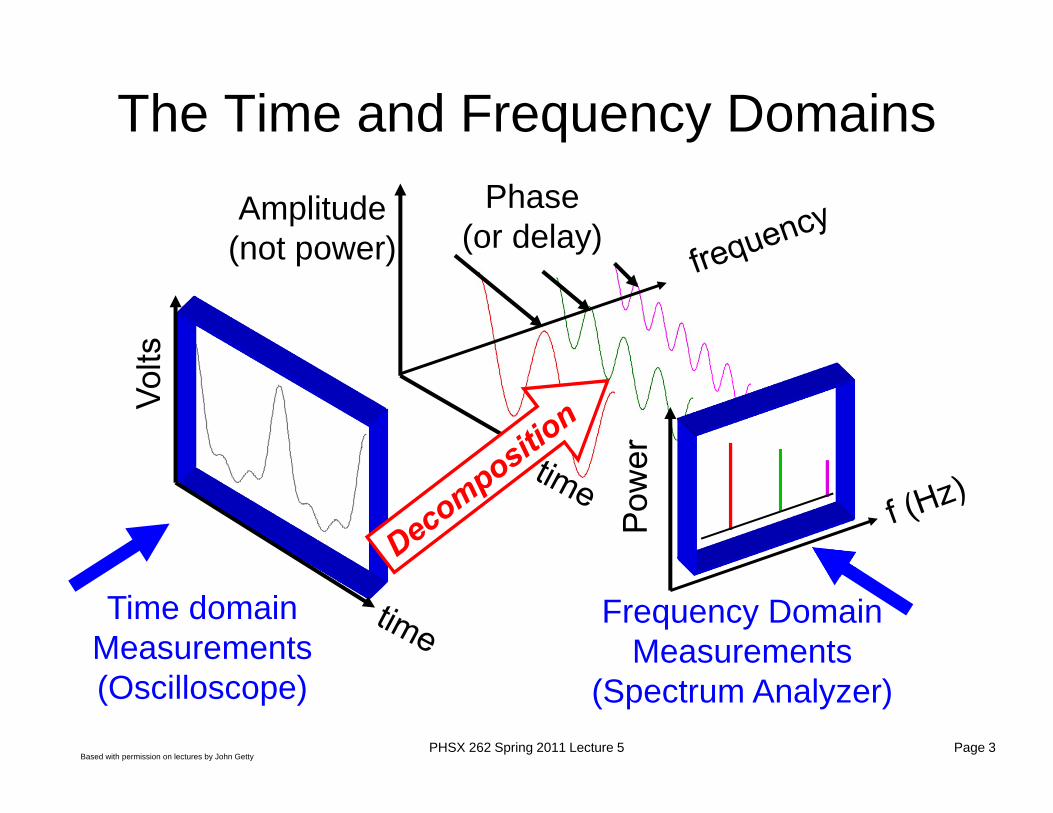
The Time and Frequency DomainsAmplitude
(not power)
Time domainMeasurements(Oscilloscope)
Frequency DomainMeasurements
(Spectrum Analyzer)
Phase(or delay)
Based with permission on lectures by John GettyPHSX 262 Spring 2011 Lecture 5 Page 4
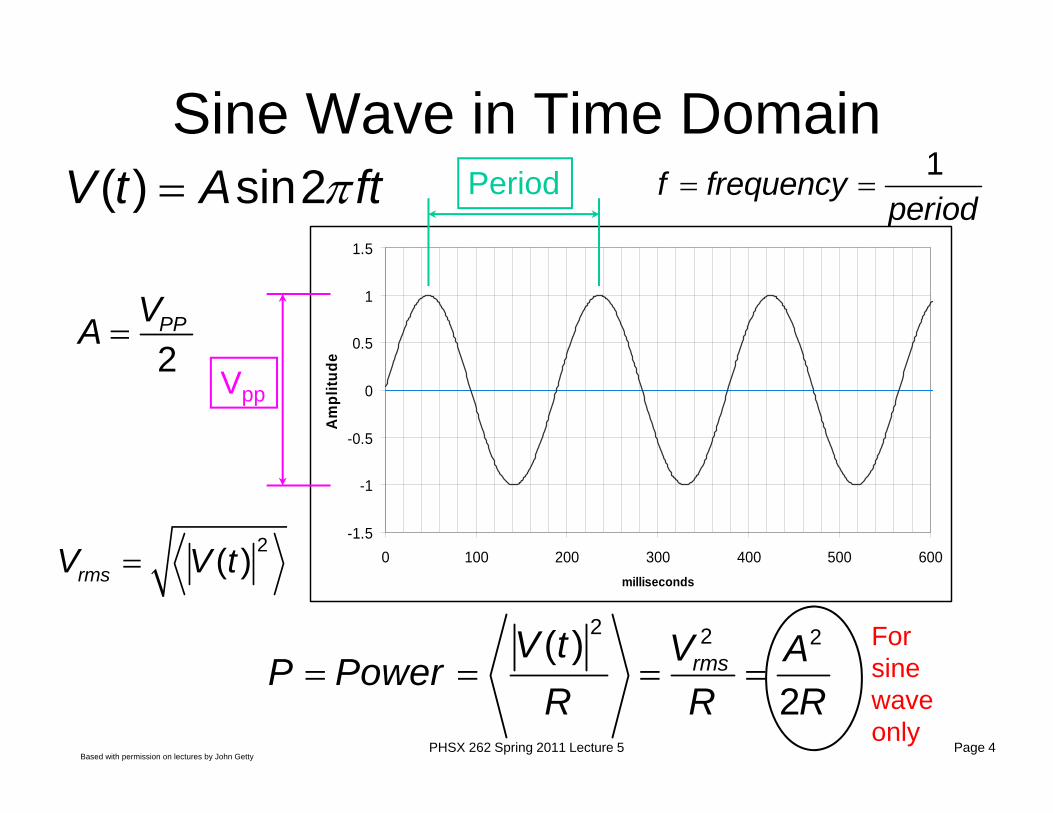
Sine Wave in Time Domain
-1.5
-1
-0.5
0
0.5
1
1.5
0 100 200 300 400 500 600milliseconds
Am
plitu
de
Vpp
Period
2PPVA
1f frequency
period( ) sin2V t A ft
2 2 2( )
2rmsV t V AP Power
R R R
2( )rmsV V t
For sine wave only
Based with permission on lectures by John GettyPHSX 262 Spring 2011 Lecture 5 Page 5
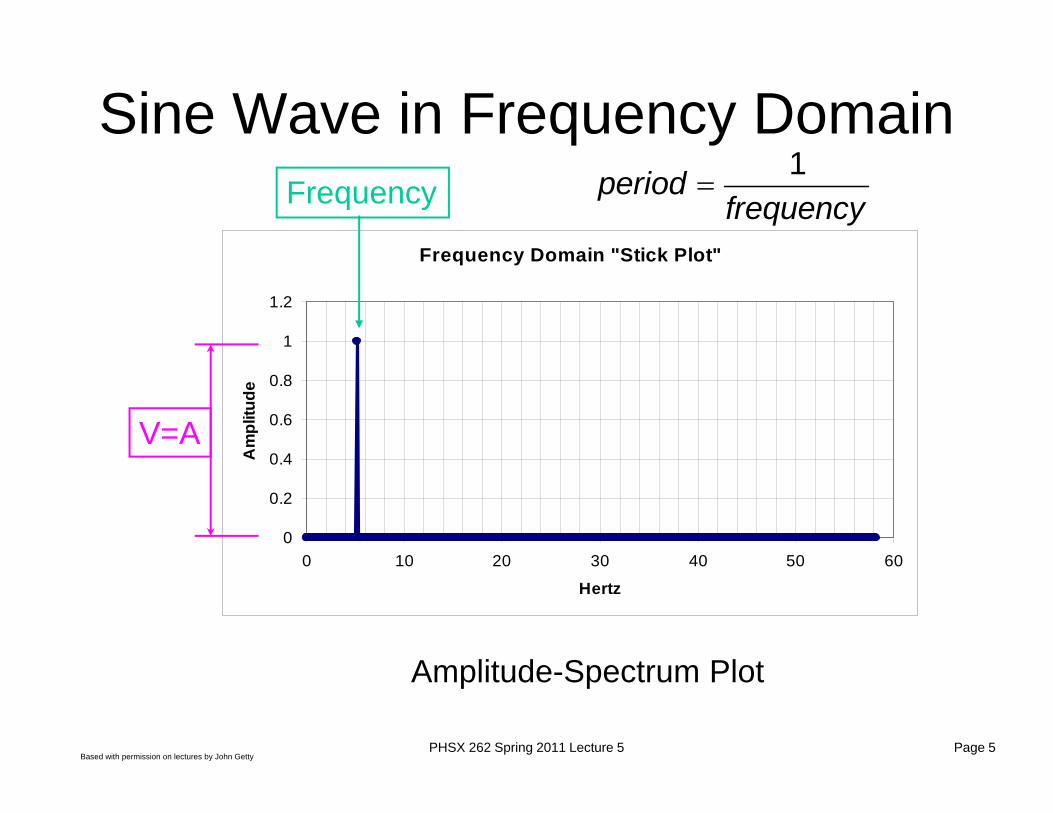
Frequency Domain "Stick Plot"
0
0.2
0.4
0.6
0.8
1
1.2
0 10 20 30 40 50 60
Hertz
Am
plitu
de
Sine Wave in Frequency Domain
V=A
Frequency1period
frequency
Amplitude-Spectrum Plot
Based with permission on lectures by John GettyPHSX 262 Spring 2011 Lecture 5 Page 6
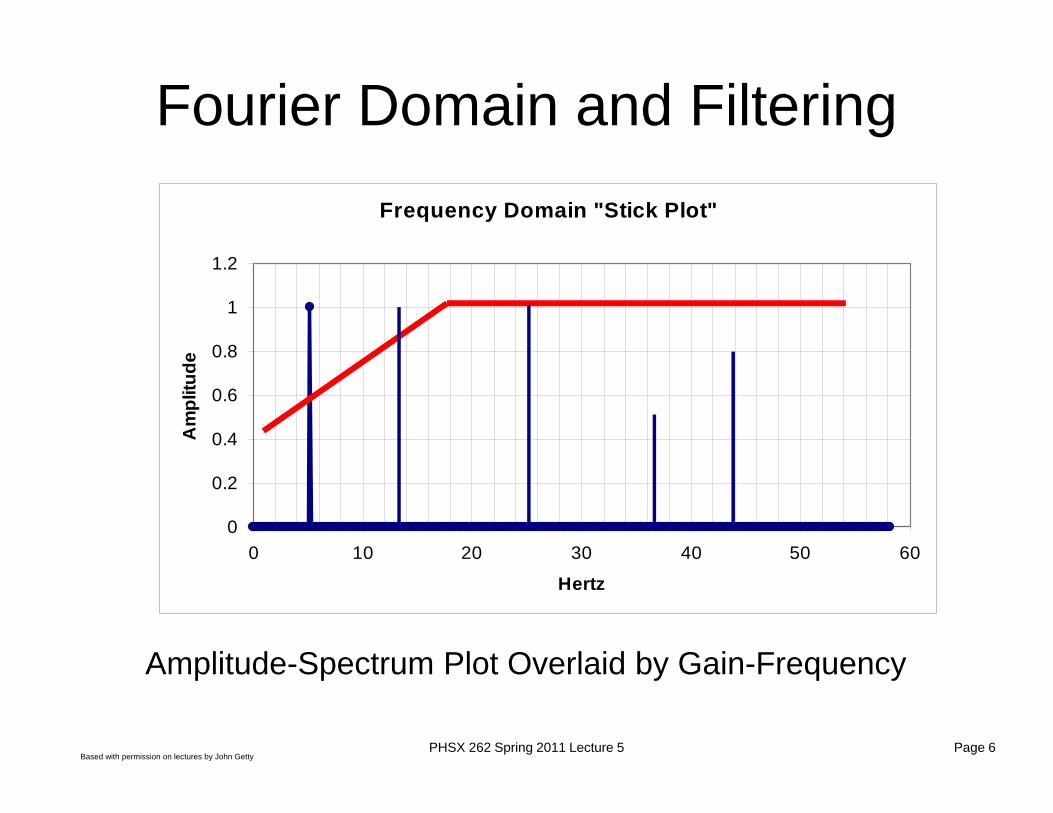
Frequency Domain "Stick Plot"
0
0.2
0.4
0.6
0.8
1
1.2
0 10 20 30 40 50 60
Hertz
Am
plitu
de
Fourier Domain and Filtering
Amplitude-Spectrum Plot Overlaid by Gain-Frequency
Based with permission on lectures by John GettyPHSX 262 Spring 2011 Lecture 5 Page 7
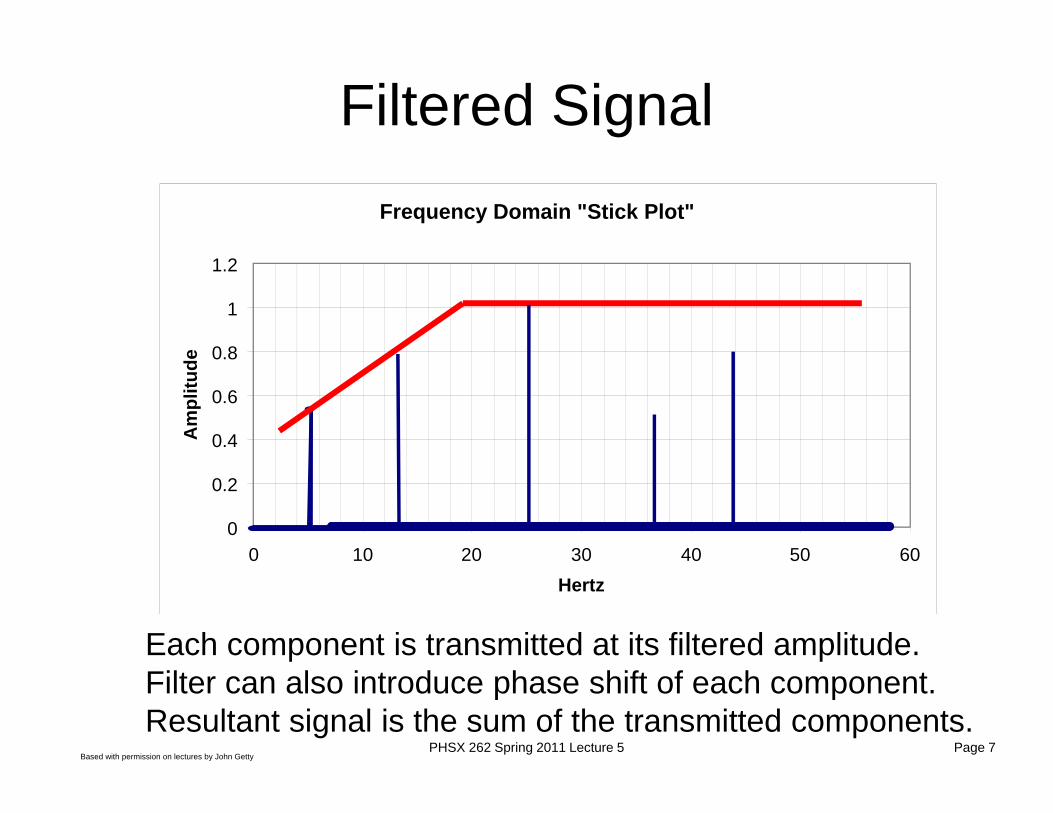
Filtered Signal
Each component is transmitted at its filtered amplitude.Filter can also introduce phase shift of each component.Resultant signal is the sum of the transmitted components.
Frequency Domain "Stick Plot"
0
0.2
0.4
0.6
0.8
1
1.2
0 10 20 30 40 50 60Hertz
Am
plitu
de
Based with permission on lectures by John GettyPHSX 262 Spring 2011 Lecture 5 Page 8
With permission, Agilent Technologies
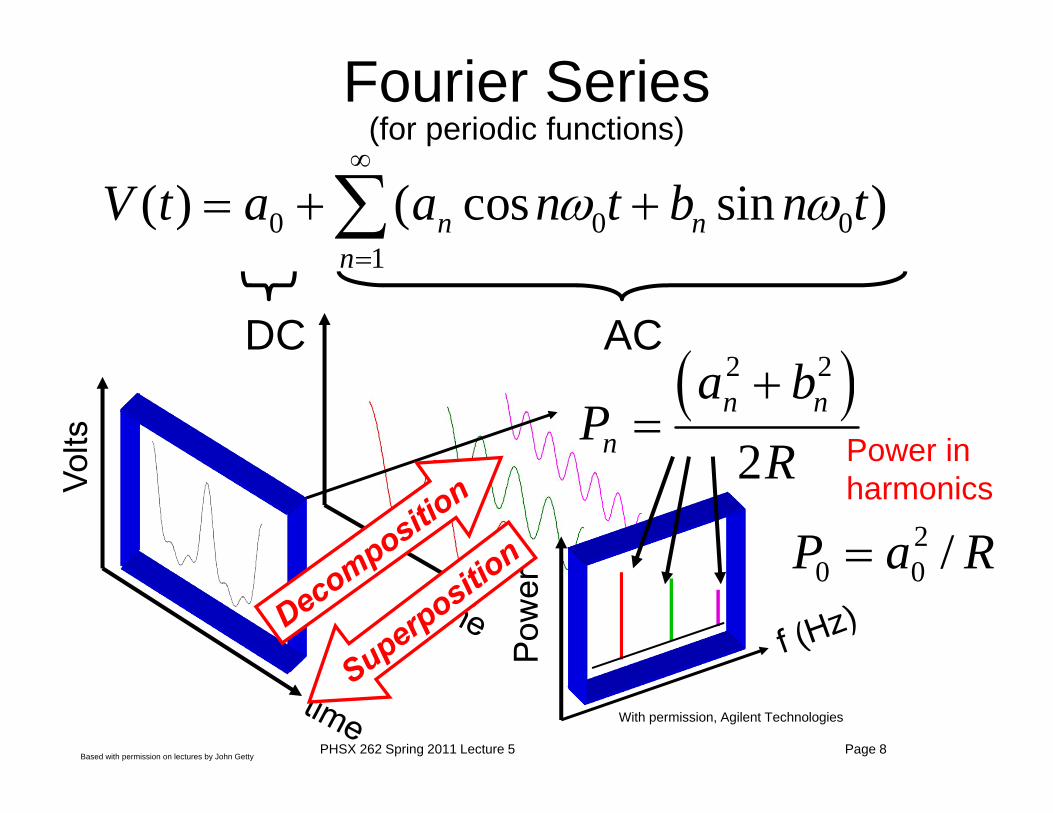
0 0 01
( ) ( cos sin )n nn
V t a a n t b n t
ACDC
Fourier Series
2 2
2n n
n
a bP
R
(for periodic functions)
20 0 /P a R
Power in harmonics
Based with permission on lectures by John GettyPHSX 262 Spring 2011 Lecture 5 Page 9
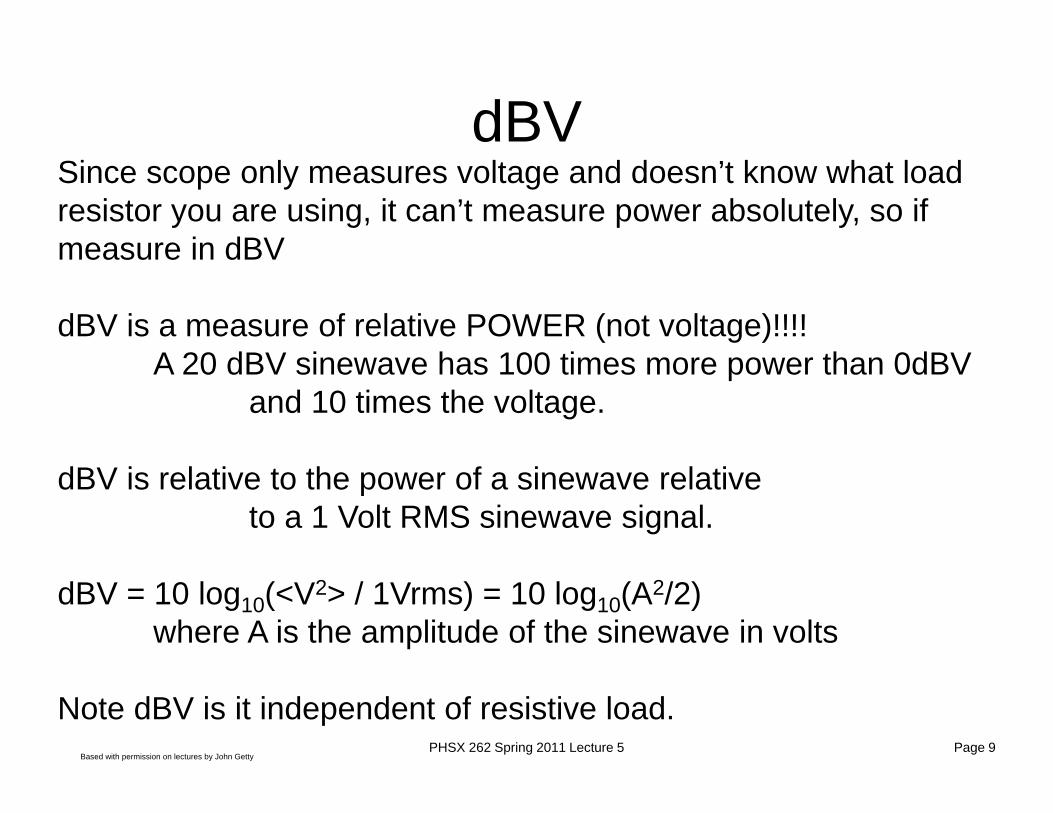
dBVSince scope only measures voltage and doesn’t know what load resistor you are using, it can’t measure power absolutely, so if measure in dBV
dBV is a measure of relative POWER (not voltage)!!!!A 20 dBV sinewave has 100 times more power than 0dBV
and 10 times the voltage.
dBV is relative to the power of a sinewave relative to a 1 Volt RMS sinewave signal.
dBV = 10 log10(<V2> / 1Vrms) = 10 log10(A2/2) where A is the amplitude of the sinewave in volts
Note dBV is it independent of resistive load.
Based with permission on lectures by John GettyPHSX 262 Spring 2011 Lecture 5 Page 10
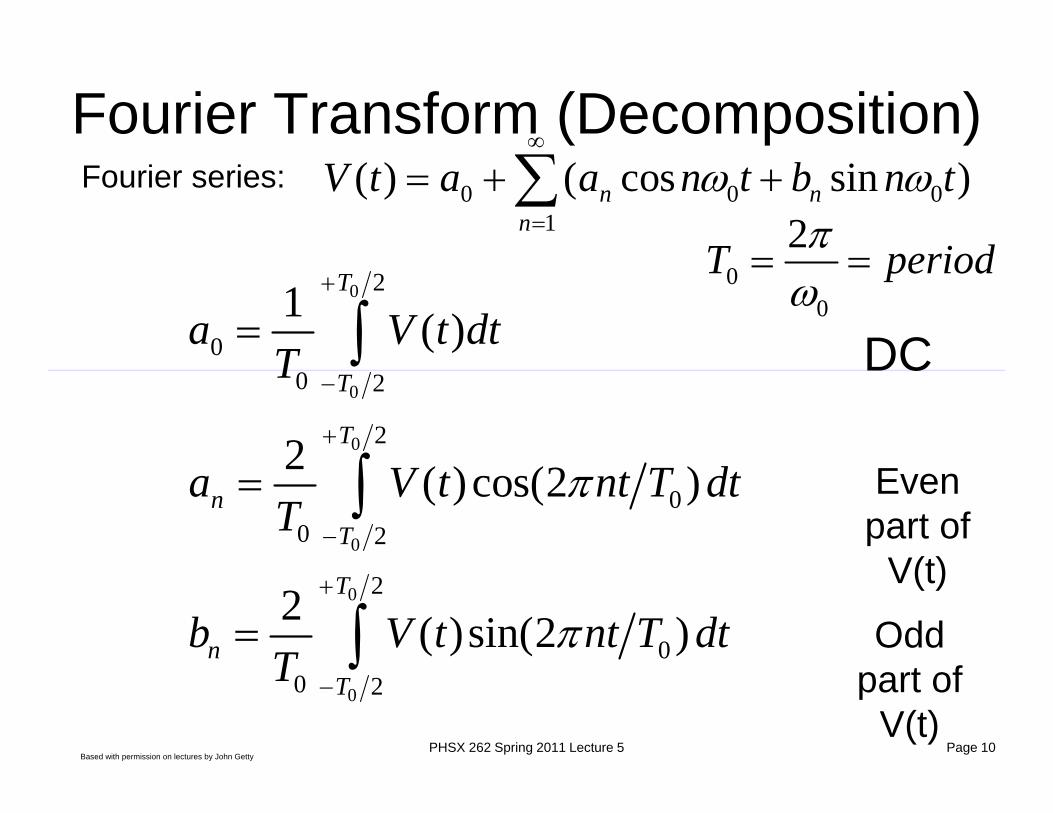
Fourier Transform (Decomposition)0 0 0
1
( ) ( cos sin )n nn
V t a a n t b n t
Fourier series:
0
0
2
00 2
1 ( )T
T
a V t dtT
0
0
2
00 2
2 ( )cos(2 )T
nT
a V t nt T dtT
0
0
2
00 2
2 ( )sin(2 )T
nT
b V t nt T dtT
DC
Even part of
V(t)
Odd part of
V(t)
00
2T period
Based with permission on lectures by John GettyPHSX 262 Spring 2011 Lecture 5 Page 11
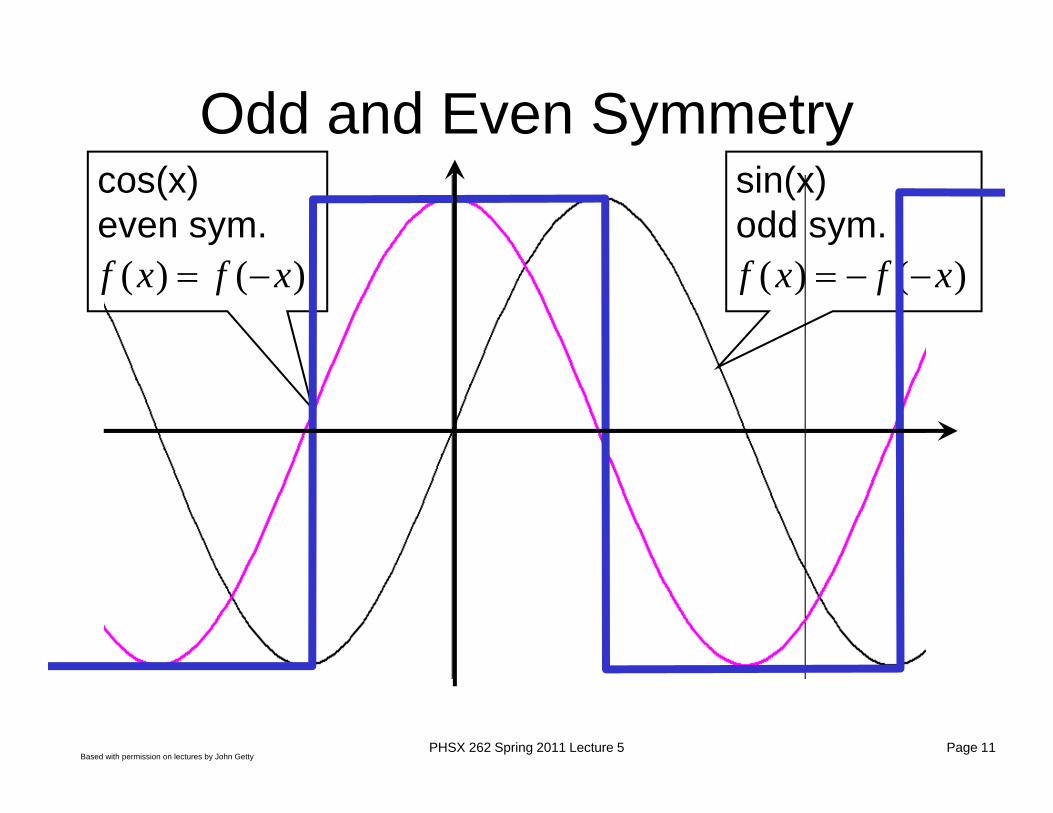
Odd and Even Symmetrycos(x)even sym.
( ) ( )f x f x
sin(x)odd sym.
( ) ( )f x f x
Based with permission on lectures by John GettyPHSX 262 Spring 2011 Lecture 5 Page 12
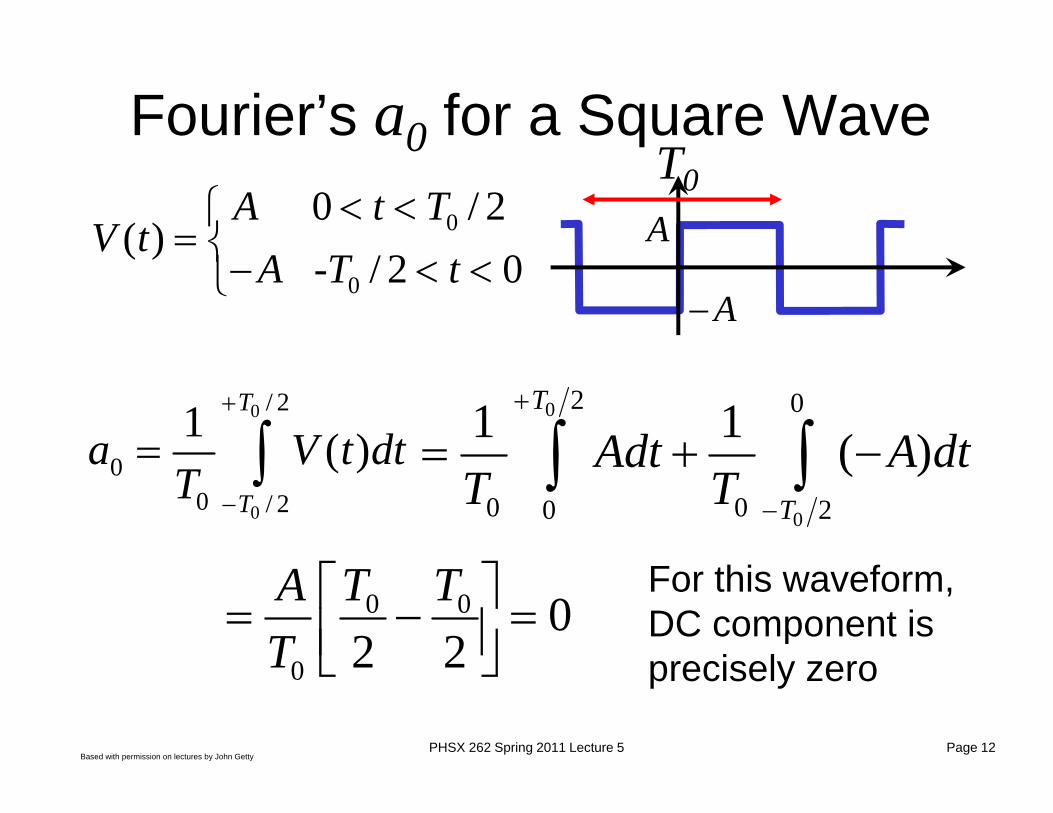
Fourier’s a0 for a Square WaveT0
0
0
0 / 2( )
- / 2 0A t T
V tA T t
0
0
/ 2
00 / 2
1 ( )T
T
a V t dtT
0
0
2 0
0 00 2
1 1 ( )T
T
Adt A dtT T
0 0
0
02 2
A T TT
A
A
For this waveform, DC component is precisely zero
Based with permission on lectures by John GettyPHSX 262 Spring 2011 Lecture 5 Page 13
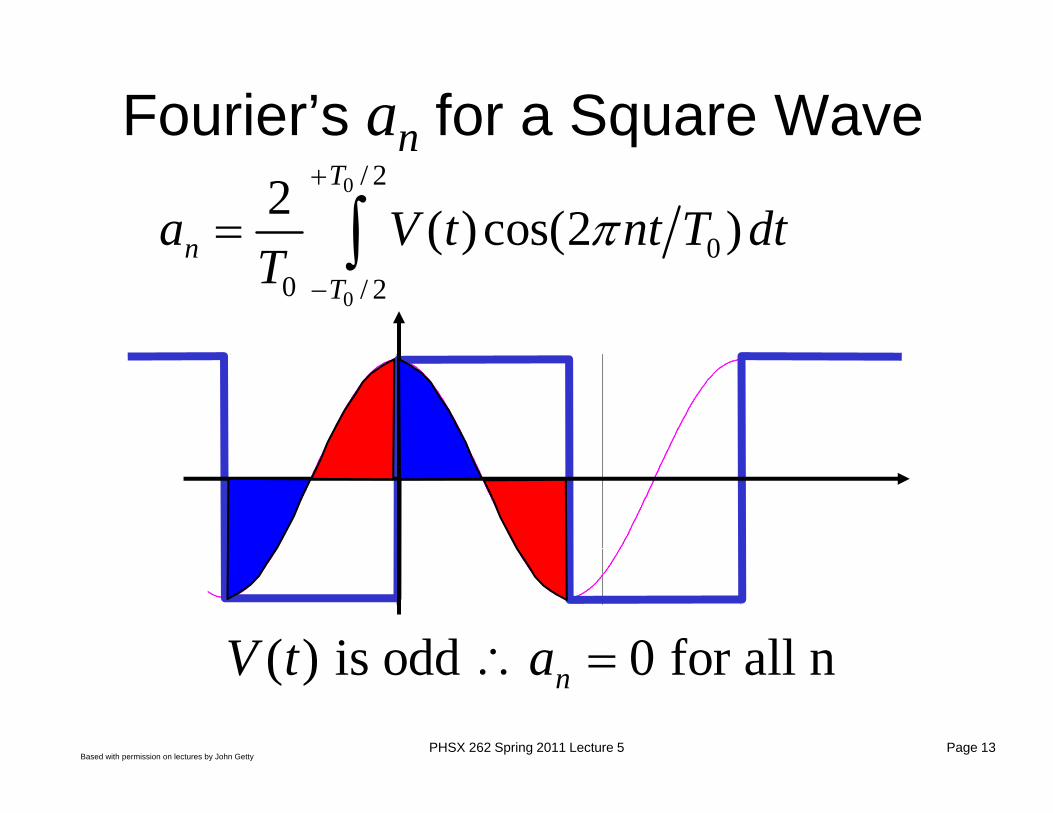
Fourier’s an for a Square Wave0
0
/ 2
00 / 2
2 ( )cos(2 )T
nT
a V t nt T dtT
( ) is odd 0 for all nnV t a
Based with permission on lectures by John GettyPHSX 262 Spring 2011 Lecture 5 Page 14
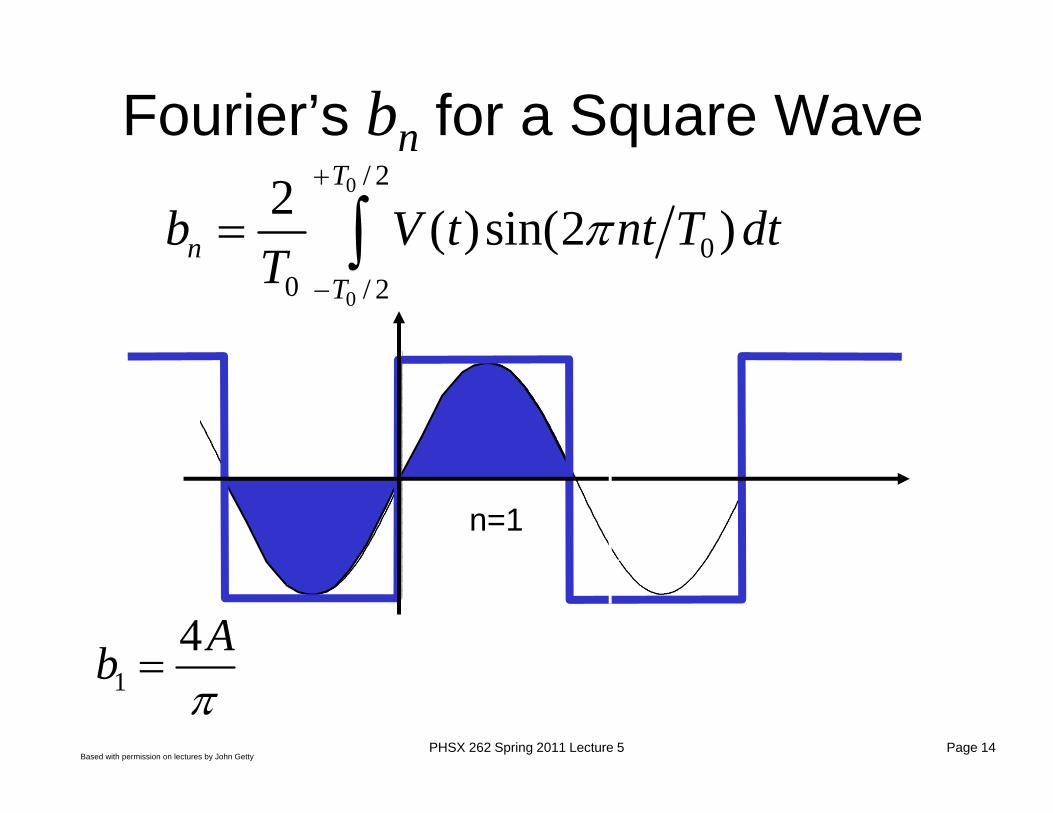
n=1
14Ab
Fourier’s bn for a Square Wave0
0
/ 2
00 / 2
2 ( )sin(2 )T
nT
b V t nt T dtT
Based with permission on lectures by John GettyPHSX 262 Spring 2011 Lecture 5 Page 15
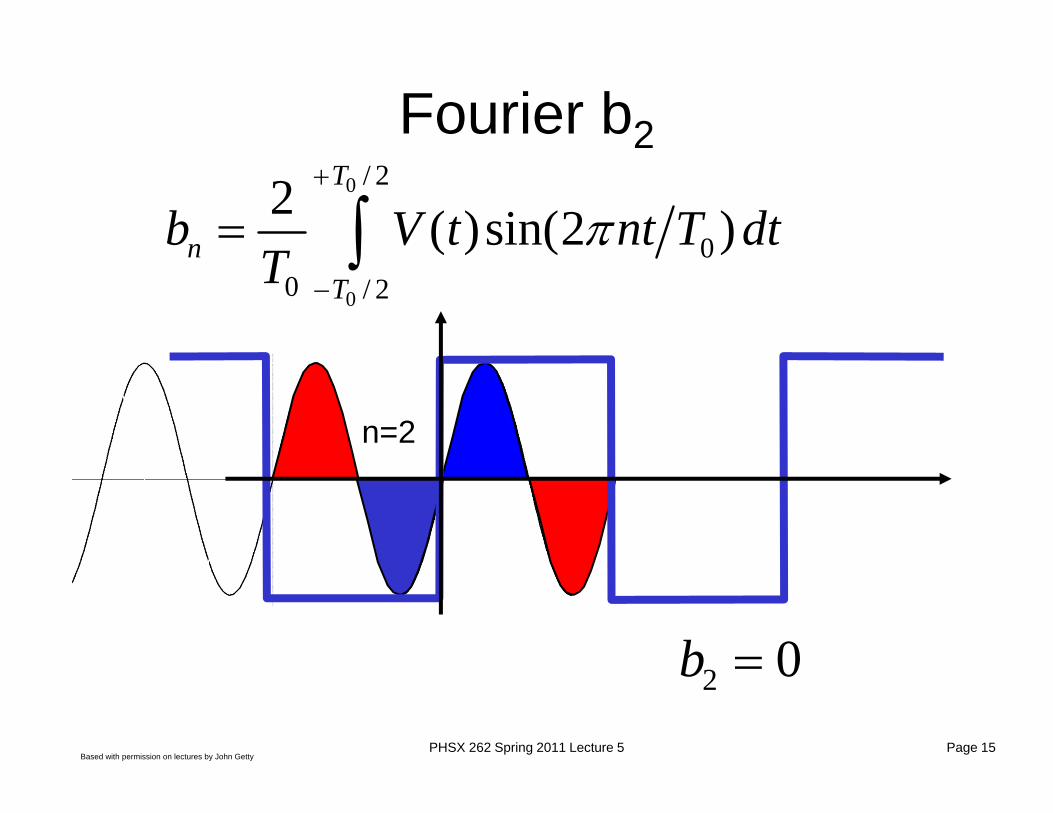
n=2
Fourier b2
2 0b
0
0
/ 2
00 / 2
2 ( )sin(2 )T
nT
b V t nt T dtT
Based with permission on lectures by John GettyPHSX 262 Spring 2011 Lecture 5 Page 16
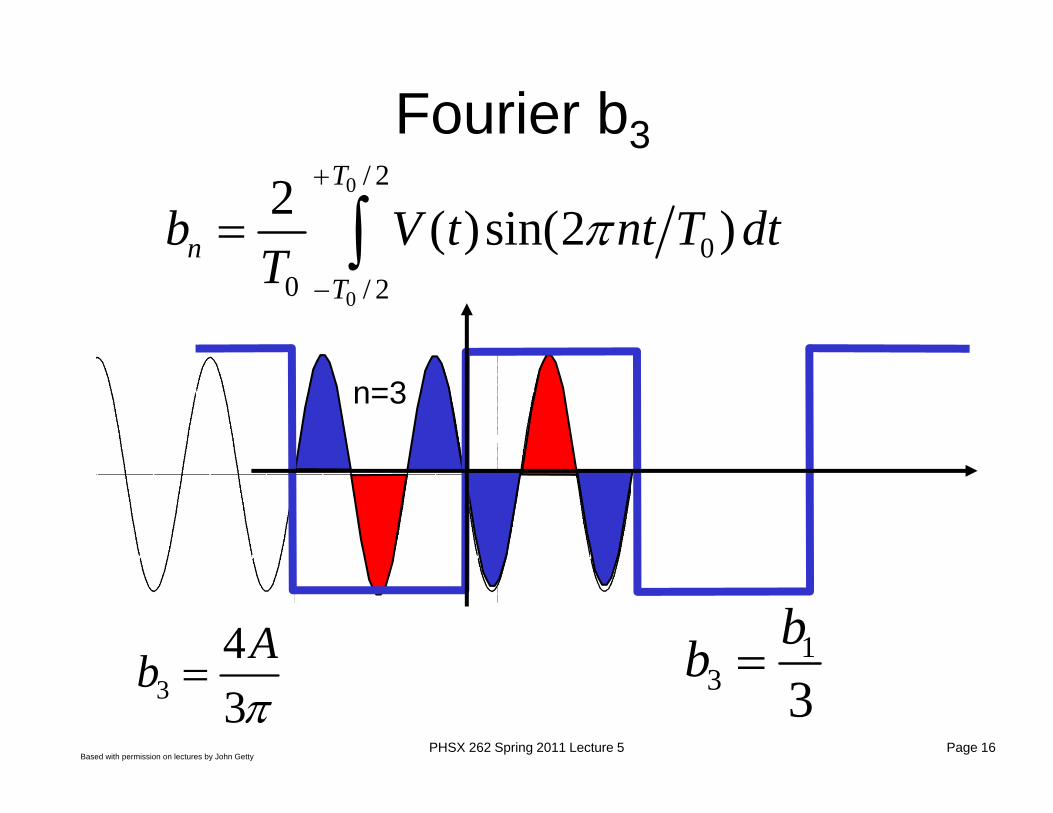
n=3
Fourier b3
13 3
bb
0
0
/ 2
00 / 2
2 ( )sin(2 )T
nT
b V t nt T dtT
343
Ab
Based with permission on lectures by John GettyPHSX 262 Spring 2011 Lecture 5 Page 17
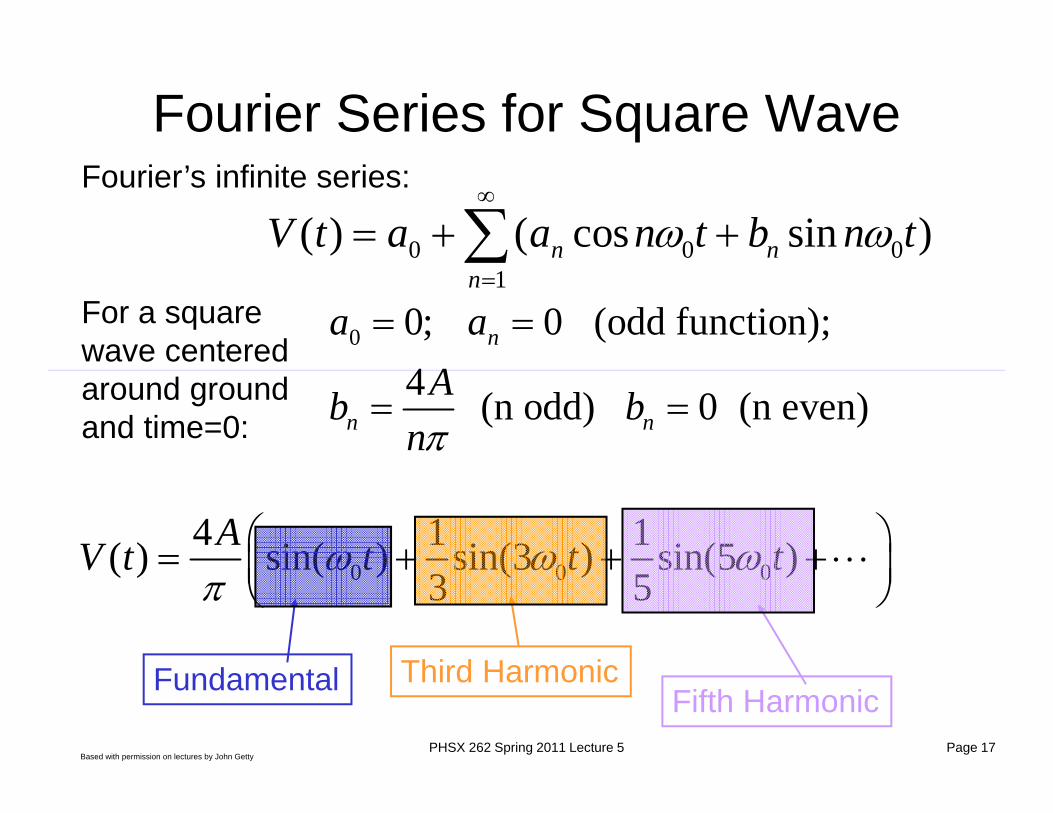
Fourier Series for Square Wave
0 0 04 1 1( ) sin( ) sin(3 ) sin(5 )
3 5AV t t t t
0 0 01
( ) ( cos sin )n nn
V t a a n t b n t
Fourier’s infinite series:
For a square wave centered around ground and time=0:
Fundamental Third HarmonicFifth Harmonic
0 0; 0 (odd function); 4 (n odd) 0 (n even)
n
n n
a aAb b
n
Based with permission on lectures by John GettyPHSX 262 Spring 2011 Lecture 5 Page 18
-1.5
-1
-0.5
0
0.5
1
1.5
0 100 200 300 400 500 600milliseconds
Am
plitu
de
Frequency Domain "Stick Plot"
0
0.2
0.4
0.6
0.8
1
1.2
0 5 10 15 20 25 30
Hertz
Am
plitu
de
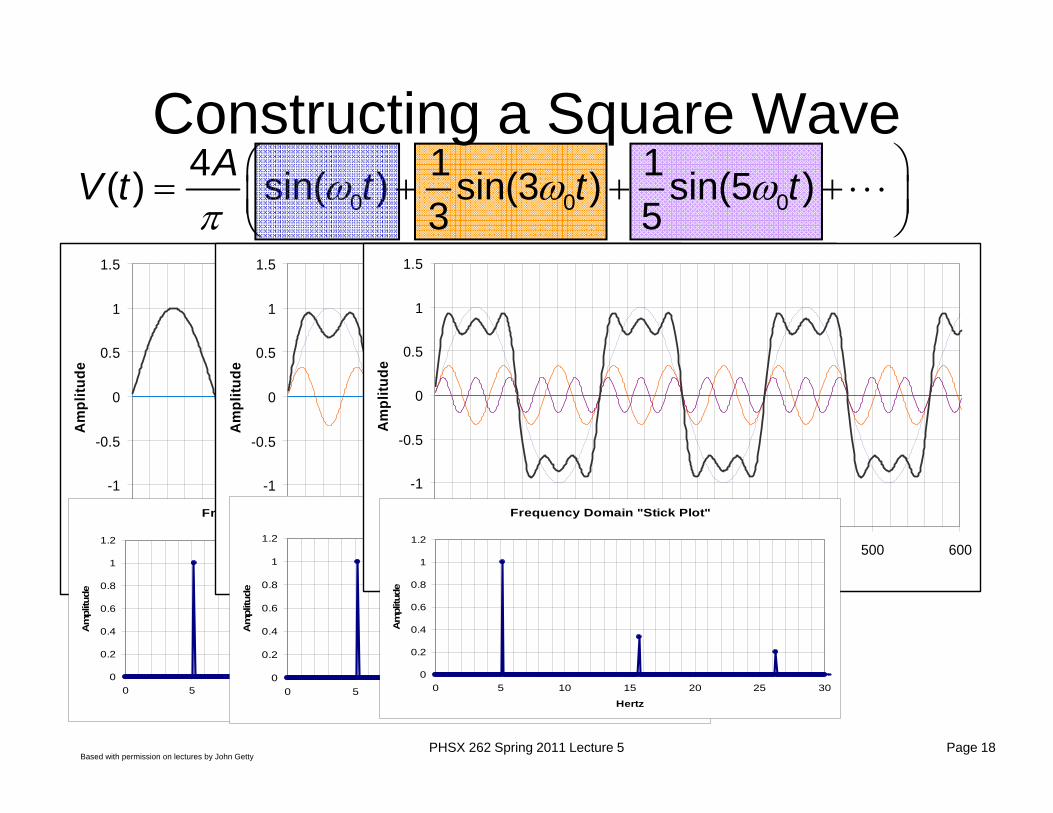
Constructing a Square Wave
0 0 04 1 1( ) sin( ) sin(3 ) sin(5 )
3 5AV t t t t
-1.5
-1
-0.5
0
0.5
1
1.5
0 100 200 300 400 500 600milliseconds
Am
plitu
de
Frequency Domain "Stick Plot"
0
0.2
0.4
0.6
0.8
1
1.2
0 5 10 15 20 25 30
Hertz
Am
plitu
de
-1.5
-1
-0.5
0
0.5
1
1.5
0 100 200 300 400 500 600milliseconds
Am
plitu
de
Frequency Domain "Stick Plot"
0
0.2
0.4
0.6
0.8
1
1.2
0 5 10 15 20 25 30
Hertz
Am
plitu
de
Based with permission on lectures by John GettyPHSX 262 Spring 2011 Lecture 5 Page 19
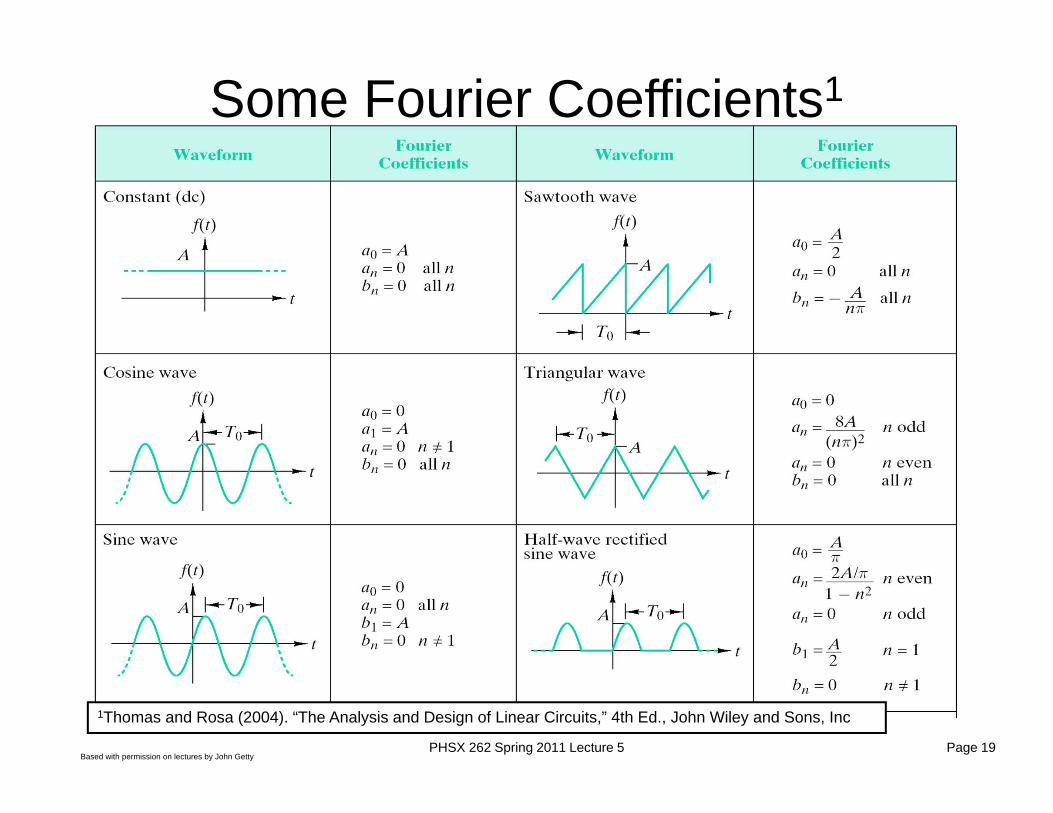
Some Fourier Coefficients1
1Thomas and Rosa (2004). “The Analysis and Design of Linear Circuits,” 4th Ed., John Wiley and Sons, Inc
Based with permission on lectures by John GettyPHSX 262 Spring 2011 Lecture 5 Page 20
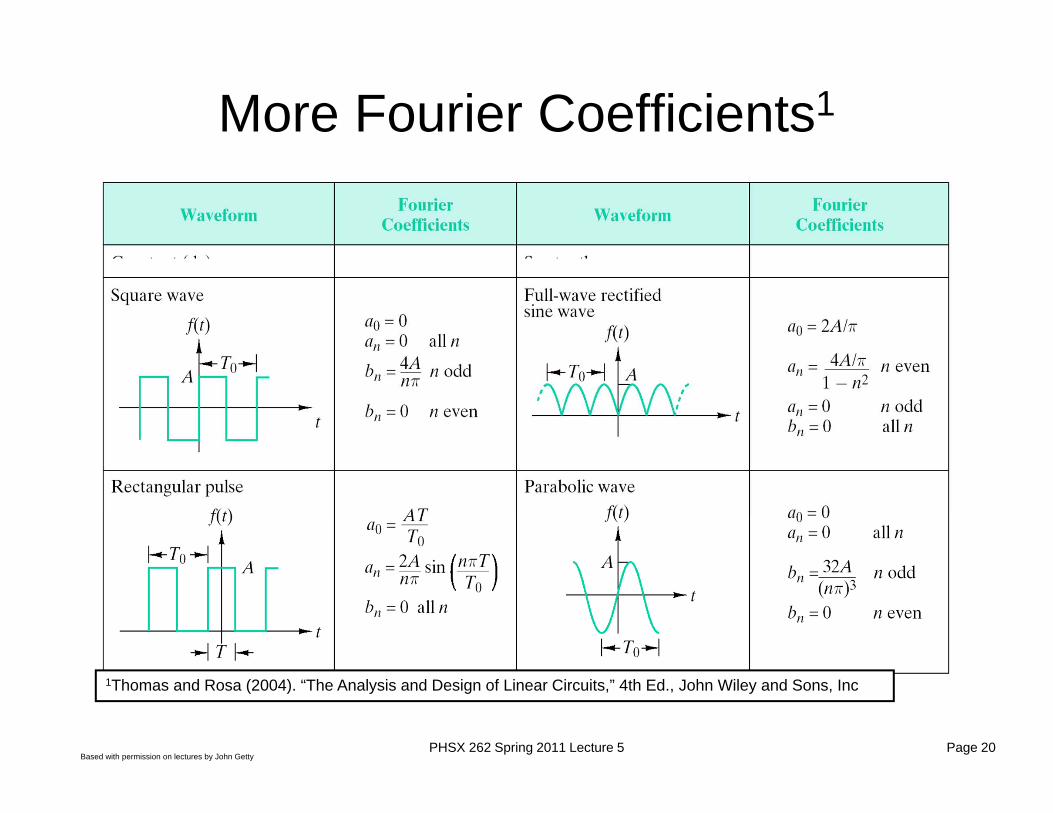
More Fourier Coefficients1
1Thomas and Rosa (2004). “The Analysis and Design of Linear Circuits,” 4th Ed., John Wiley and Sons, Inc
Based with permission on lectures by John GettyPHSX 262 Spring 2011 Lecture 5 Page 21
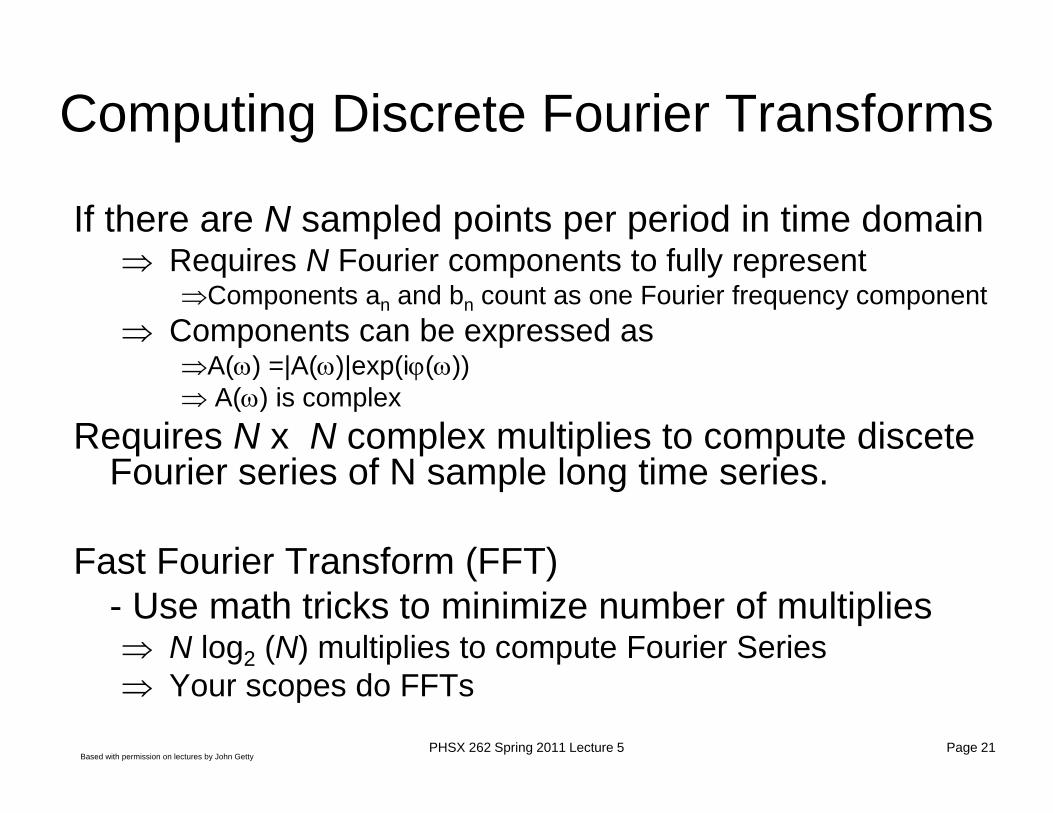
Computing Discrete Fourier Transforms
If there are N sampled points per period in time domain Requires N Fourier components to fully represent
Components an and bn count as one Fourier frequency component Components can be expressed as
A() =|A()|exp(i()) A() is complex
Requires N x N complex multiplies to compute disceteFourier series of N sample long time series.
Fast Fourier Transform (FFT)- Use math tricks to minimize number of multiplies N log2 (N) multiplies to compute Fourier Series Your scopes do FFTs
Based with permission on lectures by John GettyPHSX 262 Spring 2011 Lecture 5 Page 22
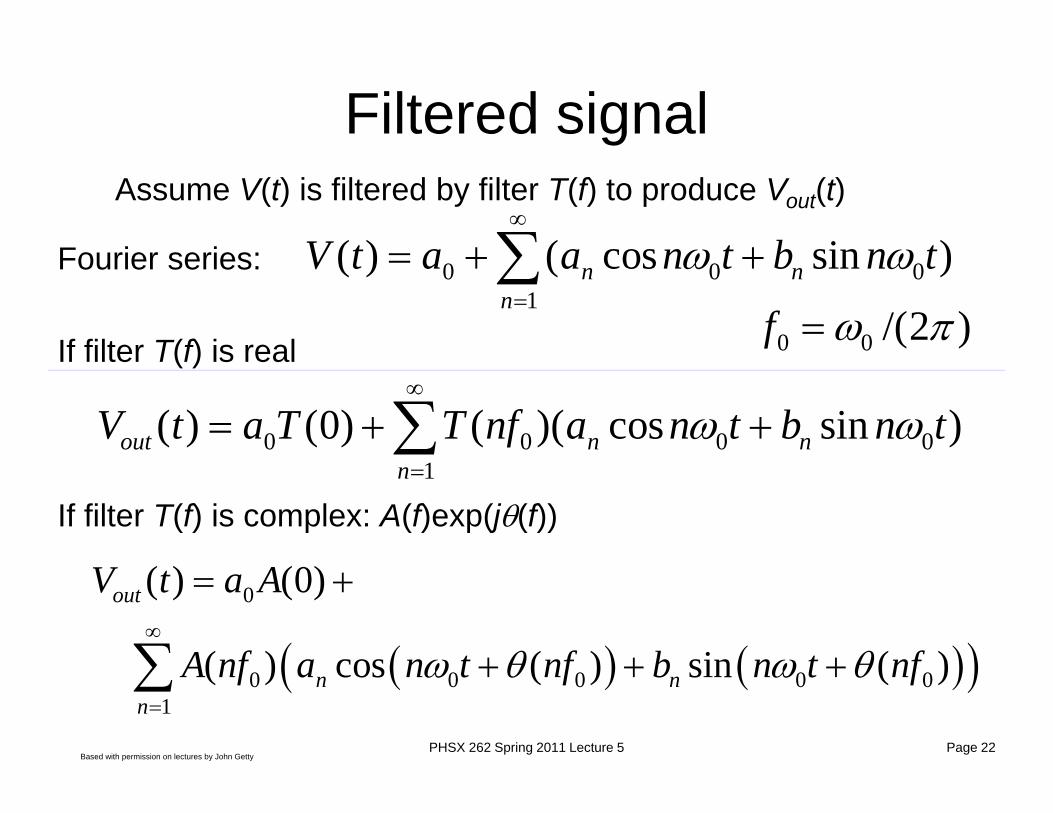
Filtered signal
0 0 01
( ) ( cos sin )n nn
V t a a n t b n t
Fourier series:
0 0 0 01
( ) (0) ( )( cos sin )out n nn
V t a T T nf a n t b n t
Assume V(t) is filtered by filter T(f) to produce Vout(t)
0
0 0 0 0 01
( ) (0)
( ) cos ( ) sin ( )
out
n nn
V t a A
A nf a n t nf b n t nf
If filter T(f) is real
If filter T(f) is complex: A(f)exp(j(f))
0 0 /(2 )f
Based with permission on lectures by John GettyPHSX 262 Spring 2011 Lecture 5 Page 23
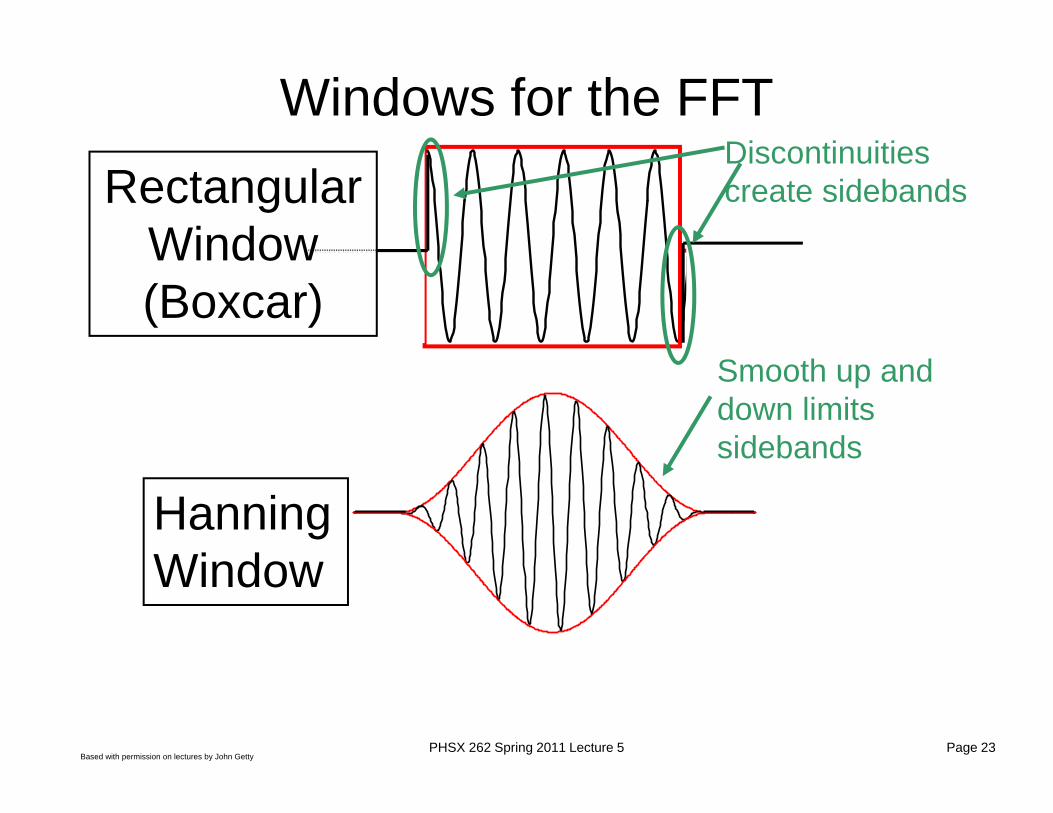
Hanning Window
Windows for the FFTRectangular
Window(Boxcar)
Discontinuitiescreate sidebands
Smooth up and down limits sidebands
Based with permission on lectures by John GettyPHSX 262 Spring 2011 Lecture 5 Page 24
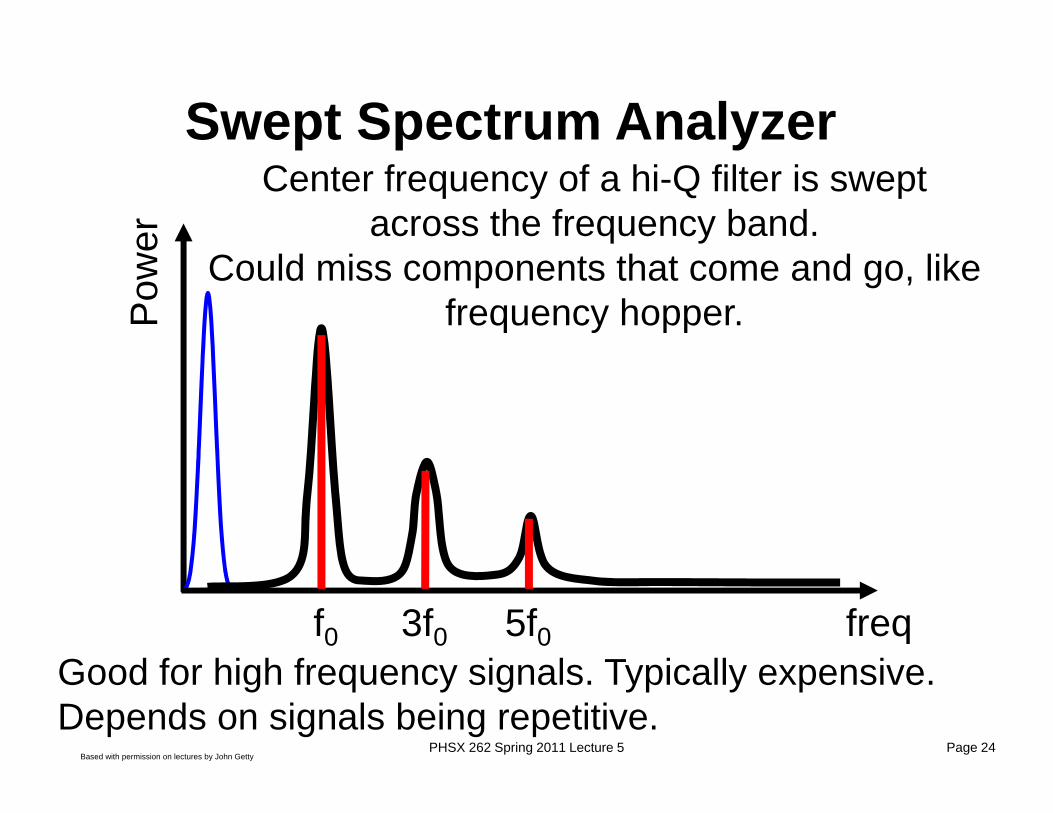
Center frequency of a hi-Q filter is swept across the frequency band.
Could miss components that come and go, like frequency hopper.
Swept Spectrum Analyzer
Good for high frequency signals. Typically expensive. Depends on signals being repetitive.
f0 3f0 5f0
Pow
er
freq
Based with permission on lectures by John GettyPHSX 262 Spring 2011 Lecture 5 Page 25
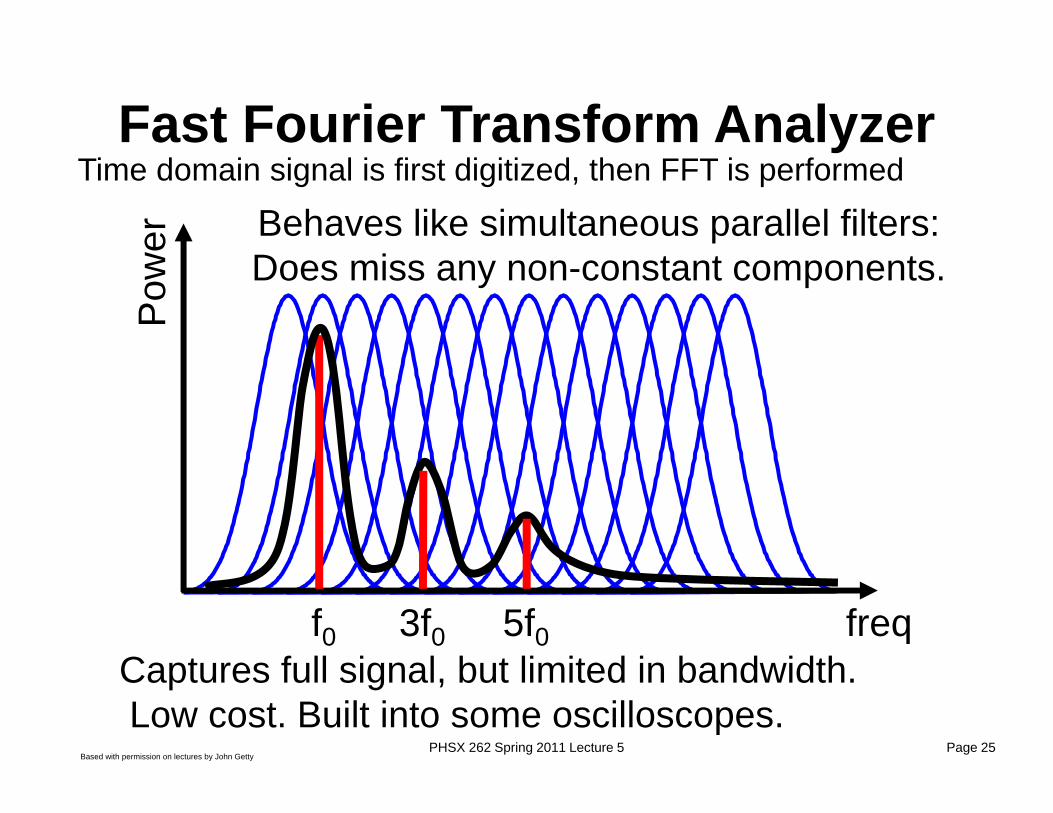
Behaves like simultaneous parallel filters: Does miss any non-constant components.
Pow
erFast Fourier Transform Analyzer
Captures full signal, but limited in bandwidth. Low cost. Built into some oscilloscopes.
f0 3f0 5f0 freq
Time domain signal is first digitized, then FFT is performed
Based with permission on lectures by John GettyPHSX 262 Spring 2011 Lecture 5 Page 26
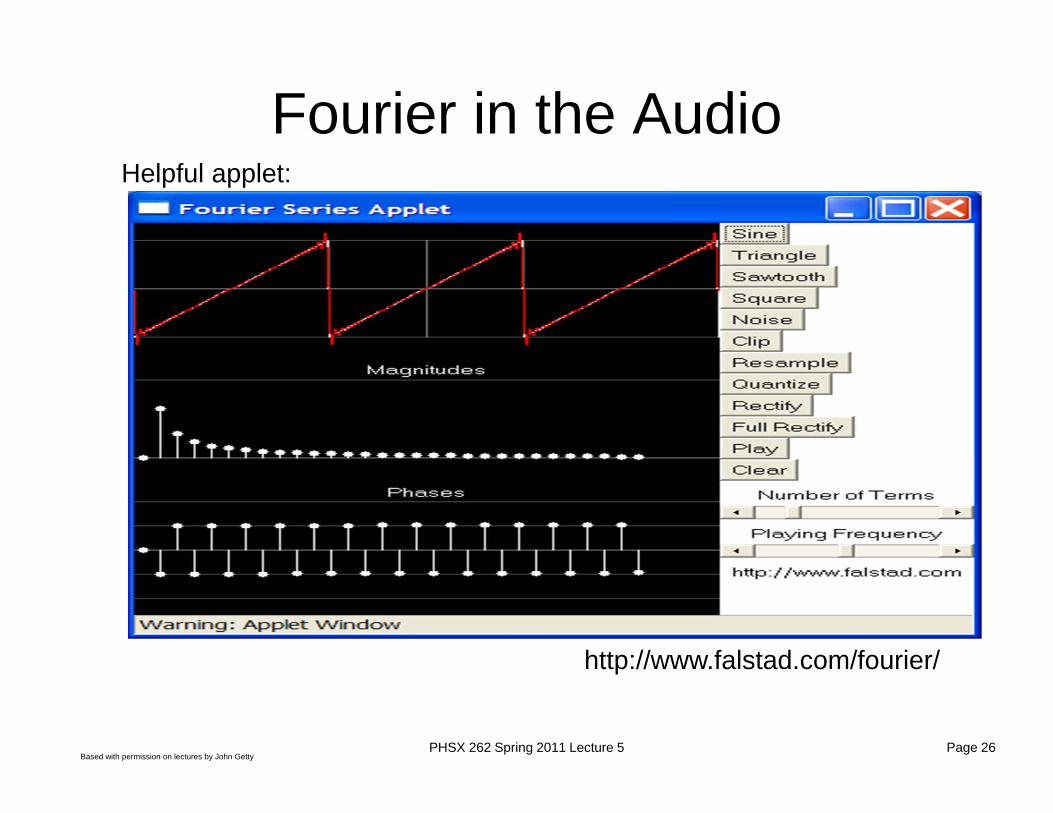
Fourier in the Audio
http://www.falstad.com/fourier/
Helpful applet:
Based with permission on lectures by John GettyPHSX 262 Spring 2011 Lecture 5 Page 27
References1. Paul Horowitz and Winfield Hill (1989). “The Art of Electronics,” 2nd Ed., Cambridge,
pages 1025-1038.2. Roland E. Thomas and Albert J. Rosa (2004). “The Analysis and Design of Linear
Circuits,” 4TH Ed., John Wiley and Sons3. Paul Falstad, “some applets … to help visualize various concepts in math and
physics”, http://www.falstad.com/mathphysics.html, 15 Feb 20104. “Efunda, Engineering Fundamentals” web site; accessed 15 Feb 2010
http://www.efunda.com/designstandards/sensors/methods/DSP_nyquist.cfm5. “The Fundamentals of FFT-Based Signal Analysis and Measurment in LabVIEW
and LabWindows”; 15 Feb 2010, http://zone.ni.com/devzone/cda/tut/p/id/4278