Embed Size (px)
Citation preview
Reliability for NDT
Tutorial: POD Basic
POD data collection & analysis – Tools for beginners
June
200
9
4th European-American Workshop
on Reliability of NDE
4th European-American Workshop on Reliability of NDE - We.4.A.4
ww
w.ndt.net/index.php?id=
8327
ww
w.ndt.net/index.php?id=
8311

Introduction Round:- How are you involved with NDE reliability in your present role?
- What do you hope to accomplish in the next 6 months with the tools learned here?

Goals:
Comfortable using typical POD software and presentation tools
Can produce valid results Aware of sources of variation and mitigation steps

POD data collection & analysis – Tools for beginners
- Before the start: Background on NDE Reliability Measurement Practice
- Vetting and assessing existing databases of POD capability- Completing experimental gap analysis- Calibrations & transfer functions- Protocols for partial/full capability demonstrations- Quality checking the data- Selecting a model- Understanding capability relationships behind POD curves- Understanding & addressing experimental variation- Substantiating and presenting the results
Basics Roadmap –
Goal: 1/3 Orientation & Discussion, 2/3 Performing POD calculations

POD data collection & analysis – Tools for beginners- Before the start: Background on NDE Reliability Measurement
Practice- Vetting and assessing existing databases of POD capability- Completing experimental gap analysis- Calibrations & transfer functions- Protocols for partial/full capability demonstrations- Quality checking the data- Selecting a model- Understanding capability relationships behind POD curves- Understanding & addressing experimental variation- Substantiating and presenting the results
Basics Roadmap –

NDT Reliability - Background
Degree that an NDT system is capable of achieving its purpose regarding detection, characterization and false calls
– American European Workshop on NDT reliability 99 Quantitative measure of the efficiency of the NDT
procedure in finding flaws of specific type and size– Metals Handbook
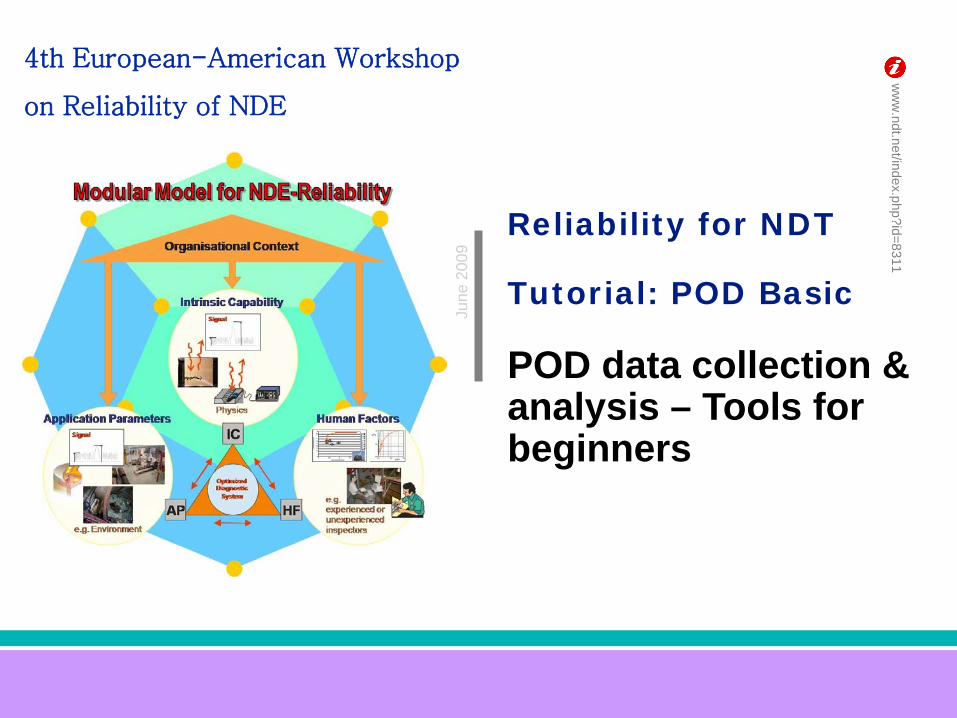
Quantification
Ideally Cracks larger than a certain
size can be detected
Defect Size
Det
ect
No
Det
ect
Probability of Detection Reality
There is a probability of detection for every crack

NDT Reliability Measurement
POD - Probability of Detection- Is it an adequate representation ?
POFA - Probability of False Alarm- Equally important from economic consideration
ROC - POD vs. POFA- A measure of reliability
Coefficient of Contingency- A measure of individual performance
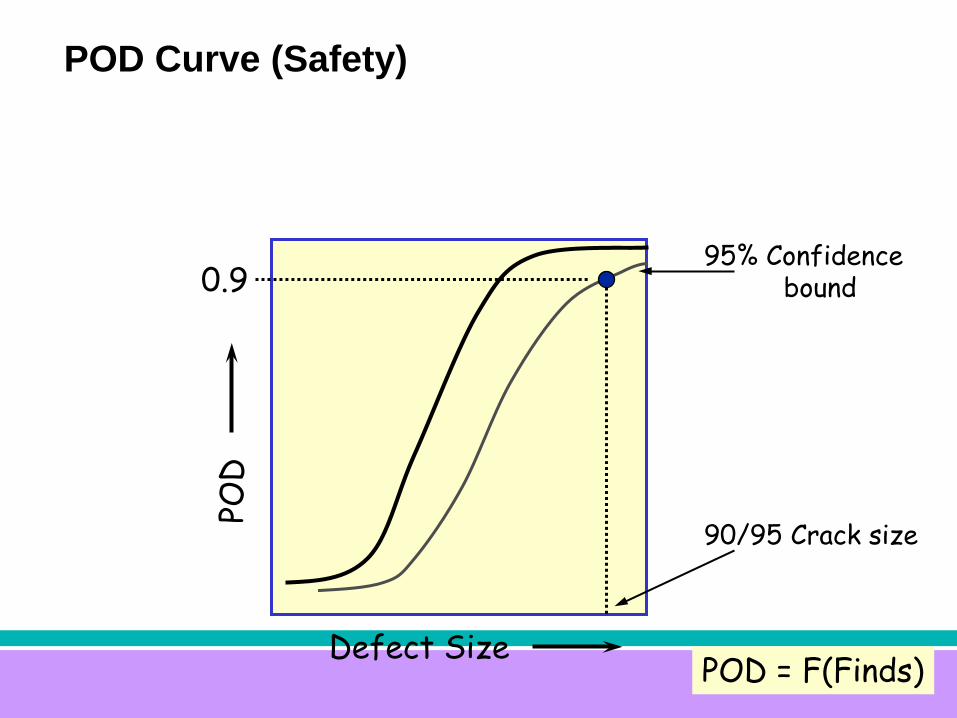
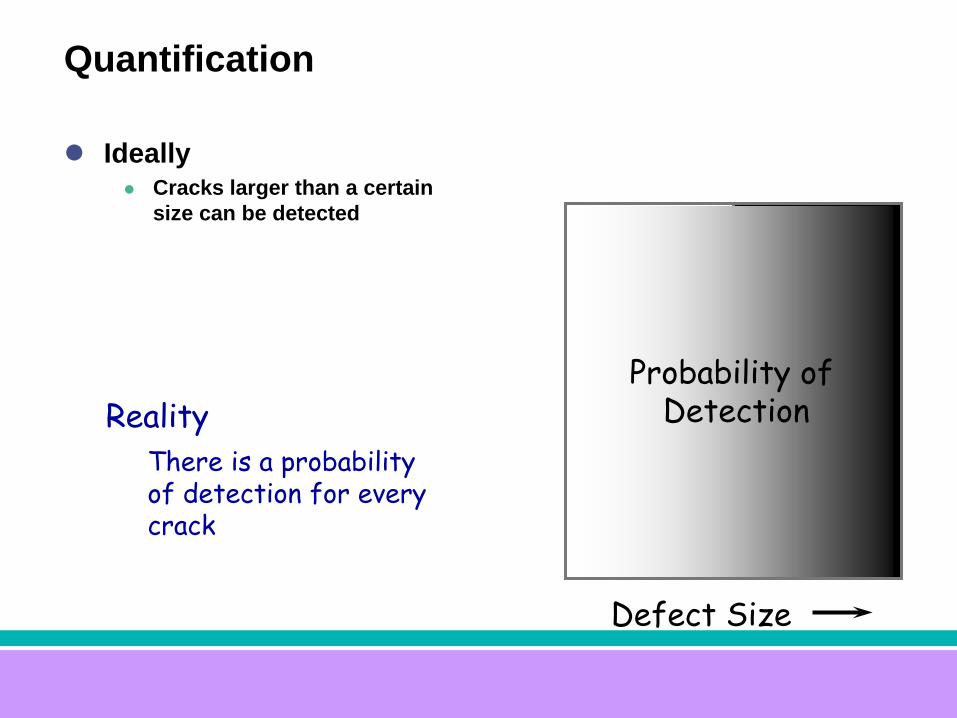
POD Curve (Safety)
Defect Size
POD
95% Confidencebound0.9
90/95 Crack size
POD = F(Finds)

ROC Curve (Economics)
PO False Call
PO T
rue
Call
> 80% Finds< 20% False calls
ROC = F(Finds, False Calls)
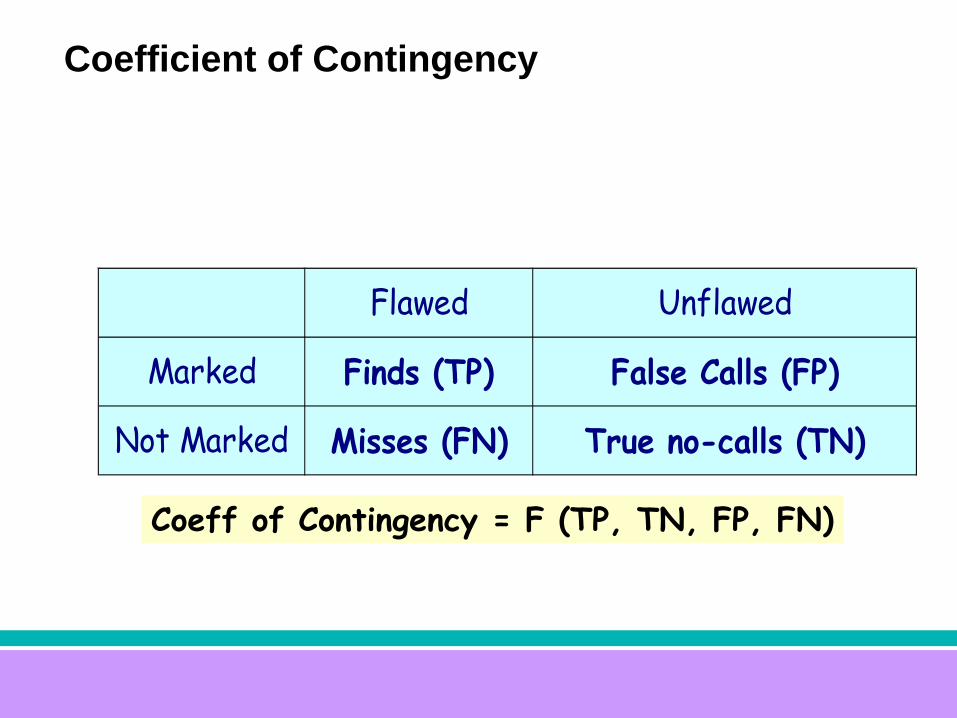
Coefficient of Contingency
Flawed Unflawed
Marked Finds (TP) False Calls (FP)
Not Marked Misses (FN) True no-calls (TN)
Coeff of Contingency = F (TP, TN, FP, FN)

Challenge
Human Factors Variables Identification Control Quantification
Operator-Equipment-Environment interaction

What Do We Need to Understand?
NDT is not viewed as a friend of production The program is in operational interest Identify and eliminate deficiencies in NDT system Ultimately operate ‘safer, cheaper, longer’

Popular Characteristics of POD
POD is Expensive Certified inspectors do not need POD Experienced and high salaried inspectors have better
POD 90/95 Crack size information is adequate Imp to find small flaws

How is the product of NDE measurement Engineering used?

Damage Tolerance Concept
Service
Dam
age
size
Opportunity for damage detection
Assumed detectable Damage size
Inspection Interval
Opportunity for damage detection
Poorer than assumed
Inspection Interval
Safe?
Better than assumed
Estimated tolerable damage size
Economic ?

Damage Tolerance Concept
Service
Dam
age
size
Tolerable damage
Inspection Interval
Detectable damage Assessed reliability
Opportunity for damage detection
Improved Reliability

Relation of system response to POD curve
50% POD “point”for an 83 unit decisionthreshold
50% POD “point”for an 129 unit decisionthreshold
Regression equation from A-hat.exe program
L. Schaefer – NIST 1998 A-E NDE Reliability
First things first!

POD data collection & analysis – Tools for beginners
- Before the start: Background on NDE Reliability Measurement Practice
- Vetting and assessing existing databases of POD capability- Completing experimental gap analysis- Calibrations & transfer functions- Protocols for partial/full capability demonstrations- Quality checking the data- Selecting a model- Understanding capability relationships behind POD curves- Understanding & addressing experimental variation- Substantiating and presenting the results
Roadmap Basics –
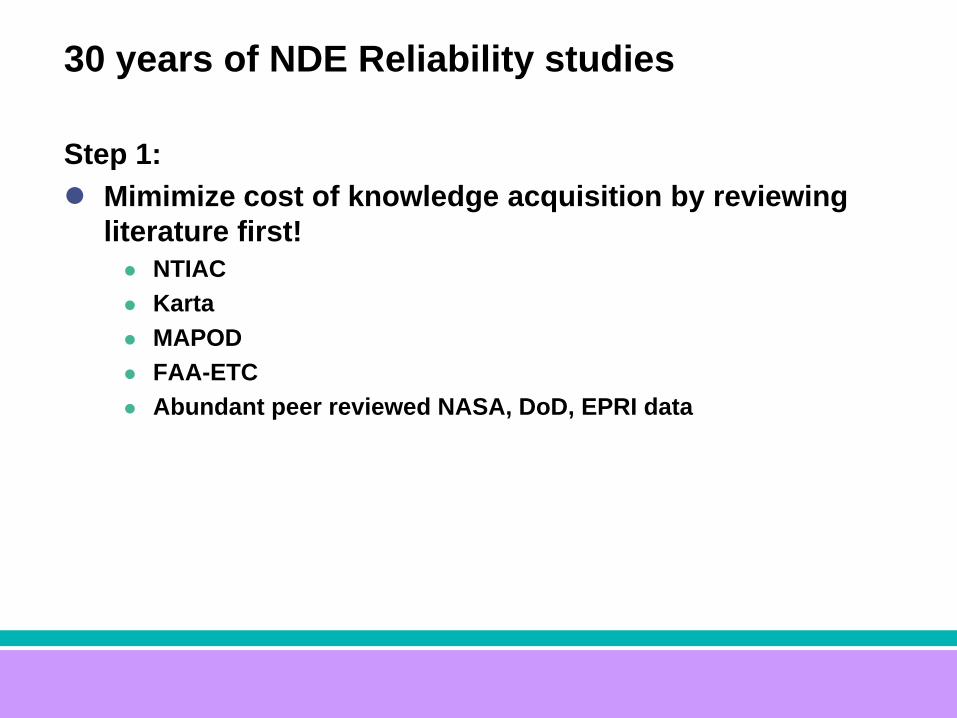
30 years of NDE Reliability studies
Step 1: Mimimize cost of knowledge acquisition by reviewing
literature first! NTIAC Karta MAPOD FAA-ETC Abundant peer reviewed NASA, DoD, EPRI data
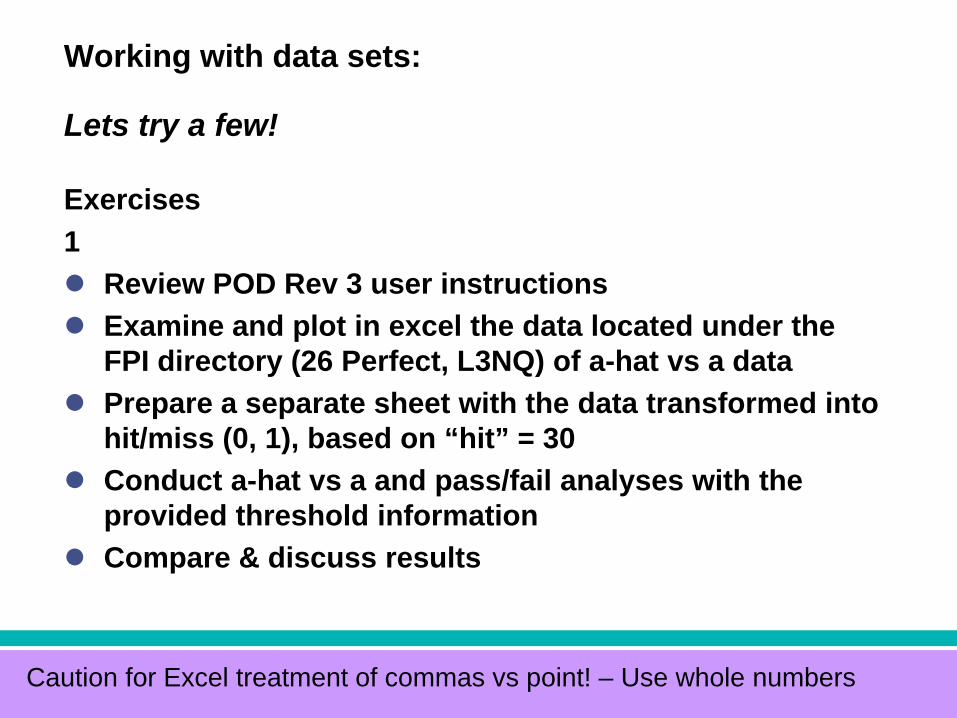
Working with data sets:
Lets try a few!
Exercises1 Review POD Rev 3 user instructions Examine and plot in excel the data located under the
FPI directory (26 Perfect, L3NQ) of a-hat vs a data Prepare a separate sheet with the data transformed into
hit/miss (0, 1), based on “hit” = 30 Conduct a-hat vs a and pass/fail analyses with the
provided threshold information Compare & discuss results
Caution for Excel treatment of commas vs point! – Use whole numbers

Lets try a few!
Exercises2 Examine and plot in excel the data located under the ET
directory (26Parent) of a-hat vs a data Prepare a separate sheet with the data transformed into
hit/miss (0, 1) where “hit” = 100 Conduct a-hat vs a and pass/fail analyses with the
provided threshold information Discuss results
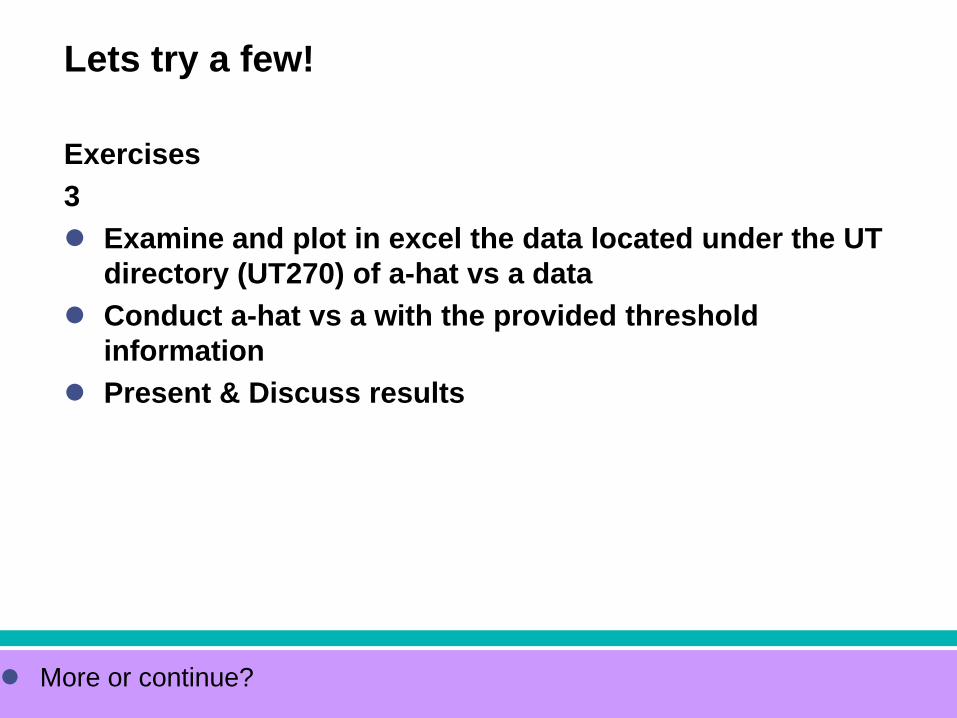
Lets try a few!
Exercises3 Examine and plot in excel the data located under the UT
directory (UT270) of a-hat vs a data Conduct a-hat vs a with the provided threshold
information Present & Discuss results
More or continue?

POD data collection & analysis – Tools for beginners- Before the start: Background on NDE Reliability Measurement
Practice- Vetting and assessing existing databases of POD capability- Completing experimental gap analysis- Calibrations & transfer functions- Protocols for partial/full capability demonstrations- Quality checking the data- Selecting a model- Understanding capability relationships behind POD curves- Understanding & addressing experimental variation- Substantiating and presenting the results
Roadmap Basics –
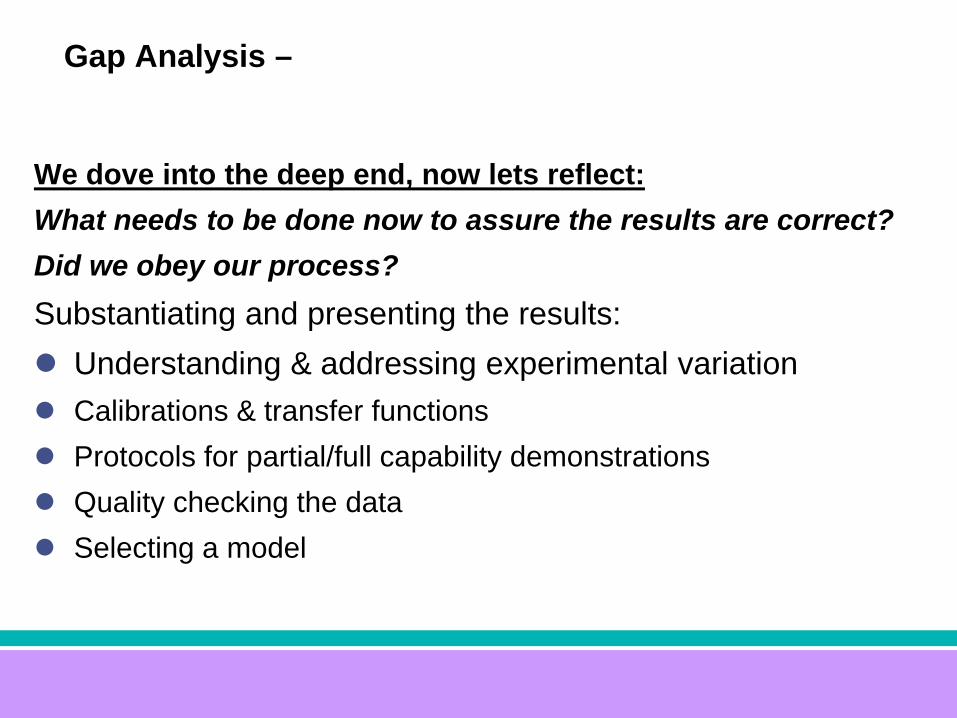
Gap Analysis –
We dove into the deep end, now lets reflect:What needs to be done now to assure the results are correct?Did we obey our process?Substantiating and presenting the results: Understanding & addressing experimental variation Calibrations & transfer functions Protocols for partial/full capability demonstrations Quality checking the data Selecting a model

NDT system performance
Knowledge on
reasons for the gap ?
Recommendactions
to bridge the gap
NDT system capability
Objective: Identify and Eliminate Deficiencies

Designed Experiment
Data base
ReliabilityInformation
Knowledge - a) System Capability, b) Improvement Avenues
ImprovedReliability
POD Analysis
RecommendedActions
Approach to Inspection Reliability
Classic POD Program
Advanced Reliability Program

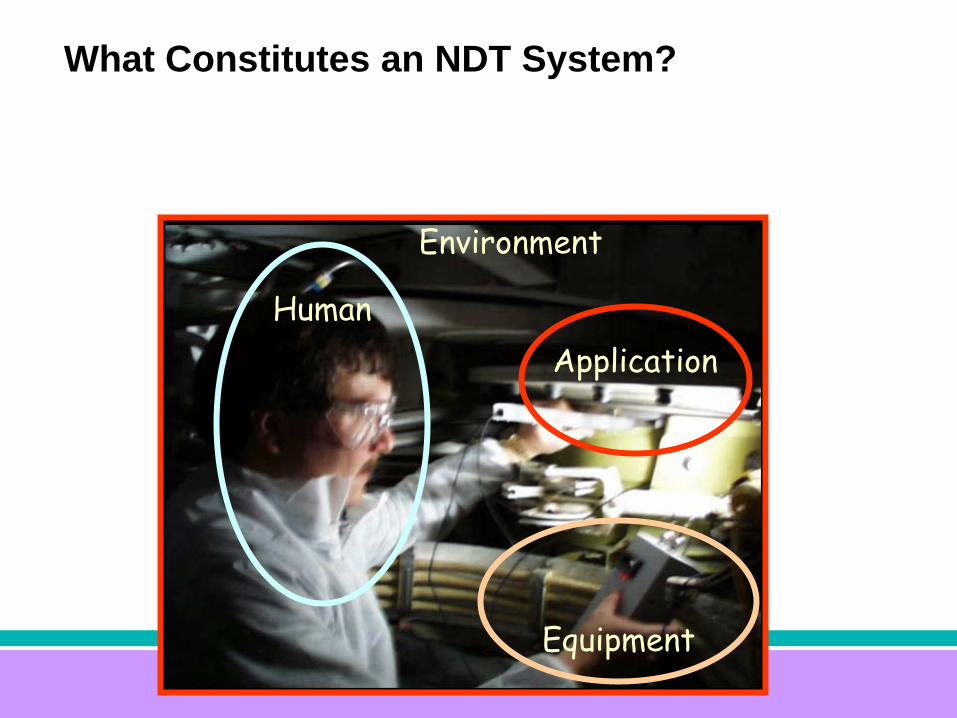
What Constitutes an NDT System?
HumanApplication
Equipment
Environment

What Factors Influence the Most?
Human Factors Application condition, access, … Equipment sensitivity, resolution, complexity, … Process, Materials, … Interactions

Human Factors – still a challenge
Factors that impact inspector’s discrimination and decision-making ability Organizational Physical Mental
Training and skill level is a major factor Inspections with predictable outcome
Routine and monotonous

POD data collection & analysis – Tools for beginners- Before the start: Background on NDE Reliability Measurement
Practice- Vetting and applying existing databases of POD capability- Completing experimental gap analysis- Calibrations & transfer functions- Protocols for partial/full capability demonstrations- Quality checking the data- Selecting a model- Understanding capability relationships behind POD curves- Understanding & addressing experimental variation- Substantiating and presenting the results
Roadmap Basics –
What Constitutes an NDT System?
HumanApplication
Equipment
Environment

Typical NDT Assessment Program
Creation of specimens with defects Visit to an NDT facility Identification of a sample of inspectors Conduct of NDT on set of specimens Acquisition of inspection data Data analysis and POD plots

NDT Assessment Program Elements…and sources of variation
Facility Sampling Inspector Sampling Specimens Scheduling Inspections Data Acquisition Data Analysis Human factors

Specimens
Ideally, real parts with real cracks Typically, synthetic parts or a combination of real and
synthetic parts Configuration as close to critical inspections as possible Presentation as close to real situation as possible Special care in handling and maintenance

Specimens
Multiple identical specimens Mounted on framework (racks) with quick interchangeability
feature Multiple inspection sites per specimen Uniquely numbered for tracking Specimen inspection guideline similar to written procedures Routine surface cleaning process without damage

Specimen Defects
40-60 defects per set Most flaws in the zone of increasing POD
Preferred 10-90% Typically 1-99% (Hard to judge) Preferred size distribution linear on ‘log a’ scale
Flawed : Unflawed site :: 1 : 2.5-3 Well characterized initially and regularly For details refer to MIL-HDBK-1823

Specimen Fabrication
Raw Specimen Flaw growth Final shape and size Characterize and mark

Cracked Metal Specimens
Raw Specimen
SpecimenEDMThrough
Crack
Raw SpecimenSpecimen Crack
EDMRaw SpecimenSpecimen
EDM
Surface crack
Raw SpecimenSpecimen
EDMRaw SpecimenSpecimen
EDM
Corner crack
Raw Specimen
Specimen
Grip Area
Margin
Raw Specimen
Specimen
Grip Area
Margin
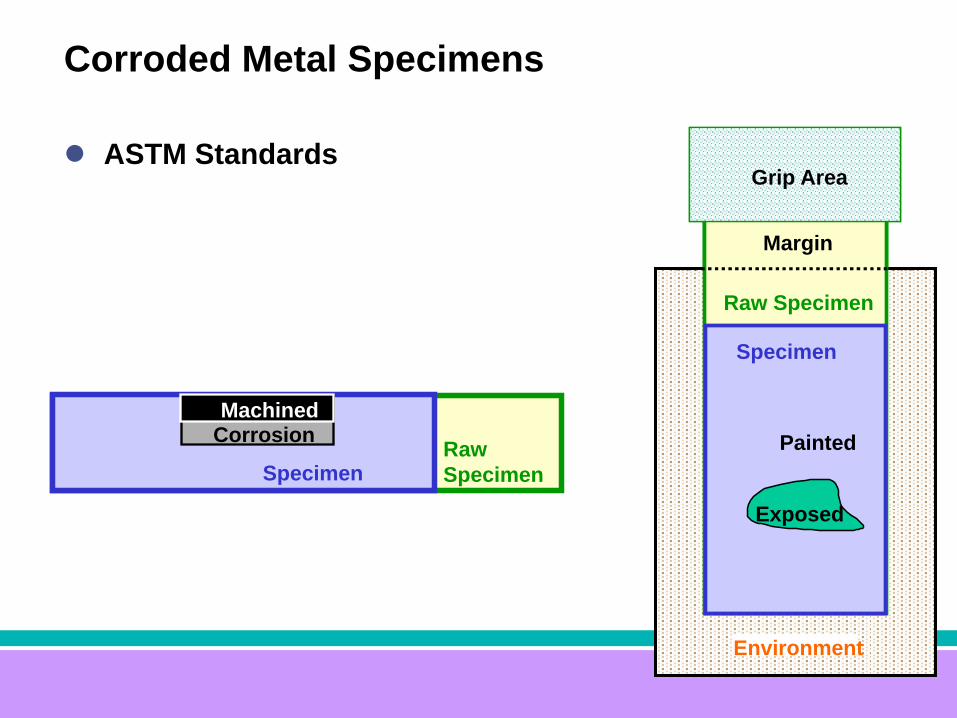
Corroded Metal Specimens
ASTM Standards
SpecimenCorrosionMachined
SpecimenRaw Specimen
CorrosionMachined
Specimen
Grip Area
Margin
Raw Specimen
Specimen
Grip Area
Margin
Environment
Painted
ExposedSpecimen
Grip Area
Margin
Raw Specimen
Specimen
Grip Area
Margin
Environment
Painted
Exposed
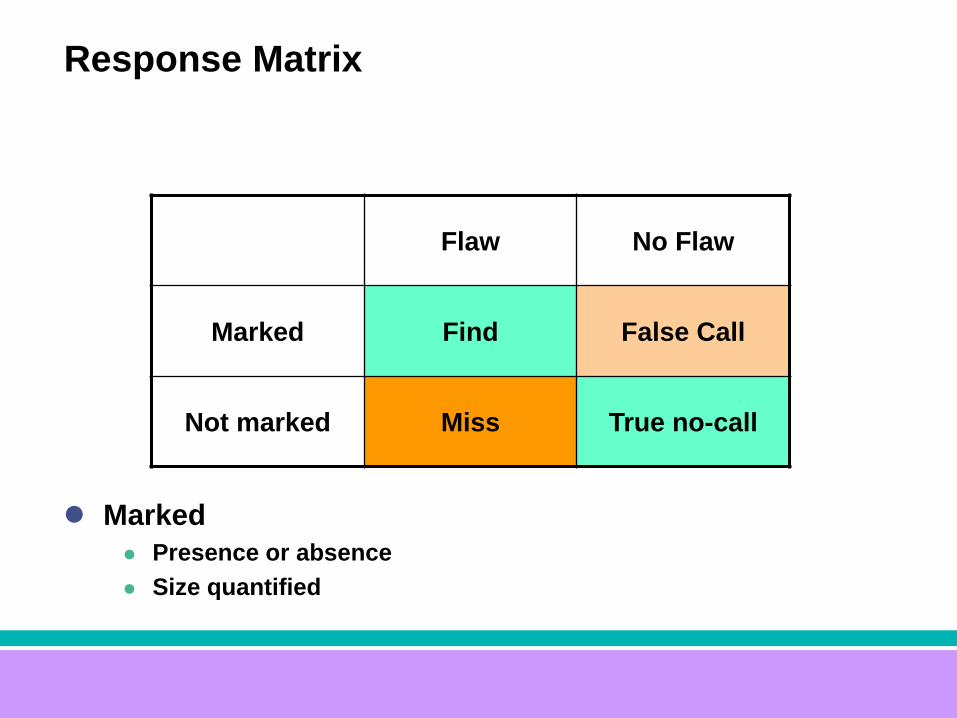
Response Matrix
Marked Presence or absence Size quantified
Flaw No Flaw
Marked Find False Call
Not marked Miss True no-call

Signal/noise Discrimination
Decision
Misses False Calls
SignalNoise
Signal amplitude
Prob
abili
ty
dens
ity
func
tion

Signal/noise Discrimination
Poor process/setupPoor DiscriminationPoor reliability
SignalNoise
Good procedure, equipment, … Inspector dependent reliability
Good
Poor Poor
SignalNoise
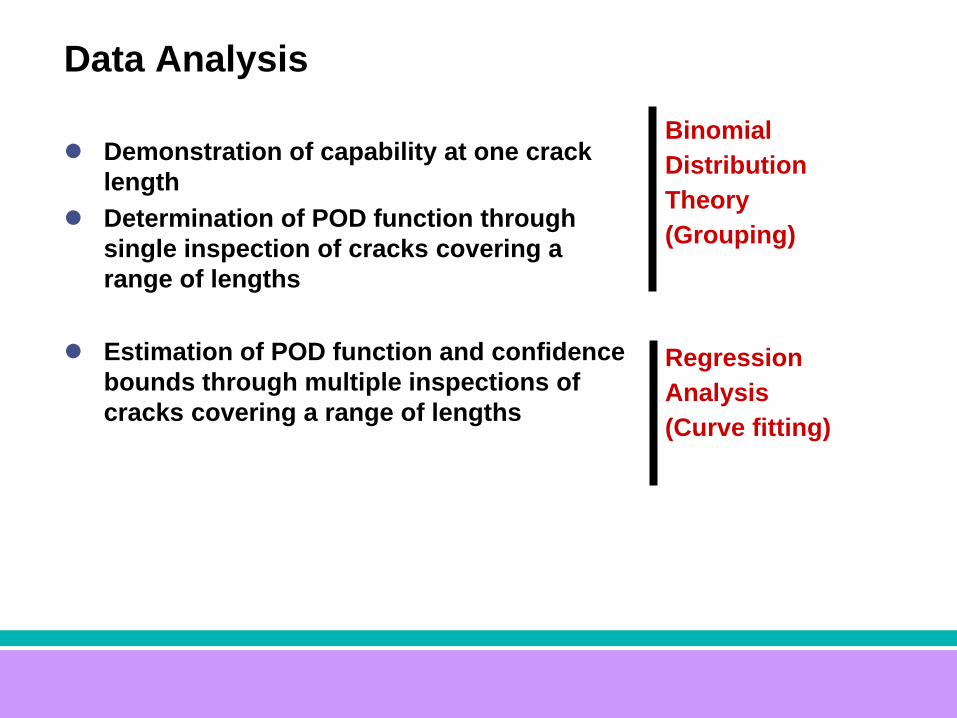
Data Analysis
Demonstration of capability at one crack length
Determination of POD function through single inspection of cracks covering a range of lengths
Estimation of POD function and confidence bounds through multiple inspections of cracks covering a range of lengths
Binomial Distribution Theory (Grouping)
Regression Analysis (Curve fitting)

Data Analysis
Two Steps Generate a point estimate of
detection probability for various crack lengths over a range of interest
Fit an appropriate curve that offers minimum deviation or maximum likelihood to the scattered data
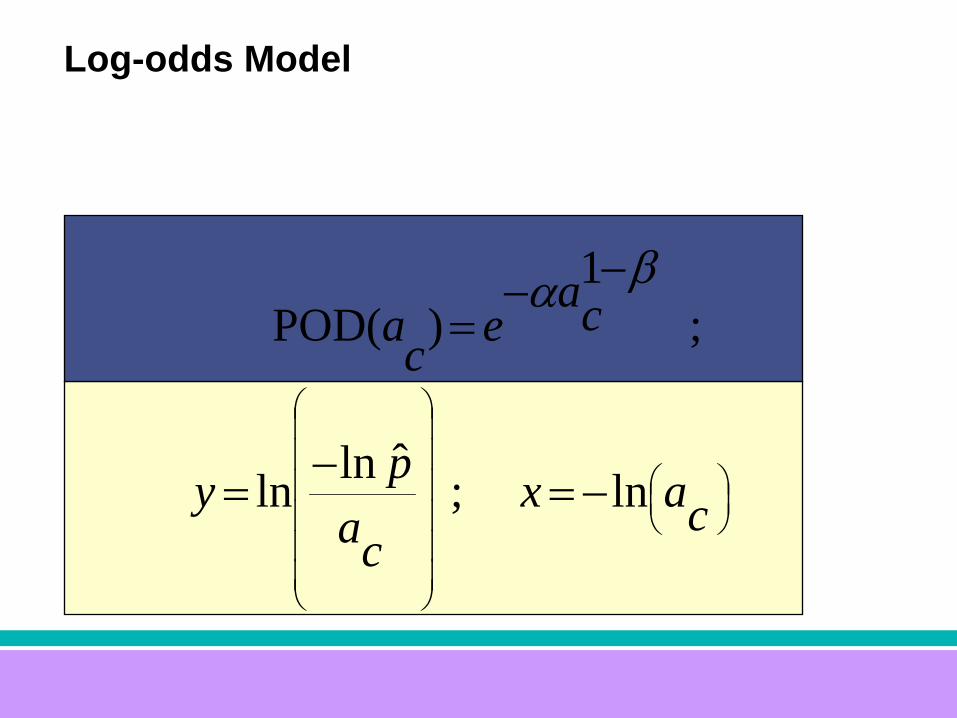
Log-odds Model
−=−=
−−=
caxca
py
caeca
ln ; ˆlnln
;1
)( PODβα

v
Indi
cate
d cr
ack
leng
th (a
)
True crack length (a)
a vs. a Analysis
Consider a lognormal scatter in indicated crack length for various cracks lengths
POD is the probability of indicated crack length exceeding the threshold of detection
Requires quantification of signal leading to detect call
Threshold
True crack length (a)
POD

Experimental quality assessmentsExample One
Human Factors quantification in Eddy Current POD Study

Demonstration Study - Introduction
Protocol for Human Factors Quantification Field lab visited in Sept 2000 L8 with 3 DOE variables
Job Type (Part Time vs Full Time)Physical comfort (Comfortable vs Uncomfortable)Speed of inspection (Normal vs Accelerated)

Demonstration Study - Plan
Eddy Current specimen set (Mfg at SwRI) 15 specimens, 8 sites/specimen 30 cracks, 35-228 mil
15 inspectors (8 full time, 7 part time) 4 rounds per inspector
Uncomfortable/comfortable, normal/fast 58 inspections on 120 sites
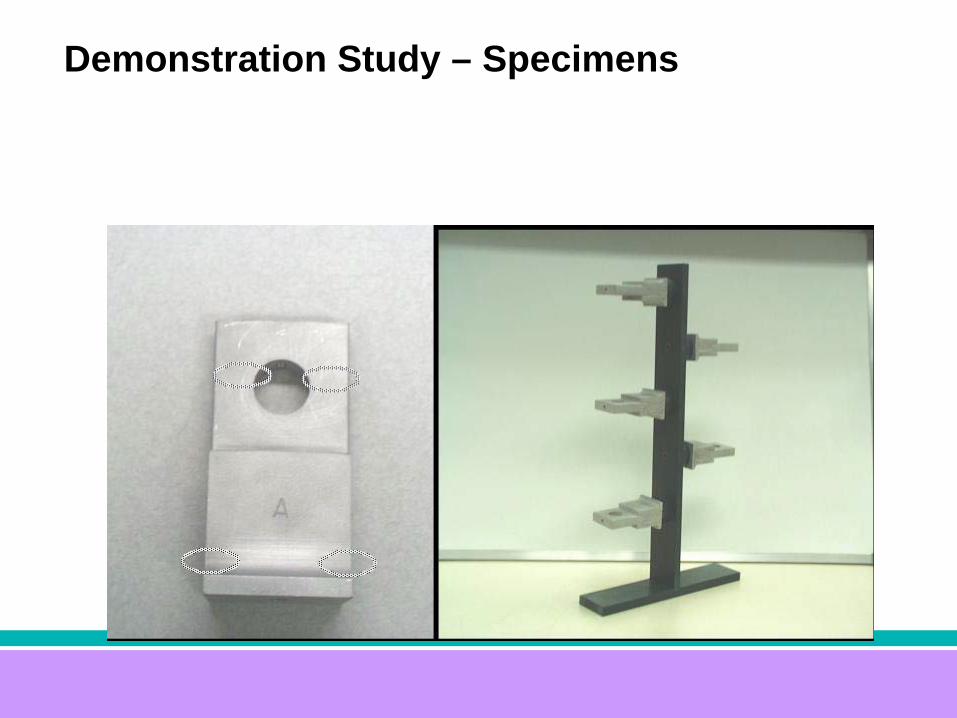
Demonstration Study – Specimens
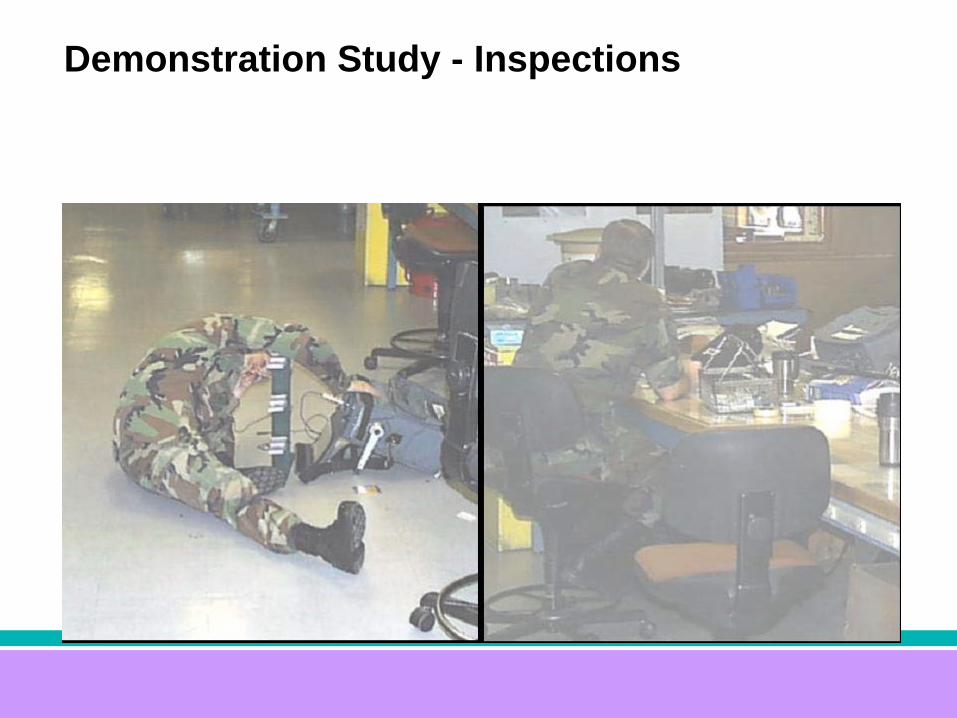
Demonstration Study - Inspections

Demonstration Study – POD Curves
Effect of Job Type on POD6 Part time inspectors, 24 inspections9 Full time inspectors, 34 inspections
0.0
0.1
0.2
0.3
0.4
0.5
0.6
0.7
0.8
0.9
1.0
Crack Size (mils)
POD
Part time95%Full Time95%
Effect of Physical Comfort on PODUncomfortable Posture, 28 inspections
Comfortable Posture, 30 inspections
0.0
0.1
0.2
0.3
0.4
0.5
0.6
0.7
0.8
0.9
1.0
Crack Size (mils)
POD
Uncomfortable95%Comfortable95%
Effect of Schedule Comfort on PODNormal speed, 29 inspectionsAccelerated, 29 inspections
0.0
0.1
0.2
0.3
0.4
0.5
0.6
0.7
0.8
0.9
1.0
Crack Size (mils)
POD
Fast95%Normal95%

Demonstration Study – DOE Analysis
DOE Analysis100.0
-20.9
-8.4
6.5
-6.3
3.37.6
0.8
-40
-20
0
20
40
60
80
100
GM J P JP S JS PS E
Nor
mal
ized
90%
PO
D C
rack
siz
e

Example Study
Effect of Physical and Schedule comfort
0
0.1
0.2
0.3
0.4
0.5
0.6
0.7
0.8
0.9
1
Inspector
Coef
ficie
nt
Uncomf-FastUncomf-NormalComf-FastComf-Normal
Indi
vidu
al P
erfo
rman
ce
Day-1
Day-2

Example Two
Considerations in FPI - POD

FPI - Reliability Formula Elements
IC - Chemistry, fluid mechanics AP - Material, surface condition, location HF - Contrast, spatial perception

FPI - Process parameters
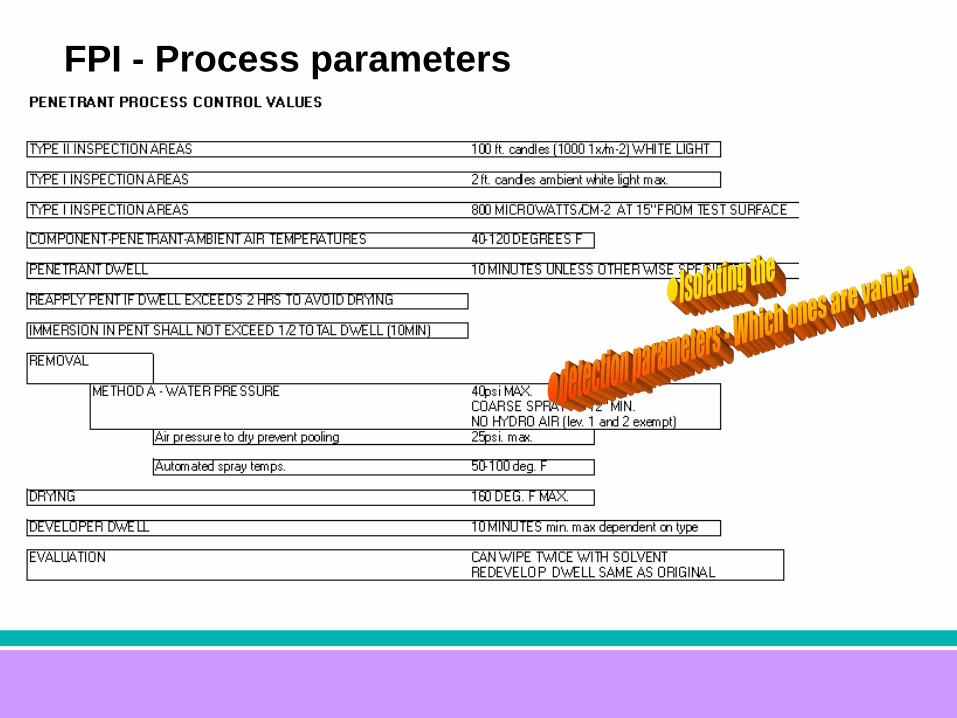
FPI - Process parameters

FPI - A-hat vs a, or Pass/Fail?
Pass/fail model-program considerations Process and behavior must conform to model assumptions…. or
no result/non-sense result Asymptotic signal to noise
A-hat vs. a - Preferred Given
- Sufficient quantity of data - as few as 20 points- Measurable strength of response
At minimum, mean performance can be calculated

FPI - Calculations; misses and false call management
Effect of decision threshold changes; 5-30milsPenetrant POD performance as a function of decision threshold
0.00E+00
2.00E-01
4.00E-01
6.00E-01
8.00E-01
1.00E+00
1.20E+00
0.00E+00 5.00E-02 1.00E-01 1.50E-01 2.00E-01 2.50E-01 3.00E-01 3.50E-01 4.00E-01
flaw length (in.)
POD

FPI - Source data from flat platesra001 0.023 0.025ra001 0.115 0.125ra001 0.069 0.07ra003 0.086 0.13ra003 0.065 0.1ra003 0.036 0.03ra003 0.095 0.1ra004 0.086 0.11ra004 0.11 0.115ra004 0.096 0.105ra004 0.05 0.055ra004 0.02 0.015ra004 0.03 0.03ra005 0.026 0.025ra005 0.072 0.085ra005 0.036 0.03ra005 0.102 0.1ra005 0.094 0.1ra006 0.088 0.1ra006 0.076 0.08ra006 0.044 0.05ra006 0.118 0.115ra007 0.067 0.065ra007 0.075 0.07ra007 0.106 0.115ra007 0.082 0.09ra007 0.016 0.002ra008 0.097 0.09ra008 0.017 0.02ra008 0.041 0.035ra008 0.057 0.04ra008 0.119 0.13ra009 0.074 0.075ra009 0.118 0.115ra009 0.027 0.02ra011 0.042 0.055ra011 0.026 0.03ra011 0.028 0.025ra011 0.07 0.075ra012 0.048 0.045ra012 0.04 0.035ra012 0.111 0.115ra012 0.071 0.08ra012 0.088 0.09ra013 0.036 0.03ra013 0.032 0.025ra013 0.019 0.002ra013 0.036 0.002ra014 0.082 0.085ra014 0.03 0.025ra015 0.07 0.07ra015 0.016 0.002ra015 0.034 0.025ra015 0.068 0.075ra015 0.089 0.075

AP - Isolating chemical parameters...
Influences of FPI parameters using flat panels
0
0.05
0.1
0.15
0.2
0.25
0.3
0.35
0.4
0 2 4 6 8 10 12 14 16
Set "A" of NASA-SSME panels used for all exams. Panels include 56 cracks on 15 4"x15" panels (both sides). Size .016" to .118 (.361
extraneous, non-verified flaw)
A-h
at 9
0/95
CIF
(nde
) len
gth
(inch
es)
L 3 W-W A-NQ
L3 W-W AB-NQ
L 4 PE AB-NQ
TL-KN
L4 WW AB-NQ
L3 WW DP
Linear (L3 WW DP)
Linear (L3 W-W AB-NQ)
Linear (L 3 W-W A-NQ)
Linear (L4 WW AB-NQ)
Inspector
-& Group performance...

FPI - Group performance expectations
Influences of FPI parameters using flat panels
0
0.01
0.02
0.03
0.04
0.05
0.06
0.07
0 2 4 6 8 10 12 14 16
Inspector Group
A-h
at 9
0/95
CIF
(nde
) len
gth
(inch
es)

Example Three
Laser Methods - PODShearography

Application - Bonded Structures, types
Traditionally acoustic inspections UT, resonance, “tap”…
Lasers can sense, map bond related displacement
Engine EndClose-out
BaseClose-out
Thrust Ramp
EdgeAssembly
Ramp SupportStructure
Honeycomb is A-286, .032 facesheets over 1.4” thick .003-.004” core, .5x.2~” cell size. Core is perforated.
facesheet
liner

Shearography - What can we measure?

POD from X-33-LS-01Base Area Width Length
Flaw ID1 .25x.5 0.125 0.25 0.52 .25x.75 0.187 0.25 0.753 .25x1 0.25 0.25 14 .25x1.25 0.3125 0.25 1.255 .25x1.5 0.375 0.25 1.56 .25x1.5 0.375 0.25 1.57 .25x1.25 0.3125 0.25 1.258 .25x1 0.25 0.25 19 .25x.75 0.187 0.25 0.75
10 .25x.5 0.125 0.25 0.511 .2x.25 0.05 0.2 0.2512 .25x.25 0.0625 0.25 0.2513 .2x.25 0.05 0.2 0.2514 .25x.25 0.0625 0.25 0.2515 .2x.5 0.1 0.2 0.516 .2x.75 0.15 0.2 0.7517 .2x1 0.2 0.2 118 .2x1.25 0.25 0.2 1.2519 .2x1.5 0.3 0.2 1.520 .25x.25 0.0625 0.25 0.2521 .5x.5 0.25 0.5 0.522 .25x.5 0.125 0.25 0.523 .25x.75 0.1875 0.25 0.7524 .25x1 0.25 0.25 1
Shearography - A-hat vs a analysis
1st Cycle Braze Liner/Closeout Shearography POD(Valid for unbonds .2" and larger)
0.0
0.1
0.2
0.3
0.4
0.5
0.6
0.7
0.8
0.9
1.0
0.0000 0.0200 0.0400 0.0600 0.0800 0.1000 0.1200 0.1400 0.1600 0.1800
Unbond Area (.2"x.2" Decision threshold)
PO
D
90/95=.104 sq. in.
1st Cycle Braze A-hat Scatter(168 responses)
y = 1.03xR2 = 0.7562
0.00
0.10
0.20
0.30
0.40
0.50
0.60
0 0.05 0.1 0.15 0.2 0.25 0.3 0.35 0.4Area (sq. in.) - .2" min dim fwd>aft
Sh
earo
grap
hy r
esp
on
se
area (
sq
.in
.)
POD/MTD/Prod. Data Linear (POD/MTD/Prod. Data)

Comparing the old vs. the “challenger”
We can assess the discrete reliability as a function of decision threshold

Ultrasonic A-hat vs a for HC panel
1 2 3ap7 0.375 0.28 0.28 0.28ap8 0.25 0.16 0.16 0.12ap9 0.375 0.28 0.28 0.28ap10 0.25 0.12 0.12 0.12ap11 0.375 0.28 0.28 0.28ap12 0.25 0.2 0.16 0.16ap13 0.375 0.32 0.28 0.24ap14 0.25 0.08 0.04 0.08ap15 0.375 0.28 0.28 0.28ap16 0.25 0.04 0.04 0.08ap17 0.5 0.4 0.44 0.44ap18 0.5 0.4 0.36 0.44ap19 0.5 0.4 0.4 0.4ap20 0.5 0.4 0.4 0.4ap21 0.5 0.4 0.36 0.4at01 0.1875 0.025 0.025 0.025at02 0.1875 0.025 0.04 0.04at03 0.1875 0.025 0.025 0.025at04 0.1875 0.025 0.025 0.025at05 0.1875 0.025 0.025 0.025at06 0.25 0.04 0.04 0.05at07 0.25 0.05 0.08 0.04at08 0.25 0.04 0.04 0.04at09 0.25 0.04 0.04 0.04at10 0.25 0.04 0.04 0.04at11 0.375 0.24 0.24 0.2at12 0.375 0.2 0.2 0.24at13 0.375 0.24 0.24 0.24at14 0.375 0.24 0.24 0.28at15 0.375 0.2 0.24 0.24at16 0.5 0.36 0.36 0.4at17 0.5 0.4 0.4 0.44at18 0.5 0.36 0.36 0.36at19 0.5 0.36 0.36 0.36at20 0.5 0.36 0.36 0.36ab11 0.375 0.04 0.04 0.04ab12 0.375 0.08 0.04 0.08ab13 0.375 0.12 0.12 0.12ab14 0.375 0.16 0.12 0.12ab15 0.375 0.16 0.12 0.12ab16 0.5 0.28 0.28 0.32ab17 0.5 0.2 0.24 0.2ab18 0.5 0.28 0.36 0.32ab19 0.5 0.28 0.24 0.28ab20 0.5 0.4 0.32 0.4bp01 0.25 0.04 0.04 0.08bp02 0.25 0.04 0.025 0.025bp03 0.375 0.16 0.24 0.2bp04 0.375 0.16 0.16 0.2bp05 0.5 0.32 0.36 0.4bp06 0.5 0.36 0.4 0.44bp07 0.375 0.24 0.24 0.2bp08 0.25 0.025 0.025 0.025bp09 0.375 0.2 0.24 0.28bp10 0.25 0.04 0.04 0.04bp11 0.375 0.28 0.28 0.2bp12 0.25 0.12 0.08 0.04bp13 0.375 0.28 0.28 0.28bp14 0.25 0.08 0.12 0.08bp15 0.375 0.24 0.24 0.24
Ultrasonic sca tte r da ta fo r .016"sk in, .1875" ce l l pane l
0
0.1
0.2
0.3
0.4
0.5
0.6
0 0.1 0.2 0.3 0.4 0.5 0.6 0.7 0.8
Programme d Unbond D ime ns ion (inche s)
Me asure d Unbond D ime ns ion (in.)
T hre sho ld : 5x5 p ixe ls >= 6db

Shearography A-hat vs a for HC panel
1 2 3ap07 0.375 0.4942 0.4942 0.5295ap08 0.25 0.3353 0.3 0.3177ap09 0.375 0.4589 0.4589 0.4589ap10 0.25 0.3 0.3177 0.3177ap11 0.375 0.4589 0.4589 0.4942ap12 0.25 0.353 0.3 0.3353ap13 0.375 0.4412 0.4236 0.4412ap14 0.25 0.3177 0.3 0.3177ap15 0.375 0.3883 0.4236 0.4236ap16 0.25 0.353 0.353 0.3706ap17 0.5 0.5295 0.5471 0.5648ap18 0.5 0.6883 0.6883 0.653ap19 0.5 0.6177 0.5824 0.6001ap20 0.5 0.653 0.6883 0.6707ap21 0.5 0.5648 0.6001 0.5824at01 0.188 0 0 0at02 0.188 0 0 0at03 0.188 0 0 0at04 0.188 0 0 0at05 0.188 0 0 0at06 0.25 0 0 0at07 0.25 0 0.2824 0.2647at08 0.25 0 0 0at09 0.25 0 0 0at10 0.25 0 0 0.1765at11 0.375 0.3883 0.3883 0.353at12 0.375 0.4236 0.4589 0.4412at13 0.375 0.353 0.3883 0.3883at14 0.375 0.4942 0.5295 0.4942at15 0.375 0.4236 0.4765 0.4765at16 0.5 0.5824 0.5824 0.5824at17 0.5 0.6177 0.6177 0.6177at18 0.5 0.6177 0.6001 0.6001at19 0.5 0.5824 0.6354 0.6001at20 0.5 0.6001 0.653 0.6001ab11 0.375 0.3177 0.3353 0.2824ab12 0.375 0.3 0.2824 0.3ab13 0.375 0.3177 0.3177 0.3ab14 0.375 0.3706 0.353 0.353ab15 0.375 0.3353 0.353 0.353ab16 0.5 0.4589 0.4944 0.4589ab17 0.5 0.353 0.3706 0.353ab18 0.5 0.5648 0.5648 0.5471ab19 0.5 0.5118 0.5648 0.5648ab20 0.5 0.6707 0.653 0.653bp01 0.25 0 0 0bp02 0.25 0 0 0bp03 0.375 0.4236 0.4059 0.4236bp04 0.375 0.4589 0.3883 0.4059bp05 0.5 0.6001 0.5824 0.5824bp06 0.5 0.5824 0.6001 0.5824bp07 0.375 0.4942 0.4765 0.4942bp08 0.25 0 0 0bp09 0.375 0.4765 0.4765 0.4765bp10 0.25 0.2824 0.3 0.3bp11 0.375 0.5118 0.4942 0.4942bp12 0.25 0.2647 0.3117 0.2647bp13 0.375 0.4765 0.4765 0.4765bp14 0.25 0.2647 0.3 0.3bp15 0.375 0.4765 0.4942 0.4942
Shearography response scatter for .016" skin, .1875 cell panels
0
0.1
0.2
0.3
0.4
0.5
0.6
0.7
0.8
0.9
0 0.1 0.2 0.3 0.4 0.5 0.6
Programmed unbond dimension (inches)
Measured unbond (in.)
Example Four
Pressure Vessel PODUltrasonic & Eddy Current

PV-POD Using transfer functions to fill gaps
Often we are asked to develop POD… But we can not create perfect knowledge
Exact material Exact geometry The precise flaws expected in the design
- All orientations- All morphologies
How can we approximate what we do not know?
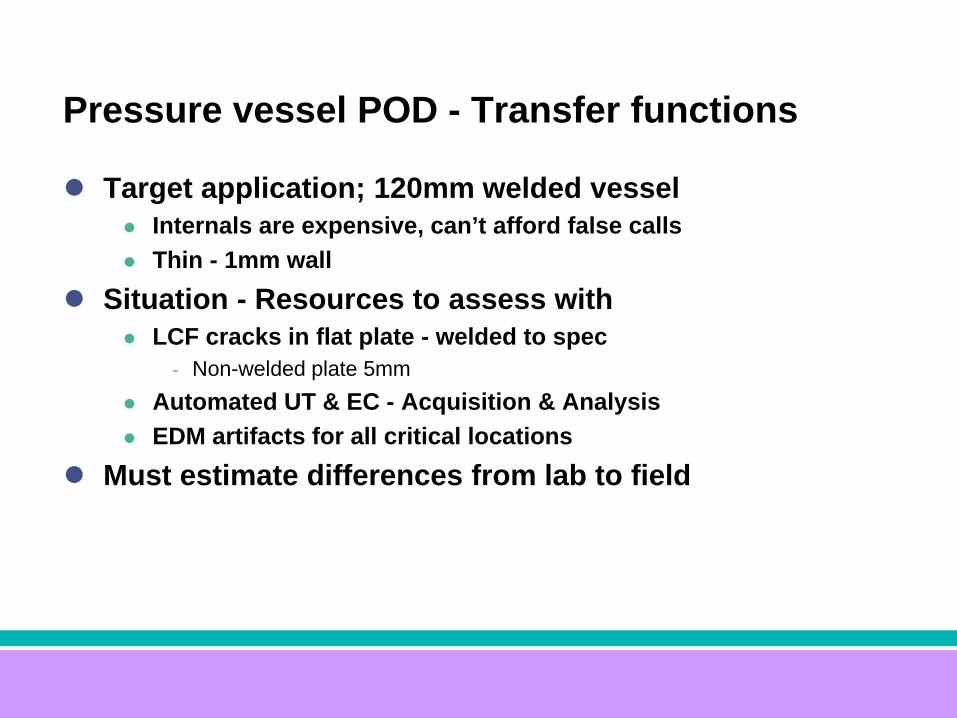
Pressure vessel POD - Transfer functions
Target application; 120mm welded vessel Internals are expensive, can’t afford false calls Thin - 1mm wall
Situation - Resources to assess with LCF cracks in flat plate - welded to spec
- Non-welded plate 5mm Automated UT & EC - Acquisition & Analysis EDM artifacts for all critical locations
Must estimate differences from lab to field

Transfer process
•Compare family of EDMs across thicknesses
•Compare family of EDMs across geometries & PM vs weld

PV - POD; Results ET
PV ET Scatter of Mean Responses for 26 Crack Sample
010000200003000040000
0 0.05 0.1 0.15
Crack Length (in.)
A/D
PV ET POD for Battery Parent Metal
0
0.5
1
1.5
0 0.01 0.02 0.03 0.04 0.05
Flaw Length (in.)
POD
(from 26parent.pod)

PV - POD; Results UT
Mean ultrasonic response versus length
0
200
400
600
800
1000
1200
1400
0 0.02 0.04 0.06 0.08 0.1 0.12
Crack Length (inches)
Amplitude (mv)
Discipline in calibration will assure estimate holds in practice!!

Example Five
Radiographic POD considerations

Radiography - HF dependant
Despite advances in image processing most applications rely on human interpretation
Detection targets include much beyond simple cracks of length and depth Pores, voids, cast shrink, honeycomb damage
WeldPM

How to achieve valid POD data for RT- without destructive sectioning of natural flaws?
Solution - Consensus evaluation of testset Inspectors differ on which are real flaws
24A/6R 21A/9R 16A/14R

Using baseline consensus to reduce variance Intersection of inspector agreement found valid in
Metallurgical assessment
21A/9R
24A/6R 16A/14R

Example Five
Variation AnalysisMeasuring known unknowns
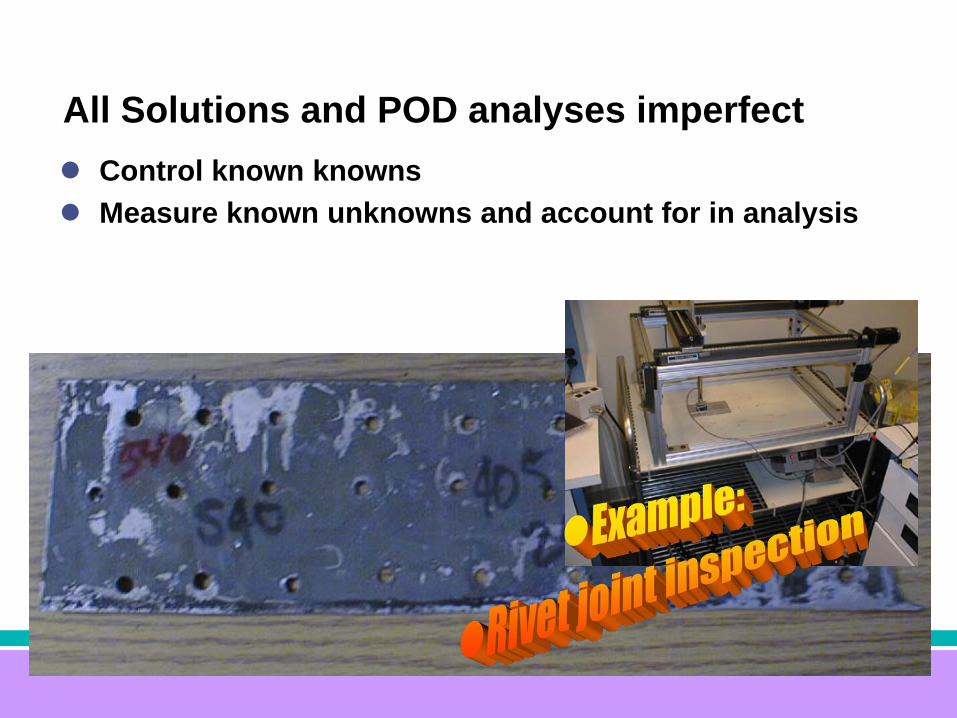
All Solutions and POD analyses imperfect Control known knowns Measure known unknowns and account for in analysis

Example - EC inspection of aircraft lap splices-Per print fastners not all in a row
Off axis model Parse new peaks based on offset
Take the data and effort to understand what you can see varying…There will be plenty which you can not!
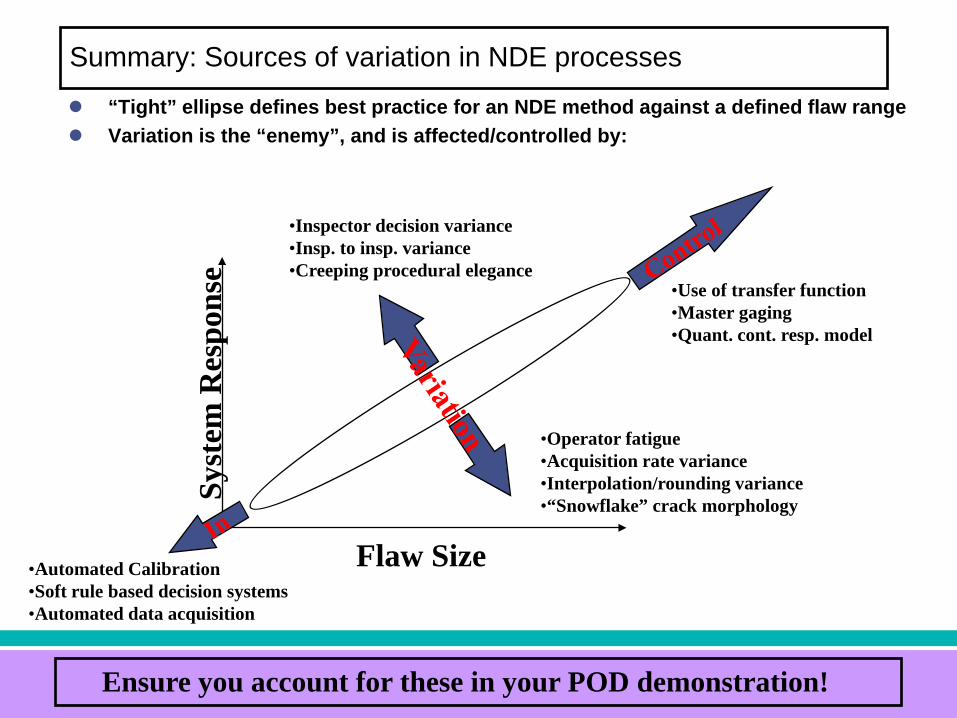
Summary: Sources of variation in NDE processes
“Tight” ellipse defines best practice for an NDE method against a defined flaw range Variation is the “enemy”, and is affected/controlled by:
•Use of transfer function•Master gaging•Quant. cont. resp. model
•Inspector decision variance•Insp. to insp. variance•Creeping procedural elegance
•Operator fatigue•Acquisition rate variance•Interpolation/rounding variance•“Snowflake” crack morphology
Flaw Size
Syst
em R
espo
nse
•Automated Calibration•Soft rule based decision systems•Automated data acquisition
Ensure you account for these in your POD demonstration!

Before the start: Background on NDE Reliability Measurement Practice
Vetting and assessing existing databases of POD capability Completing experimental gap analysis Calibrations & transfer functions Protocols for partial/full capability demonstrations Quality checking the data Selecting a model Understanding capability relationships behind POD curves Understanding & addressing experimental variation Substantiating and presenting the results
Summary & Closure
Feedback:
Did you achieve goals?
Comfortable using typical POD software and presentation tools
Can produce valid results Aware of sources of variation and mitigation steps

References/Resources
http://www.measuringusability.com/wald.htm http://www.causascientia.org/math_stat/ProportionCI.html http://stattrek.com/Help/Glossary http://www.statisticalengineering.com/ http://www.cnde.iastate.edu/MAPOD/ ASM NDT handbook Mil Std 1823 ASQ Reliability Engineering Bible Minitab SPlus R – Open source statistical software www.9095.net New release August 2009