Embed Size (px)
Citation preview

UNCLASSIFIED
lECUftlTY CLASSIFICATION OF THIS PAGE (Wh*n Dmim En(ered)
REPORT DOCUMENTATION PAGE 1. REPORT NUMBER
U. of Iowa 86-24 2. GOVT ACCESSION NO
READ INSTRUCTIONS BEFORE COMPLETING FORM
3 RECIPIENT'S CATALOG NUMBER
4. JiT\.E (tnd Sublllle)
SPORADIC NARROWBAND RADIO EMISSIONS FROM URANUS
7. AUTHORr*;
W. S. KURTH, D. A. GURNETT, F. L. SCARF
5. TYPE OF REPORT & PERIOD COVERED
Progress May 1986
6. PERFORMING ORG. REPORT NUMBER
8. CONTRACT OR GRANT NUMBERfaJ
N00014-85-K-0404
9. PERFORMING ORGANIZATION NAME AND ADDRESS
Department of Physics and Astronomy The University of Iowa Iowa City, Iowa 52242
11. CONTROLLING OFFICE NAME AND ADDRESS
Electronics Program Office Office of Naval Research Arlington, Virginia 22217
1«. MONITORING AGENCY NAME ft ADDRESSff/ dlllarent tram ControtUnt Olllca)
to. PROGRAM ELEMENT, PROJECT, TASK AREA 4 WORK UNIT NUMBERS
12. REPORT DATE
May 1986 13. NUMBER OF PAGES
32 15. SECURITY CLASS, (ol (hi* raporl)
UNCLASSIFIED 15«. DECLASSIFl CATION/DOWN GRADING
SCHEDULE
16. DISTRIBUTION ST AT EMEN T fo/ Ihis Ropori;
Approved for public release; distribution is unlimited,
17. DISTRIBUTION STATEMENT (ol th» mbttract mterad In Block 20, It dlH»r»nl from Report)
18. SUPPLEMENTARY NOTES
19. KEY WORDS (Continue on reveree aide It neceeemry end Identity by block number)
Radio Emissions Uranus Voyager
20. ABSTRACT (Continue on reveree tide It neceamary end Identity by block number)
(See page following.)
DD 1 JAN*73 1473 EDITION OF I NOV 65 IS OBSOLETE S/N 0102-LF-014-6601
UNCLASSIFIED SECURITY CLASSIFICATION OF THIS PAGE flWi^n Dmte Entered)
U. of Towa 86-24
Sporadic Narrowband Radio Emissions From Uranus
by
W. S. Kurth^, D. A, Gurnett^ and F. L. Scarf2
/ May 1986
Submitted to The Journal of Geophysical Research.
Department of Physics and Astronomy, The University of Iowa, Iowa City Iowa 52242
TRW Space and Technology Group, One Space Park, Redondo Beach, California 90278, and Inst. of Geophysics and Planetary Physics, UCLA, Los Angeles, California 90024
The research at the University of Iowa was supported by the National Aeronautics and Space Administration through Contract 954013 through the Jet Propulsion Laboratory and the Office of Naval Research through Grant N00014-85-K-0404. The research at TRW was supported by NASA through Contract 954012 with the Jet Propulsion Laboratory.
ABSTRACT
Among several different types of radio emissions discovered at
Uranus during the Voyager 2 encounter in January 1986 is a very
sporadic, bursty signal which consists of very narrow bands lying in
the frequency range from about 3 to 10 kHz. The bursty emission was
virtually undetectable from the dayside portion of the Voyager 2
trajectory but was observed out to beyond 300 % during the outbound
trajectory through the pre-dawn sector. While the narrowband tones
making up this emission are reminiscent of escaping continuum
radiation observed near Earth, Jupiter and Saturn, the Uranian signals
show large amplitude variations on time scales of a second suggesting
a very different type of generation mechanism.

•' '' '- I. INTRODUCTION
During the Voyager 2 flyby of Uranus in January 1986, several
types of radio emissions were discovered by the plasma wave
investigation [Gurnett et al., 1986] and the planetary radio astronomy
investigation [Warwick et al., 1986]. The bulk of the radio spectrum
of Uranus lies above about 30 kHz, however, there is evidence of
nonthermal continuum radiation at frequencies down to about 1 kHz. As
Voyager 2 left Uranus in the pre-dawn sector still another type of
emission was detected in a band centered near 5 kHz [Gurnett et al.,
1986].
The new band of radio emission found on the nightside of Uranus
Is remarkable in that while it displays a spectrum similar to
escaping nonthermal continuum radiation detected at Earth [Kurth et
al., 1981], Jupiter [Gurnett et al., 1983], and Saturn [Gurnett et
al. , 1981a], it is much more bursty and sporadic in nature than the
continuum radiation. In fact, the time scale for amplitude variations
of on the order of 30 dB is typically one second.
In this report we investigate the details of the sporadic
narrowband emission from the magnetosphere of Uranus. We will
emphasize the peculiar bursty nature of the emission and argue that a
rather exotic source mechanism may be responsible for the emission.
The observations presented herein are all taken from the Voyager 2

plasma wave receiver which has been described in detail by Scarf and
Gurnett [1977].

II. OBSERVATIONS
An overview of the observations of the bursty radio emission in the
frequency range of a few kHz is presented in Figure 1. Illustrated are
the peak and average power fluxes detected by the spectrum analyzer
channels centered at 3.11, 5.62, and 10.0 kHz as a function of time.
The height of the solid black areas represent approximately 11-minute
average values in each channel, while the peak power fluxes observed
during the same 11-minute averaging intervals are plotted as a line
above the averages.
It is clear in Figure 1 that the bulk of the emission is in the
5.62-kHz channel although considerable activity can be seen at 3.11 kHz
and some emissions spread upward into the 10-kHz channel early in the
plotted interval. It is important to point out, however, that during
the interval from late on January 27 through January 29 the spacecraft
traversed the bow shock several times [Bridge et al., 1986; Ness et al.,
1986] and the response at 3 kHz is primarily due to electron plasma
oscillation (Langmuir wave) activity in the upstream regions associated
with these shock crossings. The activity at 3.11 kHz prior to late
January 27 is the lower frequency extent of the waves of interest here.
Very little activity is observed after January 31, however, there is
evidence for the bursts on February 5 at about 570 Rjj.
The bursty nature of the emission is apparent in Figure 1. In
addition to the highly sporadic fluctuations in the peak amplitudes,
the very large peak-to-average ratios which are in many cases much
greater than 10 point to the highly variable amplitudes of the emis-
sion. In fact, that one cannot discern a difference between the
temporal character of the radio emission and the electron plasma
oscillations seen on days 28 and 29 of Figure 1 underscores the
temporal variability since plasma oscillations are typically one of
the most sporadic types of plasma waves. '
; Figure 2 shows several examples of high resolution frequency-time
spectrograms which detail both the temporal and spectral character-
istics of the radio emission. Each spectrogram shows the intensity of
waves as a function of both frequency (ordinate) and time (abscissa).
The most intense waves are darkest. Each panel represents a 10-second
interval and the frequency range covered is 0 to 12 kHz. The Fourier
transforms used to calculate the spectra provide about 28 Hz resolu-
tion and a new spectrum is calculated every 60 msec. Panels A through
E in Figure 2 show examples of the spectrum of the radio emission
responsible for the activity shown in Figure 1 at 5.62 kHz and
sometimes the surrounding channels.
The radio emission appears in the spectrograms in Figure 2 as
numerous narrowband signals, many of which have durations of only a
few seconds. The narrowband tone at 2.4 kHz is interference from the
Voyager power supply and the band at 1.8 kHz is also thought to be
interference since it also appeared in the Saturn data set; however,
the source of this lower frequency interference is not known. The
radio emissions of interest seem to be composed of both the brief
bursts as well as an underlying, more continuous system of narrow
bands. In some spectrograms, the weaker, more stable bands tend to
coalesce into weak, diffuse bands. The more intense bursts are
occasionally seen superimposed upon the diffuse bands.
The observations presented in Figures 1 and 2 provide solid evi-
dence that the bursty emissions are freely propagating electromagnetic
waves. The radio emissions are at frequencies sufficiently high that
the waves can freely propagate into the solar wind. The solar wind
plasma frequency fp is typically in the range of 2 to 3 kHz at the
orbit of Uranus based on the frequency of upstream plasma oscillations
[Gurnett et al., 1986] and fp in the magnetotail is even less. The
spectrum, while showing random variations in detail, remains constant
in general even though the spacecraft has moved through the magneto-
tail, magnetosheath, and solar wind from January 25 through 31. While
uncertainties in the receiver calibration caused by a failure in the
spacecraft data system and the very bursty nature of the emissions
make it difficult to detect a l/R^ intensity variation, it is clear
that both the amplitude and occurrence rate of the emissions drops
dramatically over the 7 days illustrated.
The frequency range of the narrowband radio emission lies between
about 3 and 10 kHz. The more diffuse portion of the spectrum is
limited to the range from about 3 to 6 kHz. If there is a preferred
frequency for the bursty emissions, it is 5 kHz; but the bursts can be
found over the entire range from 3 to 10 kHz.
More details of the spectrum of the Uranian radio emission near 5
kHz can be seen in Figure 3 which shows power flux as a function of
frequency for three selected time periods. Each spectrum is a 0.6-
second average and the strong band of noise below 1 kHz is interfer-
ence thought to be associated with the operation of the tape recorder
on board the spacecraft. The interference tones at 1.8 and 2.4 kHz
have been removed. In the top panel of Figure 3 there is a general
rise in wave amplitudes from about 3 to 7 kHz corresponding to the
more diffuse component of the emission. Superimposed upon this gener-
ally elevated spectrum are a few, very narrow lines with power fluxes
at least a factor of 10 greater than the background levels.
The middle panel of Figure 3 again shows some evidence for a
diffuse component between 3 and 5 kHz but also strong lines which
extend from just above 3 kHz to almost 10 kHz. The bandwidths of the
lines often do not exceed 100 Hz. For a line near 10 kHz, the
bandwidth is only 1 percent of the center frequency.
The bottom panel of Figure 3 shows a single intense spike at
about 5.5 kHz. The diffuse component is not present, however, Voyager
2 was greater than 300 % from Uranus at this time and the amplitude
of the diffuse emission may have simply dropped below the detection
threshold because of the l/R^ effect. We should point out, however,
that the diffuse component does not necessarily vary only as 1/R^;
there are spectrograms much closer to Uranus which show evidence for
only the bursty component, hence, it is likely that there are temporal
variations in the diffuse component with time scales perhaps much
greater than a few seconds.

The narrowband nature of these Uranian radio emissions is similar
to escaping continuum radiation at the Earth and similar emissions
observed at Jupiter and Saturn. However, the very bursty nature of
the Uranian emissions shown in Figures 1 and 2 set the Uranian emis-
sions apart from those with which we are familiar. Figure 4 illus-
trates the very short time scales of intensity variations character-
istic of the bursty emission. In Figure 4 we have plotted the inten-
sity (power flux) of radio waves as a function of frequency and time
in a three dimensional perspective plot to show the rapid variations
in time for this narrowband burst. The frequency range is from 4 to 6
kHz and the entire time represented is 12 seconds. The original data
have a temporal resolution of 60 msec and a spectral resolution of
about 28 Hz, however, we have averaged each point over the five sur-
rounding spectral and five surrounding temporal components (a two-
dimensional boxcar average) to obtain the surface represented in
Figure 4.
Figure 4 demonstrates that the power flux for this burst can
increase or decrease by 30 dB within a second or so. Similar analyses
of the temporal variations of narrowband electromagnetic emissions
from Jupiter show variations in power flux of a few db on the same
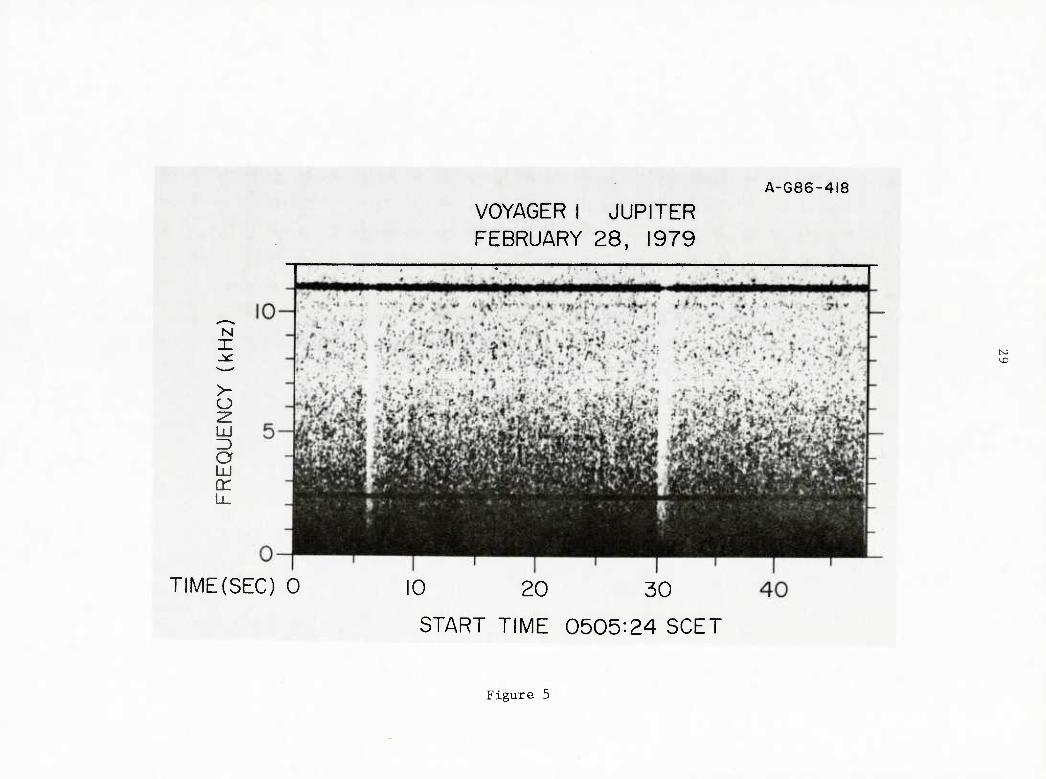
time scale. Figure 5 is an example of narrowband electromagnetic
radiation at 11 kHz escaping from the Jovian magnetosphere as observed
by Voyager 1. Note that the only apparent variations in amplitude
during the 48-second interval occur about 6 and 30 seconds into the
frame. These two decreases in signal level are actually due to
decreases in the gain of the automatic gain controlled receiver ia

10
response to interference from a stepper motor on board the spacecraft.
The hand shows significant amplitude variations only on time scale of
several minutes. The Uranian radio burst in Figure 4 will not be
fully understood unless the generation mechanism can explain both the
narrowband nature and the rapid variations in intensity. We will
attempt to address both issues in the next section.
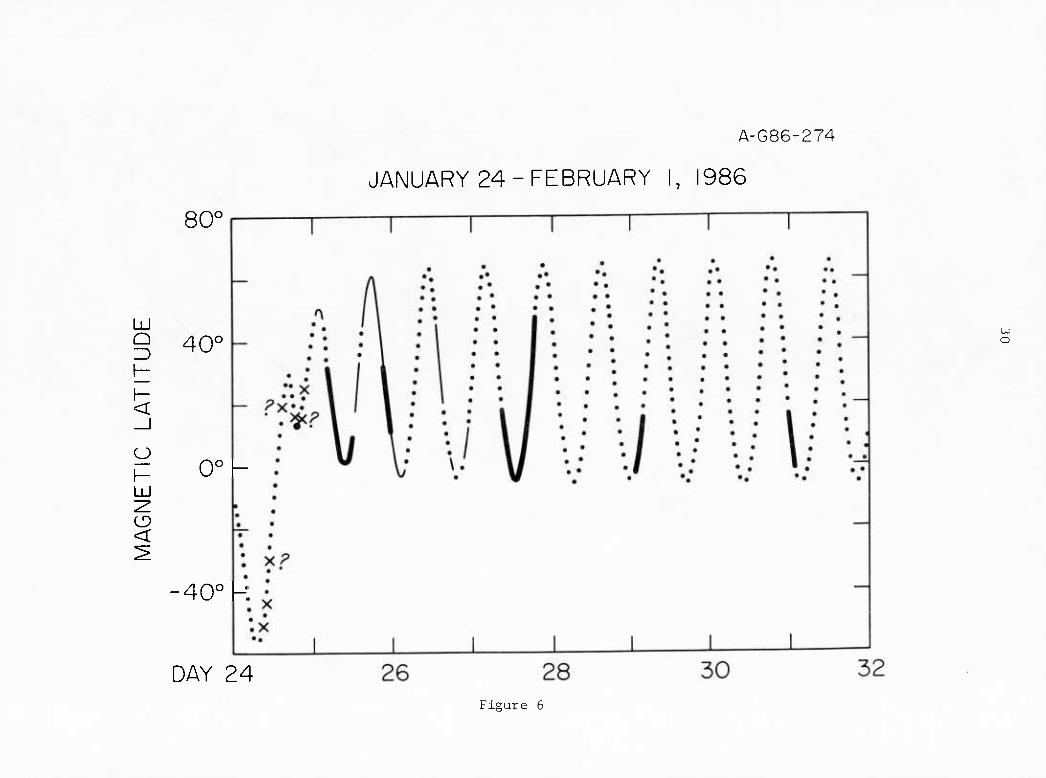
In an attempt to understand the location of the source of the
5-k.Hz radio emission we have plotted the magnetic latitude of Voyager
2.from January 24 to February 1, 1986, as a function of time in Figure
6 using information about the orientation of the magnetic dipole from
Ness et al. [1986]. There is no clear evidence for the existence of
the radio emission in the spectrum analyzer data prior to January 25,
however, there is some evidence of either the diffuse emission or the
bursts in some of the wideband frames obtained on January 24. The
locations of the spacecraft for those times when there is evidence in
the wideband frames only on January 24 are marked with 'X'. In some
cases, it is possible that the signature in the wideband frames is a
different type of radio emission and not the bursty emission discussed
in this paper; hence, we have placed question marks by these question-
able events.
After January 25, two types of markings were used to identify
times (magnetic latitudes) when the sporadic, narrowband emission was
present. The thin solid line represents times when there is weak
evidence for the emission. That is, if bursts were too sparse to
significantly affect the averaged power flux as plotted in Figure 1

11
when the spacecraft was less than about 150 Ry from Uranus, a thin
line was used in Figure 6. The broad lines imply the radio emission
was more prominent. While the distinction here is mainly qualitative,
it is important to provide a means of de-emphasizing the weaker
emissions observed close to Uranus which would not be detectable at
larger distances since we have not taken a l/R^ trend into account.
The impression left by the pattern of detections, especially the
more 'prominent' detections is that the emission was observed with
confidence only after encounter (when the spacecraft was in the pre-
dawn location) and then usually at the lowest magnetic latitudes
observed by the spacecraft.
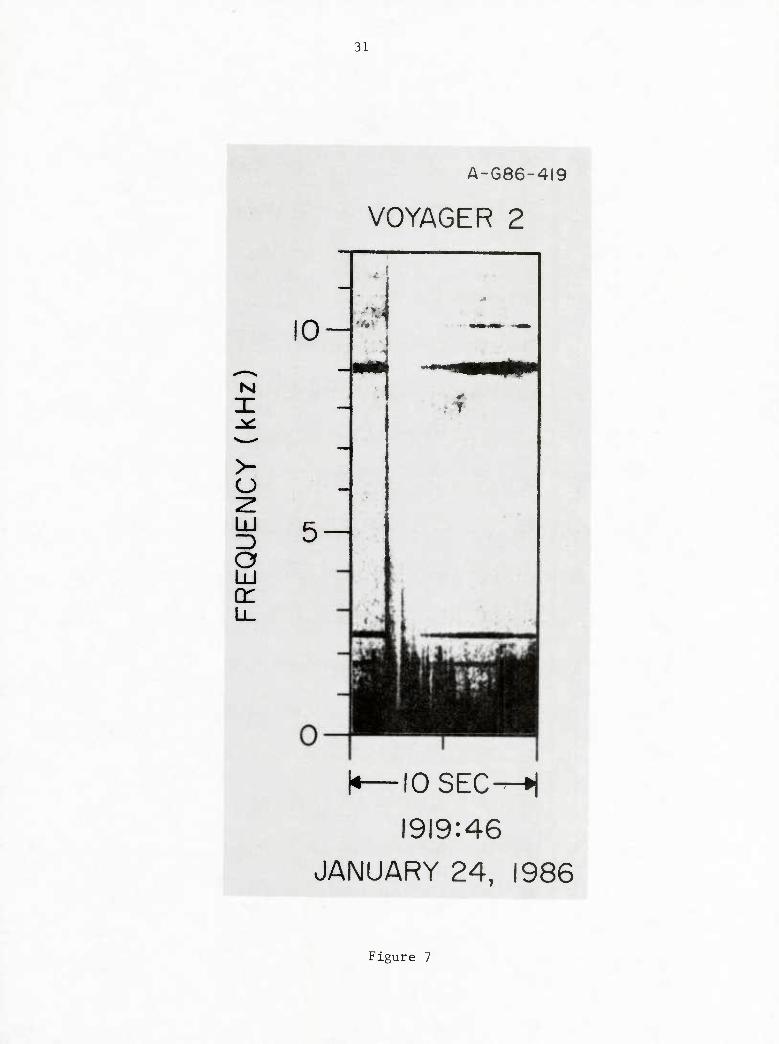
In Figure 7 we have illustrated wideband data which may have a
bearing on a possible source of the bursty radio emissions. This
spectrogram was observed near the time when Voyager traversed the
Miranda L-shell. The intense narrowband line at 9 kHz is of interest
since it is a possible source for the electromagnetic emissions
observed later. The intensity and narrowband character make the con-
nection to the radio emissions a reasonable one, even though the con-
nection cannot be proven. The large dot in Figure 5 late on January
24 marks the location of Voyager 2 at the time the data in Figure 2
were taken. It is interesting and highly suggestive that the latitude
of this intense narrowband emission is very close to the most favor-
able latitude for observing the radio emission. We will discuss the
possible significance of the narrowband emission in Figure 7 in the
next section.

12
IV. DISCUSSION AND CONCLUSIONS
The observations presented above show the characteristics of a
new radio emission discovered in the region around Uranus. The emis-
sion exhibits extremely narrowband bursts with bandwidths of a few
percent or less and time scales of seconds. The bursts are accompa-
nied at times by a diffuse underlying structure of more temporally
continuous bands. It is conceivable that the diffuse component is the
result of the superposition of several weak bursts. The emission is
only weakly present during the close-in dayside trajectory of Voyager
2 and is prominent in the radial distance range of about 20 to 300 Rjj
as the spacecraft leaves Uranus in the pre-dawn direction.
It is tempting to associate the source location for the bursty
radio emissions with the Miranda L-shell. During the brief passage
through the Uranlan magnetosphere, there is little chance to sample
anything but the smallest region dictated by the flyby trajectory.
Hence, it is quite unlikely that the spacecraft passed through an
active source region for the bursty radio emissions detected during
the outbound leg. There are many reasons, however, to suspect that
the outbound Miranda L-shell crossing is a region which is either
close to or similar to the radio emission source region. The narrow-
band emission at 9 kHz in Figure 7 is likely to be an electrostatic
emission near the local plasma frequency or upper hybrid resonance

13
frequency fyn* While most of the radio bursts discussed herein are at
lower frequencies, there are a few lines observed at 9 kHz. It is
interesting to note that according to Ness et al. [1986] the range of
magnetic field strengths of the L-shells traversed by Miranda
correspond to electron gyrofrequencies ranging from about 5 to 9.5
kHz. Should the line at 9 kHz in Figure 7 be a Bernstein mode, lying
between the electron gyrofrequency and its second harmonic, then one
might expect similar lines at a wide range of frequencies extending
down to the lower end of the radio emission frequency range. Plasma
densities from the plasma experiment [J. W. Belcher, personal communi-
cation, 1986] are consistent with an upper hybrid resonance frequency
(fUH^ "^ ■^g^ + fp^) in the range of about 9 kHz at 1920 SCET on January
24; fg is the electron gyrofrequency.
Another interesting observation from the region associated with
the outbound Miranda L-shell crossing is the presence of intense, low
frequency bursts of plasma wave activity. Figure 8 shows spectrum
analyzer data from the one-hour interval around the Miranda L-shell
crossing. The wideband data shown in Figure 7 were obtained at the
time of the data gap shortly before 1920 SCET. The line crossing
through the 5.62 kHz channel represents fg according to information
provided by the magnetometer team [N. F. Ness, private communication,
1986]. It is clear that several different types of wave modes are
present during this interval. The bursty emissions above fg-
correspond to the line at 9 kHz in Figure 7 and are likely plasma
waves associated with fy^. The intense emissions with limited band-
width in the region from perhaps 0.25 to 0.5 fg are likely to be

14
whistler modes. Emissions in the range below a few hundred Hz could
be Doppler-shifted ion-acoustic waves.
With the presence of the bursty plasma wave emissions at very low
frequencies, it is possible to conceive of 3-wave interactions
involving one of the low frequency emissions, the intense narrow band
near 9 kHz, and an electromagnetic mode which we detect as a freely
propagating radio wave as Voyager leaves Uranus.
The above-described 3-wave process is similar to one of the
favored mechanisms for the generation of continuum radiation at the
Earth, .Jupiter, and Saturn. That is, the continuum radiation is
thought to be a nonlinear process involving an intense band near fyn
and some low frequency plasma wave which produces an electromagnetic
wave (the continuum radiation) at nearly the same frequency as the
upper hybrid band [see, for example, Melrose, 1981]. An alternative
hypothesis is a linear conversion from the upper hybrid band to an
electromagnetic mode [see, for example, Jones, 1976].
The theories for generation of continuum radiation, then, are
perhaps applicable to the Uranian emission near 5 kHz, and if so,
point to the region near Miranda's orbit because intense narrow bands
near fyjj are detected there. (There is little evidence to help us
choose between the linear or nonlinear generation mechanisms,
however.) But the major problem with this generation mechanism is
that the continuum radiation usually has a very smooth temporal
behavior, as shown in Figure 5, strikingly different from that demon-
strated in Figures 1, 2, and 4. Very little has been mentioned in the
literature about the temporal variability afforded by the theories for
15
continuum radiation so it is not possible to immediately assess
whether either the linear and/or nonlinear theories can account for
smooth temporal variations at Earth, Jupiter, and Saturn, and tVie very
bursty behavior at Uranus.
There is another mechanism which comes to mind which might
explain the very bursty temporal variations of the Uranian 5-kHz radio
emission. Soliton collapse has long been considered a viable mecha-
nism for solar Type III radio bursts generated in the interplanetary
medium [see, for example, Goldman, 1983]. Type III bursts do not show
a rapidly varying component, but the model assumes the collective
action of many solitons and electromagnetic radiation from the
'condensate' radiation left by soliton collapse and burn-out [Goldman,
1984J.
There is some speculation that electromagnetic radiation could be
generated from the collapse of a single soliton if ion-acoustic waves
were present to take up momentum and serve as the third wave in
wave-vector and frequency matching conditions. The electron plasma
oscillations responsible for the ponderomotive force which collapses
the soliton is the pump wave in this scenario. This mechanism would
certainly explain the time scales of the bursts reported herein.
We have examined the energetics implied by generation of individ-
ual bursts via soliton collapse. If we assume the burst illustrated
in the bottom panel of Figure 3 was beamed into a solid angle of only
1 steradian (prompted by the restricted observability of the emission
Illustrated in Figure 6) and the source is a plasma consisting of 1
keV electrons with a density of 1 cm~^ (very optimistic in view of the
16
plasma observations in the region near Miranda's L-shell [R. L.
McNutt, personal communication, 1986J), then 100 percent of the
thermal plasma energy from a volume of (1000 XDebye)^ would have to be
converted into electromagnetic waves in the process of soliton
collapse to account for the observed amplitude of the radio burst at
greater than 300 Ry. Since soliton collapse generally results in
plasma heating, this efficiency for electromagnetic wave generation is
high by several orders of magnitude. Further, the frequency of the
pump (Langmuir) wave would vary throughout the collapse process and
the resulting electromagnetic wave would almost certainly not be
monochromatic, as observed.
The energy problem could be solved if many solitons were
radiating, however, the effect of superimposing radiation from several
collapsing solitons would be to spread both the temporal and spectral
profile of the radio emission. Type HI solar bursts are long lived
and have relatively broad bandwidths because of these collective
effects. We must conclude, then, that soliton collapse is not a
viable mechanism for the observed waves and we are led to consider
other possibilities.
It is possible to produce a short, monochromatic pulse response
in a detector simply by sweeping a narrow beam of monochromatic waves
over the detector. The pulse length is determined by the beam width
and angular velocity of the beam. The very short pulse durations
reported herein imply a very narrow beam or very large angular velo-
cities. The monochromatic spectrum is inherent in the source.
17
One excellent method of producing a monochromatic, highly
collimated beam is via a laser mechanism since these are two basic
features of a laser. We suggest that the 5-kHz Uranian bursts could
be the result of some lazing process operating in the magnetosphere of
Uranus. Calvert [1982] has suggested that several properties of
auroral kilometric radiation at the Earth can be explained by coupling
the wave amplification mechanism of Wu and Lee [1979] with a positive
feedback mechanism. High resolution spectrograms of auroral kilo-
metric radiation do not show the type of temporal and spectral
behavior seen in Figure 2, however. Instead, the terrestrial emission
is composed of narrowband tones which are nearly continuous in ampli-
tude, and which vary in frequency very rapidly.
If we use current ideas on the generation of continuum radiation
instead of the Wu and Lee mechanism for auroral kilometric radiation,
we might begin to fashion a viable mechanism for the Uranian bursty
emission. This choice is suggested by the similarity in bandwidth and
slowly varying spectral behavior of the continuum radiation and the
Uranian emission coupled with the apparent low magnetic latitude of
the source at Uranus. The upper hybrid bands at the Earth associated
with continuum radiation source regions are usually located near the
magnetic equator.
The model is complicated by the reliance of both the linear and
nonlinear theories for the generation of continuum radiation on
coupling from the electrostatic Bernstein mode into the electromag-
netic mode. For a simple laser model, one has an amplification pro-
cess which operates directly on the electromagnetic mode which
18
executes multiple reflections through the amplification region before
being emitted. Perhaps it would be possible for the electrostatic
waves to make multiple reflections through a region of growth and have
the resulting, highly amplified electrostatic mode couple into the
electromagnetic mode at the reflecting boundary, presumably the wall
of a duct.
In any case, angular motion of the beam seems to be assured by
the dramatic tumbling motion of the magnetic field of Uranus which is
due to the 60-degree tilt with respect to the angular momentum axis of
the planet [Ness et al., 1986]. In fact, it could be that the large
dipole tilt is responsible for the dramatic difference between the
smoothly varying narrowband emissions from Jupiter, Saturn and Earth
compared to the very bursty nature of the Uranian emission. While
both Jupiter and Saturn rotate more rapidly than Uranus, the apparent
motion of a spacecraft in magnetic latitude at Uranus, is much greater
than at the other planets. This distinction would imply a beam which
is broad in azimuth, but narrow in latitude. Jones [1980] has
predicted strong latitudinal beaming as a consequence of the linear
conversion of the electrostatic mode into the electromagnetic mode at
Earth and Jupiter, however, Jones' model would predict rapidly
drifting frequencies as the observer changed magnetic latitude. For
the short time intervals for which we have observations, this drift is
not apparent.
It is not within the scope of this paper to develop in detail a
generation mechanism for the new radio emission described herein. The
main purpose has been to fully describe the observations and draw some
19
general conclusions about the requirements on the source mechanism.
These requirements lead quite naturally to a number of possibilities
such as soliton collapse and lasing mechanisms. We suggest that the
lasing mechanism holds the greatest potential for success based on the
rather simple-minded approach taken above. It is obvious that
considerable theoretical effort will be required to firmly establish
any mechanism.
20
■ >- ACKNOWLEDGEMENTS
The authors would like to acknowledge D. N. Nicholson, J. P.
Sheerln, and C. K. Goertz for useful discussions. We are also
grateful to N. F. Ness and the Voyager magnetometer team for
information on the magnetic field strength and J. W. Belcher and R. L.
McNutt of the Voyager plasma science team for information on the
plasma densities and temperatures used herein.
The research at the University of Iowa was supported by the
National Aeronautics and Space Administration through Contract 954013
through the Jet Propulsion Laboratory and the Office of Naval Research
through Grant N00014-85-K-0404. The research at TRW was supported by
NASA through Contract 954012 with the Jet Propulsion Laboratory.

21
REFERENCES
Bridge, H. S., J. W. Belcher, B. Coppi, A. J. Lazarus, R. L. McNutt,
Jr., S. Olbert, J. D. Richardson, M. R. Sands, R. S. Selesnick,
J. D. Sullivan, R. E. Hartle, K. W. Ogilvie, E. C. Sittler, Jr.,
F. Bagenal, R. S. Wolff, V. M. Vasyliunas, G. L. Siscoe, C. K.
Goertz and A. Eviatar, Plasma observations near Uranus: Initial
results from Voyager 2, Science, submitted, 1986.
Calvert, W. , A feedback model for the source of auroral kilometric
radiation, J. Geophys. Res., 87, 8199, 1982.
Goldman, M. V., Progress and problems in the theory of Type III solar
radio emission. Solar Phys., 89, 403, 1983.
Goldman, M. V., Strong turbulence of plasma waves, Rev. Mod. Phys.,
56, 709, 1984.
Gurnett, D. A., W. S. Kurth and F. L. Scarf, Narrowband
electromagnetic emissions from Saturn's magnetosphere, Nature,
292, 733, 1981a.
Gurnett, D. A., W. S. Kurth and F. L. Scarf, Narrowband
electromagnetic emissions from Jupiter's magnetosphere. Nature,
302, 385, 1983.
Gurnett, D. A., W. S. Kurth, F. L. Scarf and R. L. Poynter, Plasma
wave observations at Uranus from Voyager 2, Science, submitted
1986.

22
Gurnett, D. A., J. E. Maggs, D. L. Gallagher, W. S. Kurth and F. L.
Scarf, Parametric interaction and spatial collapse of beam-driven
Langmuir waves in the solar wind, J. Geophys. Res., 86, 8833,
1981b.
Jones, D., Source of terrestrial nonthermal radiation. Nature, 260,
686, 1976.
Jones, D., Latitudinal beaming of planetary radio emissions. Nature,
288, 225, 1980.
Kurth, W. S., D. A. Gurnett and R. R. Anderson, Escaping nonthermal
continuum radiation, J. Geophys. Res., 86, 5519, 1981.
Melrose, D. B., A theory for the nonthermal radio continua in the
terrestrial and Jovian magnetospheres, J. Geophys. Res., 86,
30, 1981.
Ness, N. F., M. H. Acuna, K. W. Behannon, L. F. Burlaga, J. E. P.
Connerney, R. P. Lepping and F. M. Neubauer, Magnetic fields at
Uranus, Science, submitted, 1986.
Scarf, F. L., and D. A. Gurnett, A plasma wave investigation for the
Voyager mission. Space Sci. Rev., 21, 289, 1977. ;; .
Warwick, J. W., D. R. Evans, J. H. Romig, C. B. Sawyer, M. D. Desch,
M. L. Kaiser, J. K. Alexander, T. D. Carr, D. H. Staelin,
S. Gulkis, R. L. Poynter, M. Aubier, A. Boischot, Y. Leblanc,
A. Lecacheux, B. M. Pedersen and P. Zarka, Voyager 2 radio
observations of Uranus, Science, submitted, 1986.
Wu, C. S., and L. C. Lee, A theory of the terrestrial kilometric
radiation, Astrophys. J., 230, 621, 1979.
23
FIGURE CAPTIONS
Figure 1 Power flux as a function of time for three of the
Voyager 2 spectrum anayzer channels showing the low
frequency radio emission as the spacecraft left Uranus
in the pre-dawn direction. Notice that the bulk of the
activity occurs in the 5.6-kHz channel, but occasion-
ally spreads into the adjoining channels. Much of the
activity at 3.1 kHz after the middle of day 27 are
electron plasma oscillations associated with numerous
bow shock crossings.
Figure 2 A series of frequency-time spectrograms which show the
detailed spectral and temporal behavior of the bursty
Uranian radio emission. The emission is characterized
by brief, narrowband bursts superimposed on a weak
diffuse component. The lines at 2.4 and 1.8 kHz are
spacecraft interference.
Figure 3 High resolution spectra from three selected time
Intervals which show the rich spectral structure of the
Uranian radio emission from 3 to 10 kHz. Some evidence
for underlying diffuse bands is present in the upper
two panels while only the Intense, narrow band at 5.5
kHz is present in the bottom panel.
24
Figure 4 A perspective plot showing Intensity as a function of
frequency and time illustrating the extremely narrow-
band and bursty nature of this radio emission at about
5 kHz.
Figure 5 A spectrogram taken by Voyager 1 at Jupiter showing the
very steady nature of the Jovian narrowband emission at
11 kHz.
Figure 6 A plot of the magnetic latitude of Voyager 2 as a
function of time based on information of the Uranian
magnetic field provided by the Voyager magnetometer.
The heavy dark lines show intervals when the 5-kHz
emission was prominent. The emission was only very
weakly detectable in waveform samples on the inbound
(dayside) leg of the encounter (indicated by 'X's).
Figure 7 This wideband spectrogram may be representative of the
source region of the bursty Uranian radio emission.
The narrowband emission at 9 kHz is likely to be an
electrostatic band near fyy which could couple into the
escaping electromagnetic mode. These data were
obtained in the vicinity of the Miranda L-shell.
Figure 8 Spectrum analyzer data from the region around the
outbound Miranda L-shell crossing which is a possible
source region for the 5-kHz Uranian radio emission.

A-G86-272
VOYAGER 2
JANUARY 25-FEBRUARY I, 1986
R(Ru)
26 27 I I
50 100
28 29 30 31 32 I I I I I
150 200 250 300 350
N>
Figure 1

Nl X
>- U
UJ Z) o LJU Cd
® ® © ® B-G86-420
10 SEC
25/0635:46
h-IOSEC-H H-IOSEC-H
25/1604:34 26/0217:22
H-IOSECH
29/0016:36
H-IOSEC-H
31/0004:11
VOYAGER 2 JANUARY 1986
Figure 2

27
D-G86-280-I
tsi X
I E
X
UJ
o a.
10
10
■13
14
VOYAGER 2
0.6-SECOND AVERAGE SPECTRA 1 I \ r
10
10
10
10
10
16
17
14 H 1 1 1-
15
10
10
10
10
10
17
14
■15
16
10
■4 H
'^
J L
n \ \ ] r~
JANUARY 25, 1986 0635:50.3 SCET
\f^^W^/A|^^
1 1 h -\ 1-
JANUARY 26, 1986
0217:28.6 SCET
H h -i H
JANUARY 31, 1986 0004:02.7 SCET
"HWWifvH^ J L
0 2 4 6 8
FREQUENCY (kHz)
J L
10 12
Figure 3

A-G86-288
lo'S
N X
I
X
_J Li_
O CL
VOYAGER 2 JANUARY 31, 1986 0004:11 SCET
CO
Figure 4
A-G86-4I8
rsi
>- o LU Z) O LU tt:
VOYAGER I JUPITER FEBRUARY 28, 1979
TIME(SEC) 0 10 20 30
START TIME 0505:24 SCET
Figure 5
A-G86-274
JANUARY 24-FEBRUARY I, 1986
80°
LLI Q 3
U
UJ
o <
40°
0° -
40° -:
DAY 24
o
Figure 6
31
A-G86-4I9
o z: UJ
O Ijj (T
VOYAGER 2
10
OSEC—^
1919:46
JANUARY 24, 1986
Figure 7

C-G86-329
N X ^c
>- O -z. LJ Z) o ct:
VOYAGER 2 JANUARY 24, 1986
3.11 j
1.78 j 1.00 J
.562 j
.311 J
.I78J
.100 J
.056 -_
■* IL
iaith i . jJLi,
d_^UML^taLL
idi^ ■,..,.j i I ..ui^ I liL ,.- I I ,i
" '—" . .i.. ■A.^.ki.t^tAMili. J
yi|jg^|j|iii|^gLf
>M*iM^lkAliU«i ' ■ '■ I- ^-^"-t 'J—J u. .031 J
.018 = .^....^,.. tii..ii.ii.iLJi..j.. ,X.^
.010 E
^kMtJj^^Miila J.L .1 . .1^ L-
l^aJM^MOl lil II IIMIIitMM—MillMI*^
-L..J.^X ^-.1.. . l.,ii.jk.li.. L. , . ..il J„I.Ji>..J..,.ill.^ ^^ ,. ..A.^k.,
SCET 1900 R(Ru) 4.80 Xm 14.'° •m
1920 5.22 12.7°
1940 5.71 12.4°
o >
LJ O
o o
CO
Figure 8
s