Embed Size (px)
Citation preview

The influence of the crack tip plastic zone
strain hardening on the metal High Cycle
Fatigue behavior
D.G. Pavlou
Hellenic Airforce Academy, 16501 Dekelia, Attiki,
Greece.
Abstract
A damage tolerance analysis methodology for cracks subjected to real loading ispresented. A new retardation model, based on material hardening within theoverload plastic zone, is developed for irregular stress histories. For thetransformation of the irregular stress history into a stress history containing onlydistinguished cycles, a technique based on the Rainflow counting method is used.The methodology is applied to real aircraft loading histories for the conventional2024-T3 aluminum and the advanced 8090-T8 aluminum-lithium alloy.Predictions are in encouraging agreement with the experimental results.Limitations of the prediction method are also discussed.
1 Introduction
Aerospace structures are operating under highly variable fatigueconditions. Up to present, fatigue analysis of aerospace structures is
mostly based on test results ; Blom. *To support fatigue crack growth analysis by crack growth models is
not a small task. Real loading histories are consisted of distinguished loadpeaks with high or small stress values. On the other hand, fatigue crackpropagation is a path dependent process, strongly influenced by load
Transactions on the Built Environment vol 32, © 1998 WIT Press, www.witpress.com, ISSN 1743-3509
634 Structures Under Shock and Impact
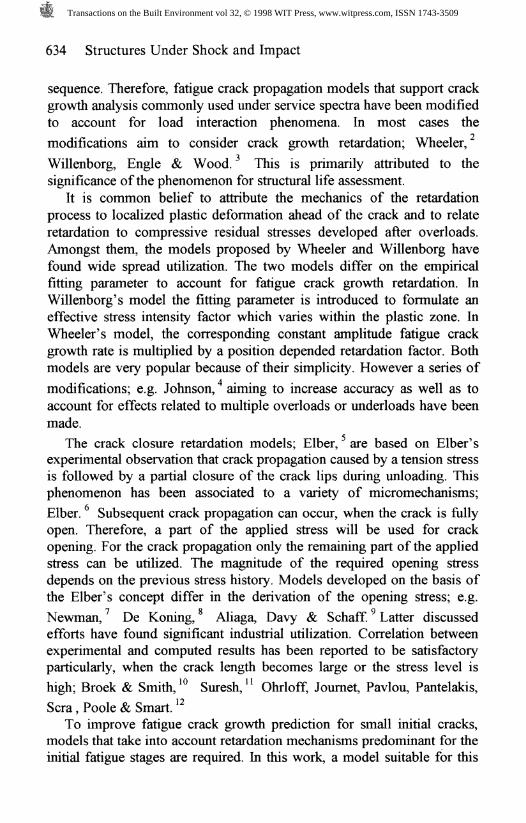
sequence. Therefore, fatigue crack propagation models that support crackgrowth analysis commonly used under service spectra have been modifiedto account for load interaction phenomena. In most cases the
modifications aim to consider crack growth retardation; Wheeler,
Willenborg, Engle & Wood. This is primarily attributed to thesignificance of the phenomenon for structural life assessment.
It is common belief to attribute the mechanics of the retardationprocess to localized plastic deformation ahead of the crack and to relateretardation to compressive residual stresses developed after overloads.Amongst them, the models proposed by Wheeler and Willenborg havefound wide spread utilization. The two models differ on the empiricalfitting parameter to account for fatigue crack growth retardation. InWillenborg's model the fitting parameter is introduced to formulate aneffective stress intensity factor which varies within the plastic zone. InWheeler's model, the corresponding constant amplitude fatigue crackgrowth rate is multiplied by a position depended retardation factor. Bothmodels are very popular because of their simplicity. However a series of
modifications; e.g. Johnson, * aiming to increase accuracy as well as toaccount for effects related to multiple overloads or underloads have beenmade.
The crack closure retardation models; Elber, are based on Fiber'sexperimental observation that crack propagation caused by a tension stressis followed by a partial closure of the crack lips during unloading. Thisphenomenon has been associated to a variety of micromechanisms;
Elber. Subsequent crack propagation can occur, when the crack is fullyopen. Therefore, a part of the applied stress will be used for crackopening. For the crack propagation only the remaining part of the appliedstress can be utilized. The magnitude of the required opening stressdepends on the previous stress history. Models developed on the basis ofthe Elber's concept differ in the derivation of the opening stress; e.g.
Newman, De Koning, * Aliaga, Davy & Schaff Latter discussedefforts have found significant industrial utilization. Correlation betweenexperimental and computed results has been reported to be satisfactoryparticularly, when the crack length becomes large or the stress level is
high; Broek & Smith, ™ Suresh, Ohrloff, Journet, Pavlou, Pantelakis,
Sera, Poole & Smart. To improve fatigue crack growth prediction for small initial cracks,
models that take into account retardation mechanisms predominant for theinitial fatigue stages are required. In this work, a model suitable for this
Transactions on the Built Environment vol 32, © 1998 WIT Press, www.witpress.com, ISSN 1743-3509

Structures Under Shock and Impact 635
case, recently presented; Pavlou and Pantelakis, Kermanidis & Pavlou is applied. The model takes into account the influence of the yield stresschanging within the overload plastic zone on the fatigue crack growthrate. The latter model is limited to cyclic loading with variable amplitude;
Pantelakis, Kermanidis & Pavlou. In this work an extension of the saidmodel for random loading conditions is attempted. For this reason, theirregular stress history is transformed into a history of full distinguishedcycles. For the derivation of the distinguished cycles the application of the
Rainflow counting technique; Richards, La Pointe & Wetzel, Matsuishi
& Endo is proposed. However the rainflow counting technique has twodisadvantages; a) It neglects the sequence effect of the derived loadingcycles, and b) when applied to long spectra it increases the computingcost. To overcome the shortcomings, a linear approximation technique isproposed.
2 Fatigue Crack Growth Prediction
Methodology
2.1 Linear approximation technique
For a given load spectrum the proposed linear approximation techniqueproceeds by considering load steps (Fig. 1). For every
Figure 1: Discretized irregular stress history
load step the rainflow method is applied separately. Because of the load-interaction effects on the crack growth behavior, the sequence of the loadcycles within the load step is very important. Hence, the cycles derived bythe rainflow method are ordered based on the same order of the peaks asin the original load trace (Fig.2). Using the latter criterion, the consistencybetween the sequence of the plastic zones of the irregular history and the
Transactions on the Built Environment vol 32, © 1998 WIT Press, www.witpress.com, ISSN 1743-3509

636 Structures Under Shock and Impact
sequence of the plastic zones of the derived cycles is satisfied. The loadcycles resulting from this
A
Figure 2: Classification of the distinguished cycles
counting procedure will, thus, form the load spectrum to be used in crackgrowth analysis.
2.2 Load Interaction Model
In the vicinity of the crack tip the fatigue damage accumulated within eachmaterial element is mainly consequence of plastic deformation. Thereforecan be assumed that the material elements in the overload plastic zone aresubjected to LCF conditions. Figure 3 provides a schematic of theproposed stripplastic zone model. The length of the overload plastic zone
is symbolized by r while a is the crack length after an overload. The
value of the yield stress S is variable for the points along the overload
plastic zone because of the different hardening degree. For these points a
linear distribution of the value S is assumed. The yield stress of the
material ahead of the overload crack tip is assumed to be
c* — /?c (\ \by — poy (i;
where S is the cyclic ultimate stress, and {3 a parameter lying between
S^ISf and 1. The yield stress at the elastic-plastic boundary is
considered to be equal to the cyclic yield stress S of the material. The
current crack length within the plastic region is a. Distinguished from
Transactions on the Built Environment vol 32, © 1998 WIT Press, www.witpress.com, ISSN 1743-3509

Structures Under Shock and Impact 637
fa is the plastic zone size co, created by a fatigue load cycle following
an overload. This zone it is very small
Ac,,
Figure 3: Schematic representation of the retardation model
compared to fa such that w, can be taken approximately to be the size
of a material element. Each element is subjected to a constant average
strain amplitude A£ that approximates the strain amplitude distribution
in a>s. Failure is assumed after a certain number of cycles AN. Low cycle
fatigue crack growth is assumed such that the relation
da co, (2)
applies, where the length of the plastic zone #, can be estimated as
Transactions on the Built Environment vol 32, © 1998 WIT Press, www.witpress.com, ISSN 1743-3509

638 Structures Under Shock and Impact
AK V
The number of cycles up to failure AN can be determined by the Coffin-
Manson's rule ; Manson, Coffin & Tavernelli: **
= 2s f (4)
According to the works; Pavlou and Pantelakis, Kermanidis & Pavlou
the value Af can be evaluated as :
An estimate of AN can thus be made
AN-V2K,;
21 m
AK
With aid of eqns. (3) and (6), eqn.(2) becomes:
da
(6)
dN 322K^ S]
Low cycle fatigue tests; Fuchs & Stephens, have shown that m is notsensitive to material type ; it can be taken to be 0,5.
2.3 Retardation Factor
Let X be defined as a retardation factor given by :
Transactions on the Built Environment vol 32, © 1998 WIT Press, www.witpress.com, ISSN 1743-3509

Structures Under Shock and Impact 639
The retarded crack growth rate (da I dN) corresponds to the situation
in fig. 4(a) where the crack growth takes place in the overload plastic
zone. The nominal crack growth rate (da I
Figure 4: Crack growth under cyclic loading : (a) overload andb) without overload.
corresponds to fig. 4(b) in which the crack growth occurs in the absenceof any overloads. In view of eqn.(7) the retardation factor take the form :
(9)
Recall that S and Sy are respectively the cyclic yield stress without
and with overload plasticity effect (fig.3). It is the relationship between
Sy and Syo that determines the change in material response due to
overload. Invoked is a linearly varying function for Sy :
a / 2) - aOL(10)
'OL
Once 1 is calculated by the eqns (9),( 10) the retarded crack growth ratecan be determined by eqn.(8):
Transactions on the Built Environment vol 32, © 1998 WIT Press, www.witpress.com, ISSN 1743-3509

640 Structures Under Shock and Impact
da __ .~
da(11)
where the nominal fatigue crack growth rate (da/dtf) can be
derived as usual by constant amplitude loading tests. Application of themodel to constant amplitude loading containing single overload has
resulted in satisfactory predictions (e.g. Figs 5(a),(b)).
<DK
O ExperimentPavlou's model [13, 14]
0.2 0.4 0.6 0.8
Normalized crack length (a-cto) / roi_
co+3
1.5
to
0.5
AI-6061-T6KoL/Kmax"2R=0.05
O ExperimentPavlou's model [13,14]
0.4 0.8
Crack length a (mm)
1.2
Figure 5: Retardation factor versus crack length for A1-2024-T3
a) Knr I K^ = 1.5 and R=0, b) K^ I K^ = 2.0 and R=0.05
Transactions on the Built Environment vol 32, © 1998 WIT Press, www.witpress.com, ISSN 1743-3509
Structures Under Shock and Impact 641
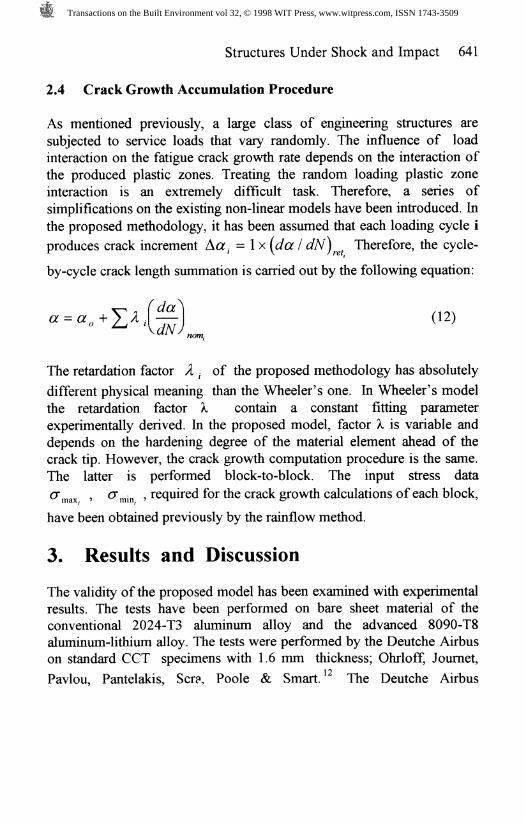
2.4 Crack Growth Accumulation Procedure
As mentioned previously, a large class of engineering structures aresubjected to service loads that vary randomly. The influence of loadinteraction on the fatigue crack growth rate depends on the interaction ofthe produced plastic zones. Treating the random loading plastic zoneinteraction is an extremely difficult task. Therefore, a series ofsimplifications on the existing non-linear models have been introduced. In
the proposed methodology, it has been assumed that each loading cycle i
produces crack increment Aa, = 1 x (da / dN) Therefore, the cycle-
by-cycle crack length summation is carried out by the following equation:
The retardation factor /I . of the proposed methodology has absolutely
different physical meaning than the Wheeler's one. In Wheeler's modelthe retardation factor 1 contain a constant fitting parameterexperimentally derived. In the proposed model, factor 1 is variable anddepends on the hardening degree of the material element ahead of thecrack tip. However, the crack growth computation procedure is the same.The latter is performed block-to-block. The input stress data
O" , er • , required for the crack growth calculations of each block,maXy ' rniiij •* *-'
have been obtained previously by the rainflow method.
3. Results and Discussion
The validity of the proposed model has been examined with experimentalresults. The tests have been performed on bare sheet material of theconventional 2024-T3 aluminum alloy and the advanced 8090-T8aluminum-lithium alloy. The tests were performed by the Deutche Airbuson standard CCT specimens with 1.6 mm thickness; Ohrloff, Journet,
Pavlou, Pantelakis, Sera, Poole & Smart. The Deutche Airbus
Transactions on the Built Environment vol 32, © 1998 WIT Press, www.witpress.com, ISSN 1743-3509

642 Structures Under Shock and Impact
standardized load sequence for the upper fuselage shell (reference 12) ofthe aircraft A-300 was used for the tests.
The cyclic properties for evaluating eqns. (4-6) are given in Table 1,and the data were taken from the references 12,13,14,19. To calculate
A1-2024-T3
A1-8090-T8
8, (MPa)
1100
423
S (MPa)
427
302
Table 1. Cyclic properties of the used alloys
the cyclic yield stress S * = ft. Sj> of the material element at crack tip,
the approximation p=l was used. For aluminum alloys such as Al-2024-T3 and A1-6061-T6 the validity of the latter simplification has been
checked ; Pavlou and Pantelakis, Kermanidis & Pavlou. The nominal fatigue crack growth rate was calculated by the Paris rule:
03)
where the parameters n and C has been fitted to n=4.305-1.316 R andO-2.503 E-15 + 4.365 E-13 R for the A1-2024-T3 alloy and, n-3.837-1.184 R, C=-1.08 E-14 + 1.489 E-12 R for the A1-8090-T8. Theabove data were obtained by CAL fatigue tests performed by DRA;
Ohrloff, Journet, Pavlou, Pantelakis, Sera , Poole & Smart. Using thedescribed damage accumulation procedure, a computer program wasformulated. This program was used to predict crack propagation underrandom loading conditions on the mentioned aluminum alloys. Both theaccuracy of the calculations and the required computing time depend onthe choice of the loading steps (Fig.l). The number of reversals assumedto build one step should be a compromise between the gain on computingtime and the loss on accuracy. In the present work, for simplicity it isassumed that the number of peaks in each block is n=60. By executingthis program, the prediction of the crack length versus the number offlights was carried out for the A1-2024-T3 and A1-8090-T8 alloys. Latterpredictions are compared with the experimental results in Fig.6a,b.
Transactions on the Built Environment vol 32, © 1998 WIT Press, www.witpress.com, ISSN 1743-3509

Structures Under Shock and Impact 643
E
D£Z0)_g
•82O
JU
25-
20-
15-
10-
5-
c
AI-20;o '/
///
o //
Jo /0 /'
- """ Propnspd n~KI ^** Willenboro'sr~~ O Experimental
i I i t i i i i40 60' '150 170 190 210 230 250
! 1 I ! I I ! 1 ! I0 20 40 60 80 100 120 140 160 180 200 220
24-T3
)delmodelresults
1240 26
Number of flights (x 1000)
Figure 6. a) Theoretical and experimental results for the alloyA1-2024-T3 under real aircraft loading conditions
30
_0>JX.o
25-
20-
10 -
0 -
AI-8090-T8
Proposed modelWillenborg's model
O Experimental results
o-o-'64 80 96 180 196 212 228
T T0 16 32 48 64 80 96 112 128 144 160 176
Number of flights (x 1000)
Figure 6. b) Theoretical and experimental results for the alloyA1-8090-T8 under real aircraft loading conditions
Transactions on the Built Environment vol 32, © 1998 WIT Press, www.witpress.com, ISSN 1743-3509

644 Structures Under Shock and Impact
For the alloys A1-2024-T3 and A1-8090-T8 the predictions were veryencouraging, only within the areas a=2-7 mm and 2-16 mm, respectively.The predictions of the Willenborg's model are also presented at the samefigures. The calculations using the latter model, however, were startedfrom larger initial crack lengths, i.e. 5.0 mm for the A1-2024-T3 and4.0mm for the A1-8090-T8. The reason of this decision is the following:for small initial crack lengths the Willenborg's model leads to very largeunderestimation of the fatigue crack increment per cycle. Therefore, the3 2-bit computer used for the calculations was unable to treat such crack
increments of the order of 1E-11 mm (i.e. (ZQ+ A#. = a§ when
Aa, < 10" mm ). The calculations, however, were carried out in order
to obtain some conclusions concerning the validity range of the mentionedretardation models.
Figures 6a,b clearly indicate that the proposed methodologyoverestimates significantly the crack growth for larger crack lengths (e.g.>7.0 mm for the 2024-T3 and >16.0 mm for the 8090-T8)significantly. A possible reason of the above result is the following: forlarger crack lengths, more predominant retardation mechanisms than themechanism of the material's hardening take place. These mechanisms arerelated with the development of compressive self-stresses around theoverload plastic zones. Fig.6a,b shows that the results of the Willenborg'smodel are in good agreement with the experimental results only for largecrack lengths.
The results lead to the following conclusions :a) Models based only on one retardation mechanism are not able to
provide reliable fatigue crack growth prediction for the total fatigue lifeperiod.
b) All the known load interaction models take into account onesingle mechanism. Therefore, the models are able to accurately predictthe fatigue crack growth only within the area where this mechanism ispredominant.
c) Improvement of fatigue crack growth prediction for long fatiguelife periods requires the development of hybridic models that take intoaccount larger number of mechanisms. The basic problem that needsfurther investigation is the definition of the predominant load-interactionmechanisms for every fatigue stage.
Transactions on the Built Environment vol 32, © 1998 WIT Press, www.witpress.com, ISSN 1743-3509

Structures Under Shock and Impact 645
4 Conclusions
a) A transformation technique of the irregular stress history to aregular one was used. The technique is based on a modification of therainflow counting method. The advantage of the modified technique is thesuitability to use non-linear damage accumulation models and long stress
histories.b) A new retardation model was applied to the transformed irregular
real spectra. The model is based on the plastic zone strain hardeningfatigue mechanism that takes place during all the fatigue life stages.However for the investigated alloys 2024-T3 and 8090-T8 themechanism seems to be predominant in the early fatigue crackpropagation stages. In respect of these alloys and stress histories, themodel led to extremely encouraging predictions for the initial crackpropagation stages.
c) To improve the fatigue crack growth predictions, it is necessary toinvestigate the boundaries where every load-interaction mechanism ispredominant as well as to develop load interaction models that take intoaccount more load-interaction mechanisms.
5 Acknowledgments
The present research work was carried out at the Hellenic MilitaryAirforce Research Center. It is a continuation of previous work carried outin cooperation with Aerospatiale, Deutsche Airbus, Dassault Aviation,British Aerospace, Defence Research Agency and NLR, in theframework of the Brite/Euram BE-3250 project, supported by theEuropean Union.
References
[1] Blom A.F., Fatigue and damade tolerance verification ofaircraft structures, Proc. of the 4th Int. Conf. On Fatigue and FatigueThresholds, Honolulu Hawaii, Vol. I, pp. 13-22,1990.
[2] Wheeler O.E., Spectrum loading and crack growth, J.Basic Engng.94, pp. 181-186, 1972.
[3] Willenborg J., Engle R.M., Wood R.A., A crack growth retardationmodel using an effective stress concept, AFFDL-TM-71-1 -FBR. 1971.
Transactions on the Built Environment vol 32, © 1998 WIT Press, www.witpress.com, ISSN 1743-3509

646 Structures Under Shock and Impact
[4] Johnson W.S., Multi-Parameter-Yield-Zone model forpredicting spectrum crack growth, ASTM STP 748, pp. 85-102,
1981.
[5] Elber W., The significance of fatigue crack closure, ASTM STP486, pp. 230-242, 1971.
[6] Elber W., Fatigue crack closure under cyclic tension, Eng.FractureMechanics, Vol. 2, pp.37-45, 1970.
[7] Newman J.C., A crack closure model for predicting fatigue crackgrowth under aircraft spectrum loading, ASTM STP 748,pp. 53-84,
1981.
[8] De Koning A.U., A simple crack closure model for predictionof fatigue crack growth rates under variable amplitude loading,ASTM STP 743, pp. 63-85, 1981.
[9] Aliaga D., Davy A., Schaff H., A simple crack closure model forpredicting fatigue crack growth under flight simulation loading, ASTMSTP 982, pp. 491-504, 1988.
[10]Broek D., Smith Sh., The prediction of fatigue crack growth underflight-by-flight loading, Engng. Fract. Mech., Vol. 11, pp. 123-141,1979.
[1 IJSuresh S., Micromechanisms of fatigue crack growthretardation following overloads, Eng. Fract. Mechanics, Vol. 18,No. 3, pp. 577-593, 1983.
[12]Ohrloff N., Journet B., Pavlou D., Pantelakis S., Sera L., Poole D.,Smart J., Investigation on Al-Li alloys for damage tolerantapplications, Brite/Euram BE-3250 project, Task 4 (FlightSimulation), Final Report DCR/M-60365/F-93, Suresnes, France,1993.
[13]Pavlou D., Fatigue crack growth prediction under irregular stresshistories, Ph.D. Thesis, University of Patras, Patras,1994.
Transactions on the Built Environment vol 32, © 1998 WIT Press, www.witpress.com, ISSN 1743-3509

Structures Under Shock and Impact 647
[14]Pantelakis S., Kermanidis Th., Pavlou D., Fatigue crack growthretardation assessment of 2024-T3 and 6061-T6 aluminum specimens,Theor. and Appl. Fract. Mech., Vol. 22, pp.35-42, 1995.
[15]Richards F., La Pointe N., Wetzel R., A cycle countingalgorithm for fatigue damage analysis, paper No.740278, AutomotiveEngineering Congress, Detroit, Michigan, Feb. 1974.
[16]Matsuishi M., Endo T., Fatigue of metals subjected to varyingstress, Japan Society of Mechanical Engineers, Fukuoka Japan,1968.
[17]Manson S.S., Fatigue: A complex subject-Some simpleapproximations, Exp. Mech. 5,193-202 (1965).
[18]Coffin L.F., Tavernelli J.F., Experimental support for generalizedequation predicted low cycle fatigue, Transaction ASME, J.BasicEngng. 84, 533-542 (1962).
[19]Fuchs H.O., Stephens R.I., Metal fatigue in engineering,J. Wiley &Sons, 1980.
Transactions on the Built Environment vol 32, © 1998 WIT Press, www.witpress.com, ISSN 1743-3509