Embed Size (px)
Citation preview
ICES Special Request Advice Baltic Sea Ecoregion Published 25 August 2015 Version 2, 14 January 2016
ICES Advice 2015, Book 1 1
8.2.3.2 HELCOM request on pressure from fishing activity (based on VMS/logbook data) in the HELCOM area relating to both seafloor integrity and management of HELCOM MPAs
Advice summary ICES has collated Vessel Monitoring System (VMS) and logbook data received; data from Russia were not received. ICES provides fishing abrasion pressure maps as well as fishing effort maps (and the underlying data) for 2009–2013 and every quarter of 2013, based on VMS data, but advises that assumptions have been made in developing these maps and emphasizes that the caveats must be taken into account when interpreting the maps and the data. Based on the above, fishing effort and fishing abrasion pressure have been summarized within the 174 HELCOM marine protected areas (MPAs). ICES has estimated the representativeness of the VMS-based fishing effort maps. Using the most recent data (2013) for vessels over 8 m (overall length), over 80% of activity by mobile bottom-contact gears was captured by the maps. Equivalent figures were over 80% of activity by midwater trawls and less than 25% by longlines. Data from vessels under 8 m (8% mobile bottom-contact gear, 2% midwater trawls, and 52% of longlines of each fleet, but not necessarily activity) are not represented in these calculations. Request a) Produce maps and shape-files of fishing intensity for the HELCOM area based on a 0.05 x 0.05 c-square degree grid. The maps should consist of a set of the polygonal feature classes and be submitted in the ESRI shape file format. Polygons should indicate the areas with equal fishing intensity measured in hours per year or per season being classified in the way harmonized with similar maps produced for the OSPAR region when applicable. b) The maps and shape files of fishing intensity should be calculated for bottom contact gear and mid-water trawl and longline for every year in the period from 2009 to 2013 and for each quarter of 2013. In particular the following maps should be produced:
i) intensity of fishing by each fishing activity for each year in the period from 2009 to 2013; ii) total intensity for each year in the period from 2009 to 2013; iii) total intensity and by each fishing activity by quarter in 2013.
c) Where available and possible, provide information on fishing intensity for bottom contact gear and mid-water trawl and longline in the 174 official HELCOM MPAs in whole 2013 and first quarter 2013. The information should be provided in the forms listed in paragraph a) of the current request. Information on overall fishing effort should also be provided. d) Estimate the proportion of total fisheries represented by the data. Elaboration on the advice a) and b) – Maps Following definitions given in ICES advice to OSPAR (ICES, 2014), ICES understanding of “fishing intensity” is clarified in the fishing abrasion pressure maps produced for the advice to OSPAR. Abrasion pressure is not appropriate for midwater trawls and longlines; therefore, maps for all gears have been produced using fishing effort as the number of hours fished, extracted from the submitted VMS data.
Published 25 August 2015 ICES Special Request Advice
2 ICES Advice 2015, Book 1
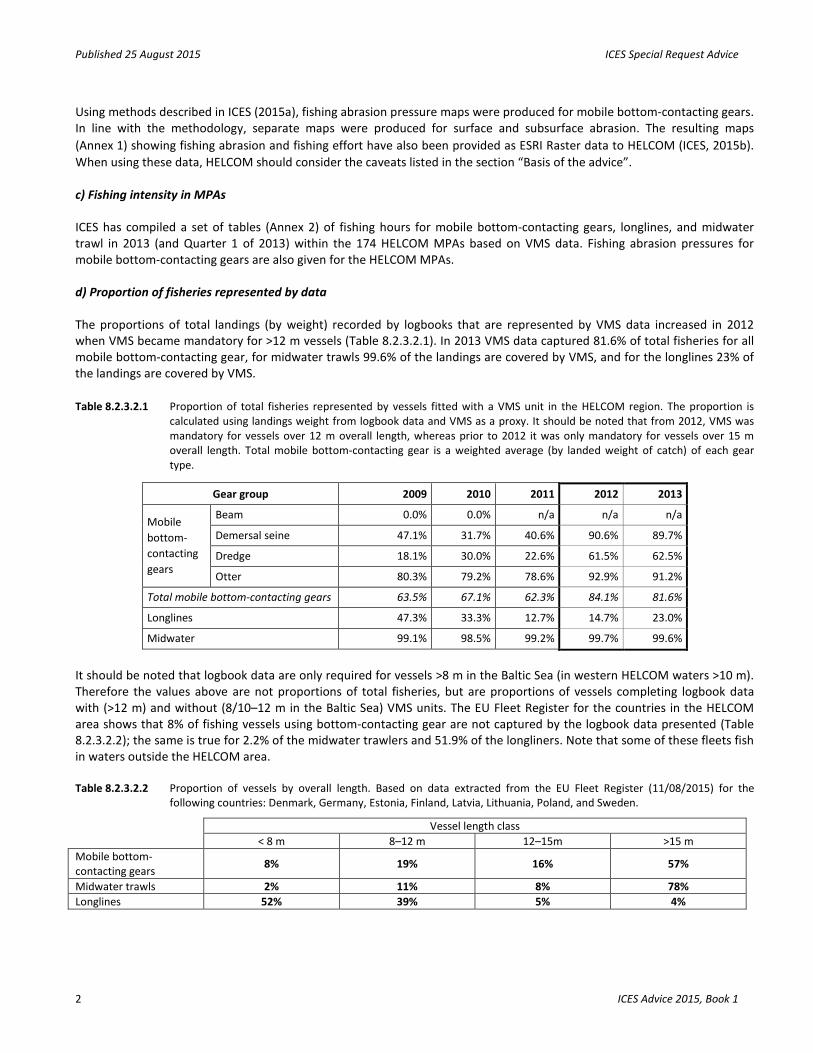
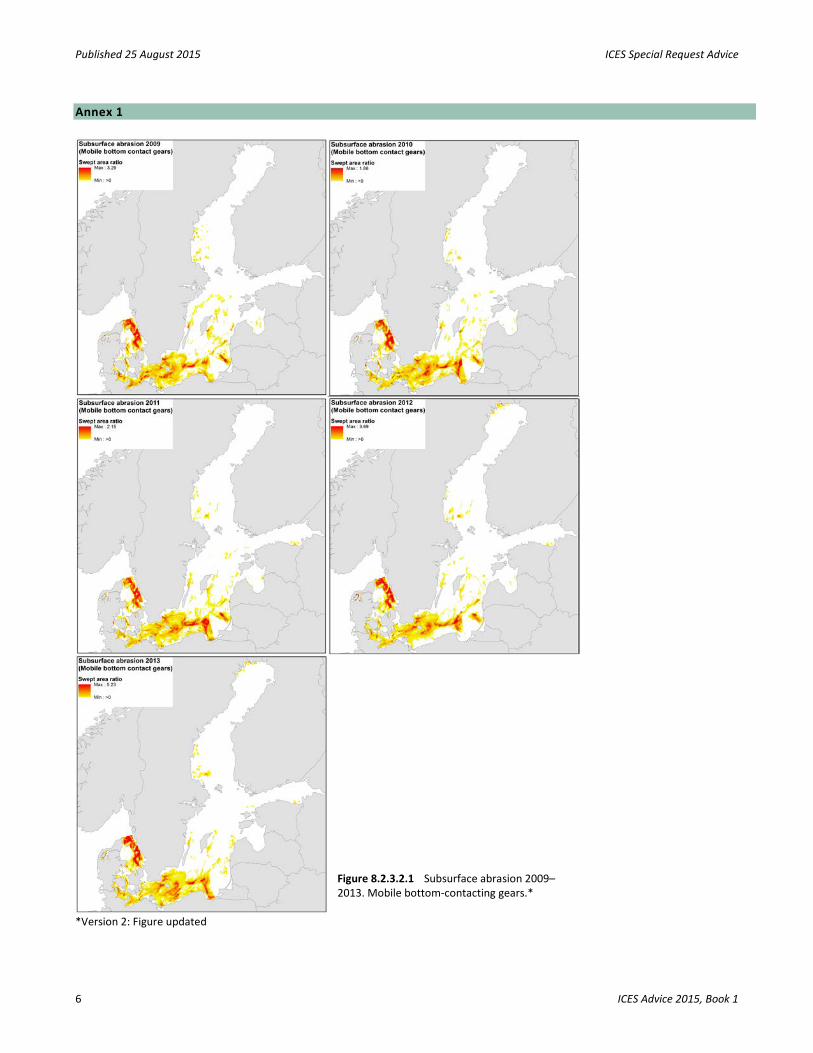
Using methods described in ICES (2015a), fishing abrasion pressure maps were produced for mobile bottom-contacting gears. In line with the methodology, separate maps were produced for surface and subsurface abrasion. The resulting maps (Annex 1) showing fishing abrasion and fishing effort have also been provided as ESRI Raster data to HELCOM (ICES, 2015b). When using these data, HELCOM should consider the caveats listed in the section “Basis of the advice”. c) Fishing intensity in MPAs ICES has compiled a set of tables (Annex 2) of fishing hours for mobile bottom-contacting gears, longlines, and midwater trawl in 2013 (and Quarter 1 of 2013) within the 174 HELCOM MPAs based on VMS data. Fishing abrasion pressures for mobile bottom-contacting gears are also given for the HELCOM MPAs. d) Proportion of fisheries represented by data The proportions of total landings (by weight) recorded by logbooks that are represented by VMS data increased in 2012 when VMS became mandatory for >12 m vessels (Table 8.2.3.2.1). In 2013 VMS data captured 81.6% of total fisheries for all mobile bottom-contacting gear, for midwater trawls 99.6% of the landings are covered by VMS, and for the longlines 23% of the landings are covered by VMS. Table 8.2.3.2.1 Proportion of total fisheries represented by vessels fitted with a VMS unit in the HELCOM region. The proportion is
calculated using landings weight from logbook data and VMS as a proxy. It should be noted that from 2012, VMS was mandatory for vessels over 12 m overall length, whereas prior to 2012 it was only mandatory for vessels over 15 m overall length. Total mobile bottom-contacting gear is a weighted average (by landed weight of catch) of each gear type.
It should be noted that logbook data are only required for vessels >8 m in the Baltic Sea (in western HELCOM waters >10 m). Therefore the values above are not proportions of total fisheries, but are proportions of vessels completing logbook data with (>12 m) and without (8/10–12 m in the Baltic Sea) VMS units. The EU Fleet Register for the countries in the HELCOM area shows that 8% of fishing vessels using bottom-contacting gear are not captured by the logbook data presented (Table 8.2.3.2.2); the same is true for 2.2% of the midwater trawlers and 51.9% of the longliners. Note that some of these fleets fish in waters outside the HELCOM area. Table 8.2.3.2.2 Proportion of vessels by overall length. Based on data extracted from the EU Fleet Register (11/08/2015) for the
following countries: Denmark, Germany, Estonia, Finland, Latvia, Lithuania, Poland, and Sweden.
Vessel length class
< 8 m 8–12 m 12–15m >15 m Mobile bottom-contacting gears 8% 19% 16% 57%
Midwater trawls 2% 11% 8% 78% Longlines 52% 39% 5% 4%
Gear group 2009 2010 2011 2012 2013
Mobile bottom-contacting gears
Beam 0.0% 0.0% n/a n/a n/a
Demersal seine 47.1% 31.7% 40.6% 90.6% 89.7%
Dredge 18.1% 30.0% 22.6% 61.5% 62.5%
Otter 80.3% 79.2% 78.6% 92.9% 91.2%
Total mobile bottom-contacting gears 63.5% 67.1% 62.3% 84.1% 81.6%
Longlines 47.3% 33.3% 12.7% 14.7% 23.0%
Midwater 99.1% 98.5% 99.2% 99.7% 99.6%
ICES Special Request Advice Published 25 August 2015
ICES Advice 2015, Book 1 3
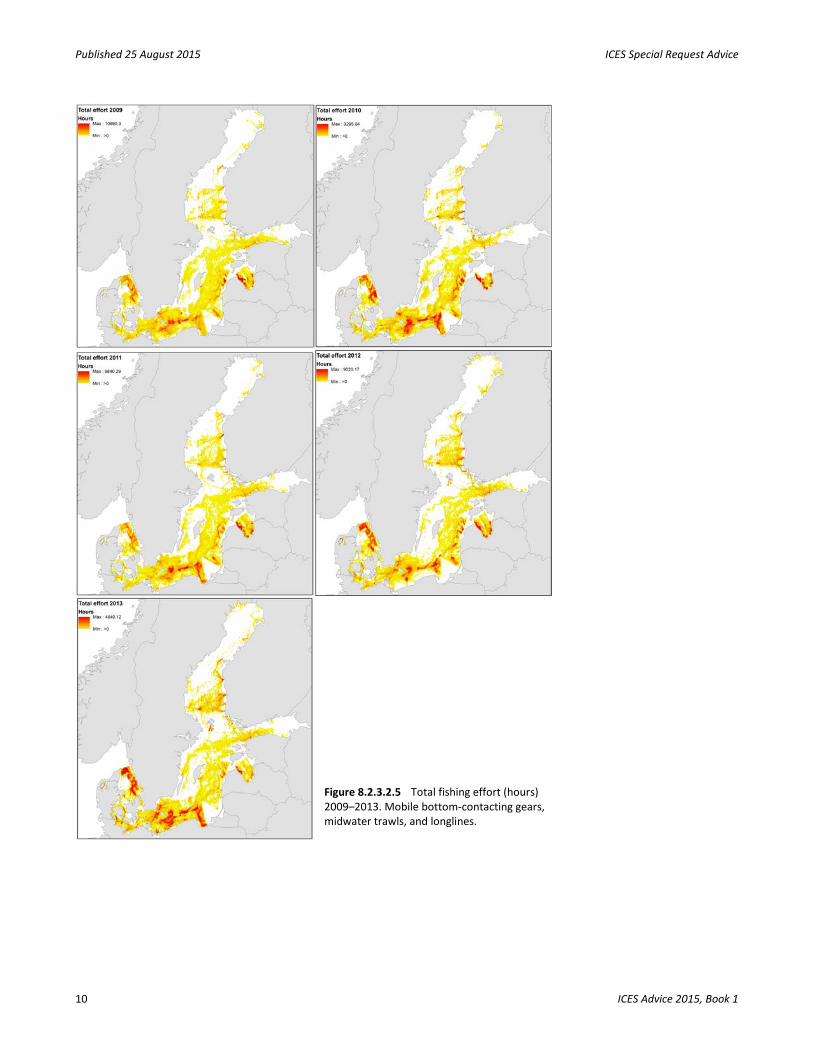
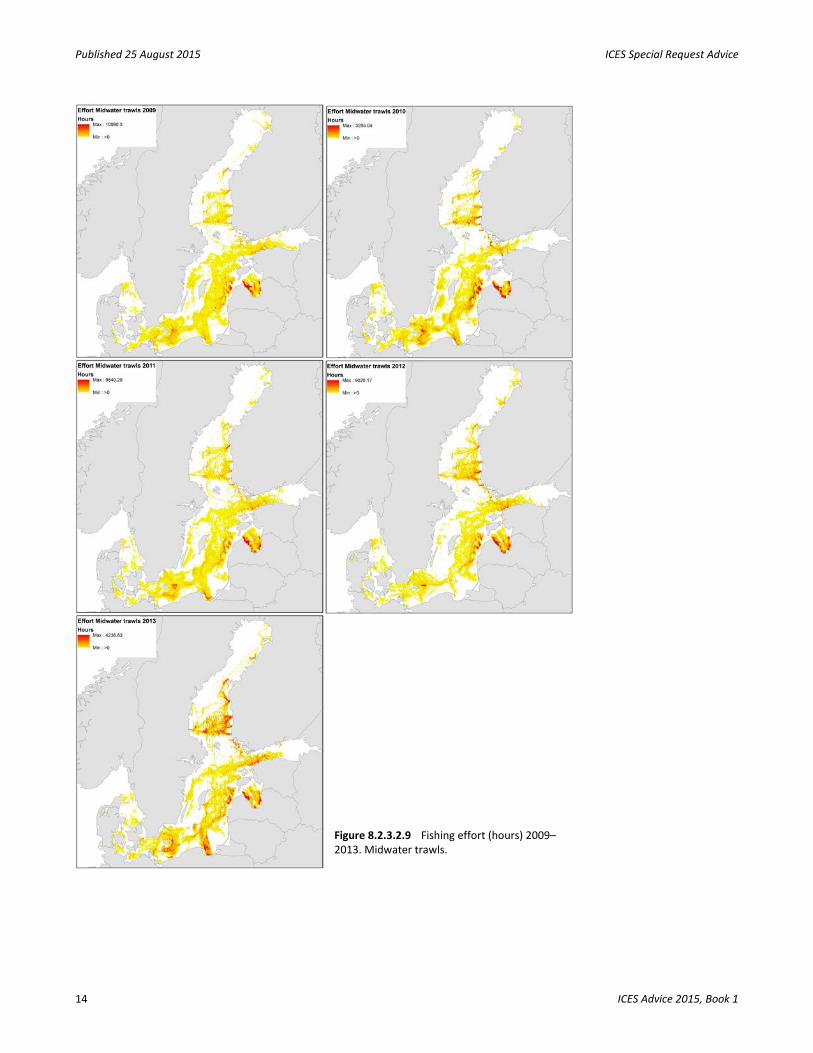
The activity of the < 8–10 m vessels will mainly occur close to the coast. It is unlikely that fishing abrasion pressure or fishing effort further off the coast will be affected. The proportion of < 8–10 m vessels varies between countries in the HELCOM area and the proportion of time spent fishing varies also, both by country and by vessel length. The size of nets, and therefore the towed area is related also to vessel size – smaller vessels generally tow smaller nets. Suggestions The objective of the mapping is to show areas where fishing occurs. This requires the application of speed filters to remove areas where vessels are either stationary (e.g. in port) or in transit and not fishing. In some figures (e.g. Figure 8.2.3.2.5) it can be seen that there have been some problems in setting the correct speed filter for midwater trawls. Fishing effort can be seen to diminish away from harbours, meaning that steaming has been incorrectly classified as fishing effort. The speed filters should ideally be set by each country prior to submission in c-square format. All countries fishing in the HELCOM waters should submit data; without complete submissions it is not possible for ICES or for HELCOM to gain a full picture of fishing effort and fishing pressure. ICES notes that efforts to map the fishing effort of vessels < 12 m in length is challenging. Two approaches could be tested in the future: i) logbook data by ICES rectangle for vessels between 8 and 10–12 m in length could be mapped (not possible this year for resource reasons); ii) if future data calls were expanded to include data from the register of buyers and sellers (including sales landing notes for vessels < 8–10 m) then mapping of home/landing ports of these vessels would give an indication of the main areas in which these vessels are fishing. Note that this would not lead to improved fishing abrasion maps. Basis of the advice Background HELCOM is developing indicators relating to seafloor integrity and is also interested in the management of HELCOM MPAs. Results and conclusions a) and b) – Maps The requested maps (Annex 1) and electronic files have been produced. Measures of fishing abrasion pressure are only applicable to mobile bottom-contacting gears. For mobile bottom-contacting gears, midwater trawls, and longlines fishing intensity has been mapped as hours fished for the years 2009–2013 as well as by quarter in 2013. c) Fishing intensity in MPAs Results of fishing intensity per MPA can be found in Annex 2. d) Proportion of fisheries represented by data The proportion of total fisheries represented by VMS for the HELCOM region have been estimated (Table 8.2.3.2.1).
Published 25 August 2015 ICES Special Request Advice
4 ICES Advice 2015, Book 1
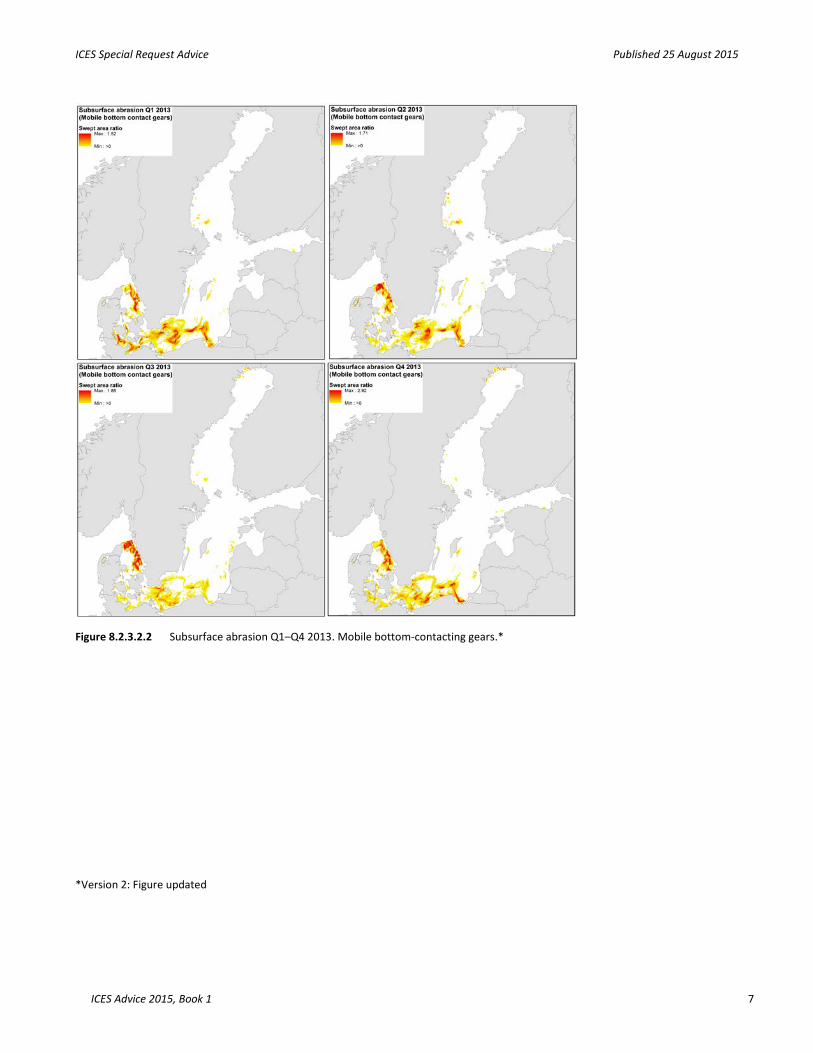
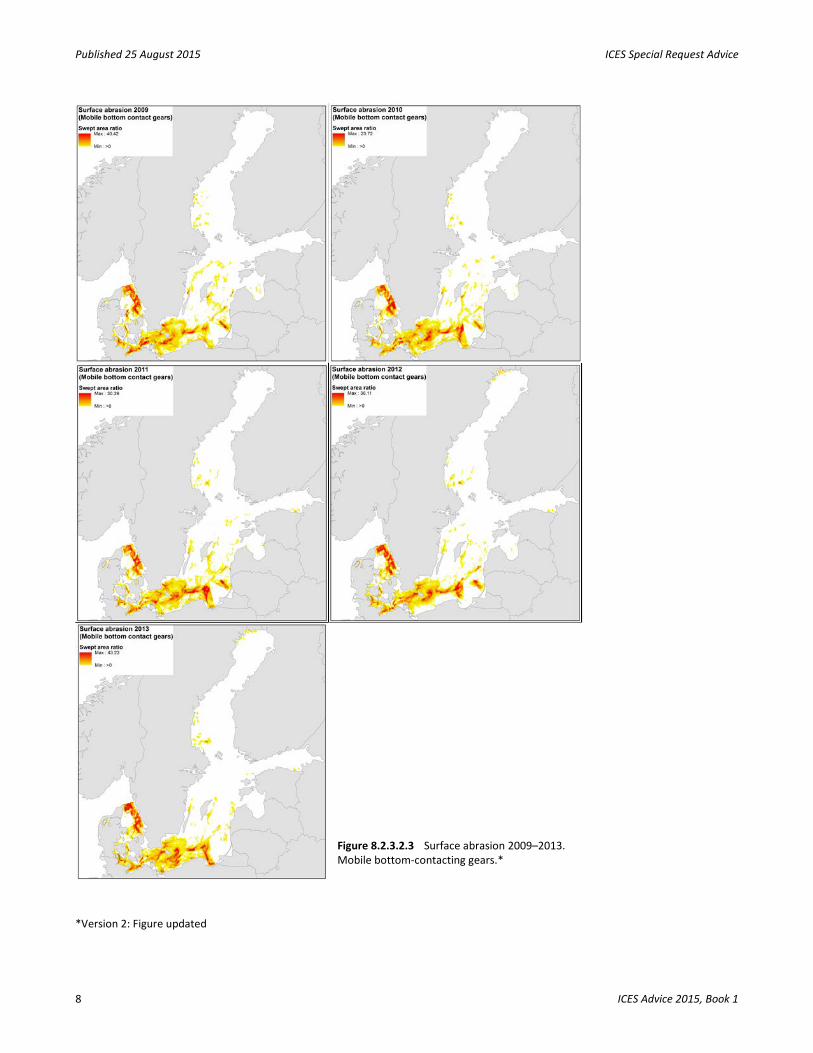
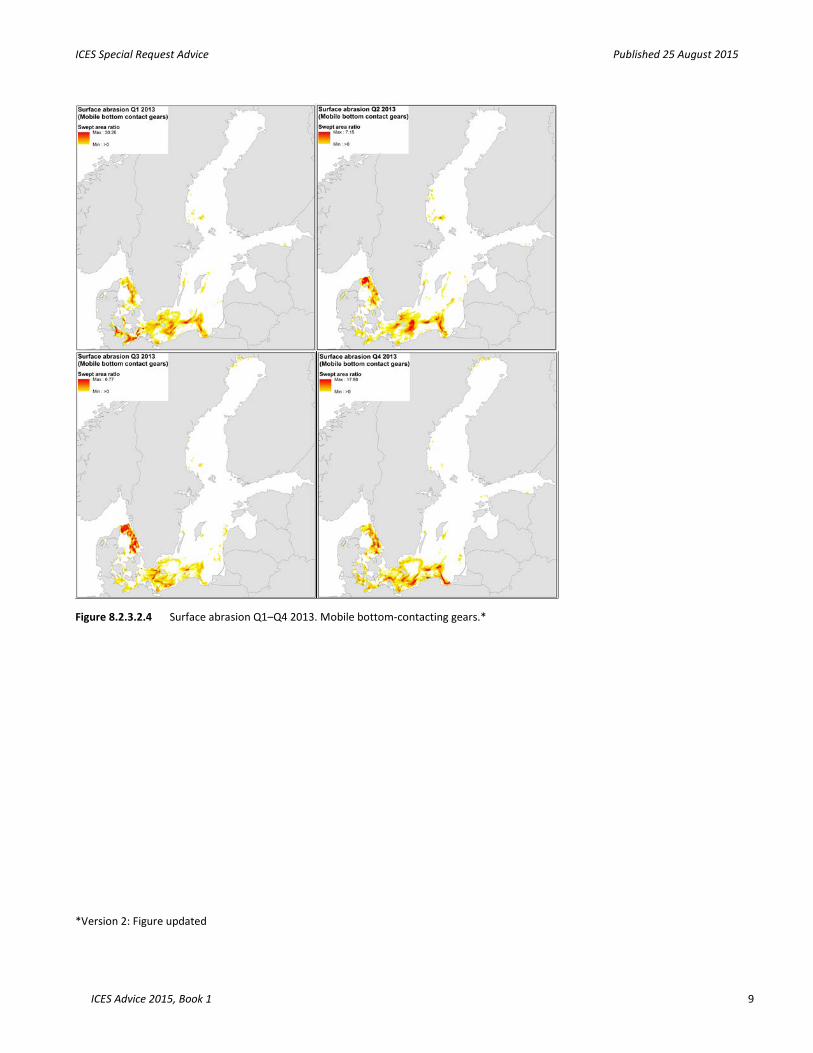
Methods a) and b) – Maps ‘Swept area’ is generally considered to be an estimate of the area of seabed in contact with the fishing gear and is a function of gear width, vessel speed, and fishing effort. The gears considered as mobile bottom-contacting are listed in Annex 3. The swept area ratio is calculated as the swept area divided by the cell area, and the values indicate the number of times the entire grid cell area was swept (note that distribution of effort may not be evenly spread). The swept area ratio is calculated for surface and subsurface abrasion separately. Different gear types interact with the seabed in different ways and thus exert different levels of abrasive pressure, both in terms of the area of substrate affected and the penetration depth. Surface abrasion is defined as the damage to seabed surface features, subsurface abrasion as the penetration and/or disturbance of the substrate below the surface of the seabed. Maps showing fishing effort expressed as number of hours per grid cell have been produced for all requested fisheries individually and combined (mobile bottom-contacting gears, midwater trawls, and longlines). Other fisheries in the Baltic Sea such as gillnets and pots have not been covered by this request. The maps have been produced as requested for each year in 2009–2013 and for each quarter in 2013. A number of caveats were identified relevant for the HELCOM request: • The methods for identifying fishing activity from the VMS data varied between countries; therefore there may be some
country-specific biases that ICES cannot evaluate. Additionally, activities other than active towing of gear may have been incorrectly identified as fishing activity. This would have the effect of overestimating the apparent fishing intensity in ports and in areas used for passage.
• The data for 2012 and 2013 is not directly comparable to the data of previous years in the data call (2009–2011) due to the gradual increase in VMS-enabled vessels in the range of 12–15 m. This is likely to be most relevant when examining trends in effort for inshore areas.
• Many countries have substantial fleets of smaller vessels that are not equipped with VMS (< 15 m prior to 2012, < 12 m thereafter); logbook data is at the spatial resolution of ICES rectangles, but where possible, they have been overlaid with the VMS data for the purpose of analysis.
• The fishing abrasion pressure methodology is based on very broad assumptions in terms of the area affected by abrasion. A single speed and gear width was applied across each gear category in most cases, which can lead to both underestimates and overestimates in actual surface and subsurface abrasion.
c) Fishing intensity in MPAs In GIS, the raster data used for mapping activity in the whole Baltic area were overlaid with a shapefile provided by HELCOM with the 174 MPAs. If the centroid of any c-square lies within the MPA polygon, the number of hours for each fishery were added together to provide an approximate estimate of effort for the MPA for that fishery. For swept area ratios (surface and subsurface abrasion), the values for each of the c-squares whose centroid lies within each MPA were averaged. d) Proportion of fisheries represented by data In absence of non-comparable quantitative effort data, this request was partially addressed by assuming that the weight of fish landed was in approximate proportion to fishing effort. The weight of fish landed by vessels >15 m (or after 2012 >12 m) using mobile bottom-contacting gear was compared, using logbook data, to the total weight of fish landings by all vessels with that gear. This assumes that the weight of fish landed is in proportion to effort (and therefore possibly abrasion
ICES Special Request Advice Published 25 August 2015
ICES Advice 2015, Book 1 5
pressure). ICES does not know how valid this assumption is. The proportion of landings by non-VMS and VMS vessels was calculated and presented by gear types per year. Sources and references ICES. 2014. OSPAR request on mapping of bottom fishing intensity using VMS data. In Report of the ICES Advisory Committee, 2014. ICES Advice 2014, Book 1, Section 1.6.6.5. 11 pp.
ICES. 2015a. Second Interim Report of the Working Group on Spatial Fisheries Data (WGSFD), 8–12 June 2015, ICES Headquarters, Copenhagen, Denmark. ICES CM 2015/SSGSUE:05. 150 pp.
ICES. 2015b. Fishing abrasion pressure maps for mobile bottom-contacting gears. Available as ESRI Raster data at: http://ices.dk/sites/pub/Publication%20Reports/Data%20outputs/HELCOM_mapping_fishing_intensity_and_effort_data_outputs_2015.zip.
Published 25 August 2015 ICES Special Request Advice
6 ICES Advice 2015, Book 1
Annex 1
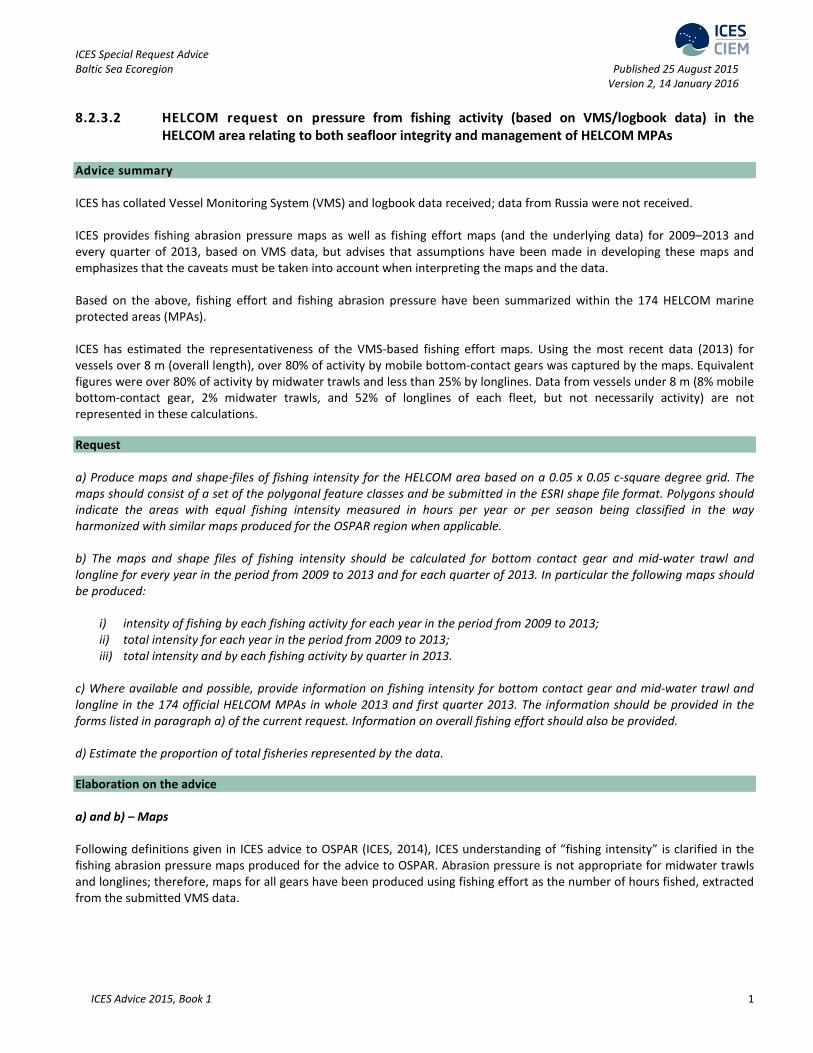
*Version 2: Figure updated
Figure 8.2.3.2.1 Subsurface abrasion 2009–2013. Mobile bottom-contacting gears.*
ICES Special Request Advice Published 25 August 2015
ICES Advice 2015, Book 1 7
Figure 8.2.3.2.2 Subsurface abrasion Q1–Q4 2013. Mobile bottom-contacting gears.*
*Version 2: Figure updated
Published 25 August 2015 ICES Special Request Advice
8 ICES Advice 2015, Book 1
*Version 2: Figure updated
Figure 8.2.3.2.3 Surface abrasion 2009–2013. Mobile bottom-contacting gears.*
ICES Special Request Advice Published 25 August 2015
ICES Advice 2015, Book 1 9
Figure 8.2.3.2.4 Surface abrasion Q1–Q4 2013. Mobile bottom-contacting gears.*
*Version 2: Figure updated
Published 25 August 2015 ICES Special Request Advice
10 ICES Advice 2015, Book 1
Figure 8.2.3.2.5 Total fishing effort (hours) 2009–2013. Mobile bottom-contacting gears, midwater trawls, and longlines.
ICES Special Request Advice Published 25 August 2015
ICES Advice 2015, Book 1 11
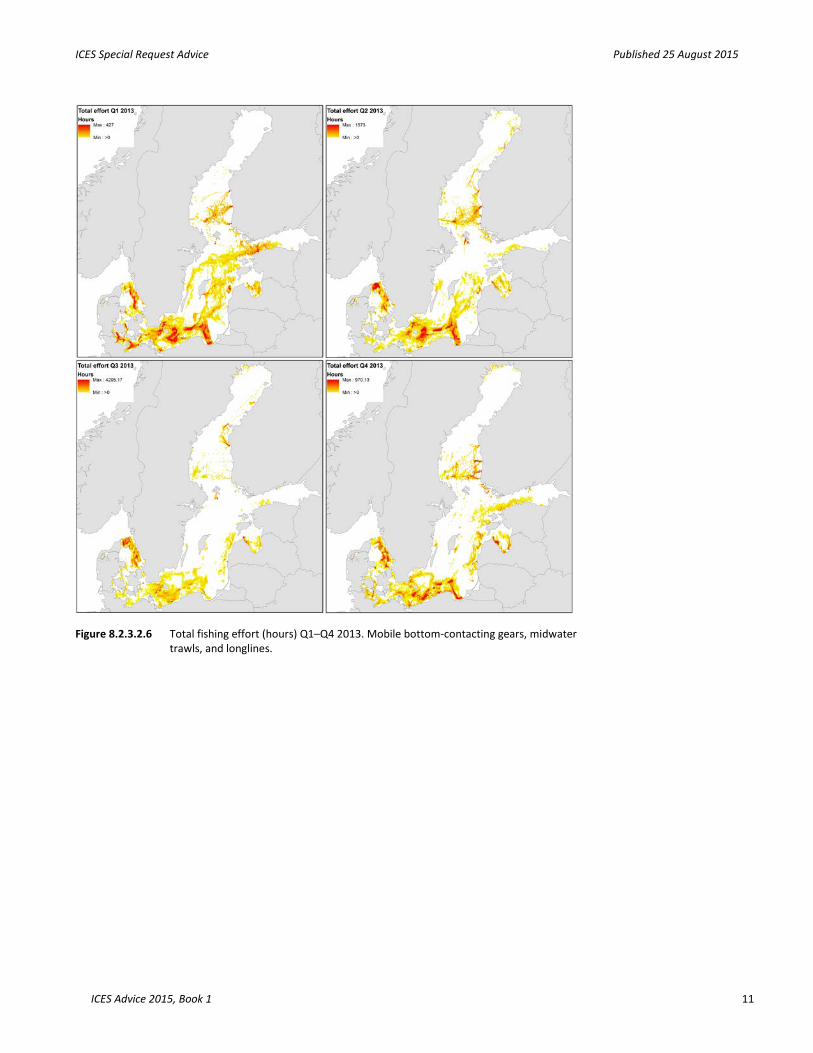
Figure 8.2.3.2.6 Total fishing effort (hours) Q1–Q4 2013. Mobile bottom-contacting gears, midwater trawls, and longlines.
Published 25 August 2015 ICES Special Request Advice
12 ICES Advice 2015, Book 1
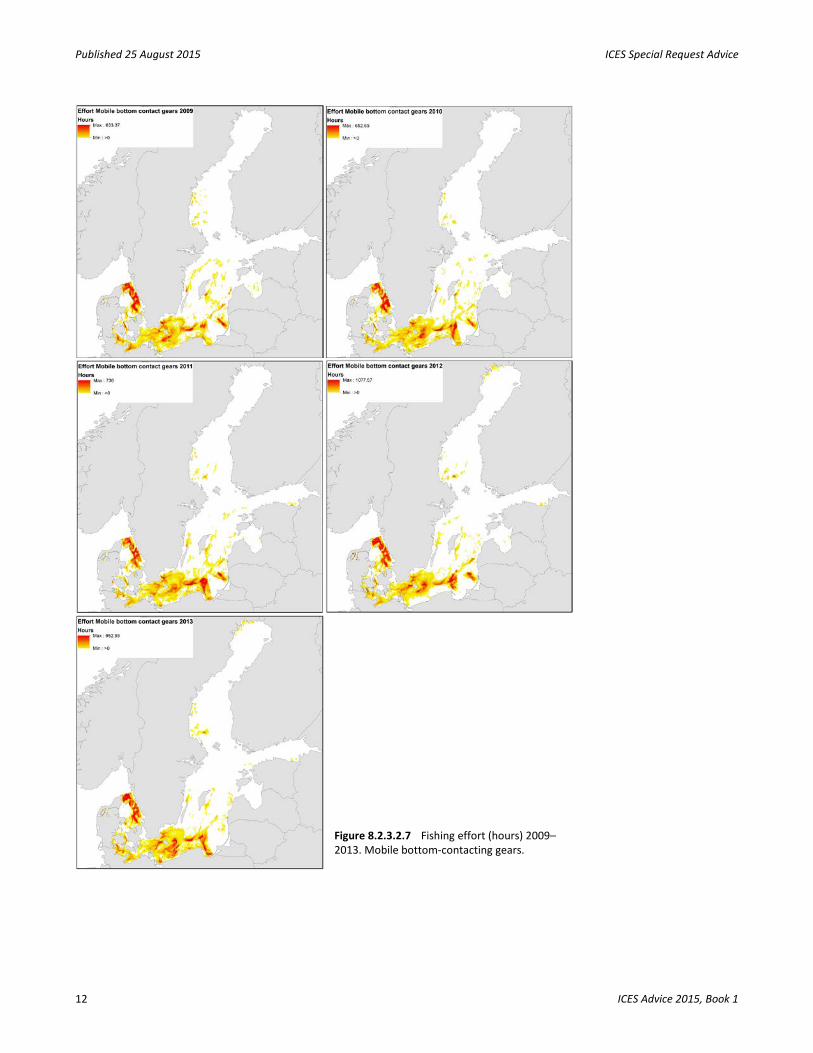
Figure 8.2.3.2.7 Fishing effort (hours) 2009–2013. Mobile bottom-contacting gears.
ICES Special Request Advice Published 25 August 2015
ICES Advice 2015, Book 1 13
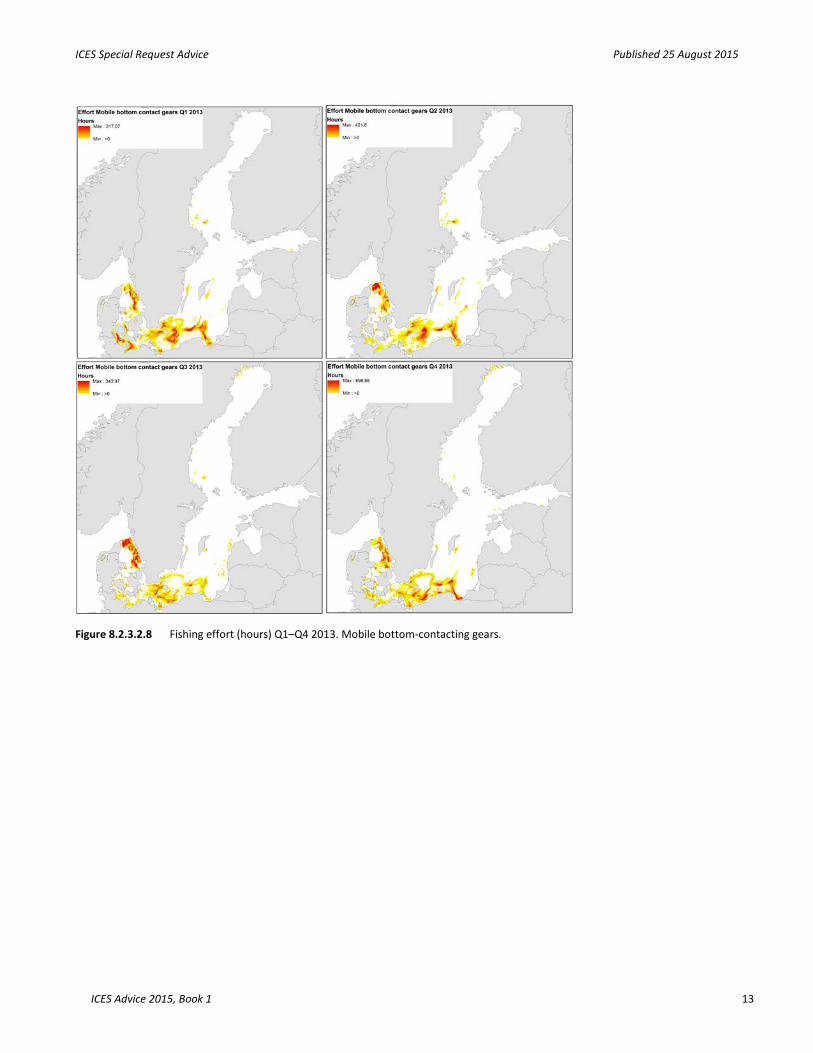
Figure 8.2.3.2.8 Fishing effort (hours) Q1–Q4 2013. Mobile bottom-contacting gears.
Published 25 August 2015 ICES Special Request Advice
14 ICES Advice 2015, Book 1
Figure 8.2.3.2.9 Fishing effort (hours) 2009–2013. Midwater trawls.
ICES Special Request Advice Published 25 August 2015
ICES Advice 2015, Book 1 15
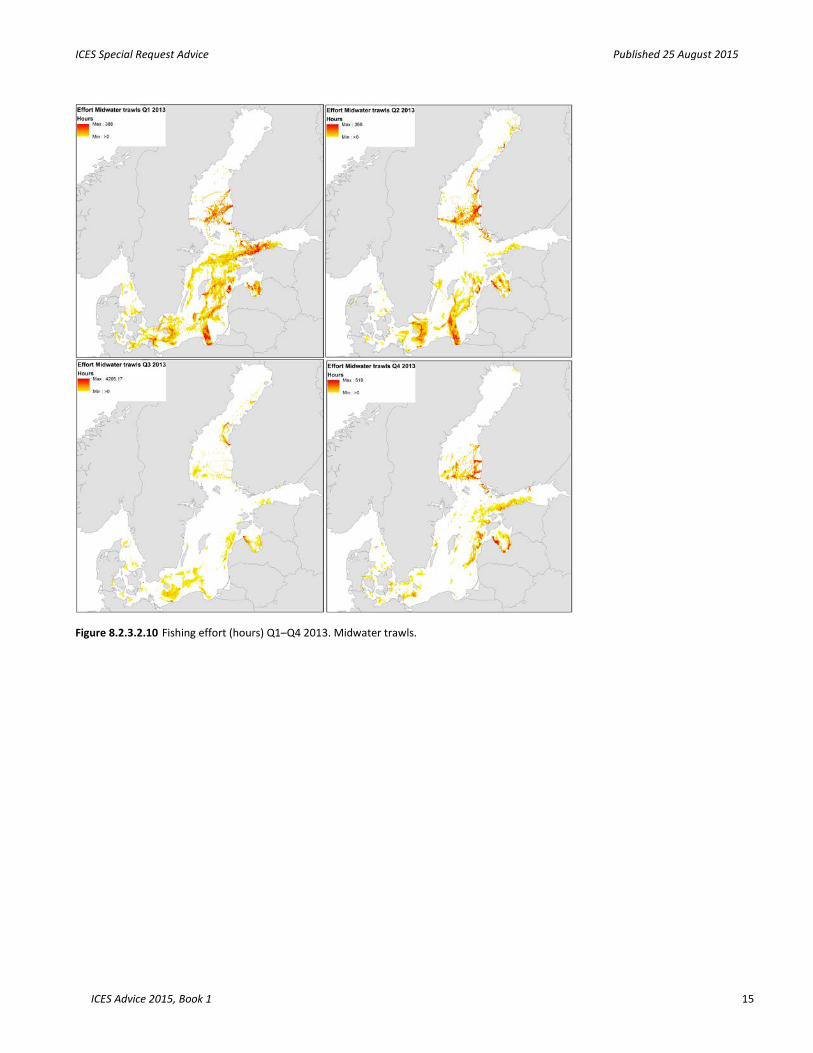
Figure 8.2.3.2.10 Fishing effort (hours) Q1–Q4 2013. Midwater trawls.
Published 25 August 2015 ICES Special Request Advice
16 ICES Advice 2015, Book 1
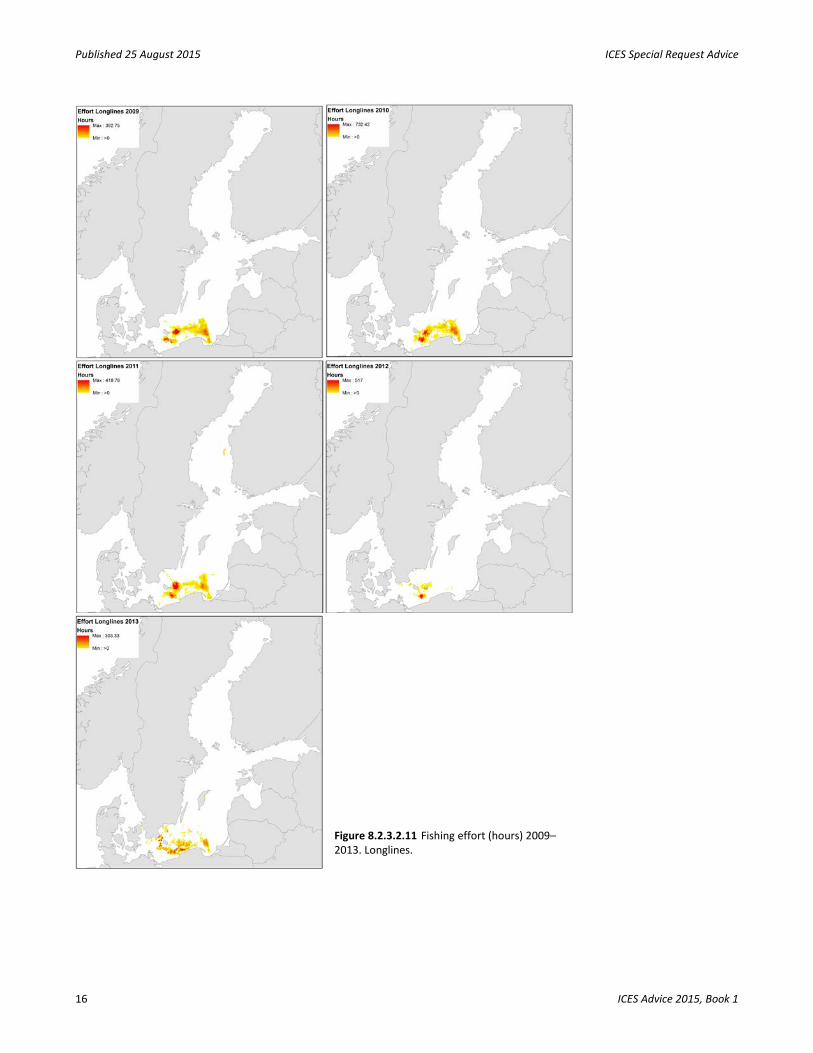
Figure 8.2.3.2.11 Fishing effort (hours) 2009–2013. Longlines.
ICES Special Request Advice Published 25 August 2015
ICES Advice 2015, Book 1 17
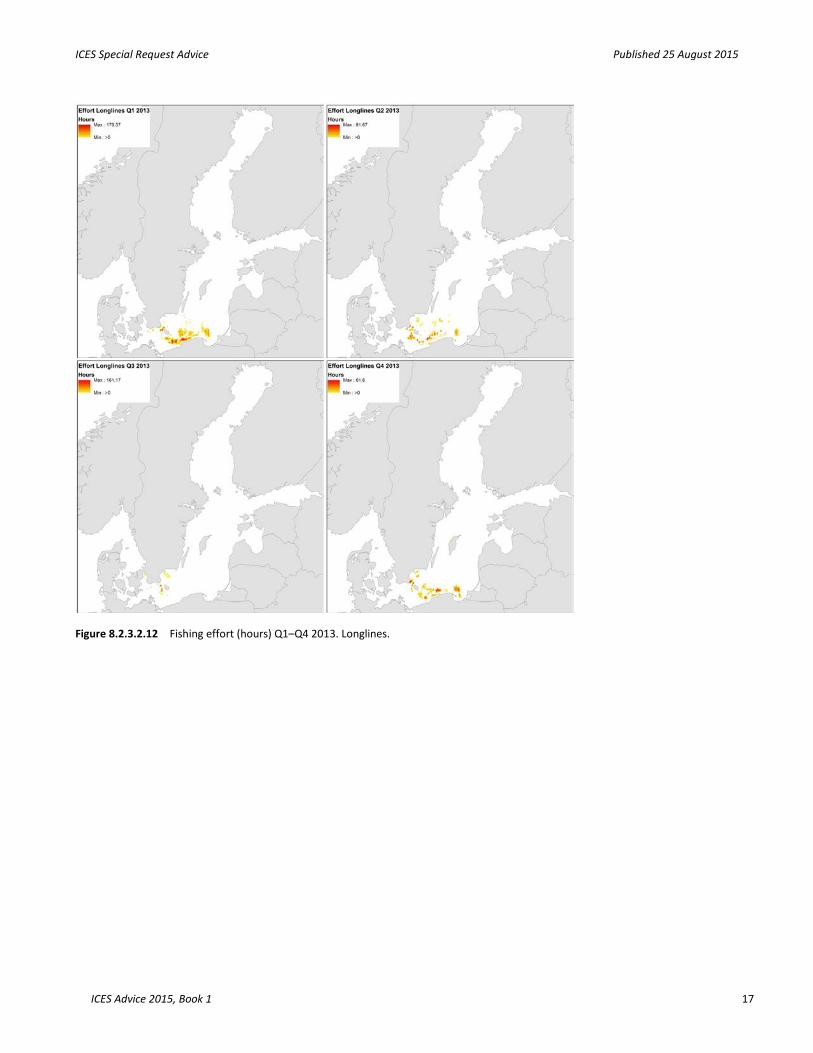
Figure 8.2.3.2.12 Fishing effort (hours) Q1–Q4 2013. Longlines.
Published 25 August 2015 ICES Special Request Advice
18 ICES Advice 2015, Book 1
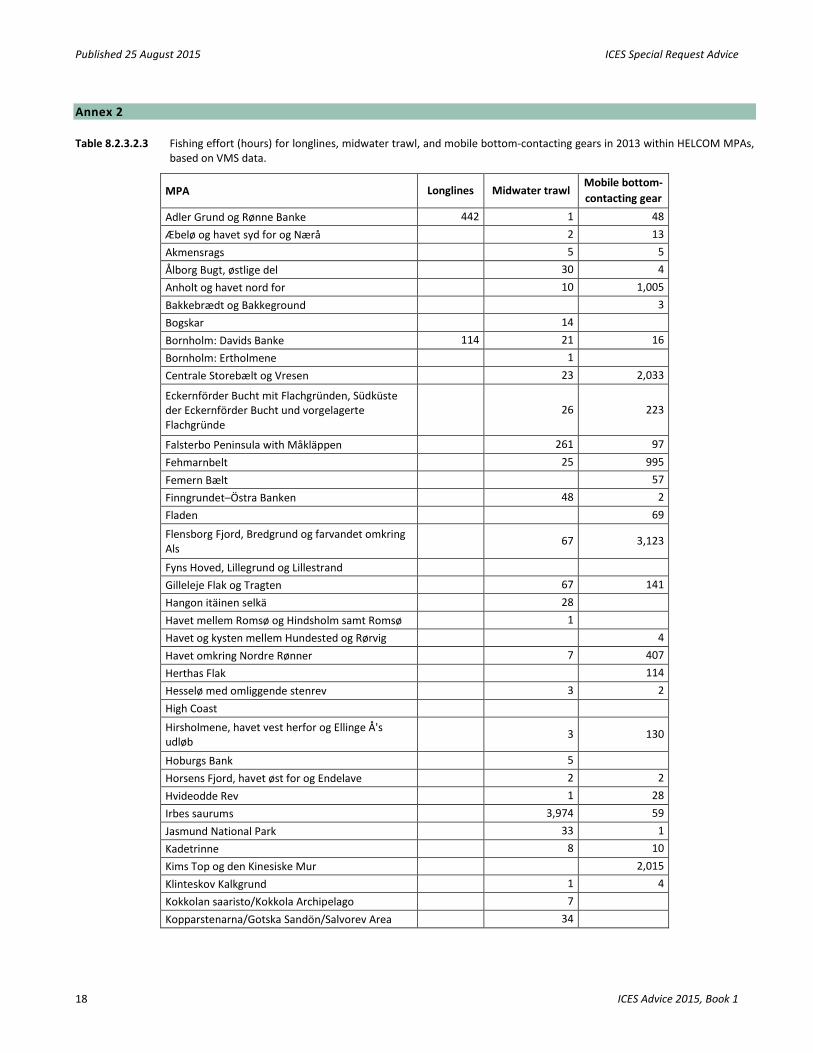
Annex 2 Table 8.2.3.2.3 Fishing effort (hours) for longlines, midwater trawl, and mobile bottom-contacting gears in 2013 within HELCOM MPAs,
based on VMS data.
MPA Longlines Midwater trawl Mobile bottom-contacting gear
Adler Grund og Rønne Banke 442 1 48 Æbelø og havet syd for og Nærå 2 13 Akmensrags 5 5 Ålborg Bugt, østlige del 30 4 Anholt og havet nord for 10 1,005 Bakkebrædt og Bakkeground 3 Bogskar 14 Bornholm: Davids Banke 114 21 16 Bornholm: Ertholmene 1 Centrale Storebælt og Vresen 23 2,033
Eckernförder Bucht mit Flachgründen, Südküste der Eckernförder Bucht und vorgelagerte Flachgründe
26 223
Falsterbo Peninsula with Måkläppen 261 97 Fehmarnbelt 25 995 Femern Bælt 57 Finngrundet–Östra Banken 48 2 Fladen 69
Flensborg Fjord, Bredgrund og farvandet omkring Als
67 3,123
Fyns Hoved, Lillegrund og Lillestrand Gilleleje Flak og Tragten 67 141 Hangon itäinen selkä 28 Havet mellem Romsø og Hindsholm samt Romsø 1 Havet og kysten mellem Hundested og Rørvig 4 Havet omkring Nordre Rønner 7 407 Herthas Flak 114 Hesselø med omliggende stenrev 3 2 High Coast
Hirsholmene, havet vest herfor og Ellinge Å's udløb
3 130
Hoburgs Bank 5 Horsens Fjord, havet øst for og Endelave 2 2 Hvideodde Rev 1 28 Irbes saurums 3,974 59 Jasmund National Park 33 1 Kadetrinne 8 10 Kims Top og den Kinesiske Mur 2,015 Klinteskov Kalkgrund 1 4 Kokkolan saaristo/Kokkola Archipelago 7 Kopparstenarna/Gotska Sandön/Salvorev Area 34
ICES Special Request Advice Published 25 August 2015
ICES Advice 2015, Book 1 19
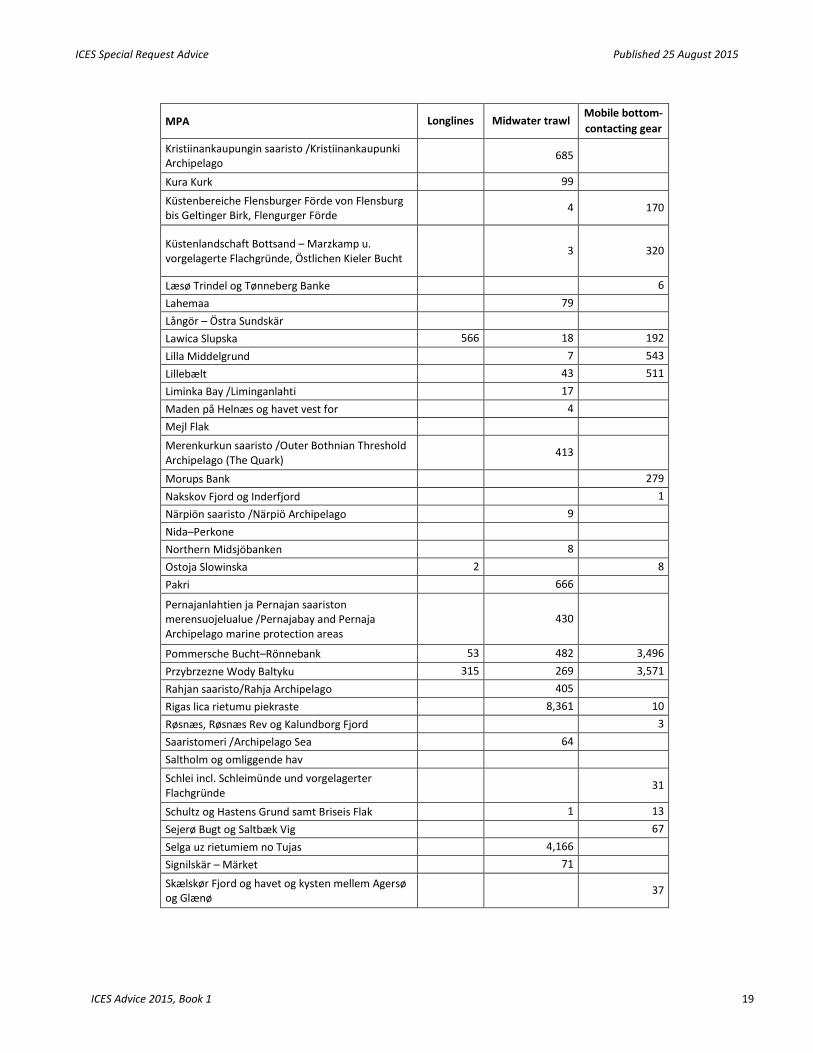
MPA Longlines Midwater trawl Mobile bottom-contacting gear
Kristiinankaupungin saaristo /Kristiinankaupunki Archipelago
685
Kura Kurk 99
Küstenbereiche Flensburger Förde von Flensburg bis Geltinger Birk, Flengurger Förde
4 170
Küstenlandschaft Bottsand – Marzkamp u. vorgelagerte Flachgründe, Östlichen Kieler Bucht
3 320
Læsø Trindel og Tønneberg Banke 6 Lahemaa 79 Långör – Östra Sundskär Lawica Slupska 566 18 192 Lilla Middelgrund 7 543 Lillebælt 43 511 Liminka Bay /Liminganlahti 17 Maden på Helnæs og havet vest for 4 Mejl Flak
Merenkurkun saaristo /Outer Bothnian Threshold Archipelago (The Quark)
413
Morups Bank 279 Nakskov Fjord og Inderfjord 1 Närpiön saaristo /Närpiö Archipelago 9 Nida–Perkone Northern Midsjöbanken 8 Ostoja Slowinska 2 8 Pakri 666
Pernajanlahtien ja Pernajan saariston merensuojelualue /Pernajabay and Pernaja Archipelago marine protection areas
430
Pommersche Bucht–Rönnebank 53 482 3,496 Przybrzezne Wody Baltyku 315 269 3,571 Rahjan saaristo/Rahja Archipelago 405 Rigas lica rietumu piekraste 8,361 10 Røsnæs, Røsnæs Rev og Kalundborg Fjord 3 Saaristomeri /Archipelago Sea 64 Saltholm og omliggende hav
Schlei incl. Schleimünde und vorgelagerter Flachgründe
31
Schultz og Hastens Grund samt Briseis Flak 1 13 Sejerø Bugt og Saltbæk Vig 67 Selga uz rietumiem no Tujas 4,166 Signilskär – Märket 71
Skælskør Fjord og havet og kysten mellem Agersø og Glænø
37
Published 25 August 2015 ICES Special Request Advice
20 ICES Advice 2015, Book 1
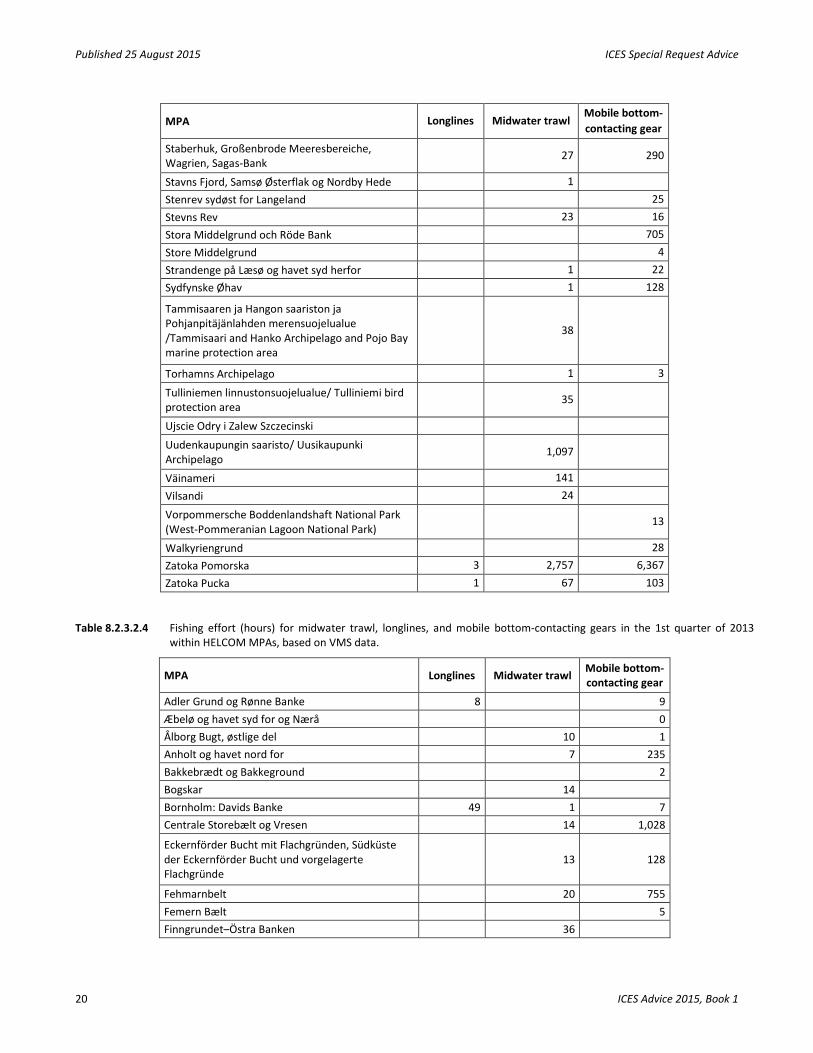
MPA Longlines Midwater trawl Mobile bottom-contacting gear
Staberhuk, Großenbrode Meeresbereiche, Wagrien, Sagas-Bank
27 290
Stavns Fjord, Samsø Østerflak og Nordby Hede 1 Stenrev sydøst for Langeland 25 Stevns Rev 23 16 Stora Middelgrund och Röde Bank 705 Store Middelgrund 4 Strandenge på Læsø og havet syd herfor 1 22 Sydfynske Øhav 1 128
Tammisaaren ja Hangon saariston ja Pohjanpitäjänlahden merensuojelualue /Tammisaari and Hanko Archipelago and Pojo Bay marine protection area
38
Torhamns Archipelago 1 3
Tulliniemen linnustonsuojelualue/ Tulliniemi bird protection area
35
Ujscie Odry i Zalew Szczecinski
Uudenkaupungin saaristo/ Uusikaupunki Archipelago
1,097
Väinameri 141 Vilsandi 24
Vorpommersche Boddenlandshaft National Park (West-Pommeranian Lagoon National Park)
13
Walkyriengrund 28 Zatoka Pomorska 3 2,757 6,367 Zatoka Pucka 1 67 103
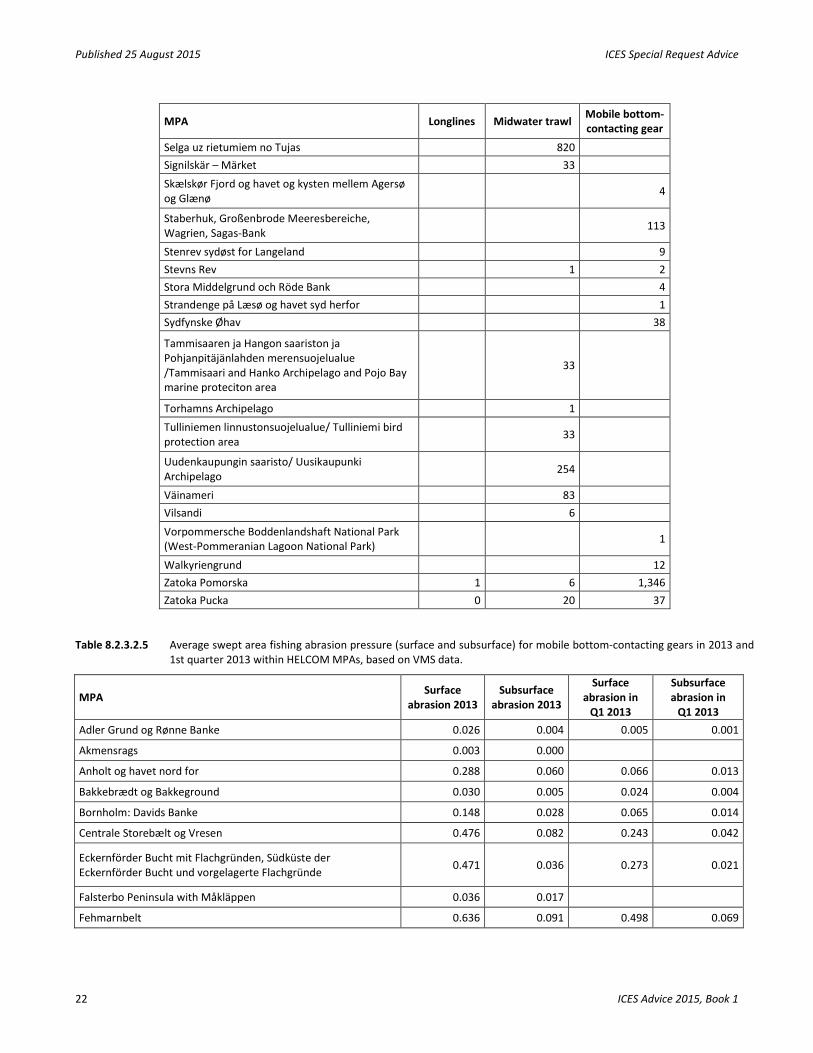
Table 8.2.3.2.4 Fishing effort (hours) for midwater trawl, longlines, and mobile bottom-contacting gears in the 1st quarter of 2013 within HELCOM MPAs, based on VMS data.
MPA Longlines Midwater trawl Mobile bottom-contacting gear
Adler Grund og Rønne Banke 8 9 Æbelø og havet syd for og Nærå 0 Ålborg Bugt, østlige del 10 1 Anholt og havet nord for 7 235 Bakkebrædt og Bakkeground 2 Bogskar 14 Bornholm: Davids Banke 49 1 7 Centrale Storebælt og Vresen 14 1,028
Eckernförder Bucht mit Flachgründen, Südküste der Eckernförder Bucht und vorgelagerte Flachgründe
13 128
Fehmarnbelt 20 755 Femern Bælt 5 Finngrundet–Östra Banken 36
ICES Special Request Advice Published 25 August 2015
ICES Advice 2015, Book 1 21
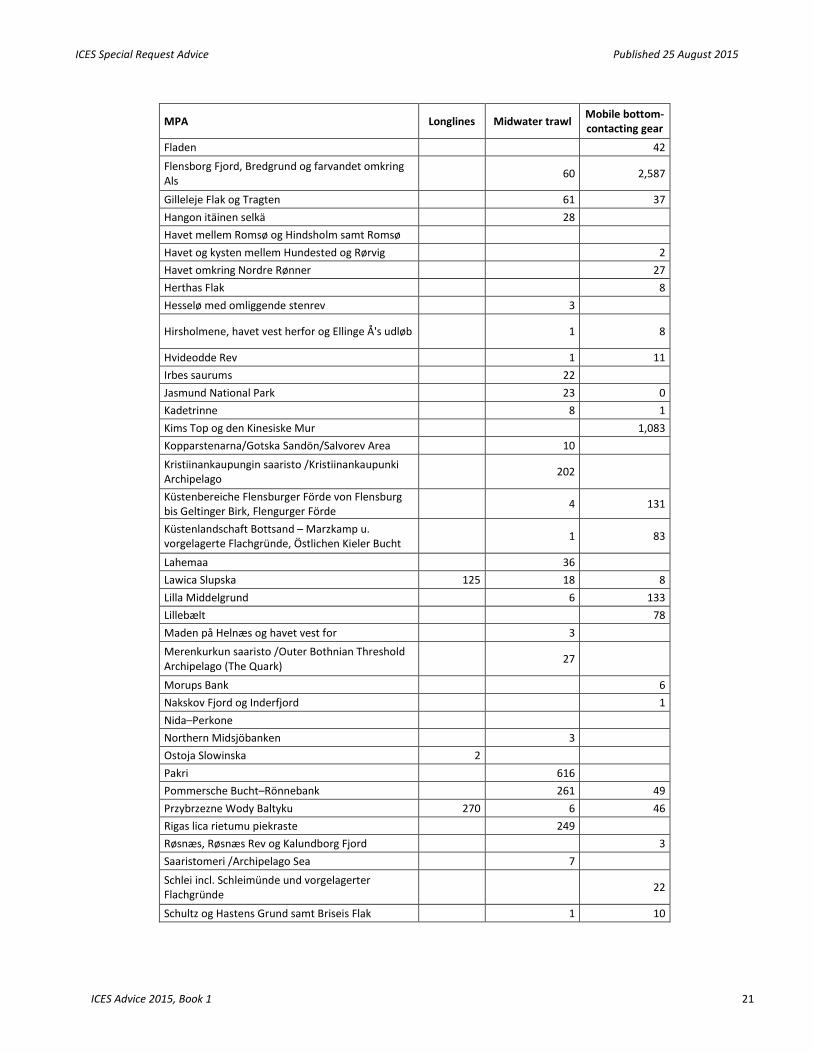
MPA Longlines Midwater trawl Mobile bottom-contacting gear
Fladen 42 Flensborg Fjord, Bredgrund og farvandet omkring Als 60 2,587
Gilleleje Flak og Tragten 61 37 Hangon itäinen selkä 28 Havet mellem Romsø og Hindsholm samt Romsø Havet og kysten mellem Hundested og Rørvig 2 Havet omkring Nordre Rønner 27 Herthas Flak 8 Hesselø med omliggende stenrev 3
Hirsholmene, havet vest herfor og Ellinge Å's udløb 1 8
Hvideodde Rev 1 11 Irbes saurums 22 Jasmund National Park 23 0 Kadetrinne 8 1 Kims Top og den Kinesiske Mur 1,083 Kopparstenarna/Gotska Sandön/Salvorev Area 10 Kristiinankaupungin saaristo /Kristiinankaupunki Archipelago 202
Küstenbereiche Flensburger Förde von Flensburg bis Geltinger Birk, Flengurger Förde 4 131
Küstenlandschaft Bottsand – Marzkamp u. vorgelagerte Flachgründe, Östlichen Kieler Bucht 1 83
Lahemaa 36 Lawica Slupska 125 18 8 Lilla Middelgrund 6 133 Lillebælt 78 Maden på Helnæs og havet vest for 3 Merenkurkun saaristo /Outer Bothnian Threshold Archipelago (The Quark) 27
Morups Bank 6 Nakskov Fjord og Inderfjord 1 Nida–Perkone Northern Midsjöbanken 3 Ostoja Slowinska 2 Pakri 616 Pommersche Bucht–Rönnebank 261 49 Przybrzezne Wody Baltyku 270 6 46 Rigas lica rietumu piekraste 249 Røsnæs, Røsnæs Rev og Kalundborg Fjord 3 Saaristomeri /Archipelago Sea 7 Schlei incl. Schleimünde und vorgelagerter Flachgründe 22
Schultz og Hastens Grund samt Briseis Flak 1 10
Published 25 August 2015 ICES Special Request Advice
22 ICES Advice 2015, Book 1
MPA Longlines Midwater trawl Mobile bottom-contacting gear
Selga uz rietumiem no Tujas 820 Signilskär – Märket 33 Skælskør Fjord og havet og kysten mellem Agersø og Glænø 4
Staberhuk, Großenbrode Meeresbereiche, Wagrien, Sagas-Bank 113
Stenrev sydøst for Langeland 9 Stevns Rev 1 2 Stora Middelgrund och Röde Bank 4 Strandenge på Læsø og havet syd herfor 1 Sydfynske Øhav 38
Tammisaaren ja Hangon saariston ja Pohjanpitäjänlahden merensuojelualue /Tammisaari and Hanko Archipelago and Pojo Bay marine proteciton area
33
Torhamns Archipelago 1 Tulliniemen linnustonsuojelualue/ Tulliniemi bird protection area 33
Uudenkaupungin saaristo/ Uusikaupunki Archipelago 254
Väinameri 83 Vilsandi 6 Vorpommersche Boddenlandshaft National Park (West-Pommeranian Lagoon National Park) 1
Walkyriengrund 12 Zatoka Pomorska 1 6 1,346 Zatoka Pucka 0 20 37
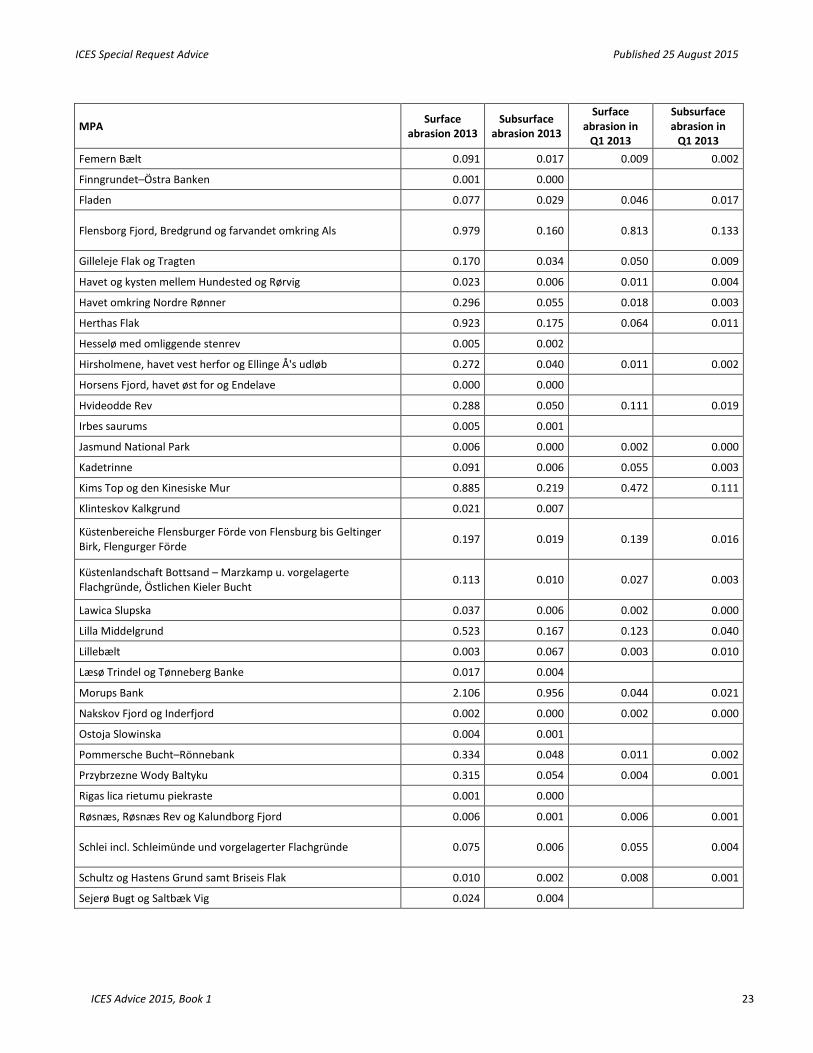
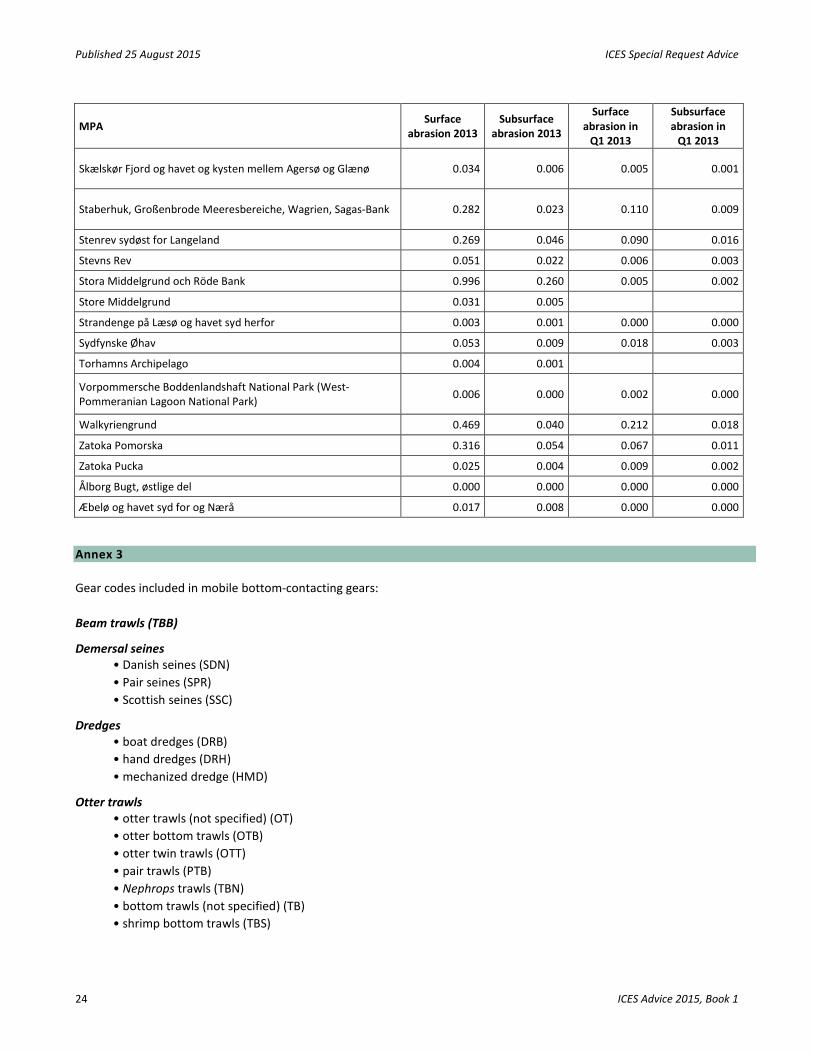
Table 8.2.3.2.5 Average swept area fishing abrasion pressure (surface and subsurface) for mobile bottom-contacting gears in 2013 and 1st quarter 2013 within HELCOM MPAs, based on VMS data.
MPA Surface abrasion 2013
Subsurface abrasion 2013
Surface abrasion in
Q1 2013
Subsurface abrasion in
Q1 2013 Adler Grund og Rønne Banke 0.026 0.004 0.005 0.001
Akmensrags 0.003 0.000
Anholt og havet nord for 0.288 0.060 0.066 0.013
Bakkebrædt og Bakkeground 0.030 0.005 0.024 0.004
Bornholm: Davids Banke 0.148 0.028 0.065 0.014
Centrale Storebælt og Vresen 0.476 0.082 0.243 0.042
Eckernförder Bucht mit Flachgründen, Südküste der Eckernförder Bucht und vorgelagerte Flachgründe 0.471 0.036 0.273 0.021
Falsterbo Peninsula with Måkläppen 0.036 0.017
Fehmarnbelt 0.636 0.091 0.498 0.069
ICES Special Request Advice Published 25 August 2015
ICES Advice 2015, Book 1 23
MPA Surface abrasion 2013
Subsurface abrasion 2013
Surface abrasion in
Q1 2013
Subsurface abrasion in
Q1 2013 Femern Bælt 0.091 0.017 0.009 0.002
Finngrundet–Östra Banken 0.001 0.000
Fladen 0.077 0.029 0.046 0.017
Flensborg Fjord, Bredgrund og farvandet omkring Als 0.979 0.160 0.813 0.133
Gilleleje Flak og Tragten 0.170 0.034 0.050 0.009
Havet og kysten mellem Hundested og Rørvig 0.023 0.006 0.011 0.004
Havet omkring Nordre Rønner 0.296 0.055 0.018 0.003
Herthas Flak 0.923 0.175 0.064 0.011
Hesselø med omliggende stenrev 0.005 0.002
Hirsholmene, havet vest herfor og Ellinge Å's udløb 0.272 0.040 0.011 0.002
Horsens Fjord, havet øst for og Endelave 0.000 0.000
Hvideodde Rev 0.288 0.050 0.111 0.019
Irbes saurums 0.005 0.001
Jasmund National Park 0.006 0.000 0.002 0.000
Kadetrinne 0.091 0.006 0.055 0.003
Kims Top og den Kinesiske Mur 0.885 0.219 0.472 0.111
Klinteskov Kalkgrund 0.021 0.007
Küstenbereiche Flensburger Förde von Flensburg bis Geltinger Birk, Flengurger Förde 0.197 0.019 0.139 0.016
Küstenlandschaft Bottsand – Marzkamp u. vorgelagerte Flachgründe, Östlichen Kieler Bucht 0.113 0.010 0.027 0.003
Lawica Slupska 0.037 0.006 0.002 0.000
Lilla Middelgrund 0.523 0.167 0.123 0.040
Lillebælt 0.003 0.067 0.003 0.010
Læsø Trindel og Tønneberg Banke 0.017 0.004
Morups Bank 2.106 0.956 0.044 0.021
Nakskov Fjord og Inderfjord 0.002 0.000 0.002 0.000
Ostoja Slowinska 0.004 0.001
Pommersche Bucht–Rönnebank 0.334 0.048 0.011 0.002
Przybrzezne Wody Baltyku 0.315 0.054 0.004 0.001
Rigas lica rietumu piekraste 0.001 0.000
Røsnæs, Røsnæs Rev og Kalundborg Fjord 0.006 0.001 0.006 0.001
Schlei incl. Schleimünde und vorgelagerter Flachgründe 0.075 0.006 0.055 0.004
Schultz og Hastens Grund samt Briseis Flak 0.010 0.002 0.008 0.001
Sejerø Bugt og Saltbæk Vig 0.024 0.004
Published 25 August 2015 ICES Special Request Advice
24 ICES Advice 2015, Book 1
MPA Surface abrasion 2013
Subsurface abrasion 2013
Surface abrasion in
Q1 2013
Subsurface abrasion in
Q1 2013
Skælskør Fjord og havet og kysten mellem Agersø og Glænø 0.034 0.006 0.005 0.001
Staberhuk, Großenbrode Meeresbereiche, Wagrien, Sagas-Bank 0.282 0.023 0.110 0.009
Stenrev sydøst for Langeland 0.269 0.046 0.090 0.016
Stevns Rev 0.051 0.022 0.006 0.003
Stora Middelgrund och Röde Bank 0.996 0.260 0.005 0.002
Store Middelgrund 0.031 0.005
Strandenge på Læsø og havet syd herfor 0.003 0.001 0.000 0.000
Sydfynske Øhav 0.053 0.009 0.018 0.003
Torhamns Archipelago 0.004 0.001
Vorpommersche Boddenlandshaft National Park (West-Pommeranian Lagoon National Park) 0.006 0.000 0.002 0.000
Walkyriengrund 0.469 0.040 0.212 0.018
Zatoka Pomorska 0.316 0.054 0.067 0.011
Zatoka Pucka 0.025 0.004 0.009 0.002
Ålborg Bugt, østlige del 0.000 0.000 0.000 0.000
Æbelø og havet syd for og Nærå 0.017 0.008 0.000 0.000
Annex 3 Gear codes included in mobile bottom-contacting gears: Beam trawls (TBB)
Demersal seines • Danish seines (SDN) • Pair seines (SPR) • Scottish seines (SSC)
Dredges • boat dredges (DRB) • hand dredges (DRH) • mechanized dredge (HMD)
Otter trawls • otter trawls (not specified) (OT) • otter bottom trawls (OTB) • otter twin trawls (OTT) • pair trawls (PTB) • Nephrops trawls (TBN) • bottom trawls (not specified) (TB) • shrimp bottom trawls (TBS)