Embed Size (px)
Citation preview
8/10/2019 9. Fluorescence Spectroscopy
http://slidepdf.com/reader/full/9-fluorescence-spectroscopy 1/30
Fluorometry
PHRM 309
8/10/2019 9. Fluorescence Spectroscopy
http://slidepdf.com/reader/full/9-fluorescence-spectroscopy 2/30
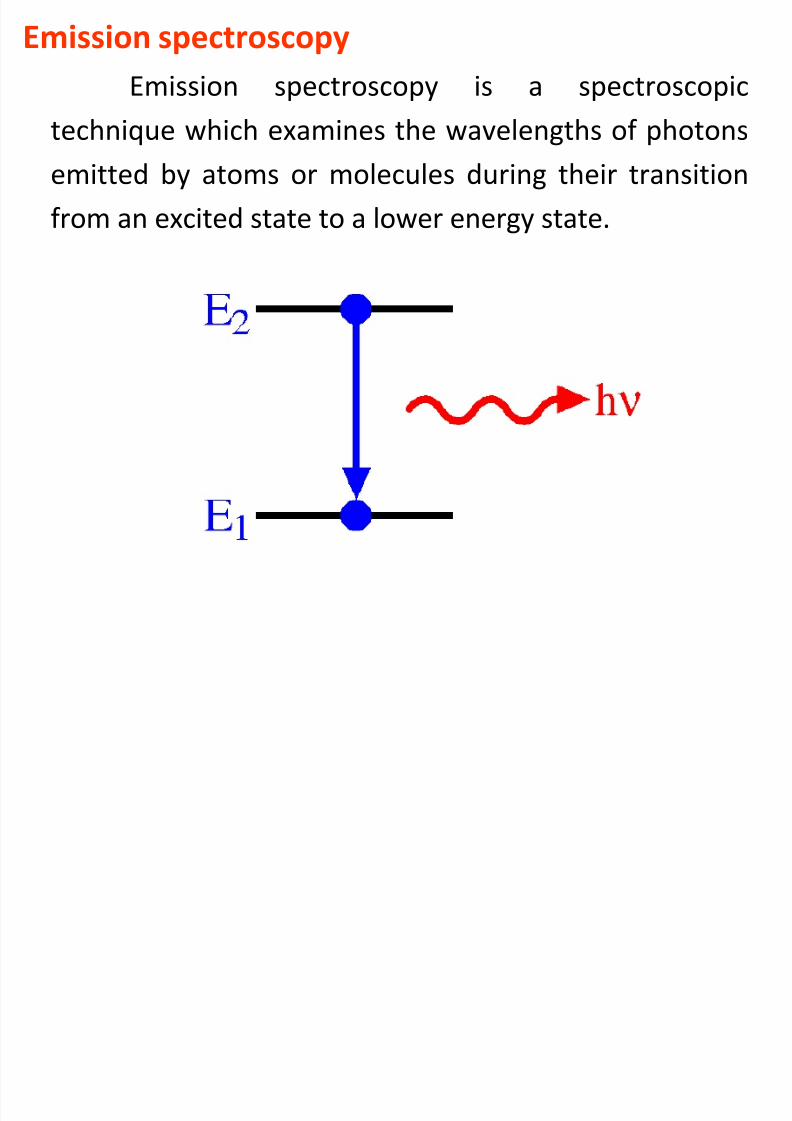
Emission spectroscopy
Emission spectroscopy is a spectroscopic
technique which examines the wavelengths of photonsemitted by atoms or molecules during their transition
from an excited state to a lower energy state.
8/10/2019 9. Fluorescence Spectroscopy
http://slidepdf.com/reader/full/9-fluorescence-spectroscopy 3/30
LuminescenceLuminescence is the emission of light from any
substance, and occurs from electronically excited states.
Luminescence is divided into two categories-
fluorescence and phosphorescence.
The emission rates of fluorescence are typically
108 s –1, so that a typical fluorescence lifetime is near 10
ns. The emission rates of phosphorescence are slow
(10
3
to 100 s
–1
), so that phosphorescence lifetimes aretypically milliseconds to seconds.
Fluorescence is much more widely used for chemical
analysis than phosphorescence.
8/10/2019 9. Fluorescence Spectroscopy
http://slidepdf.com/reader/full/9-fluorescence-spectroscopy 4/30
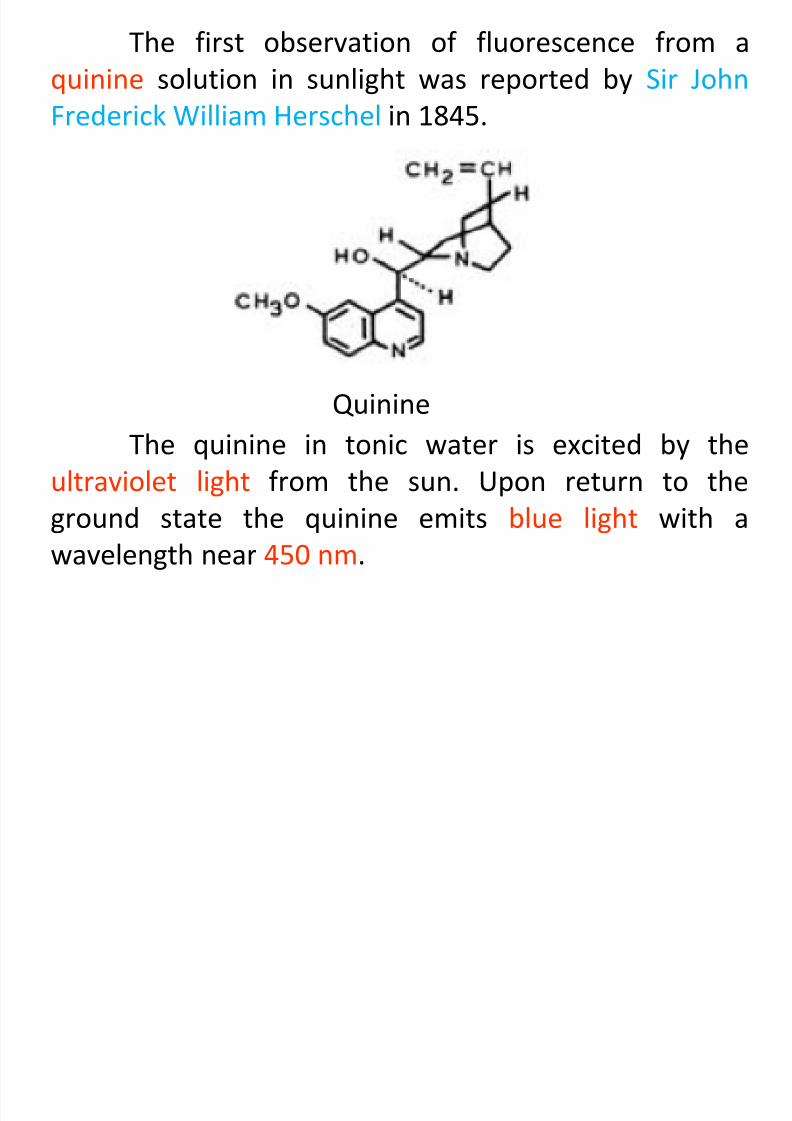
The first observation of fluorescence from a
quinine solution in sunlight was reported by Sir John
Frederick William Herschel in 1845.
QuinineThe quinine in tonic water is excited by the
ultraviolet light from the sun. Upon return to the
ground state the quinine emits blue light with a
wavelength near 450 nm.

8/10/2019 9. Fluorescence Spectroscopy
http://slidepdf.com/reader/full/9-fluorescence-spectroscopy 5/30
Theory of molecular fluorescence
Molecular fluorescence is measured by exciting
the sample at the absorption wavelength, also calledthe excitation wavelength, and measuring the emission
at a longer wavelength called the emission or
fluorescence wavelength.
For example, the reduced form of the coenzyme
nicotinamide adenine dinucleotide (NADH) can absorb
radiation at 340 nm. The molecule exhibits fluorescence
with an emission maximum at 465 nm.
8/10/2019 9. Fluorescence Spectroscopy
http://slidepdf.com/reader/full/9-fluorescence-spectroscopy 6/30
Theory of molecular fluorescence
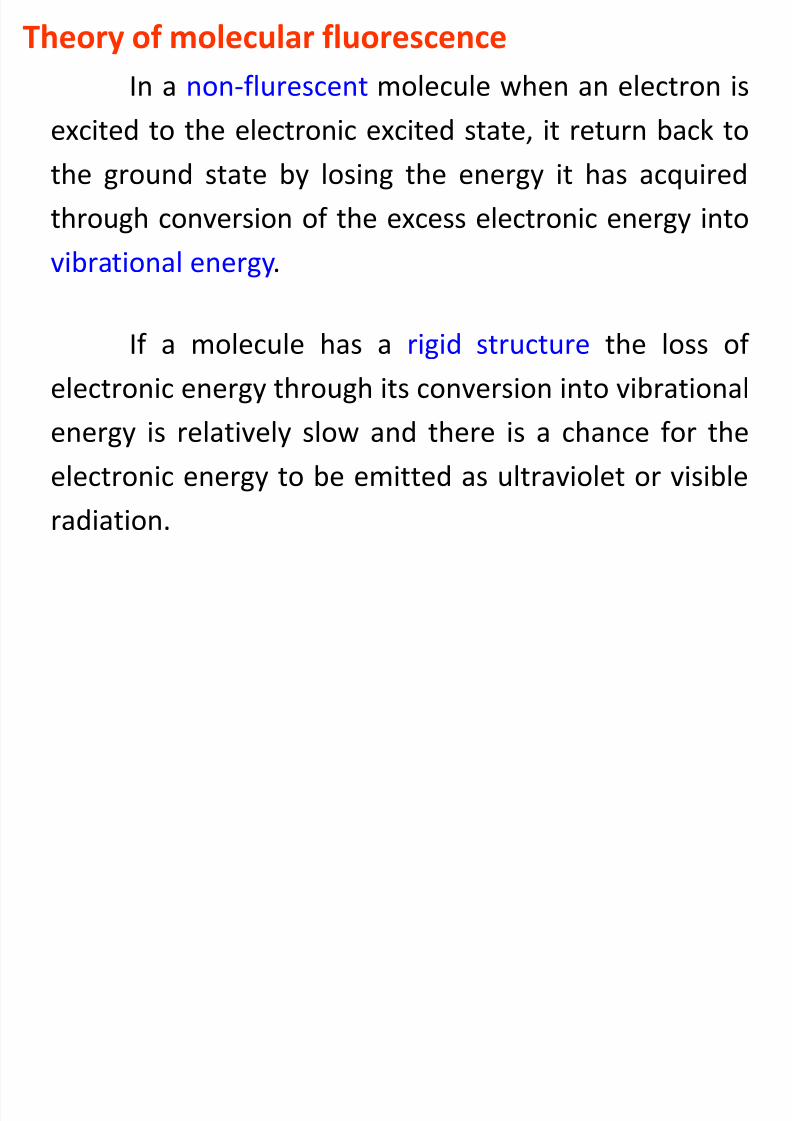
In a non-flurescent molecule when an electron is
excited to the electronic excited state, it return back tothe ground state by losing the energy it has acquired
through conversion of the excess electronic energy into
vibrational energy.
If a molecule has a rigid structure the loss of
electronic energy through its conversion into vibrational
energy is relatively slow and there is a chance for the
electronic energy to be emitted as ultraviolet or visible
radiation.
8/10/2019 9. Fluorescence Spectroscopy
http://slidepdf.com/reader/full/9-fluorescence-spectroscopy 7/30
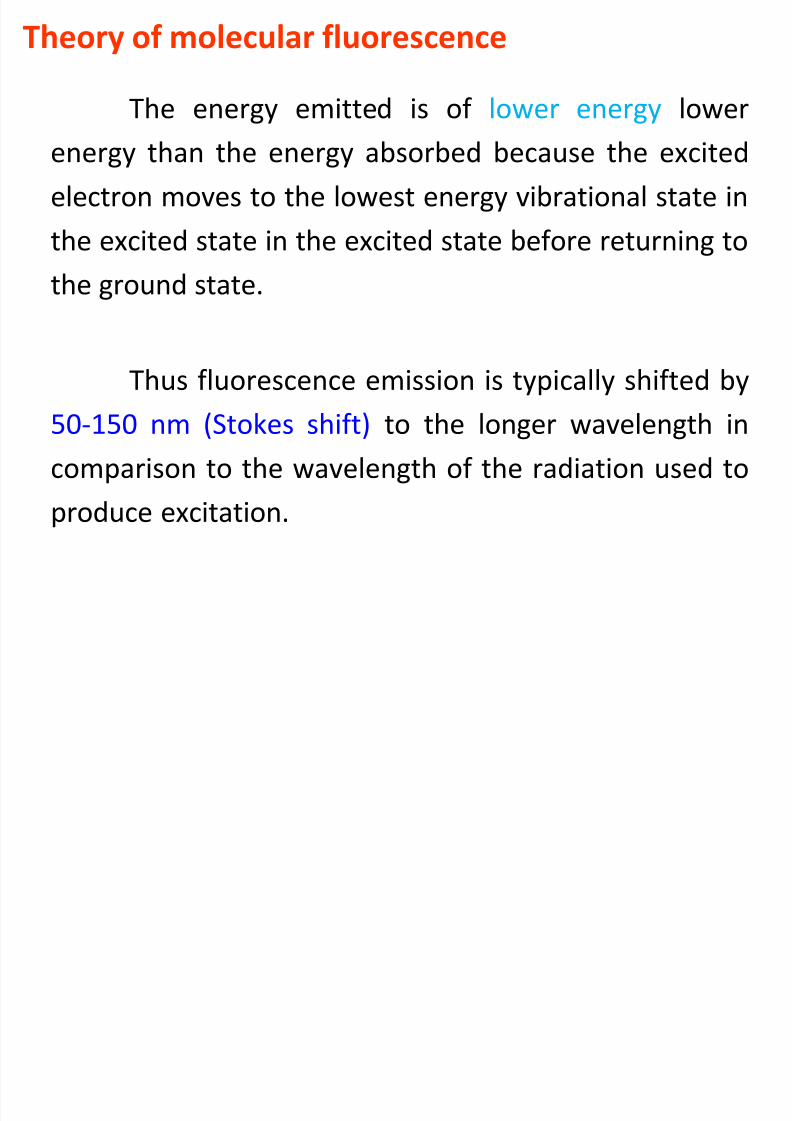
The energy emitted is of lower energy lower
energy than the energy absorbed because the excited
electron moves to the lowest energy vibrational state in
the excited state in the excited state before returning to
the ground state.
Thus fluorescence emission is typically shifted by
50-150 nm (Stokes shift) to the longer wavelength in
comparison to the wavelength of the radiation used to
produce excitation.
Theory of molecular fluorescence
8/10/2019 9. Fluorescence Spectroscopy
http://slidepdf.com/reader/full/9-fluorescence-spectroscopy 8/30
Relaxation processes
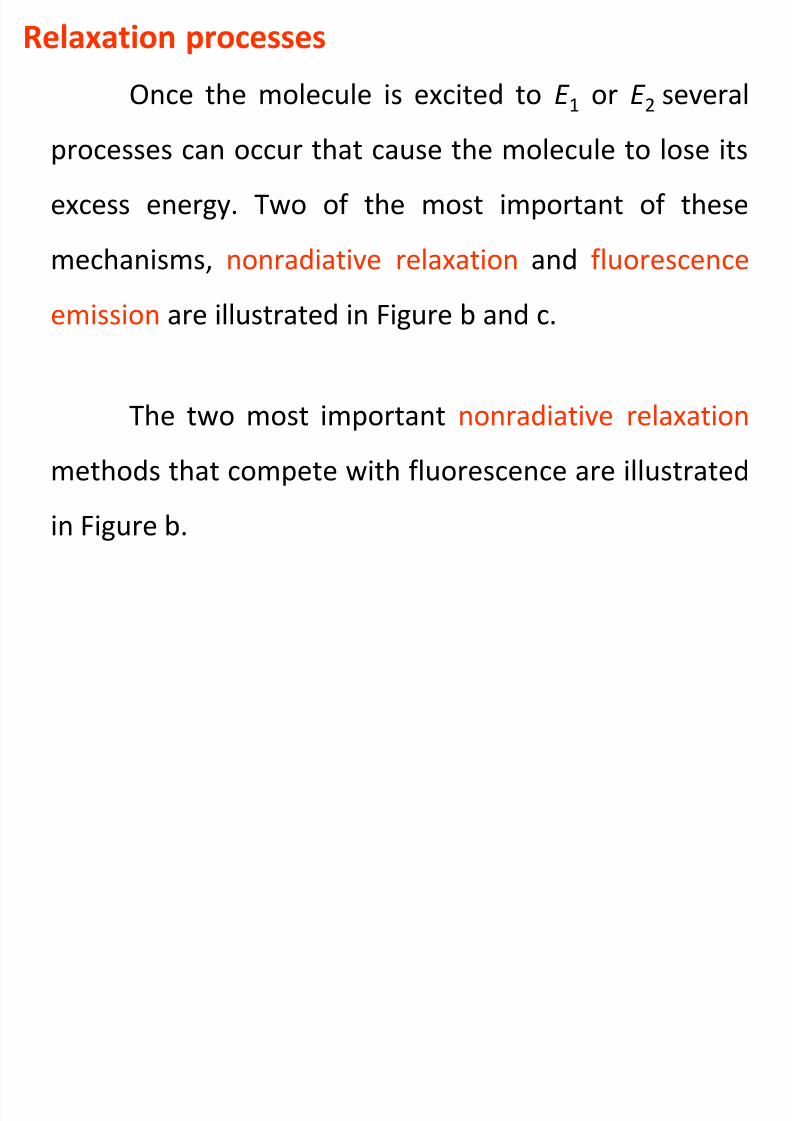
Once the molecule is excited to E 1 or E 2 several
processes can occur that cause the molecule to lose its
excess energy. Two of the most important of these
mechanisms, nonradiative relaxation and fluorescence
emission are illustrated in Figure b and c.
The two most important nonradiative relaxation
methods that compete with fluorescence are illustrated
in Figure b.
8/10/2019 9. Fluorescence Spectroscopy
http://slidepdf.com/reader/full/9-fluorescence-spectroscopy 9/30
8/10/2019 9. Fluorescence Spectroscopy
http://slidepdf.com/reader/full/9-fluorescence-spectroscopy 10/30
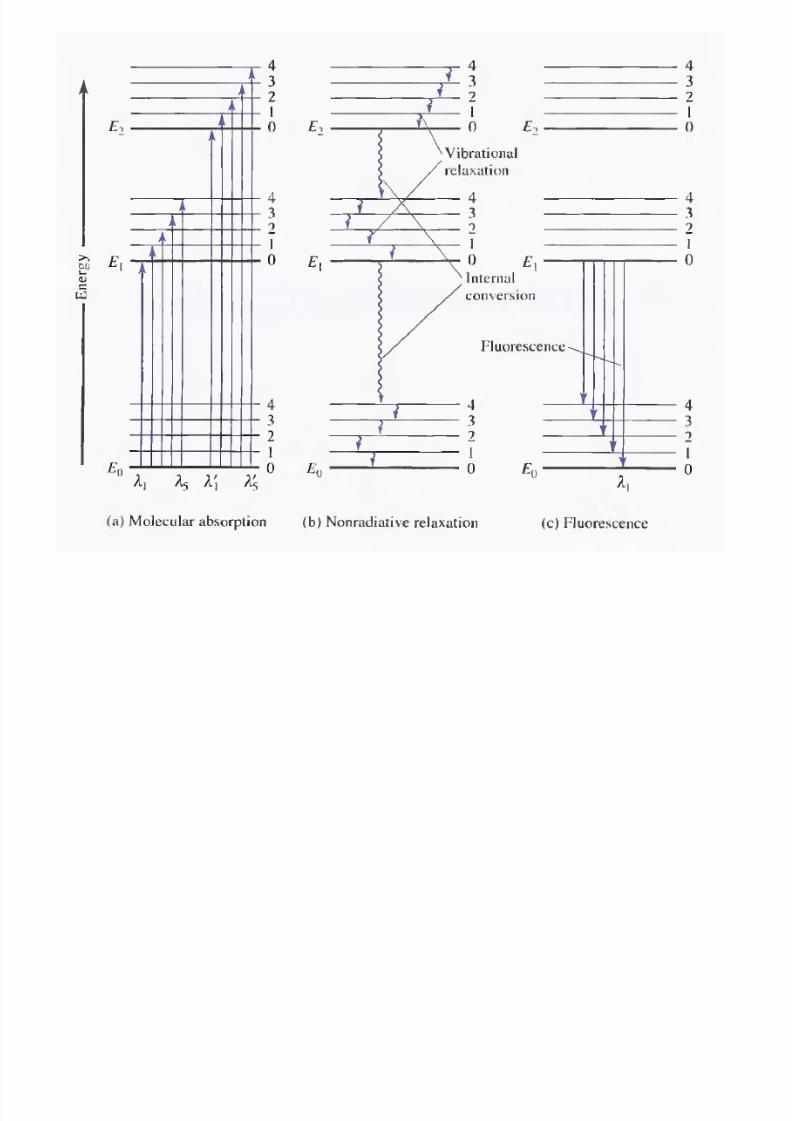
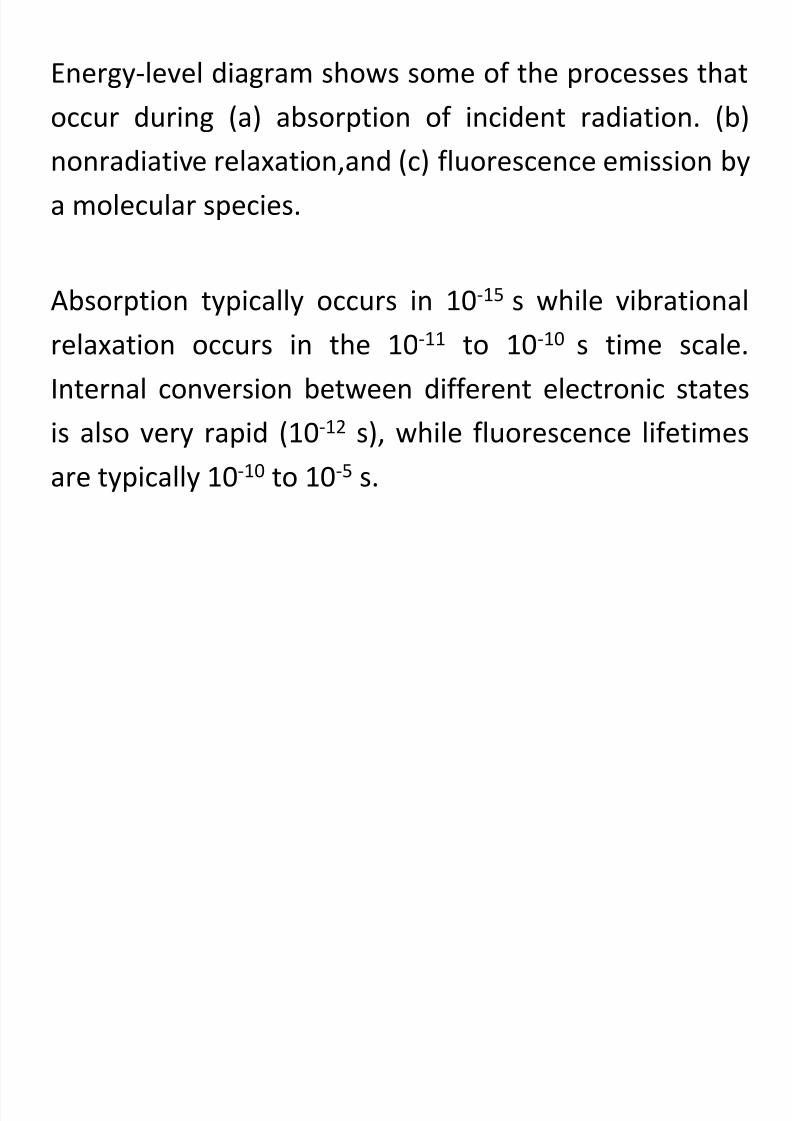
Energy-level diagram shows some of the processes that
occur during (a) absorption of incident radiation. (b)
nonradiative relaxation,and (c) fluorescence emission by
a molecular species.
Absorption typically occurs in 10-15 s while vibrational
relaxation occurs in the 10-11 to 10-10 s time scale.
Internal conversion between different electronic states
is also very rapid (10-12 s), while fluorescence lifetimes
are typically 10-10 to 10-5 s.
8/10/2019 9. Fluorescence Spectroscopy
http://slidepdf.com/reader/full/9-fluorescence-spectroscopy 11/30
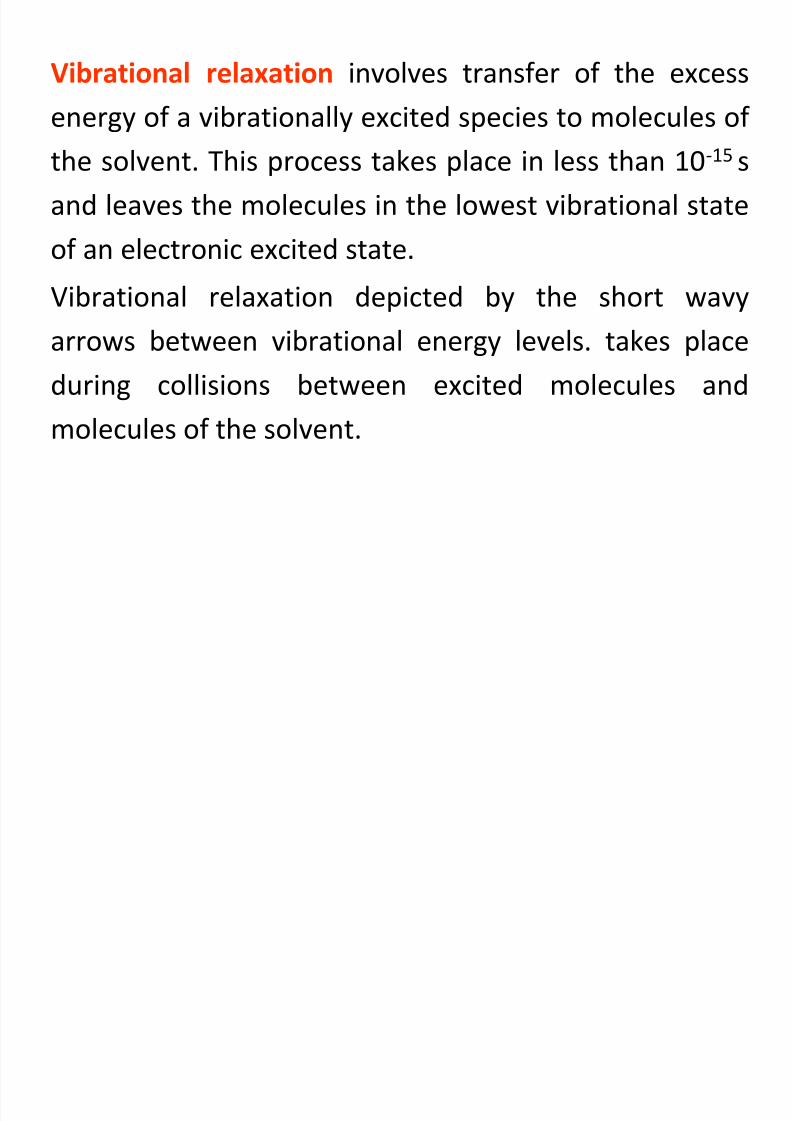
Vibrational relaxation involves transfer of the excess
energy of a vibrationally excited species to molecules of
the solvent. This process takes place in less than 10-15 s
and leaves the molecules in the lowest vibrational state
of an electronic excited state.
Vibrational relaxation depicted by the short wavy
arrows between vibrational energy levels. takes place
during collisions between excited molecules and
molecules of the solvent.
8/10/2019 9. Fluorescence Spectroscopy
http://slidepdf.com/reader/full/9-fluorescence-spectroscopy 12/30
Internal conversion is a type of relaxation that involves
transfer of the excess energy of a species in the lowest
vibrational level of an excited electronic state to solvent
molecules and conversion of the excited species to a
lower electronic state.
8/10/2019 9. Fluorescence Spectroscopy
http://slidepdf.com/reader/full/9-fluorescence-spectroscopy 13/30
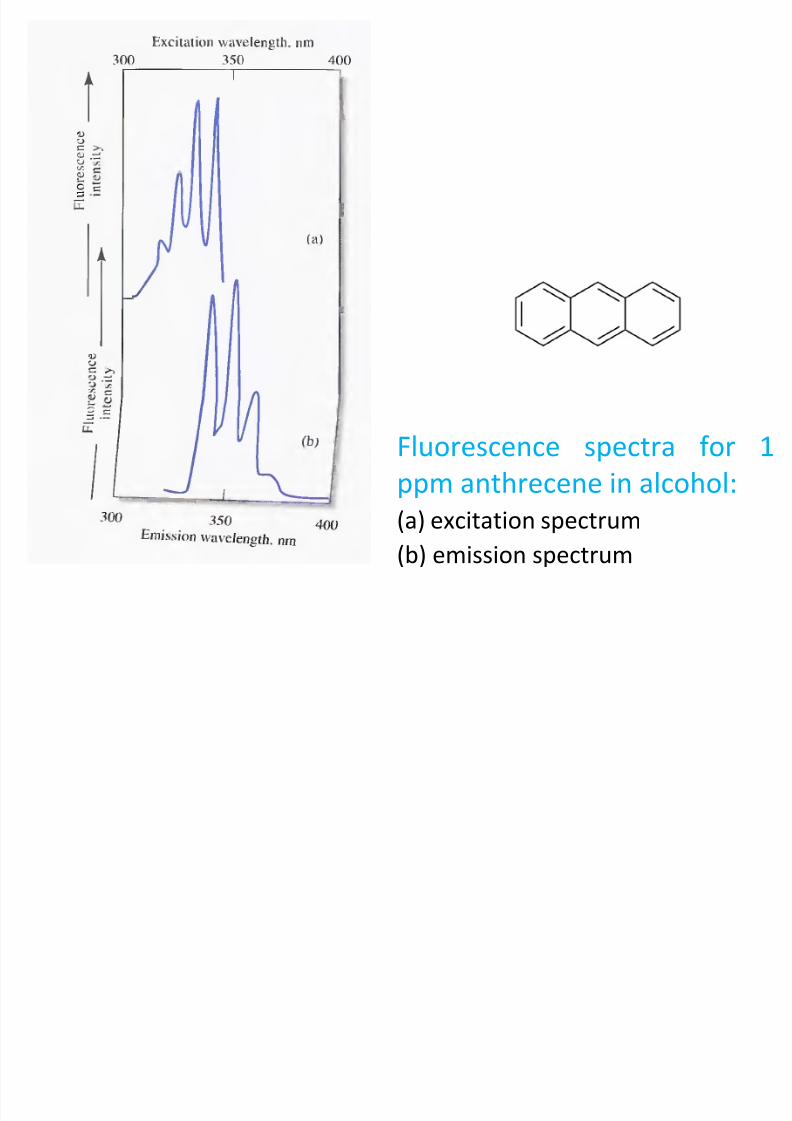
Relationship between excitation spectra and
fluorescence spectra
Because the energy differences between
vibrational states is about the same for both ground and
excited states, the absorption spectrum, or excitation
spectrum, and the fluorescence spectrum for a
compound often appear as approximate mirror images
of one another with overlap occurring near the origin
transition.
8/10/2019 9. Fluorescence Spectroscopy
http://slidepdf.com/reader/full/9-fluorescence-spectroscopy 14/30
Fluorescence spectra for 1
ppm anthrecene in alcohol:
(a) excitation spectrum
(b) emission spectrum
8/10/2019 9. Fluorescence Spectroscopy
http://slidepdf.com/reader/full/9-fluorescence-spectroscopy 15/30
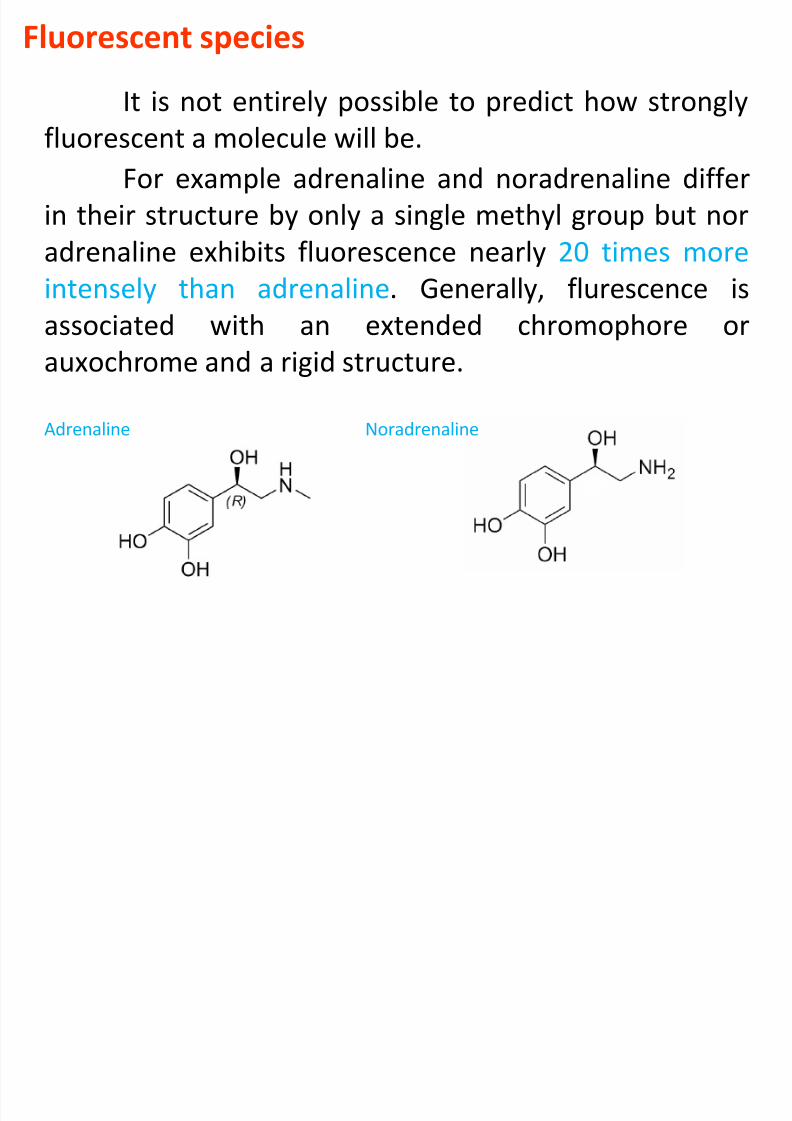
Fluorescent species
It is not entirely possible to predict how strongly
fluorescent a molecule will be.For example adrenaline and noradrenaline differ
in their structure by only a single methyl group but nor
adrenaline exhibits fluorescence nearly 20 times more
intensely than adrenaline. Generally, flurescence is
associated with an extended chromophore or
auxochrome and a rigid structure.
NoradrenalineAdrenaline
8/10/2019 9. Fluorescence Spectroscopy
http://slidepdf.com/reader/full/9-fluorescence-spectroscopy 16/30
- Compounds containing aromatic rings give the most
intense and most useful molecular fluorescence
emission.- Few aliphatic and alicyclic carbonyl compounds as well
as highly conjugate double-bonded structures.
The simplest heterocyclics, such as pyridine, furan,
thiophene and pyrrole, do not exhibit molecular
fluorescence, but fused-ring structures containing these
rings often do for example quinoline, isoquinoline,indole.

8/10/2019 9. Fluorescence Spectroscopy
http://slidepdf.com/reader/full/9-fluorescence-spectroscopy 17/30
8/10/2019 9. Fluorescence Spectroscopy
http://slidepdf.com/reader/full/9-fluorescence-spectroscopy 18/30
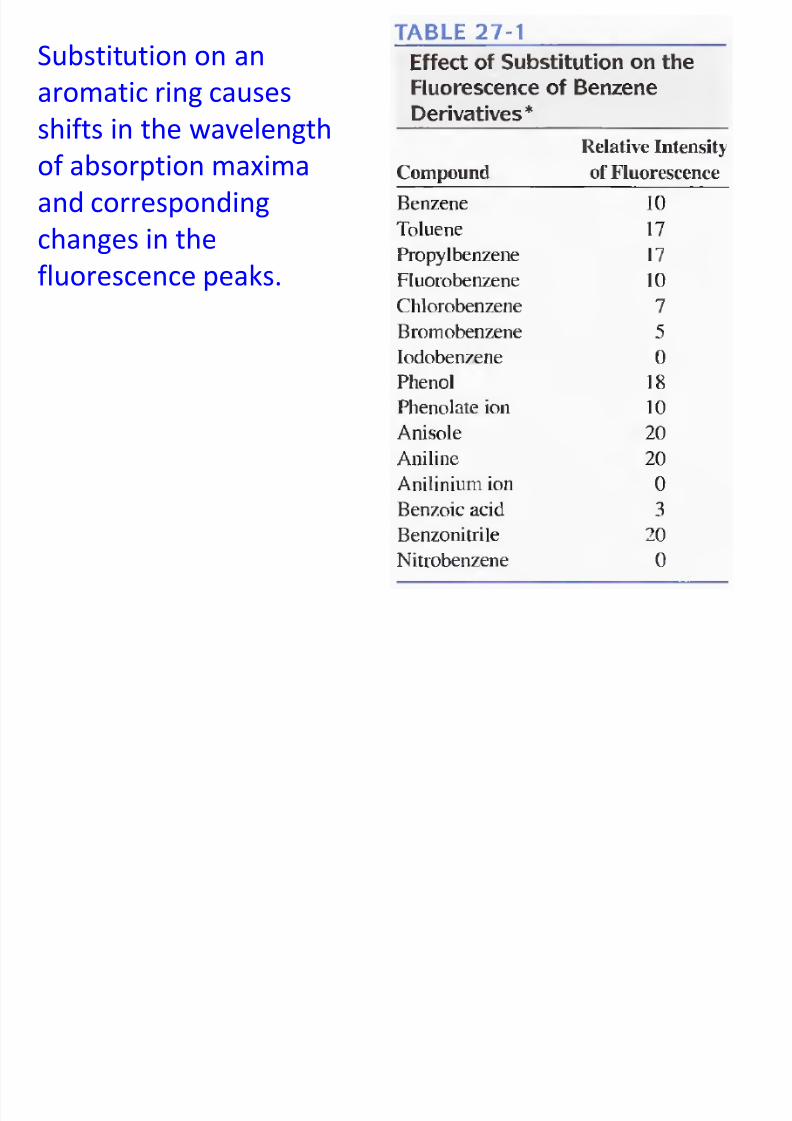
Substitution on an
aromatic ring causes
shifts in the wavelengthof absorption maxima
and corresponding
changes in the
fluorescence peaks.
8/10/2019 9. Fluorescence Spectroscopy
http://slidepdf.com/reader/full/9-fluorescence-spectroscopy 19/30
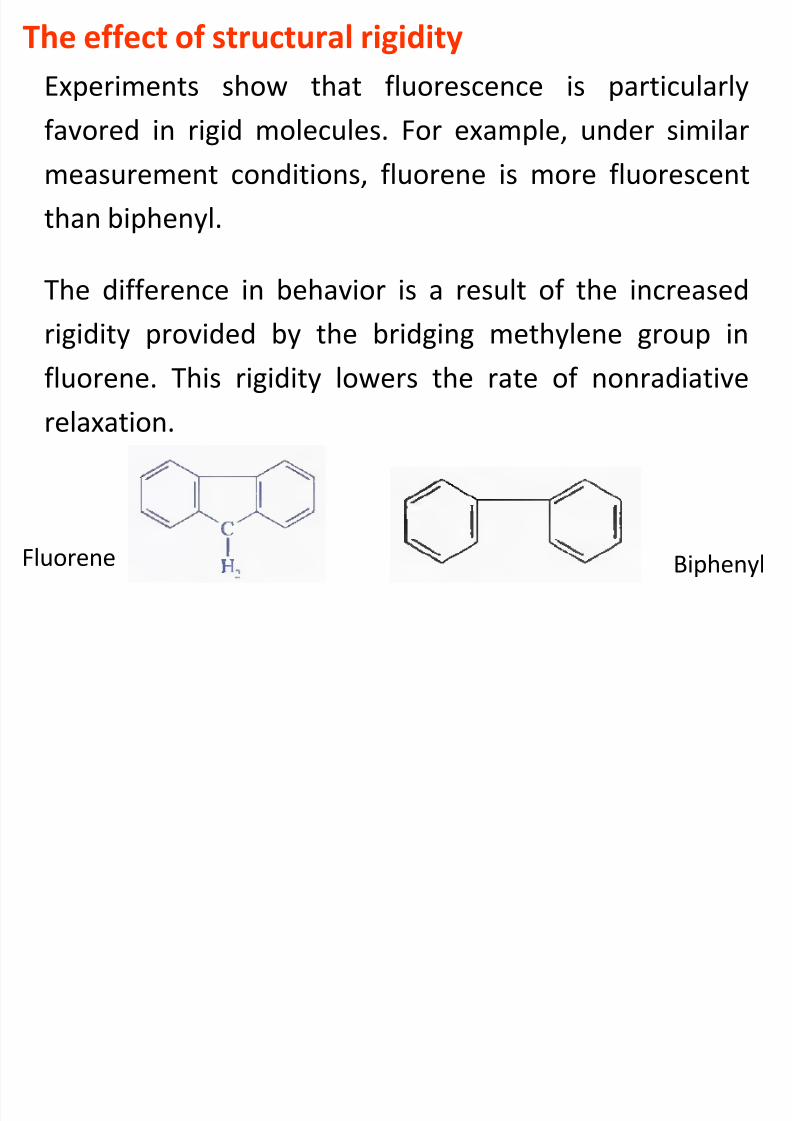
The effect of structural rigidity
Experiments show that fluorescence is particularly
favored in rigid molecules. For example, under similarmeasurement conditions, fluorene is more fluorescent
than biphenyl.
The difference in behavior is a result of the increased
rigidity provided by the bridging methylene group in
fluorene. This rigidity lowers the rate of nonradiative
relaxation.
Fluorene Biphenyl
8/10/2019 9. Fluorescence Spectroscopy
http://slidepdf.com/reader/full/9-fluorescence-spectroscopy 20/30
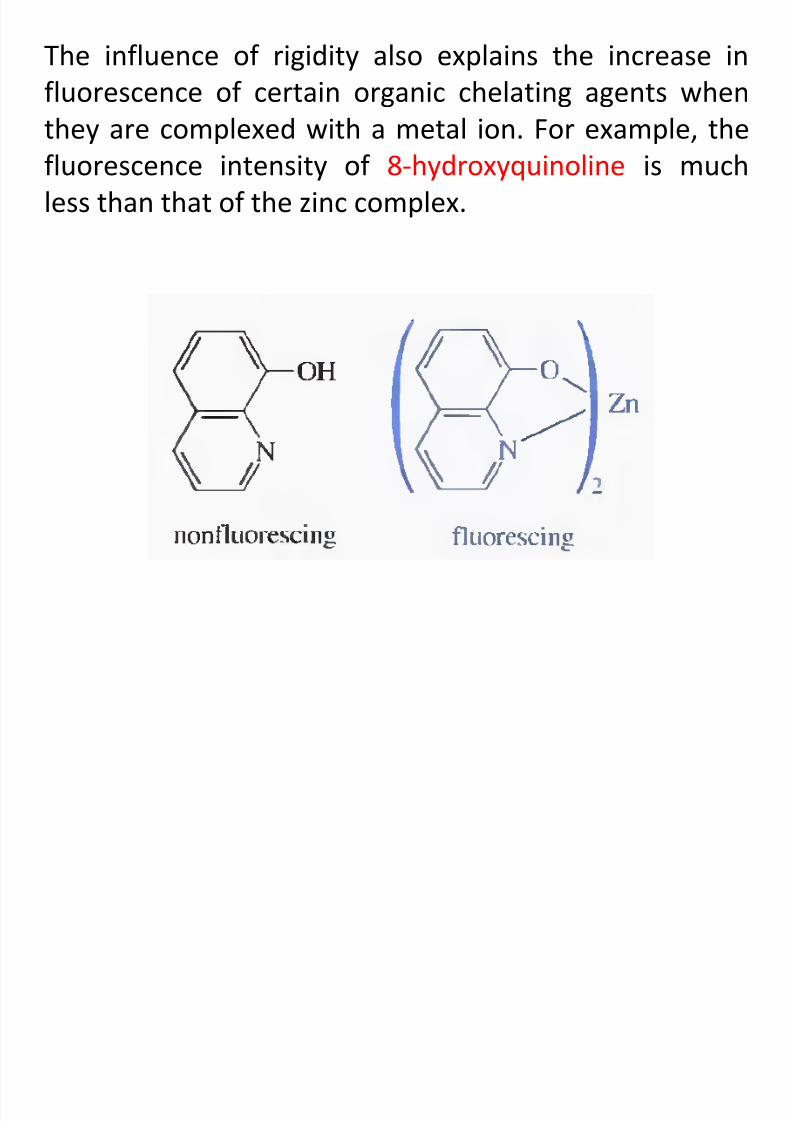
The influence of rigidity also explains the increase in
fluorescence of certain organic chelating agents when
they are complexed with a metal ion. For example, thefluorescence intensity of 8-hydroxyquinoline is much
less than that of the zinc complex.
8/10/2019 9. Fluorescence Spectroscopy
http://slidepdf.com/reader/full/9-fluorescence-spectroscopy 21/30
8/10/2019 9. Fluorescence Spectroscopy
http://slidepdf.com/reader/full/9-fluorescence-spectroscopy 22/30
Fluorescence spectroscopy
Fluorescence spectroscopy (fluorometry or
spectrofluorometry), is a type of electromagnetic
spectroscopy which analyzes fluorescence from a
sample.
It involves using a beam of light, usually ultraviolet light,
that excites the electrons in molecules of certain
compounds and causes them to emit light of a lower
energy, typically, but not necessarily, visible light. This
shift to longer wavelength is called the Stokes shift.
Devices that measure fluorescence are called
fluorometers or fluorimeters.
8/10/2019 9. Fluorescence Spectroscopy
http://slidepdf.com/reader/full/9-fluorescence-spectroscopy 23/30
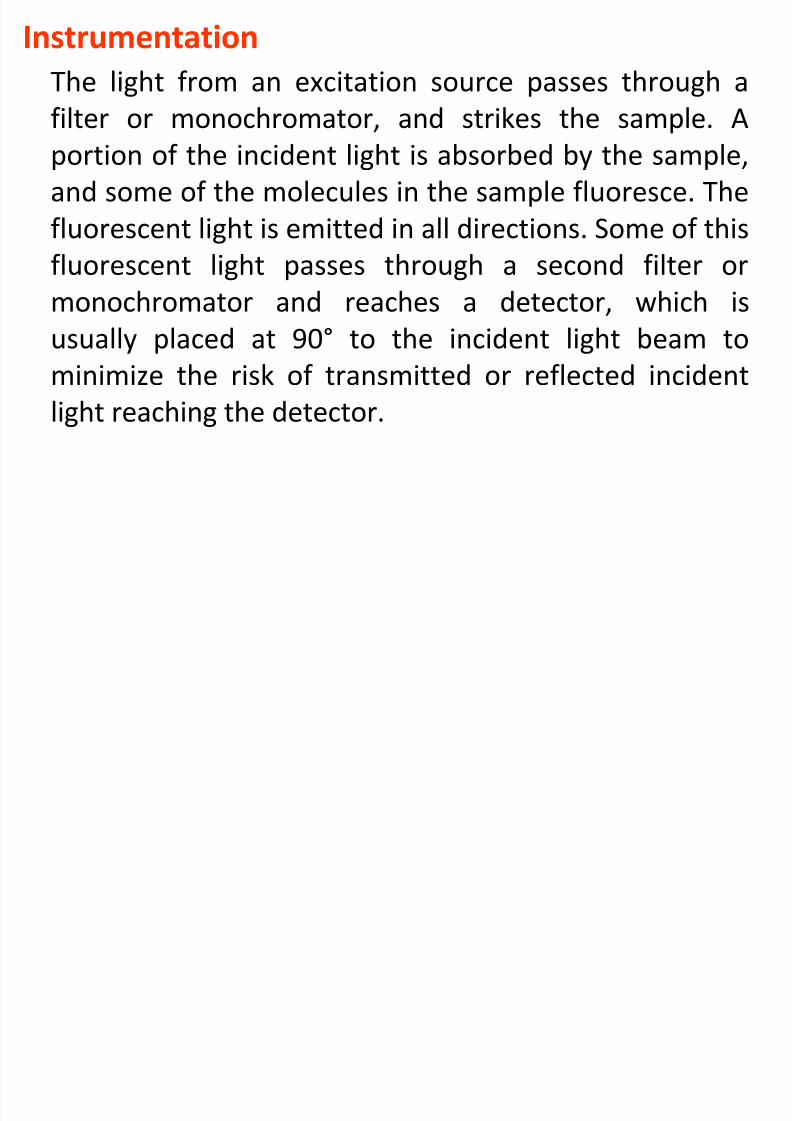
Instrumentation
The light from an excitation source passes through a
filter or monochromator, and strikes the sample. A
portion of the incident light is absorbed by the sample,
and some of the molecules in the sample fluoresce. The
fluorescent light is emitted in all directions. Some of this
fluorescent light passes through a second filter ormonochromator and reaches a detector, which is
usually placed at 90° to the incident light beam to
minimize the risk of transmitted or reflected incident
light reaching the detector.
8/10/2019 9. Fluorescence Spectroscopy
http://slidepdf.com/reader/full/9-fluorescence-spectroscopy 24/30
8/10/2019 9. Fluorescence Spectroscopy
http://slidepdf.com/reader/full/9-fluorescence-spectroscopy 25/30
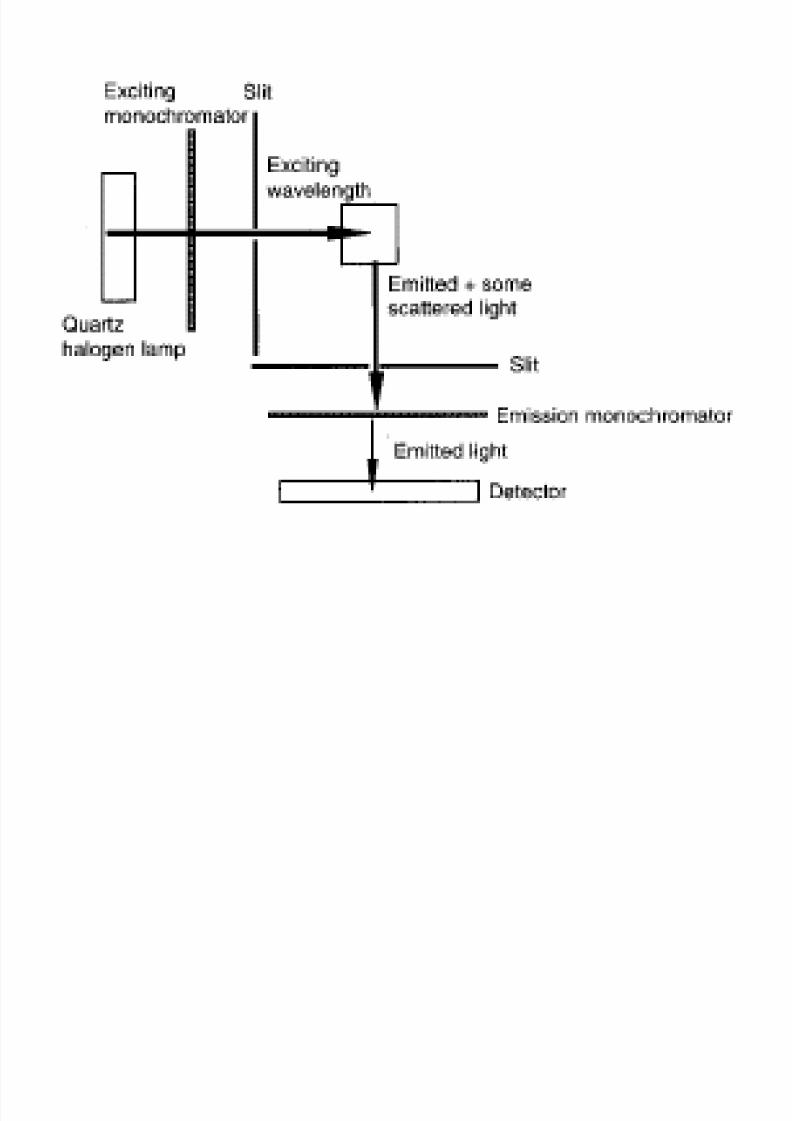
Schematic of a fluorometer with 90° geometry utilizing a Xe light source
8/10/2019 9. Fluorescence Spectroscopy
http://slidepdf.com/reader/full/9-fluorescence-spectroscopy 26/30
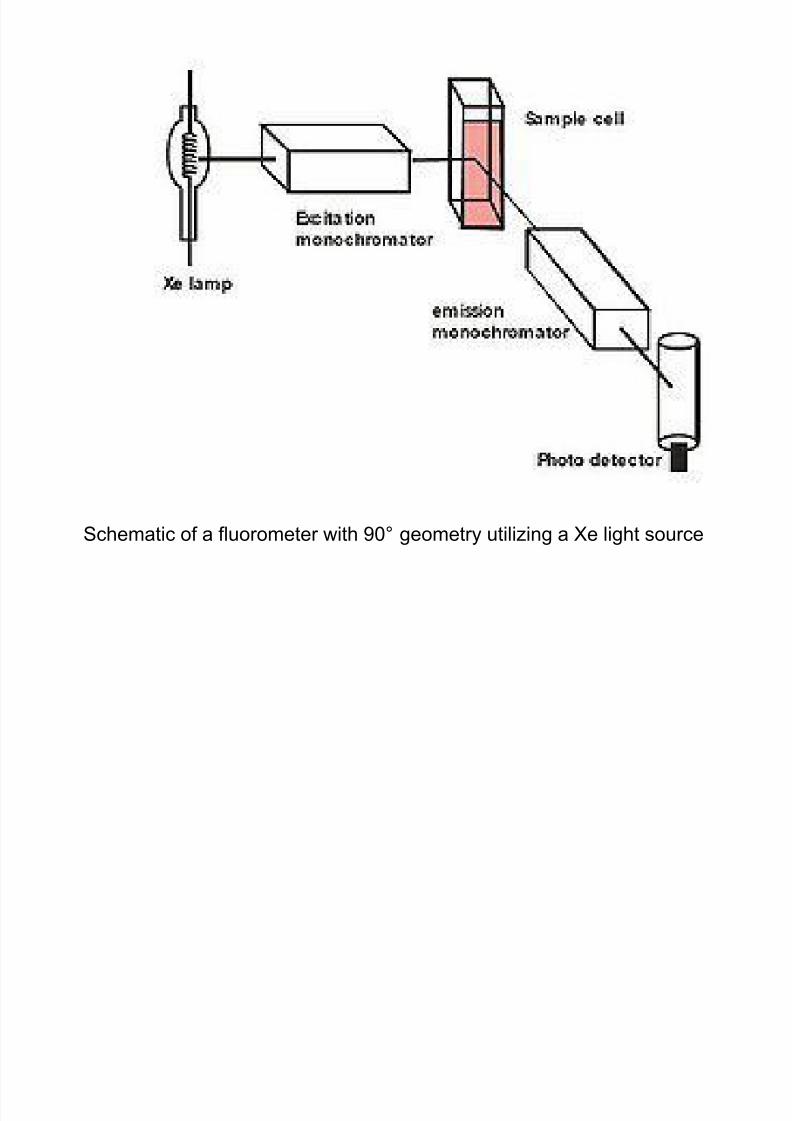
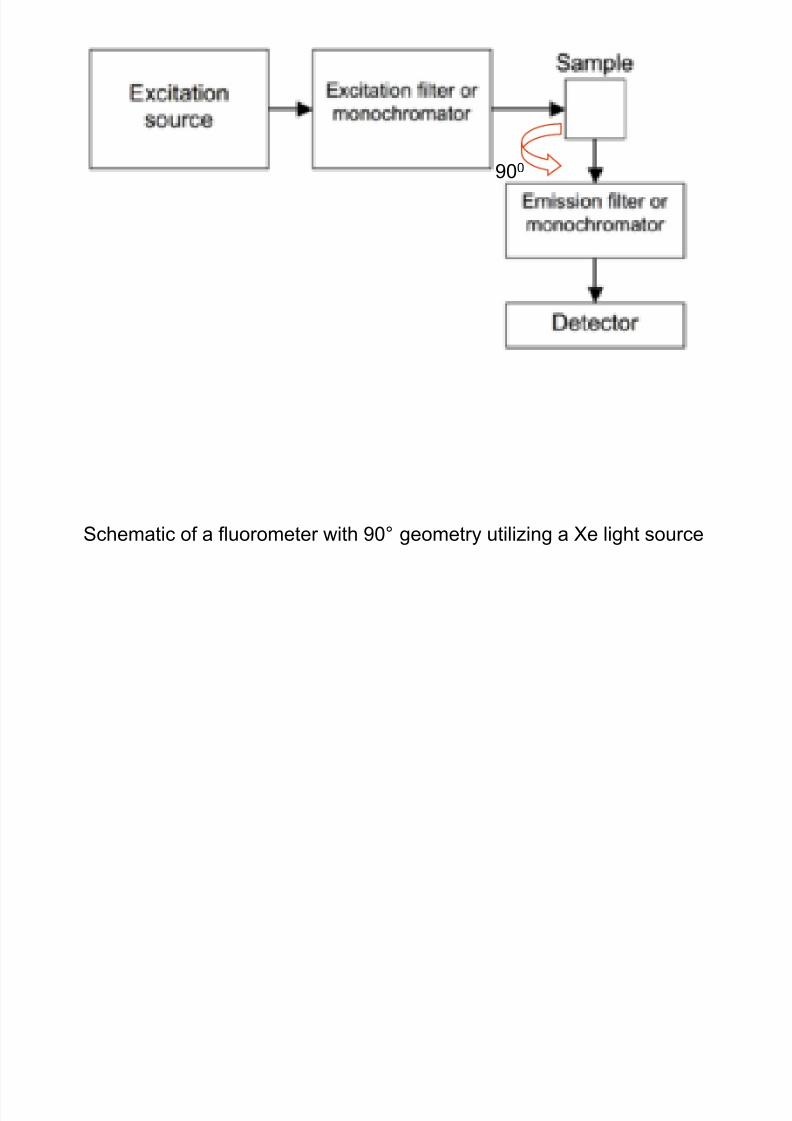
Schematic of a fluorometer with 90° geometry utilizing a Xe light source
900
8/10/2019 9. Fluorescence Spectroscopy
http://slidepdf.com/reader/full/9-fluorescence-spectroscopy 27/30
Light source
Xenon lamps
Filters and/or monochromatorsThe most common type of monochromator utilizes a
diffraction grating.
8/10/2019 9. Fluorescence Spectroscopy
http://slidepdf.com/reader/full/9-fluorescence-spectroscopy 28/30
Application
1. Determination of fluorescent drugs in low-dose
formulations in the presence of non-fluorescent
excipients.
2. In carrying out the limit tests where the impurity is
fluorescent.
3. Useful for studying the binding of drugs to componentin complex formulations.
4. Widely used in bioanalysis for measuring small
amounts of drug and for studying drug-protein binding.
8/10/2019 9. Fluorescence Spectroscopy
http://slidepdf.com/reader/full/9-fluorescence-spectroscopy 29/30
Factors interfering with fluorescence intensity
1. If the concentration of a solution prepared forfluorescence measurement is too high, some of the light
emitted by the sample as fluorescence will be reabsorbed
by other unexcited molecules in solution.
For this reason, fluorescence measurements are bestmade on solutions with an absorbance less than 0.02, i.e.
solutions of a sample 10-100 weaker than those which
would be used for measurement by UV-VIS spectroscopy.
8/10/2019 9. Fluorescence Spectroscopy
http://slidepdf.com/reader/full/9-fluorescence-spectroscopy 30/30
2. Heavy atoms in solution quench fluorescence by
colliding with excited molecules so that energy is
dissipated, e.g. chloride or bromide ions in solution cause
collisional quenching.
3. Formation of chemical complex with other molecules
in solution can change fluorescence behavior, e.g. the
presence of caffeine in solution reduces the fluorescenceof riboflavin.
4. In most molecules, fluorescent property decreases
with increasing temperature because the increased
frequency of collision at elevated temperatures increases
the probability of collisional relaxation. A decrease in
solvent viscosity leads to the same result.