Embed Size (px)
Citation preview
A Case for Battery Charging-Aware Power Management and Deferrable Task Scheduling in
SmartphonesSalma Elmalaki, Mark Gottscho, Puneet Gupta and Mani Srivastava
!Networked & Embedded System Laboratory
NanoCAD Laboratory University of California, Los Angeles
NanoCAD LAB
NanoCAD LAB
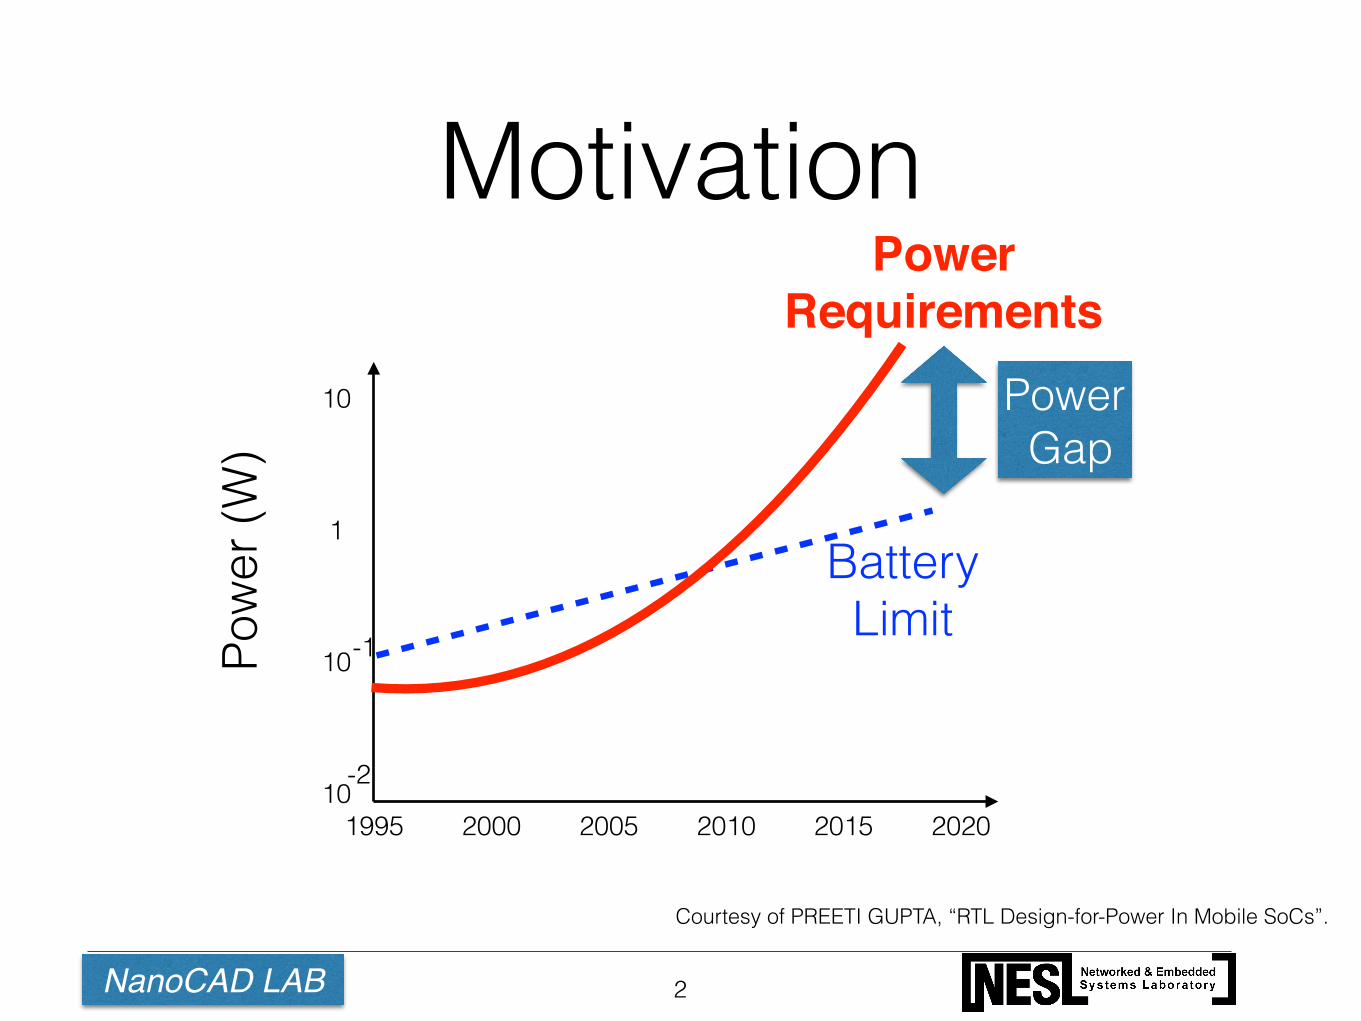
Motivation
2
Courtesy of PREETI GUPTA, “RTL Design-for-Power In Mobile SoCs”.
Power Requirements
Battery Limit
Power Gap
1995 2000 2005 2010 2015 202010
10
1
10
Pow
er (W
)
-1
-2
NanoCAD LAB
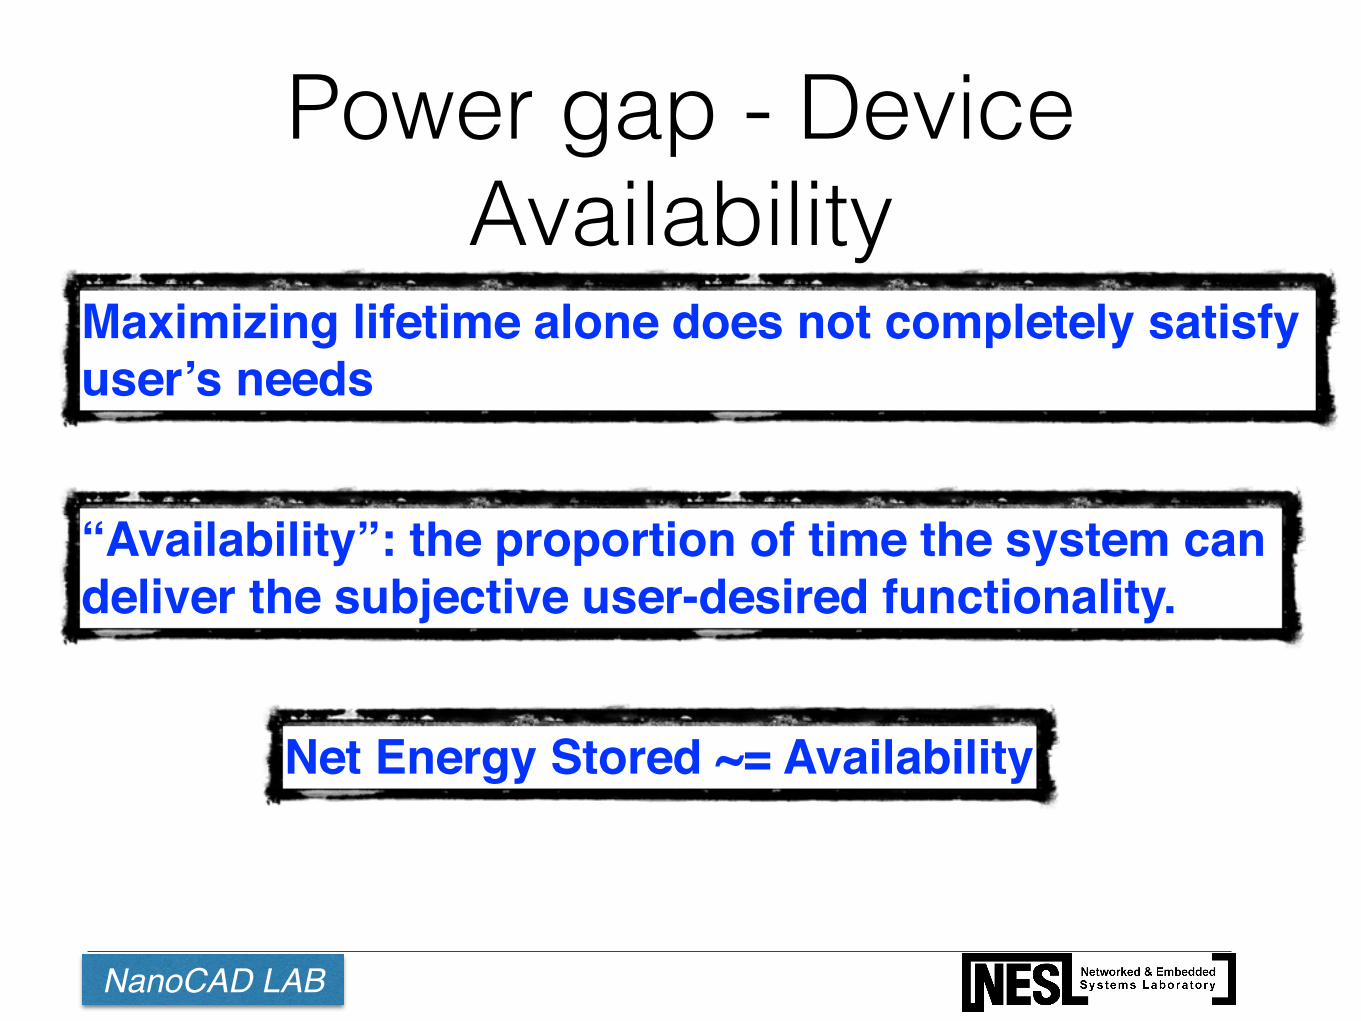
Power gap - Device Availability
“Availability”: the proportion of time the system can deliver the subjective user-desired functionality.
Net Energy Stored ~= Availability
Maximizing lifetime alone does not completely satisfy user’s needs
NanoCAD LAB
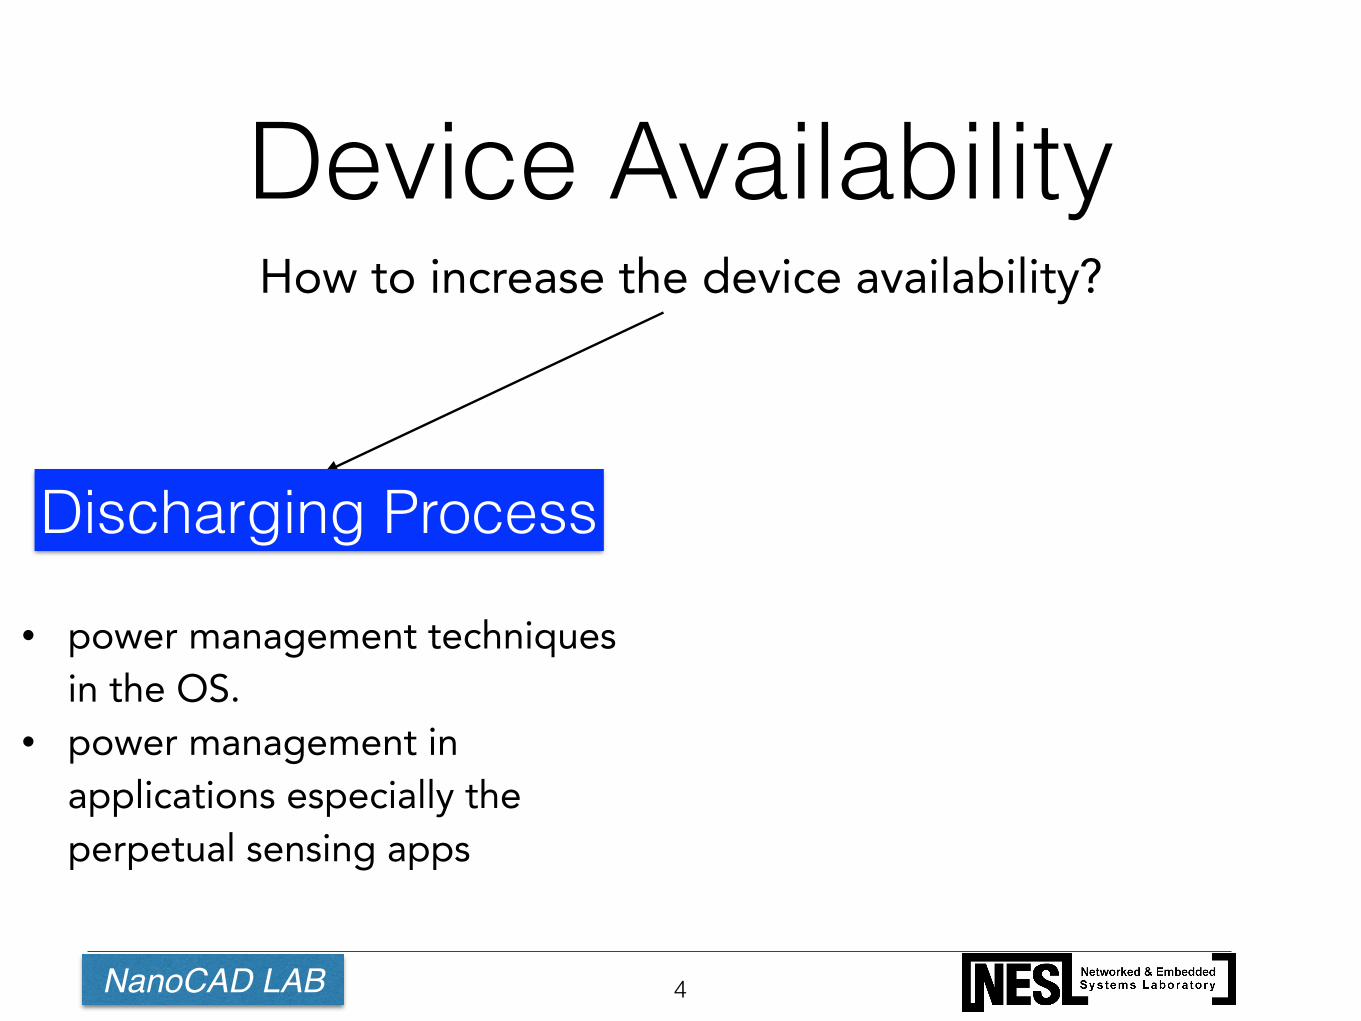
Device Availability
4
How to increase the device availability?
Discharging Process
• power management techniques in the OS.
• power management in applications especially the perpetual sensing apps
NanoCAD LAB
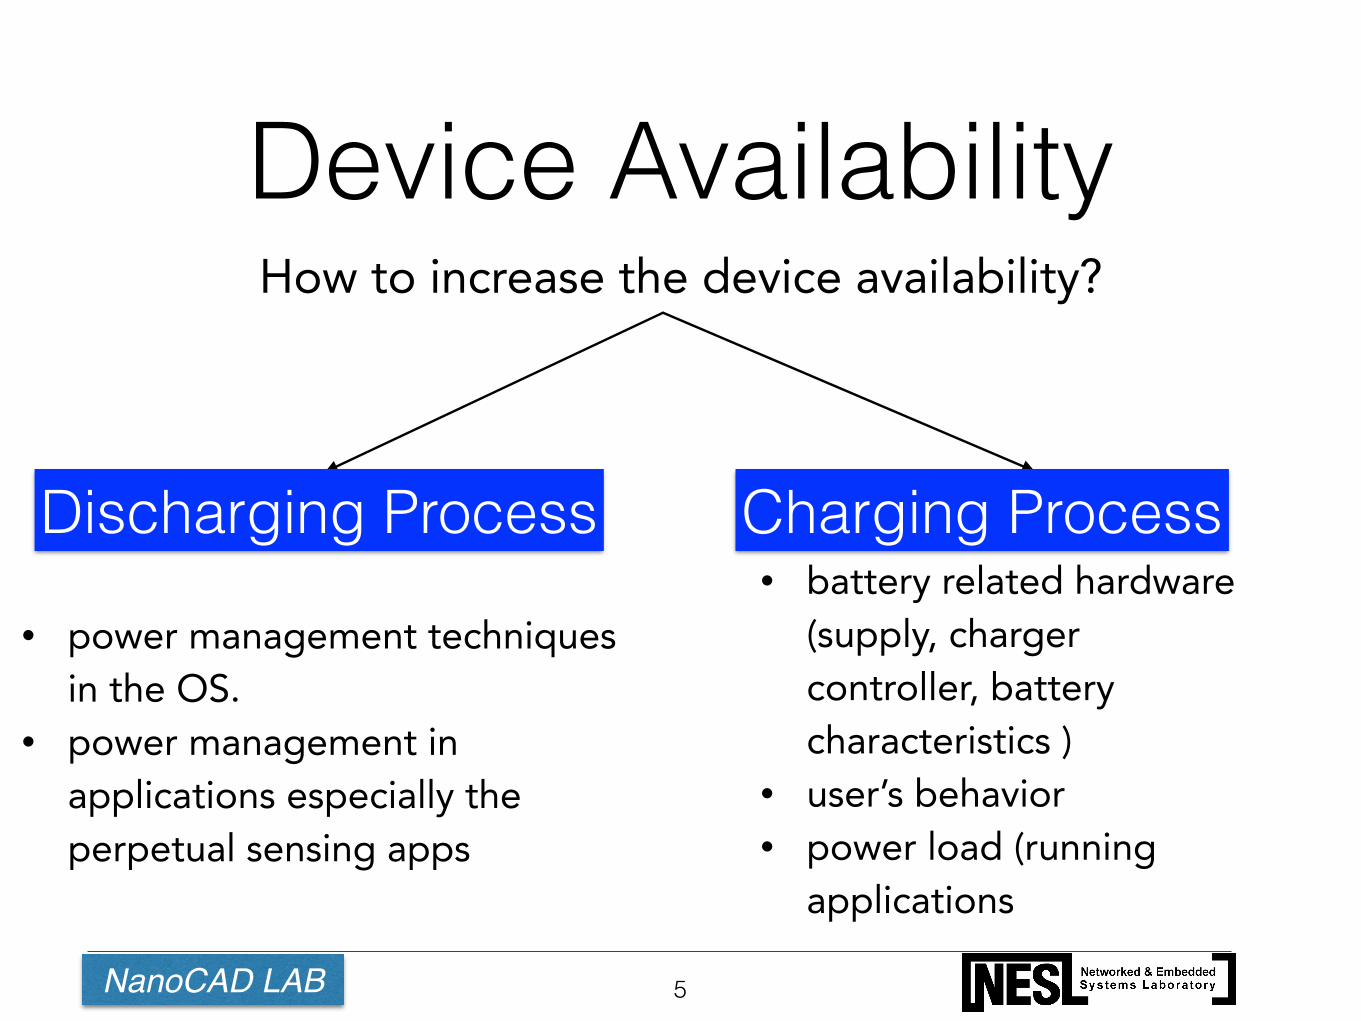
Device Availability
5
How to increase the device availability?
Discharging Process Charging Process
• power management techniques in the OS.
• power management in applications especially the perpetual sensing apps
• battery related hardware (supply, charger controller, battery characteristics )
• user’s behavior • power load (running
applications
NanoCAD LAB
Is it possible we can control the charging process in a way to increase the net energy gained by the end of the charging event?
6
NanoCAD LAB
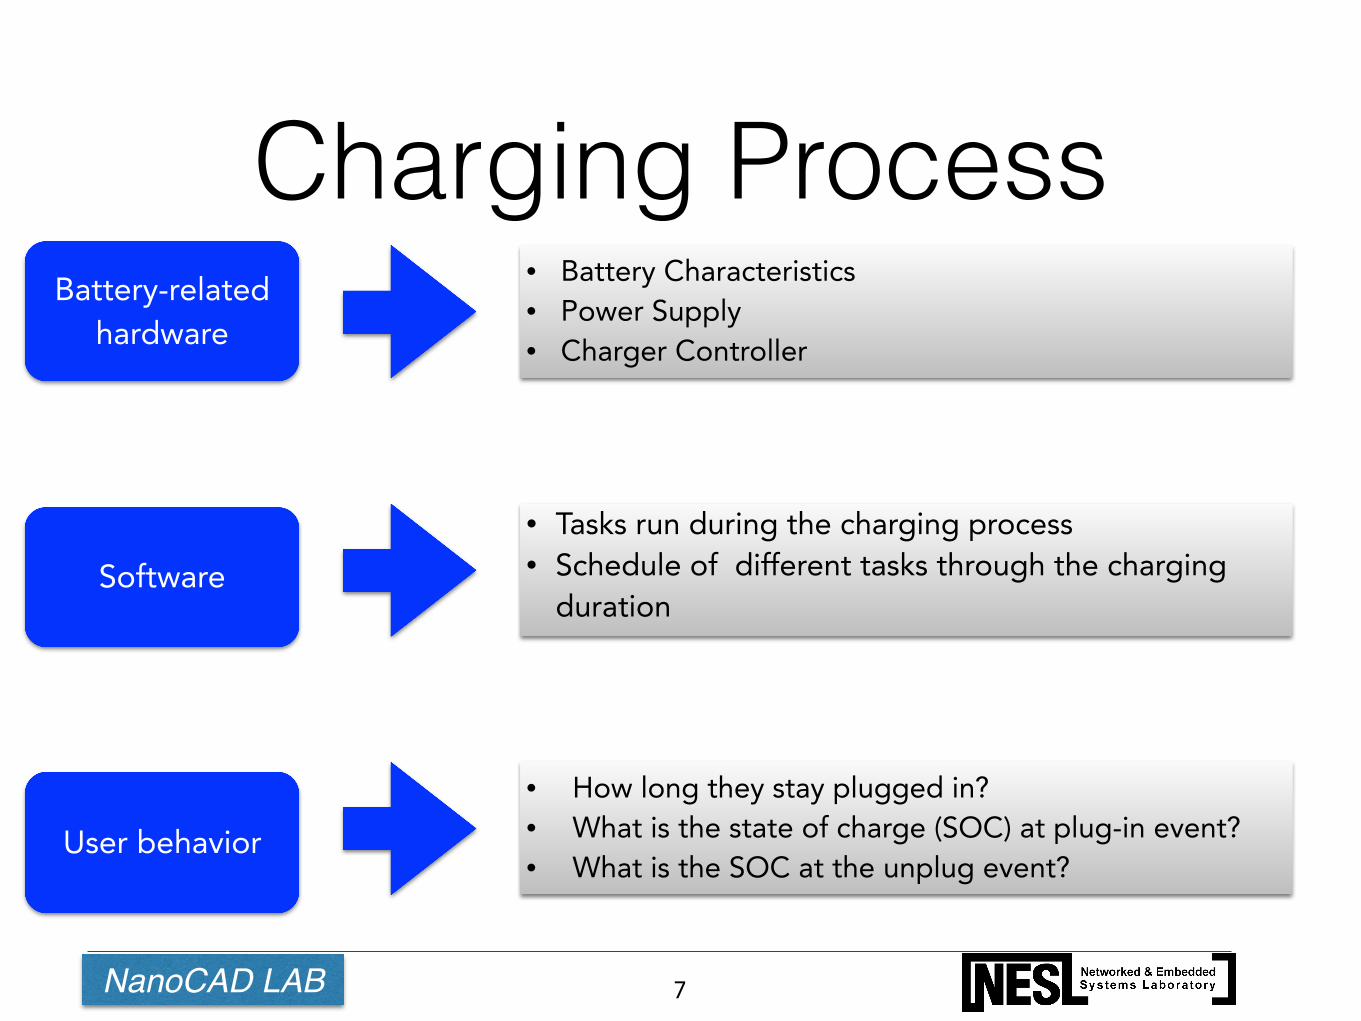
Charging Process
7
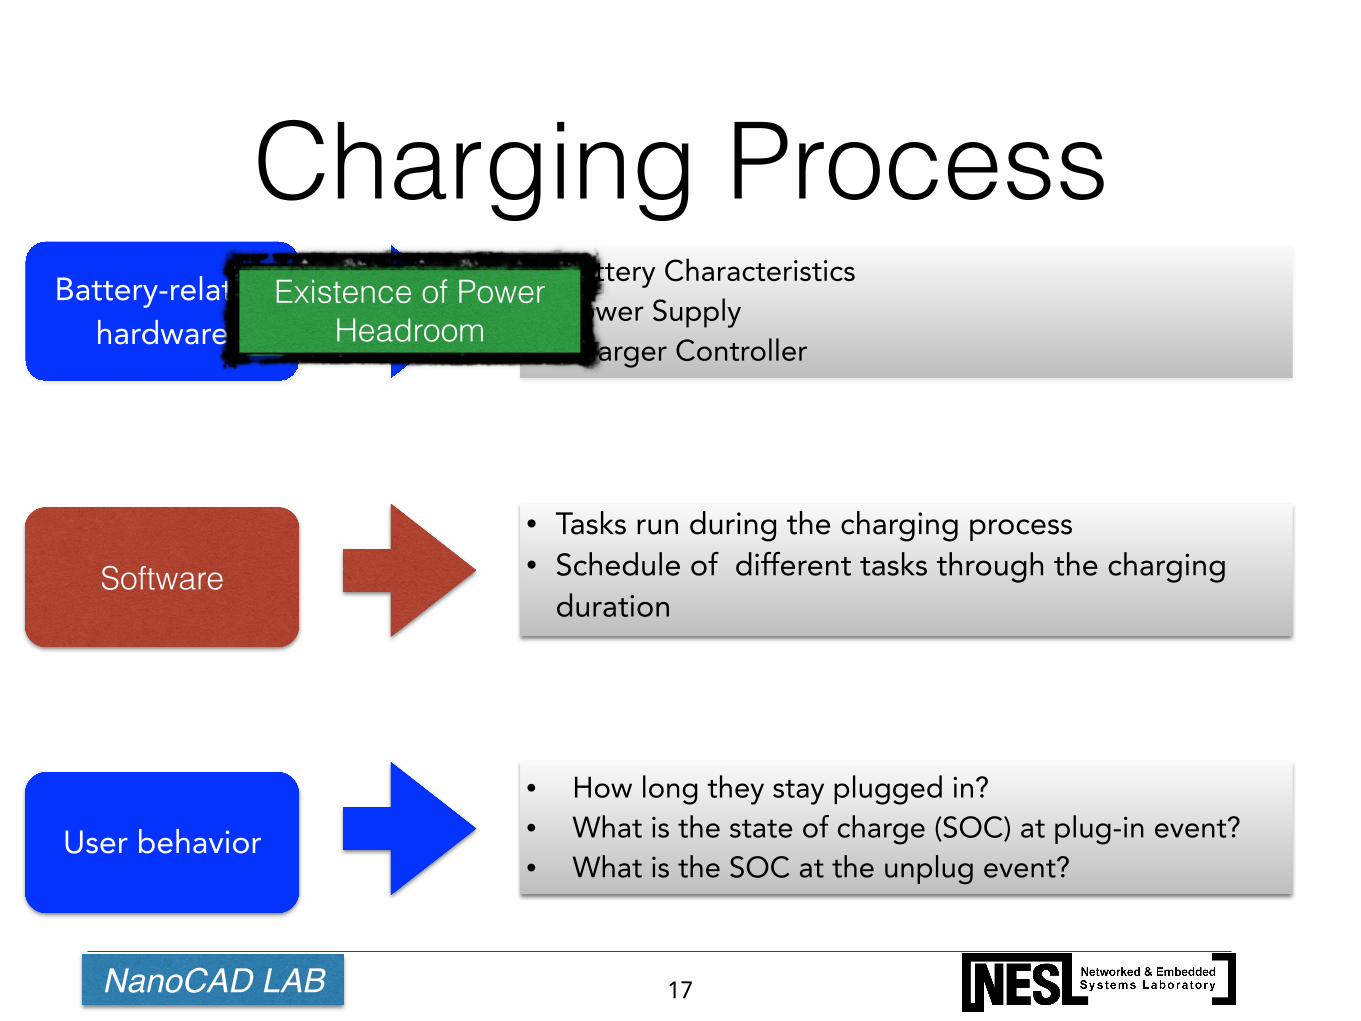
Battery-related hardware
Software
• Battery Characteristics • Power Supply • Charger Controller
• Tasks run during the charging process • Schedule of different tasks through the charging
duration
User behavior
• How long they stay plugged in? • What is the state of charge (SOC) at plug-in event? • What is the SOC at the unplug event?
Part 1: Battery Related Hardware (Charging Characteristics)
NanoCAD LAB
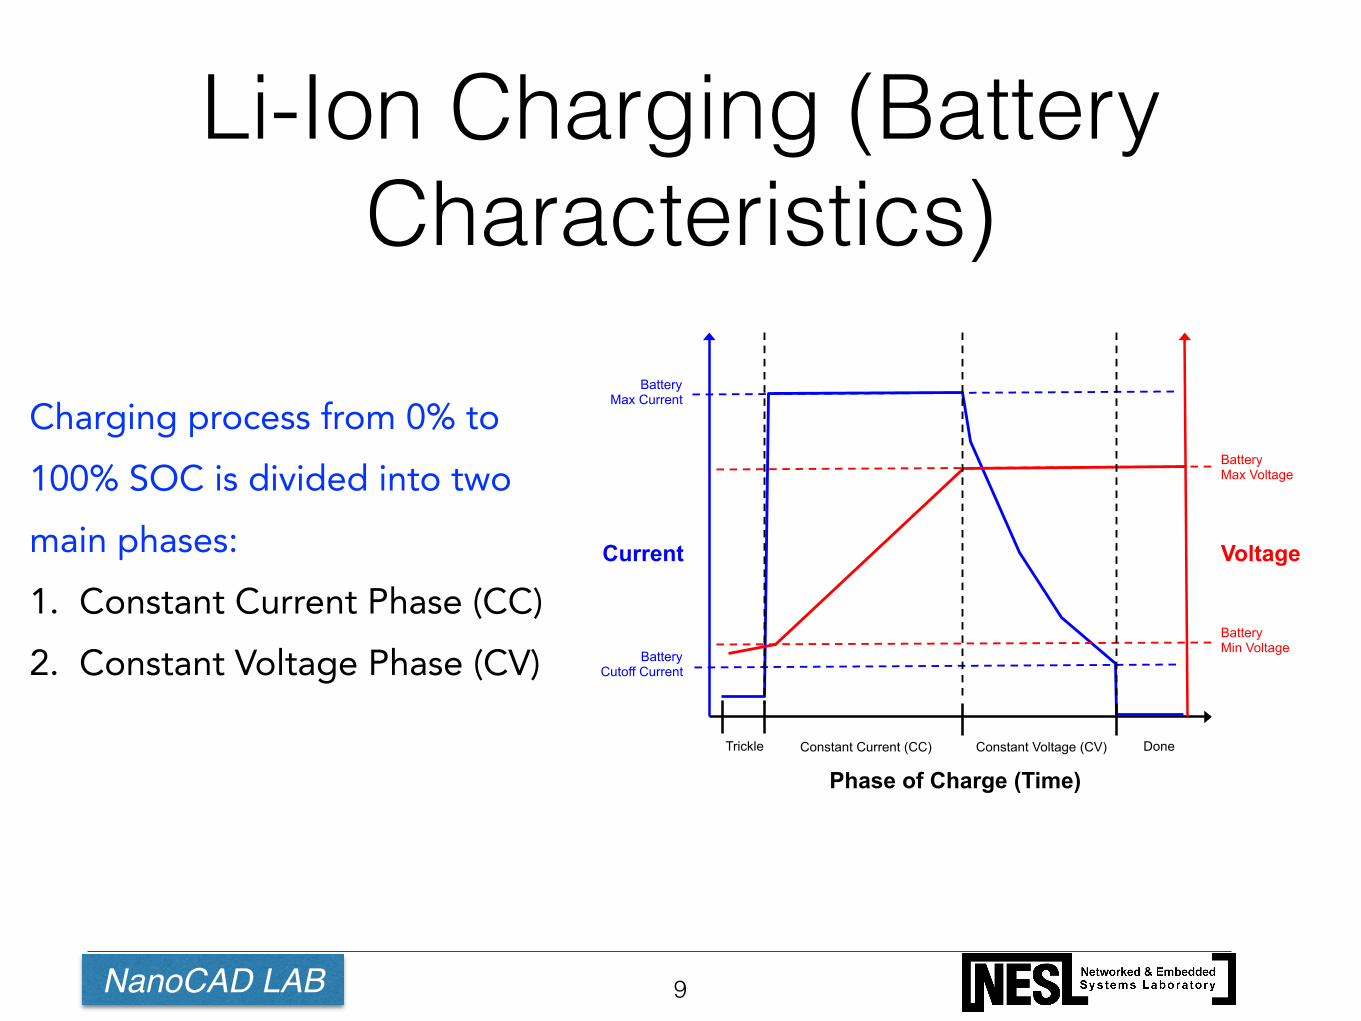
Li-Ion Charging (Battery Characteristics)
9
Voltage Current
Phase of Charge (Time)
Trickle Constant Current (CC) Constant Voltage (CV) Done
Battery Cutoff Current
Battery Max Current
Battery Min Voltage
Battery Max Voltage
NOTES: Plot not to scale.
Arbitrary units.
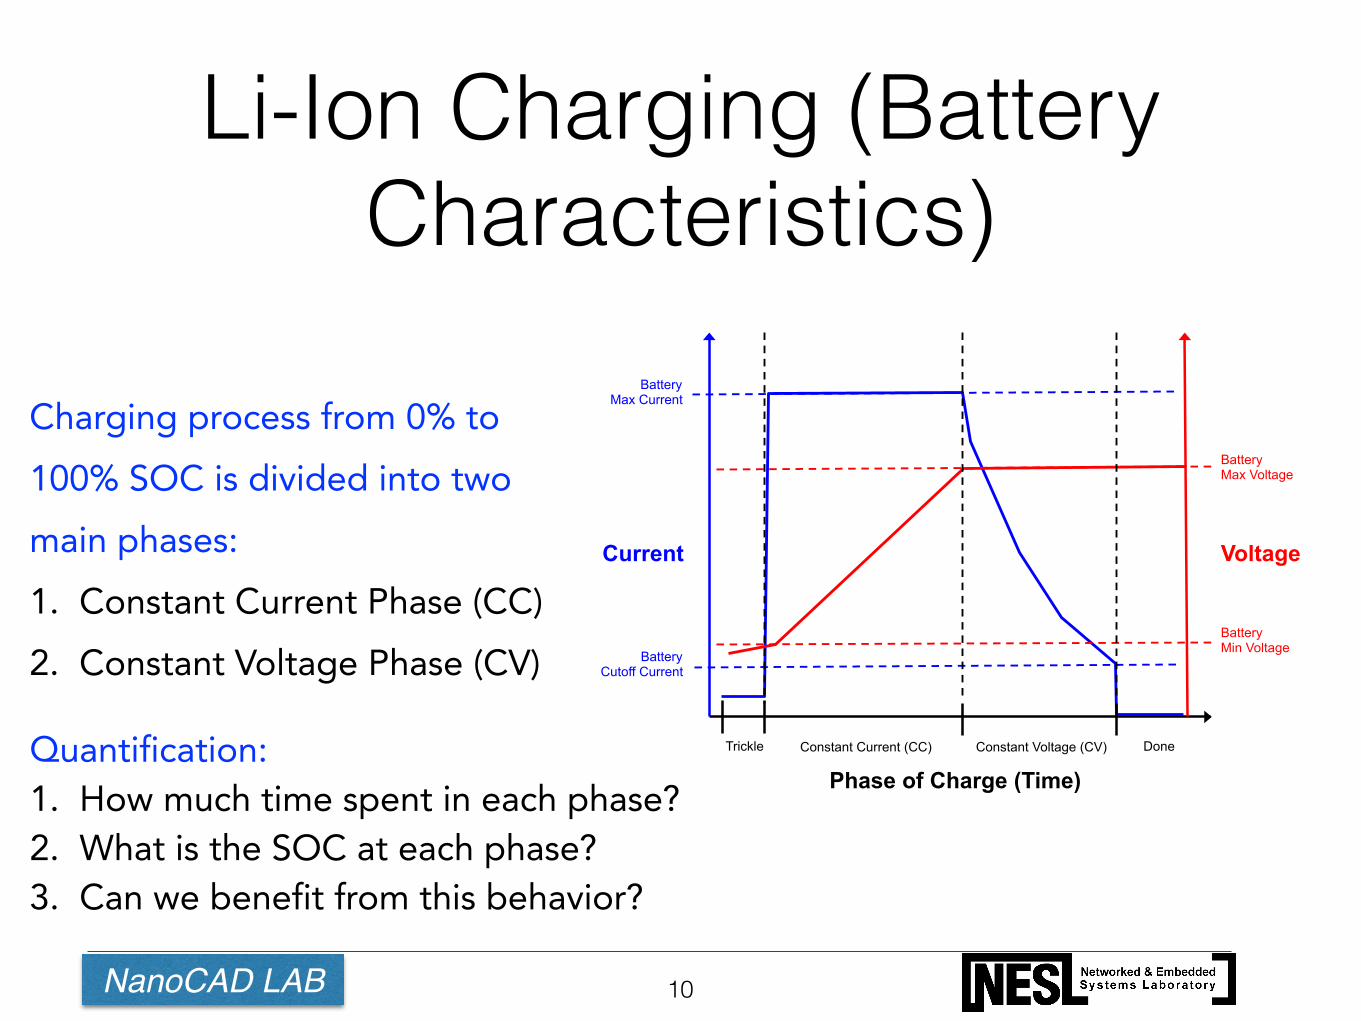
Charging process from 0% to 100% SOC is divided into two main phases: 1. Constant Current Phase (CC) 2. Constant Voltage Phase (CV)
NanoCAD LAB
Li-Ion Charging (Battery Characteristics)
10
Voltage Current
Phase of Charge (Time)
Trickle Constant Current (CC) Constant Voltage (CV) Done
Battery Cutoff Current
Battery Max Current
Battery Min Voltage
Battery Max Voltage
NOTES: Plot not to scale.
Arbitrary units.
Charging process from 0% to 100% SOC is divided into two main phases: 1. Constant Current Phase (CC) 2. Constant Voltage Phase (CV)
Quantification: 1. How much time spent in each phase? 2. What is the SOC at each phase? 3. Can we benefit from this behavior?
NanoCAD LAB
Smartphone Charging Profile
11
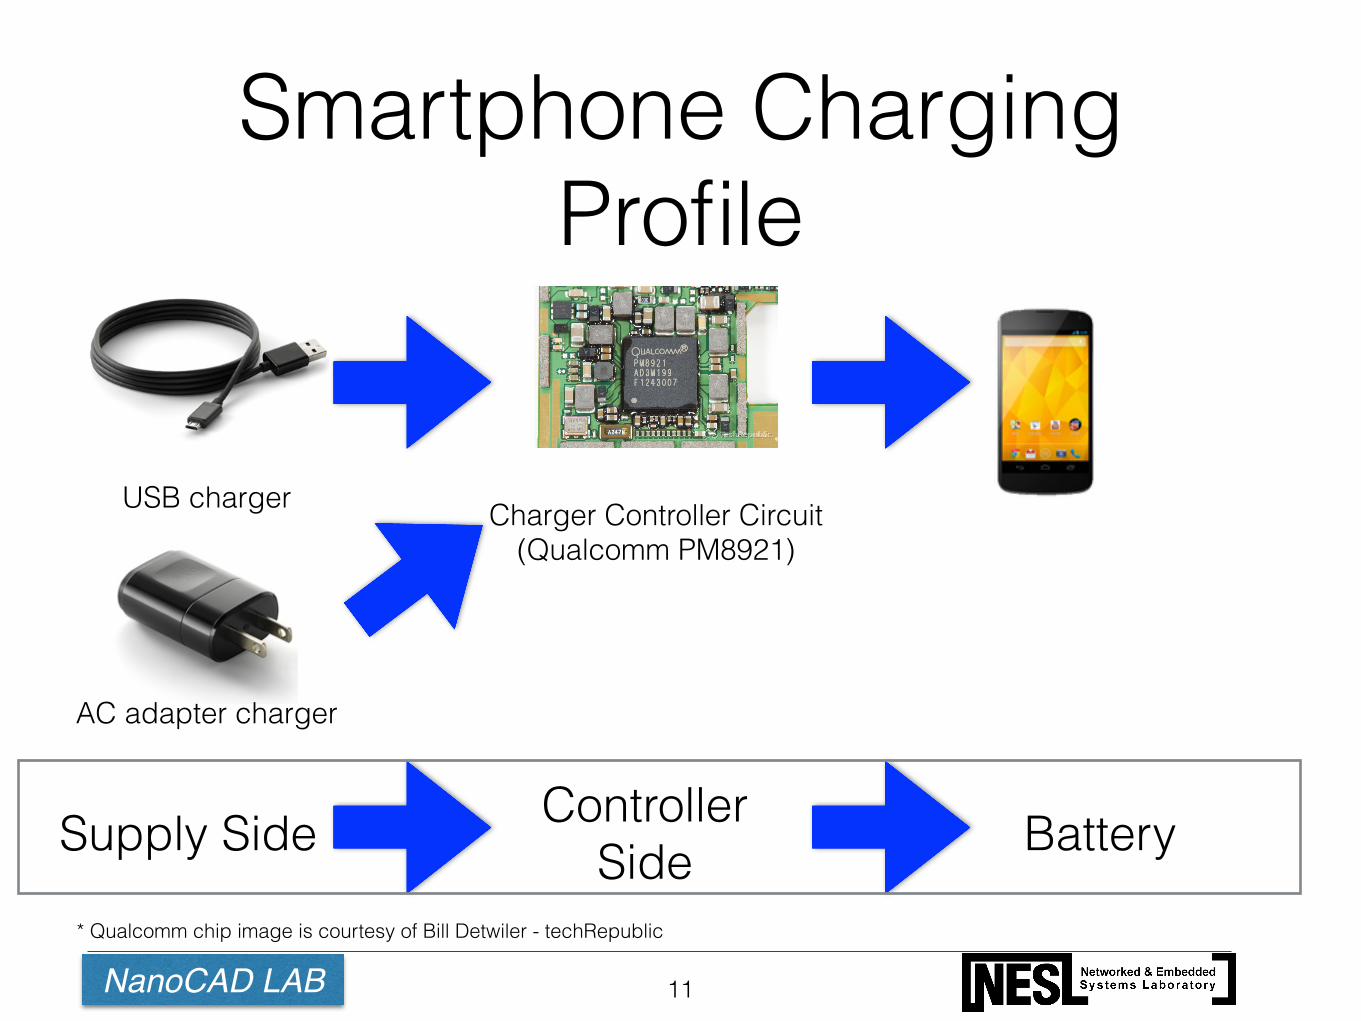
* Qualcomm chip image is courtesy of Bill Detwiler - techRepublic
Charger Controller Circuit (Qualcomm PM8921)
USB charger
AC adapter charger
Supply Side Controller Side Battery
NanoCAD LAB
Smartphone Charging Profile
12
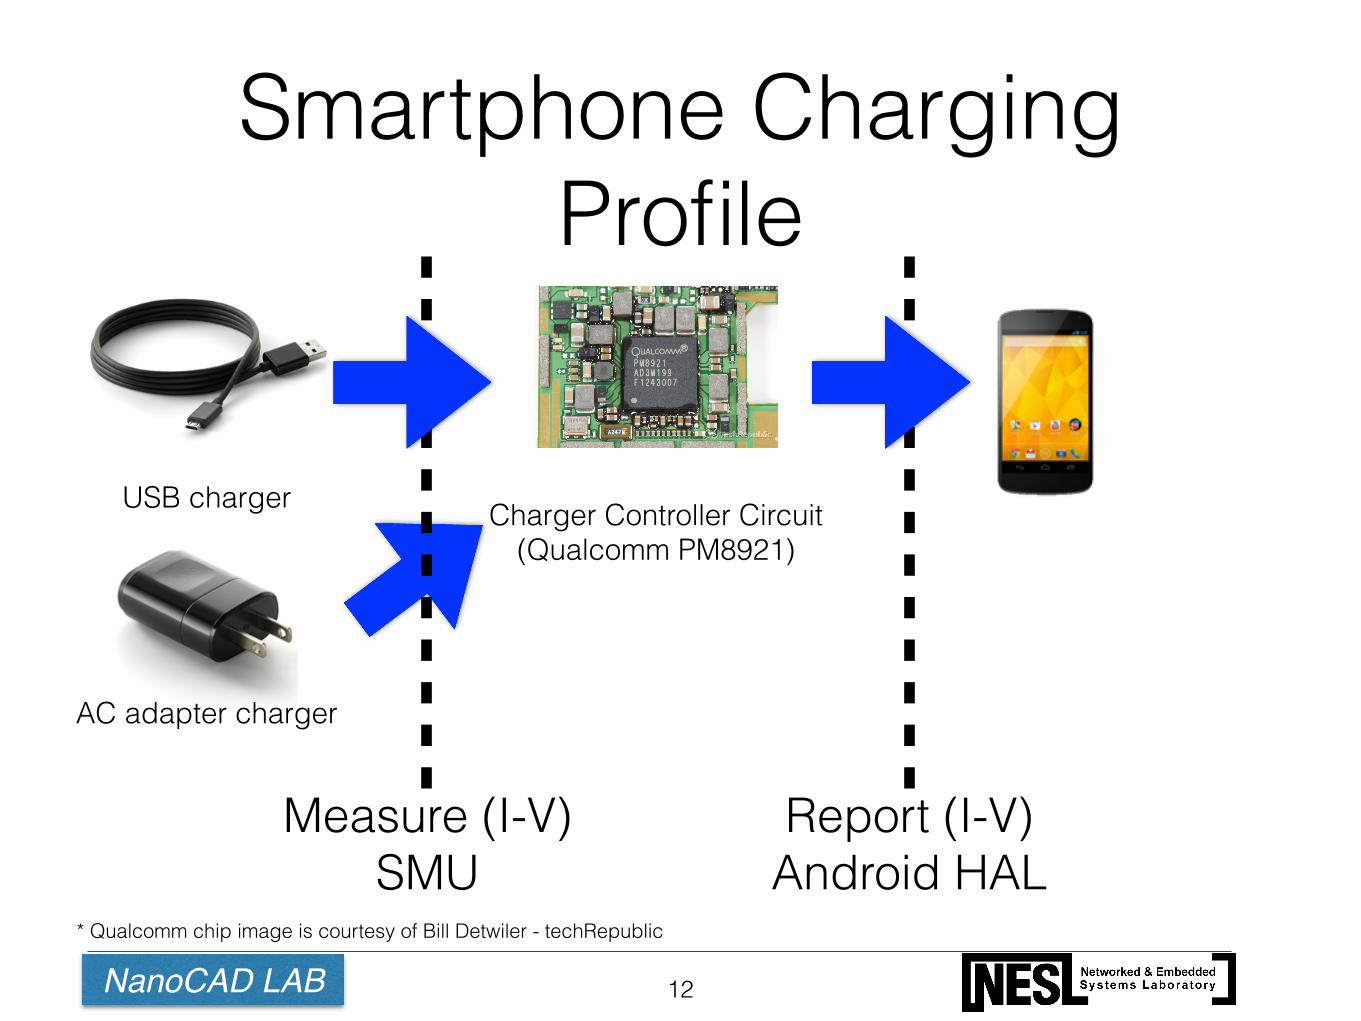
* Qualcomm chip image is courtesy of Bill Detwiler - techRepublic
Charger Controller Circuit (Qualcomm PM8921)
USB charger
AC adapter charger
Report (I-V)Android HAL
Measure (I-V)SMU
NanoCAD LAB
Smartphone Charging Profile (USB cable)
13
0 2 4 60.2
0.3
0.4
0.5
time (hr)
Cur
rent
(A)
0 2 4 6 1
2
3
4
5
6Vo
ltage
(V)
0 2 4 60
0.1
0.2
0.3
0.4
0.5
time (hr)
Cur
rent
(A)
0 2 4 6 0
20
40
60
80
100
Batte
ry C
apac
ity (%
)
0 2 4 60
0.1
0.2
0.3
0.4
0.5
time (hr)
Cur
rent
(A)
0 2 4 6 3.6
3.8
4
4.2
4.4
4.6
Volta
ge (V
)
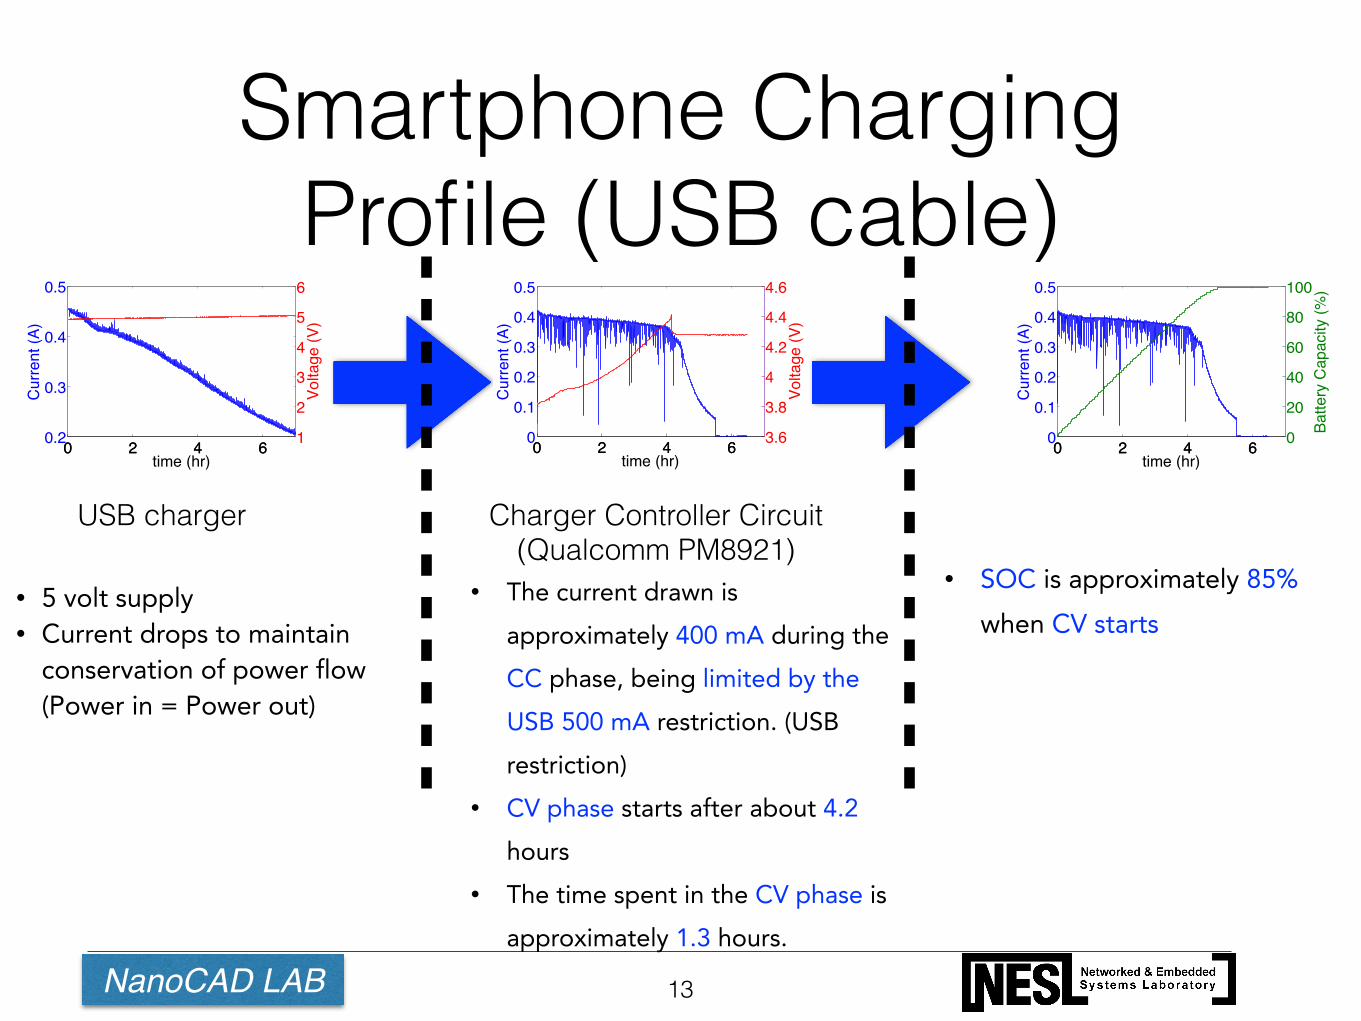
Charger Controller Circuit (Qualcomm PM8921)
USB charger
• The current drawn is approximately 400 mA during the CC phase, being limited by the USB 500 mA restriction. (USB restriction)
• CV phase starts after about 4.2 hours
• The time spent in the CV phase is approximately 1.3 hours.
• SOC is approximately 85% when CV starts
• 5 volt supply • Current drops to maintain
conservation of power flow (Power in = Power out)
NanoCAD LAB
Is there an opportunity to increase availability from the charging profile?
14
NanoCAD LAB
Power Headroom
15
0 2 4 60
0.1
0.2
0.3
0.4
0.5
time (hr)
Cur
rent
(A)
0 2 4 6 3.6
3.8
4
4.2
4.4
4.6
Volta
ge (V
)
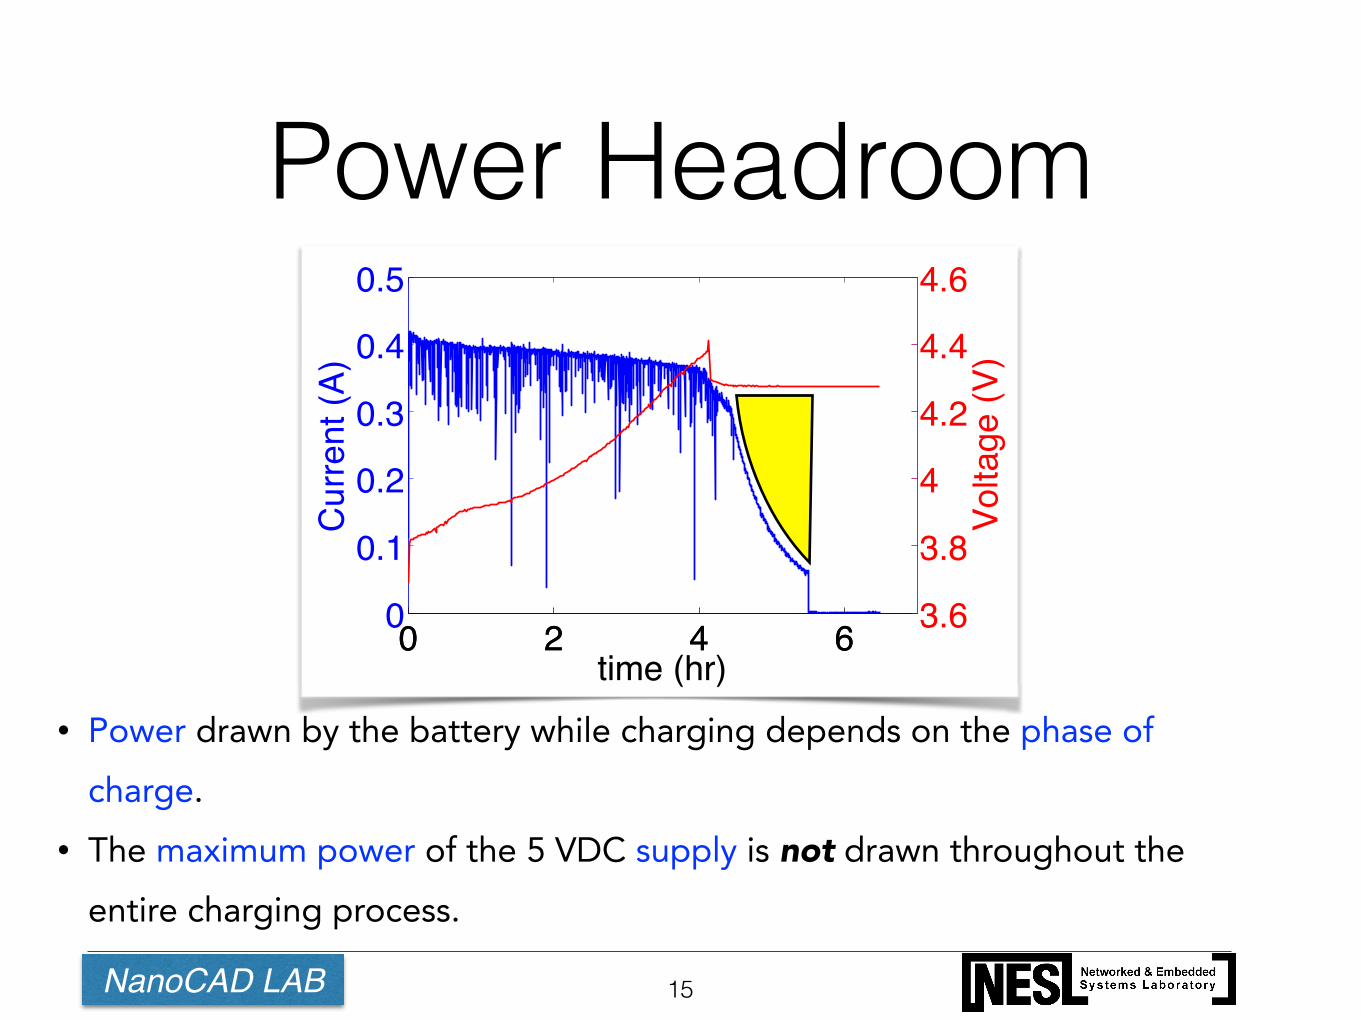
• Power drawn by the battery while charging depends on the phase of charge.
• The maximum power of the 5 VDC supply is not drawn throughout the entire charging process.
NanoCAD LAB
Power Headroom
16
Voltage Current
Phase of Charge (Time)
Trickle Constant Current (CC) Constant Voltage (CV) Done
Battery Cutoff Current
Battery Max Current
Battery Min Voltage
Battery Max Voltage
NOTES: Plot not to scale.
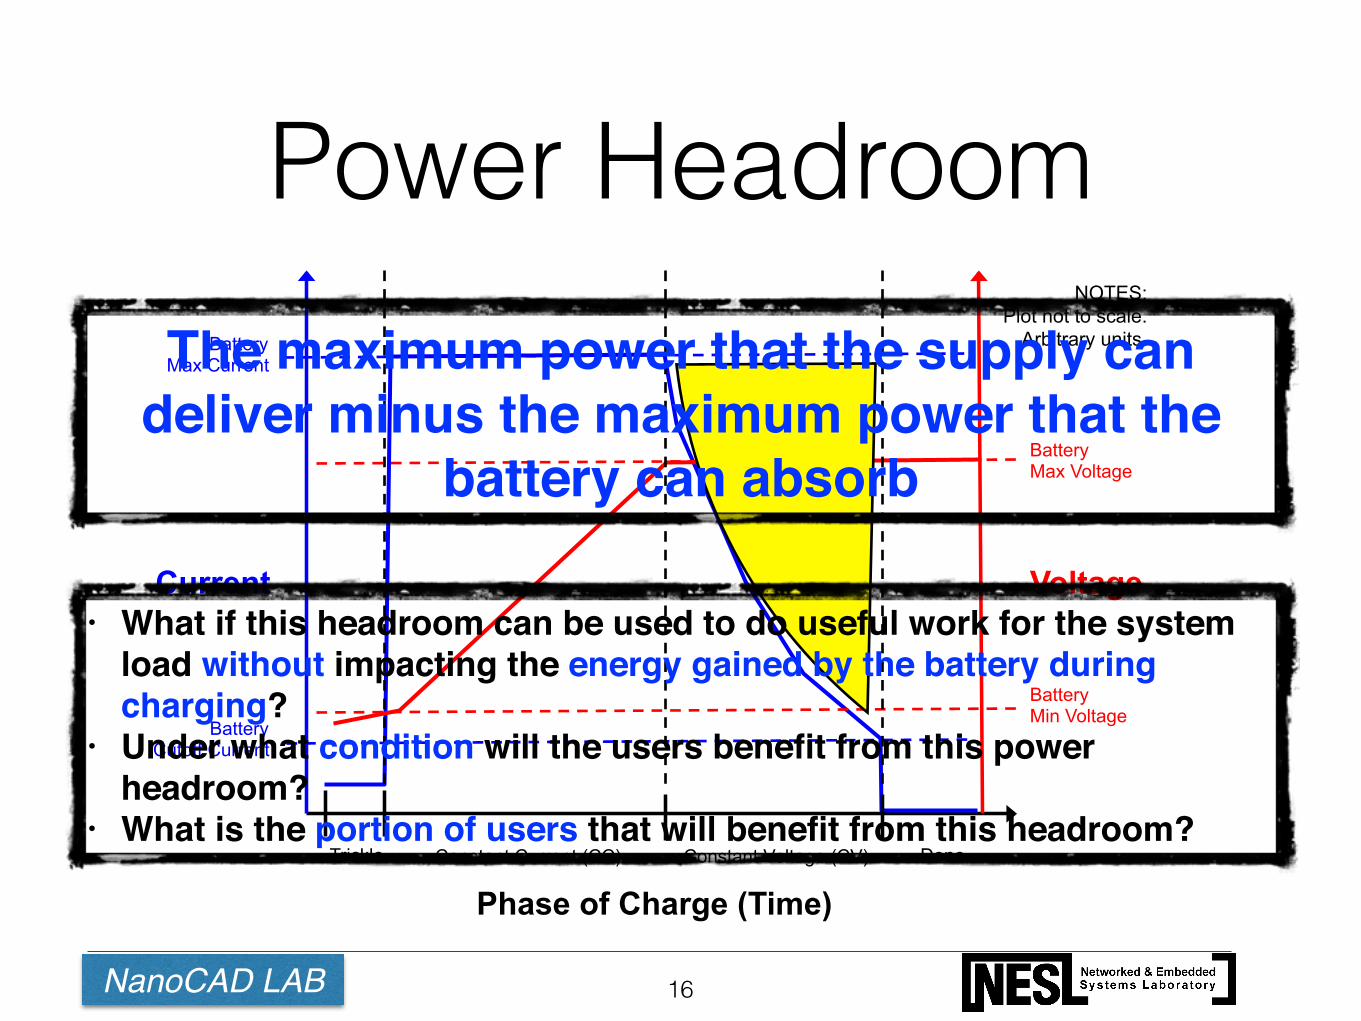
Arbitrary units. The maximum power that the supply can deliver minus the maximum power that the
battery can absorb
• What if this headroom can be used to do useful work for the system load without impacting the energy gained by the battery during charging?!
• Under what condition will the users benefit from this power headroom? !
• What is the portion of users that will benefit from this headroom?
NanoCAD LAB
Charging Process
17
Battery-related hardware
Software
• Battery Characteristics • Power Supply • Charger Controller
• Tasks run during the charging process • Schedule of different tasks through the charging
duration
User behavior
• How long they stay plugged in? • What is the state of charge (SOC) at plug-in event? • What is the SOC at the unplug event?
Existence of Power Headroom

Part 2: Software: Opportunities for Task Deferral
NanoCAD LAB
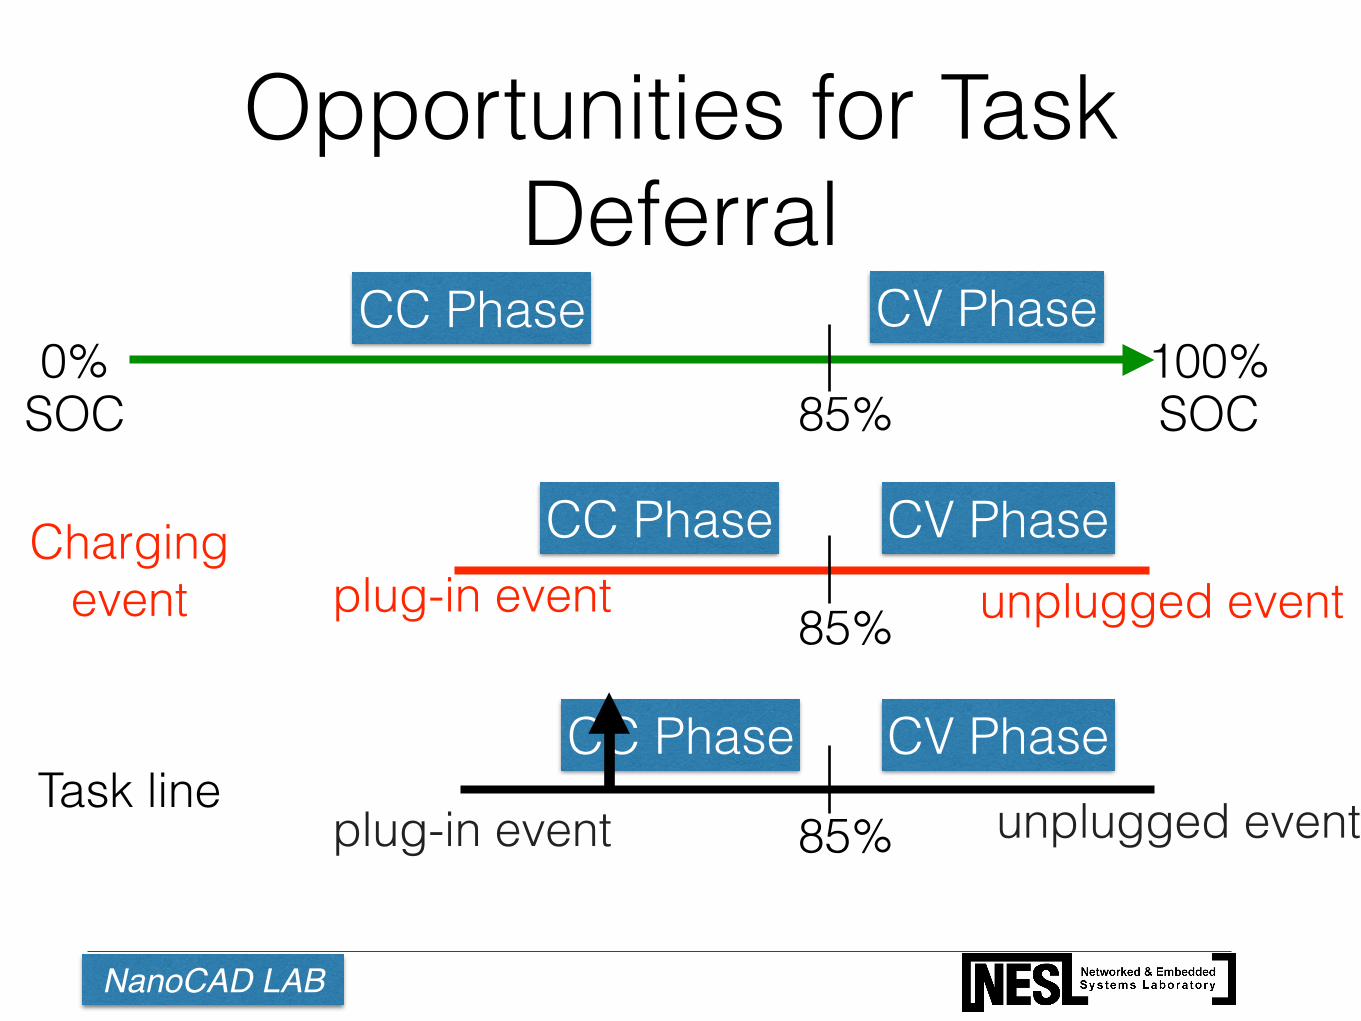
CC Phase
Opportunities for Task Deferral
0% 100%SOC SOC85%
CC Phase CV Phase
plug-in event
Task line
85%
85%
unplugged event
plug-in event unplugged event
Charging event
CC Phase CV Phase
CV Phase
NanoCAD LAB
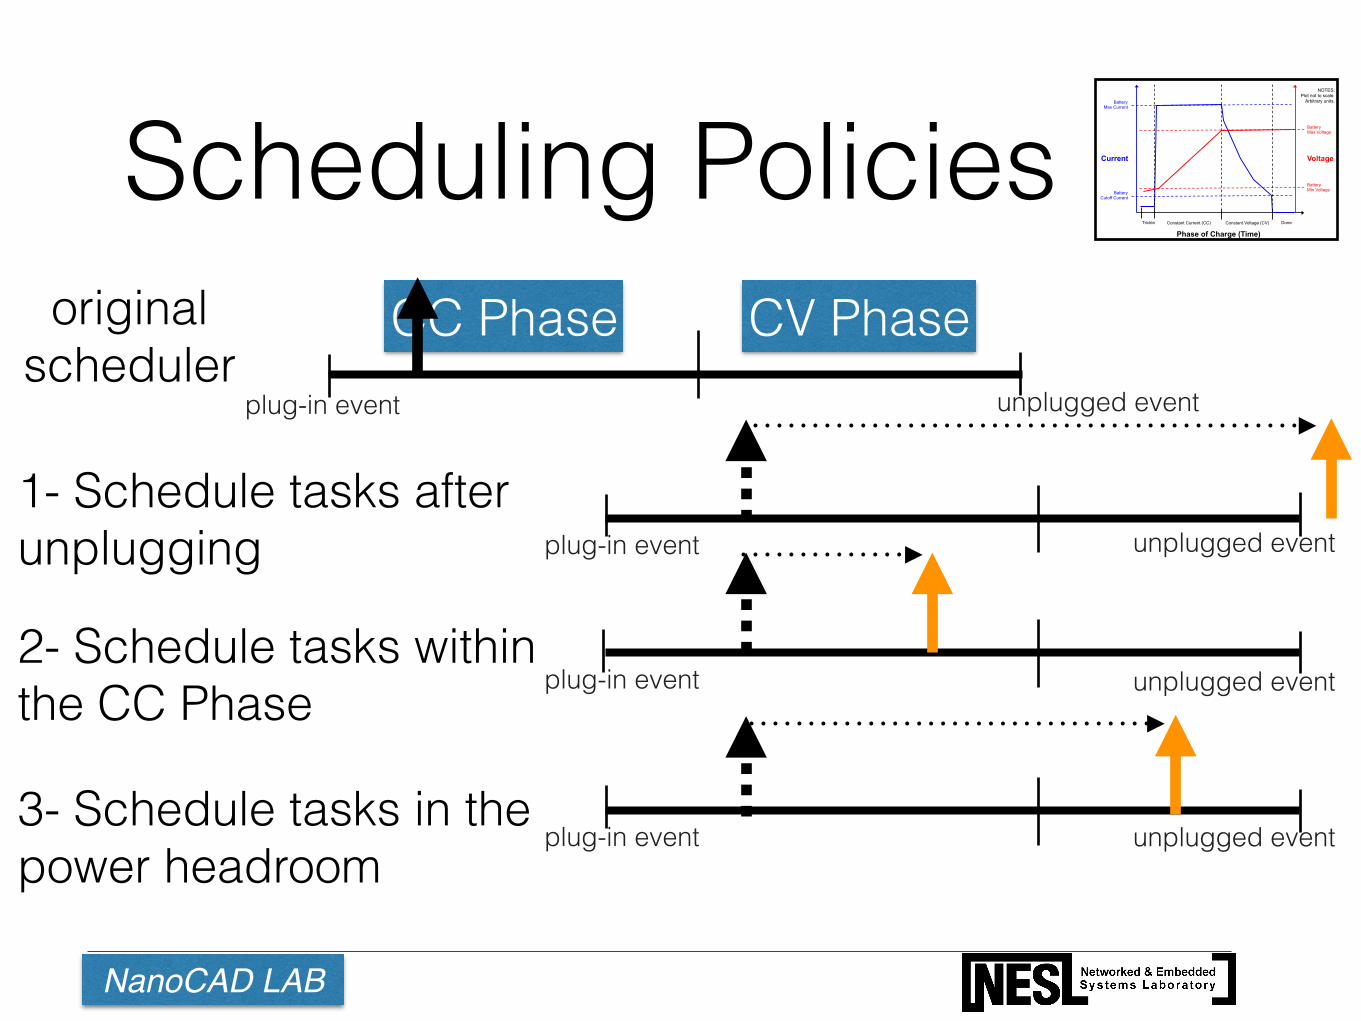
Scheduling Policies
1- Schedule tasks after unplugging
2- Schedule tasks within the CC Phase
3- Schedule tasks in the power headroom
original scheduler
CV PhaseCC Phaseplug-in event
plug-in event
Voltage Current
Phase of Charge (Time)
Trickle Constant Current (CC) Constant Voltage (CV) Done
Battery Cutoff Current
Battery Max Current
Battery Min Voltage
Battery Max Voltage
NOTES: Plot not to scale.
Arbitrary units.
plug-in event
plug-in event
unplugged event
unplugged event
unplugged event
unplugged event
NanoCAD LAB
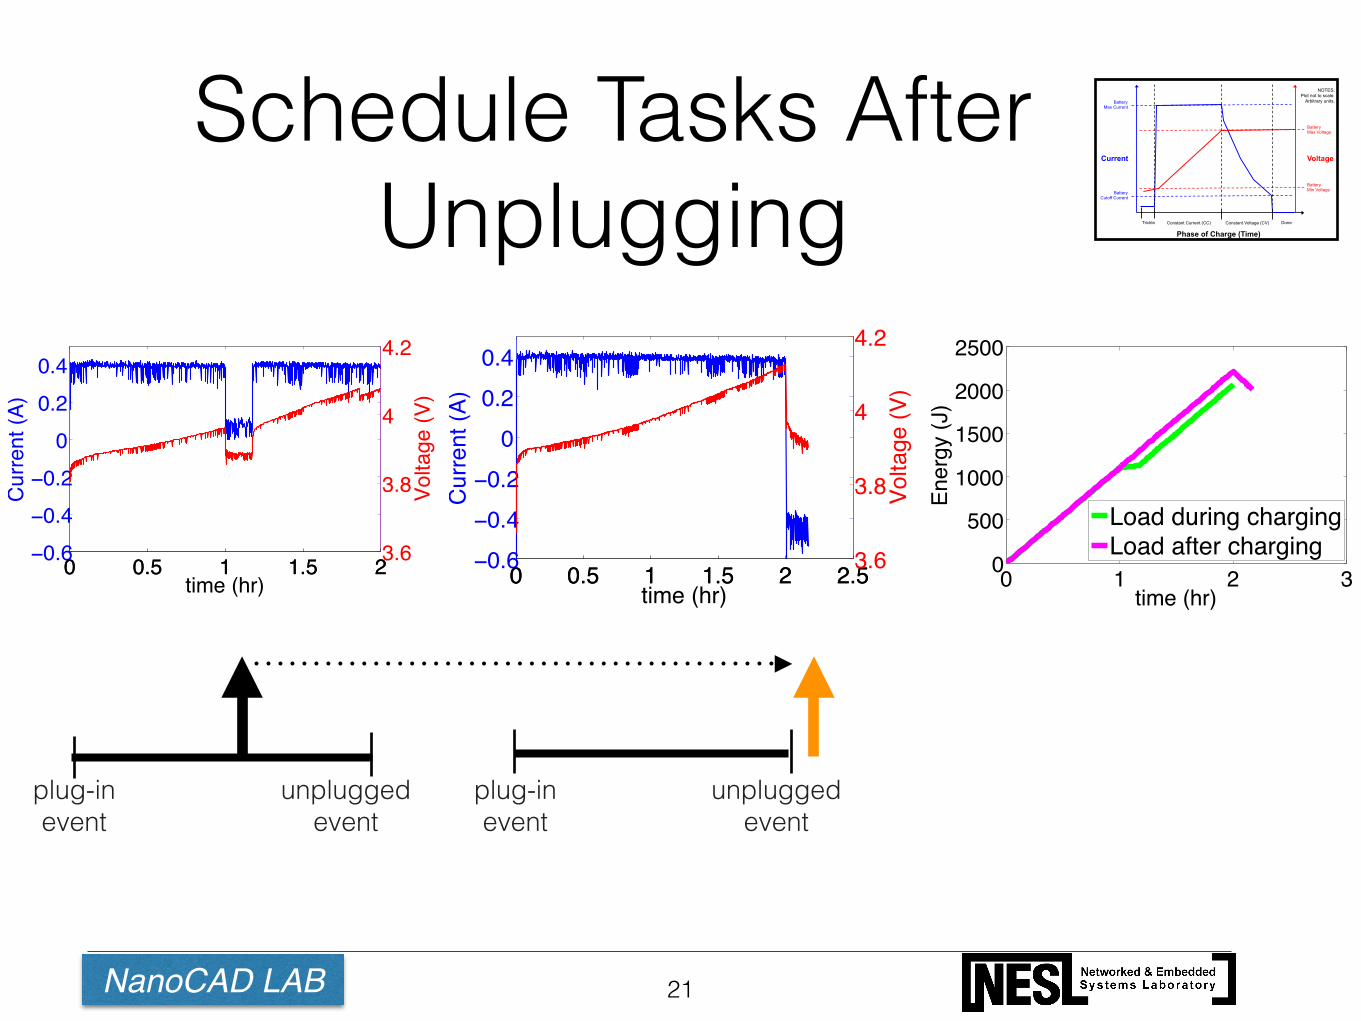
Schedule Tasks After Unplugging
21
0 0.5 1 1.5 2−0.6−0.4−0.2
00.20.4
time (hr)
Cur
rent
(A)
0 0.5 1 1.5 23.6
3.8
4
4.2
Volta
ge (V
)
0 0.5 1 1.5 2 2.5−0.6−0.4−0.2
00.20.4
time (hr)
Cur
rent
(A)
0 0.5 1 1.5 2 2.53.6
3.8
4
4.2
Volta
ge (V
)
0 1 2 30
500
1000
1500
2000
2500
time (hr)
Ener
gy (J
)
Load during chargingLoad after charging
Voltage Current
Phase of Charge (Time)
Trickle Constant Current (CC) Constant Voltage (CV) Done
Battery Cutoff Current
Battery Max Current
Battery Min Voltage
Battery Max Voltage
NOTES: Plot not to scale.
Arbitrary units.
plug-in event
plug-in event
unplugged event
unplugged event
NanoCAD LAB
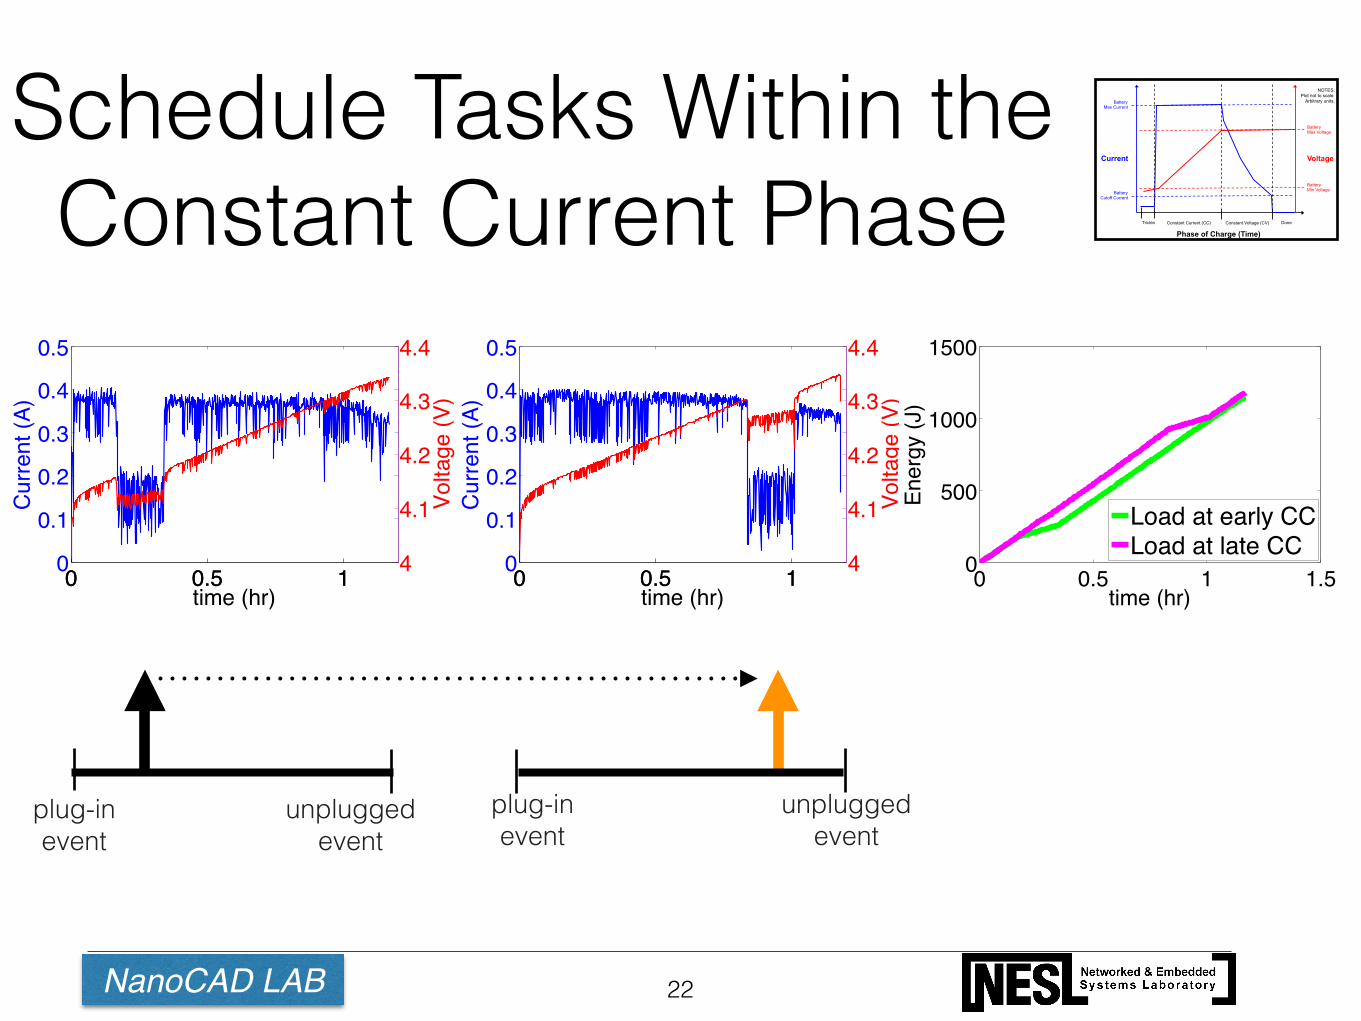
Schedule Tasks Within the Constant Current Phase
22
0 0.5 10
0.1
0.2
0.3
0.4
0.5
time (hr)
Cur
rent
(A)
0 0.5 1 4
4.1
4.2
4.3
4.4
Volta
ge (V
)
0 0.5 10
0.1
0.2
0.3
0.4
0.5
time (hr)
Cur
rent
(A)
0 0.5 1 4
4.1
4.2
4.3
4.4
Volta
ge (V
)
0 0.5 1 1.50
500
1000
1500
time (hr)
Ener
gy (J
)
Load at early CCLoad at late CC
Voltage Current
Phase of Charge (Time)
Trickle Constant Current (CC) Constant Voltage (CV) Done
Battery Cutoff Current
Battery Max Current
Battery Min Voltage
Battery Max Voltage
NOTES: Plot not to scale.
Arbitrary units.
plug-in event
plug-in event
unplugged event
unplugged event
NanoCAD LAB
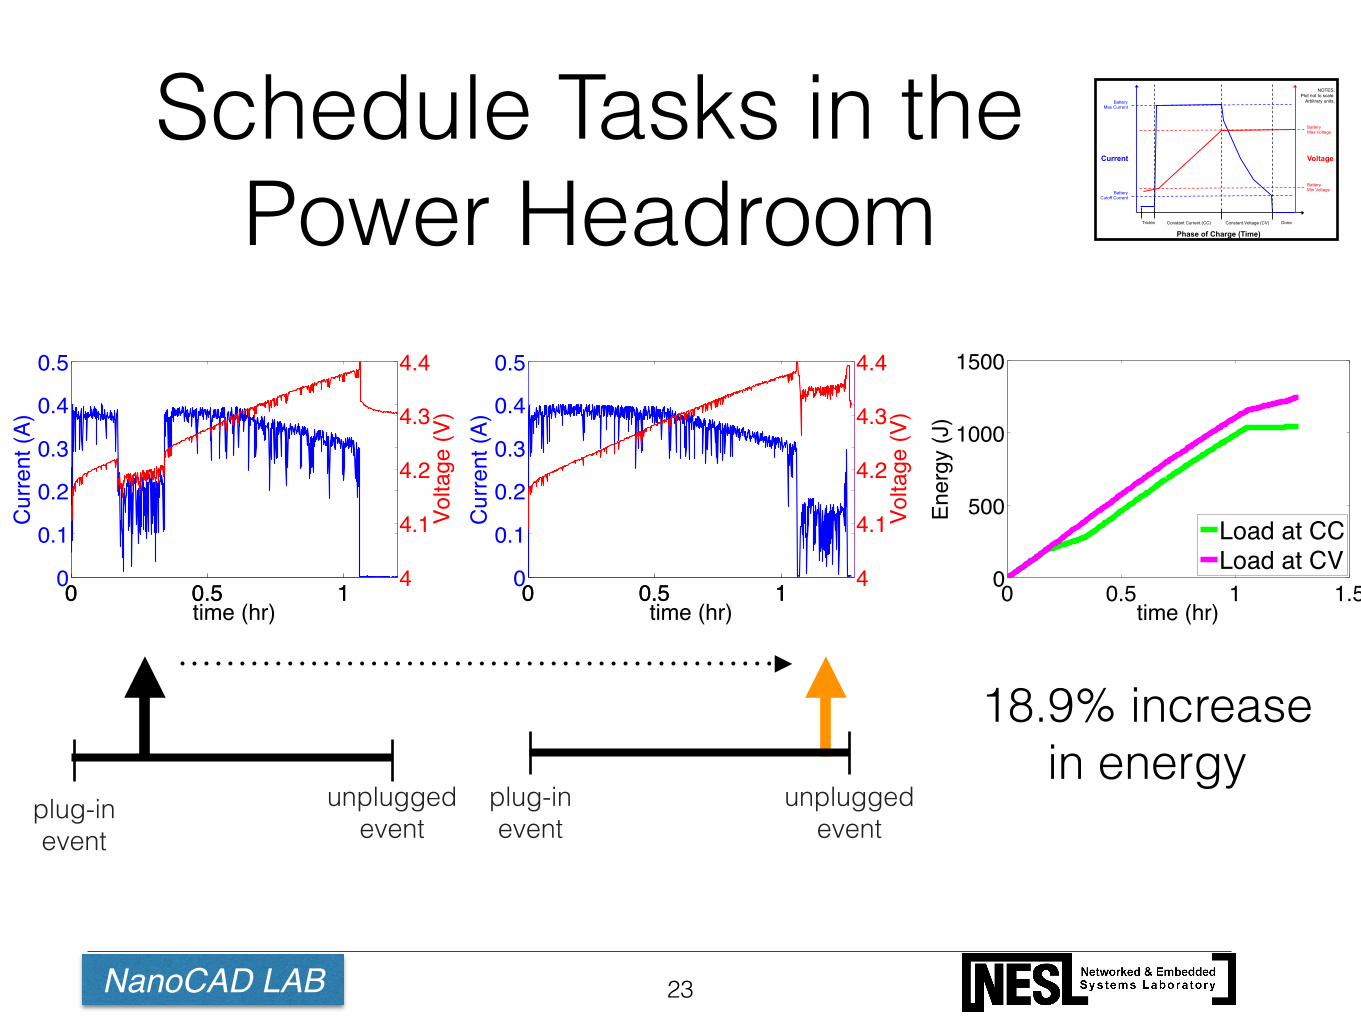
Schedule Tasks in the Power Headroom
23
0 0.5 10
0.1
0.2
0.3
0.4
0.5
time (hr)
Cur
rent
(A)
0 0.5 1 4
4.1
4.2
4.3
4.4
Volta
ge (V
)
0 0.5 10
0.1
0.2
0.3
0.4
0.5
time (hr)
Cur
rent
(A)
0 0.5 1 4
4.1
4.2
4.3
4.4
Volta
ge (V
)
0 0.5 1 1.50
500
1000
1500
time (hr)
Ener
gy (J
)
Load at CCLoad at CV
18.9% increase in energy
Voltage Current
Phase of Charge (Time)
Trickle Constant Current (CC) Constant Voltage (CV) Done
Battery Cutoff Current
Battery Max Current
Battery Min Voltage
Battery Max Voltage
NOTES: Plot not to scale.
Arbitrary units.
plug-in event
plug-in event
unplugged event
unplugged event
NanoCAD LAB
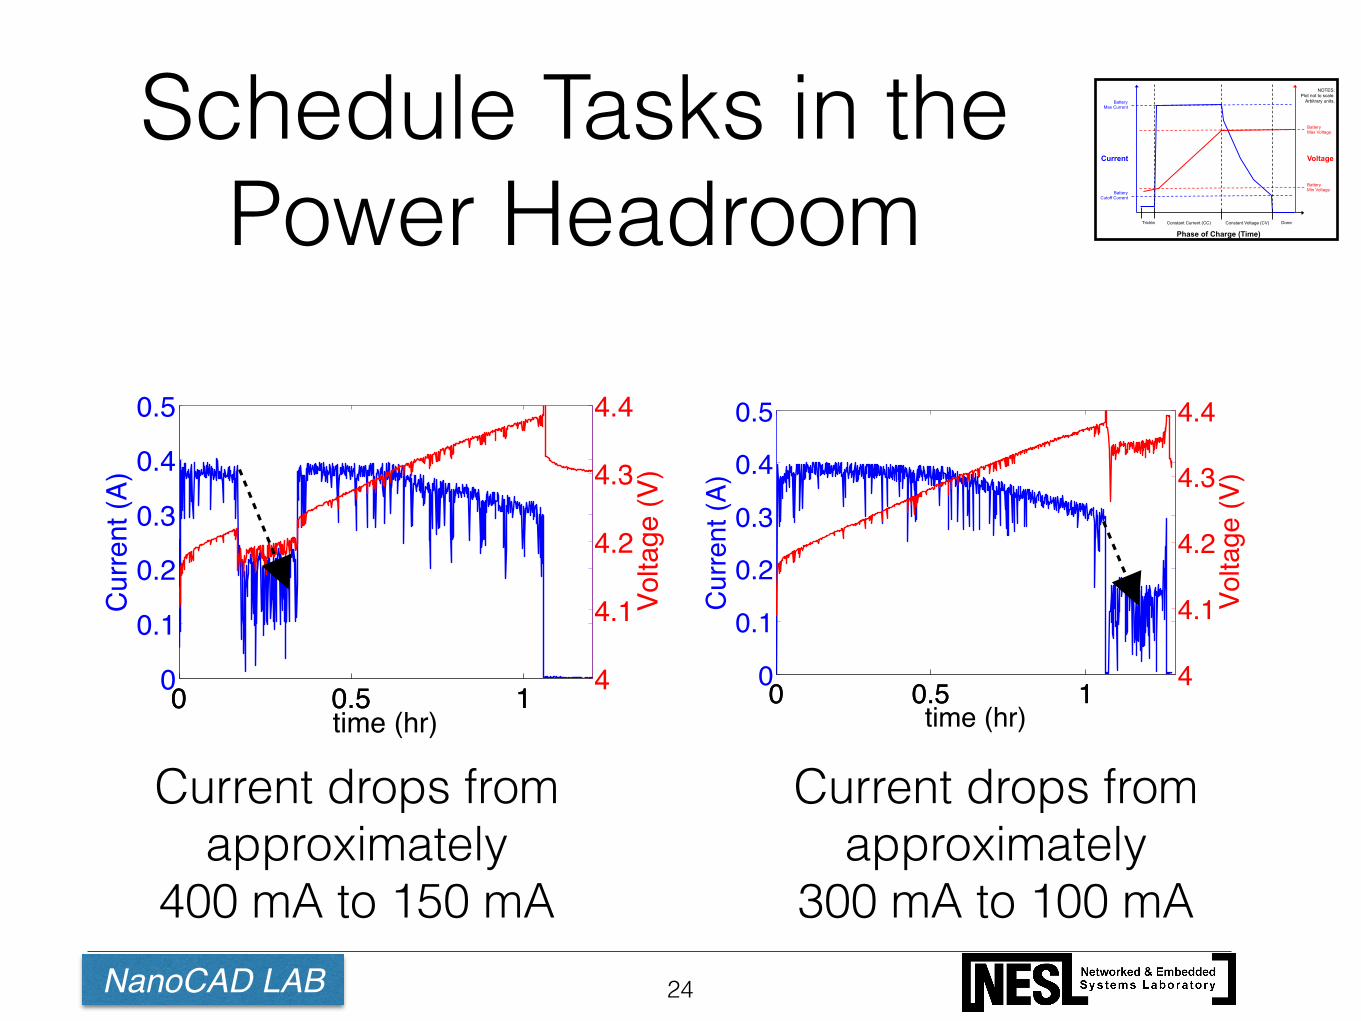
Schedule Tasks in the Power Headroom
24
0 0.5 10
0.1
0.2
0.3
0.4
0.5
time (hr)
Cur
rent
(A)
0 0.5 1 4
4.1
4.2
4.3
4.4
Volta
ge (V
)0 0.5 10
0.1
0.2
0.3
0.4
0.5
time (hr)C
urre
nt (A
)0 0.5 1 4
4.1
4.2
4.3
4.4
Volta
ge (V
)
Current drops from approximately
400 mA to 150 mA
Current drops from approximately
300 mA to 100 mA
Voltage Current
Phase of Charge (Time)
Trickle Constant Current (CC) Constant Voltage (CV) Done
Battery Cutoff Current
Battery Max Current
Battery Min Voltage
Battery Max Voltage
NOTES: Plot not to scale.
Arbitrary units.
NanoCAD LAB
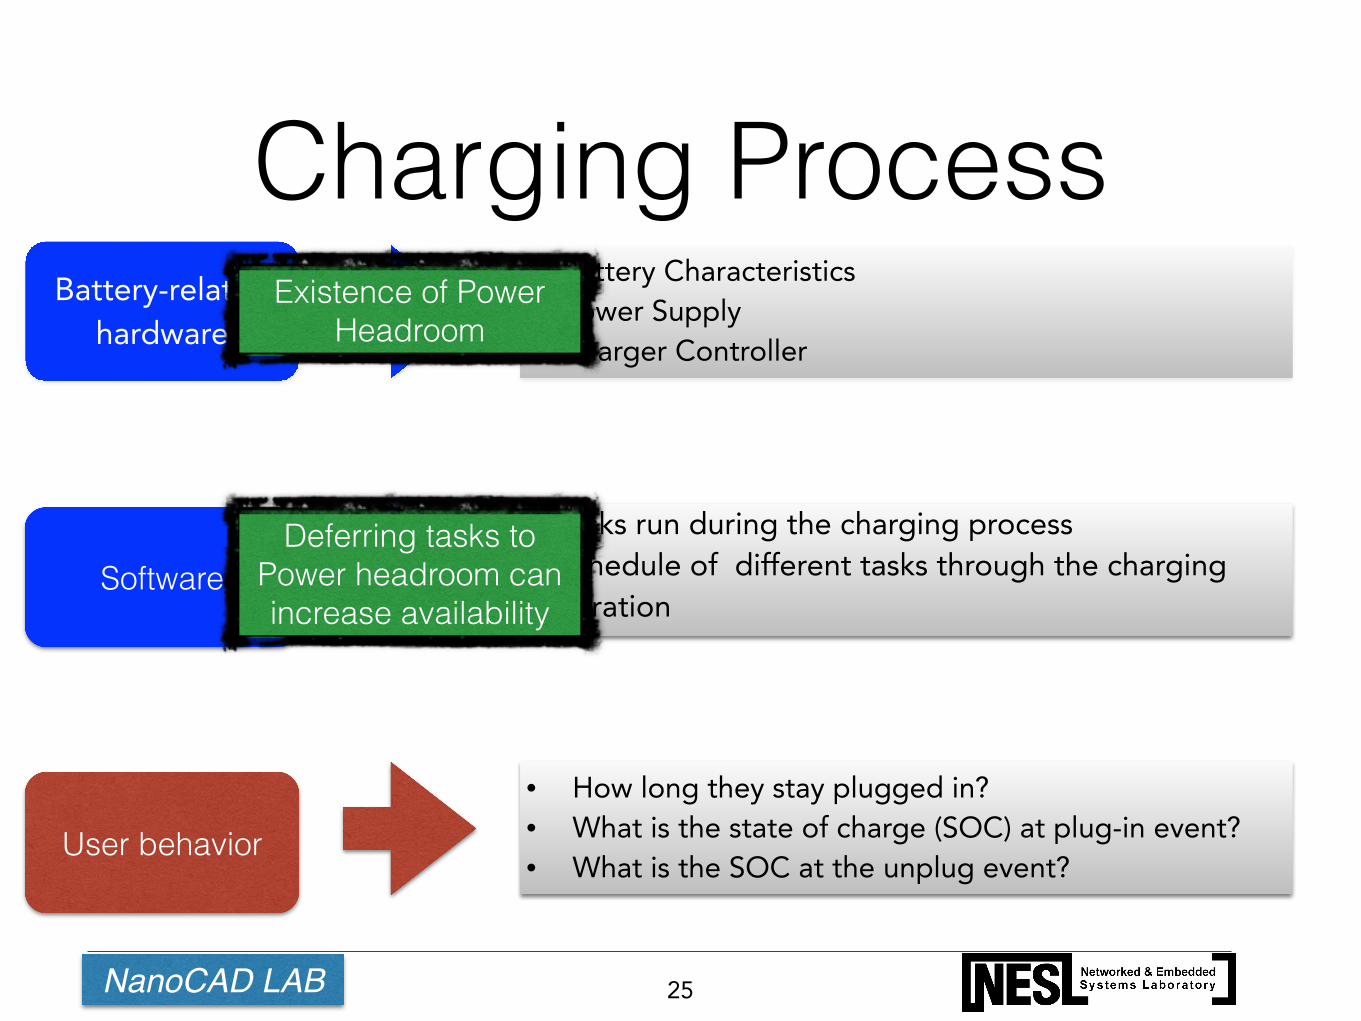
Charging Process
25
Battery-related hardware
Software
• Battery Characteristics • Power Supply • Charger Controller
• Tasks run during the charging process • Schedule of different tasks through the charging
duration
User behavior
• How long they stay plugged in? • What is the state of charge (SOC) at plug-in event? • What is the SOC at the unplug event?
Existence of Power Headroom
Deferring tasks to Power headroom can increase availability
Part 3: USER CHARGING BEHAVIOR (Users progress through CC and CV phases)
NanoCAD LAB
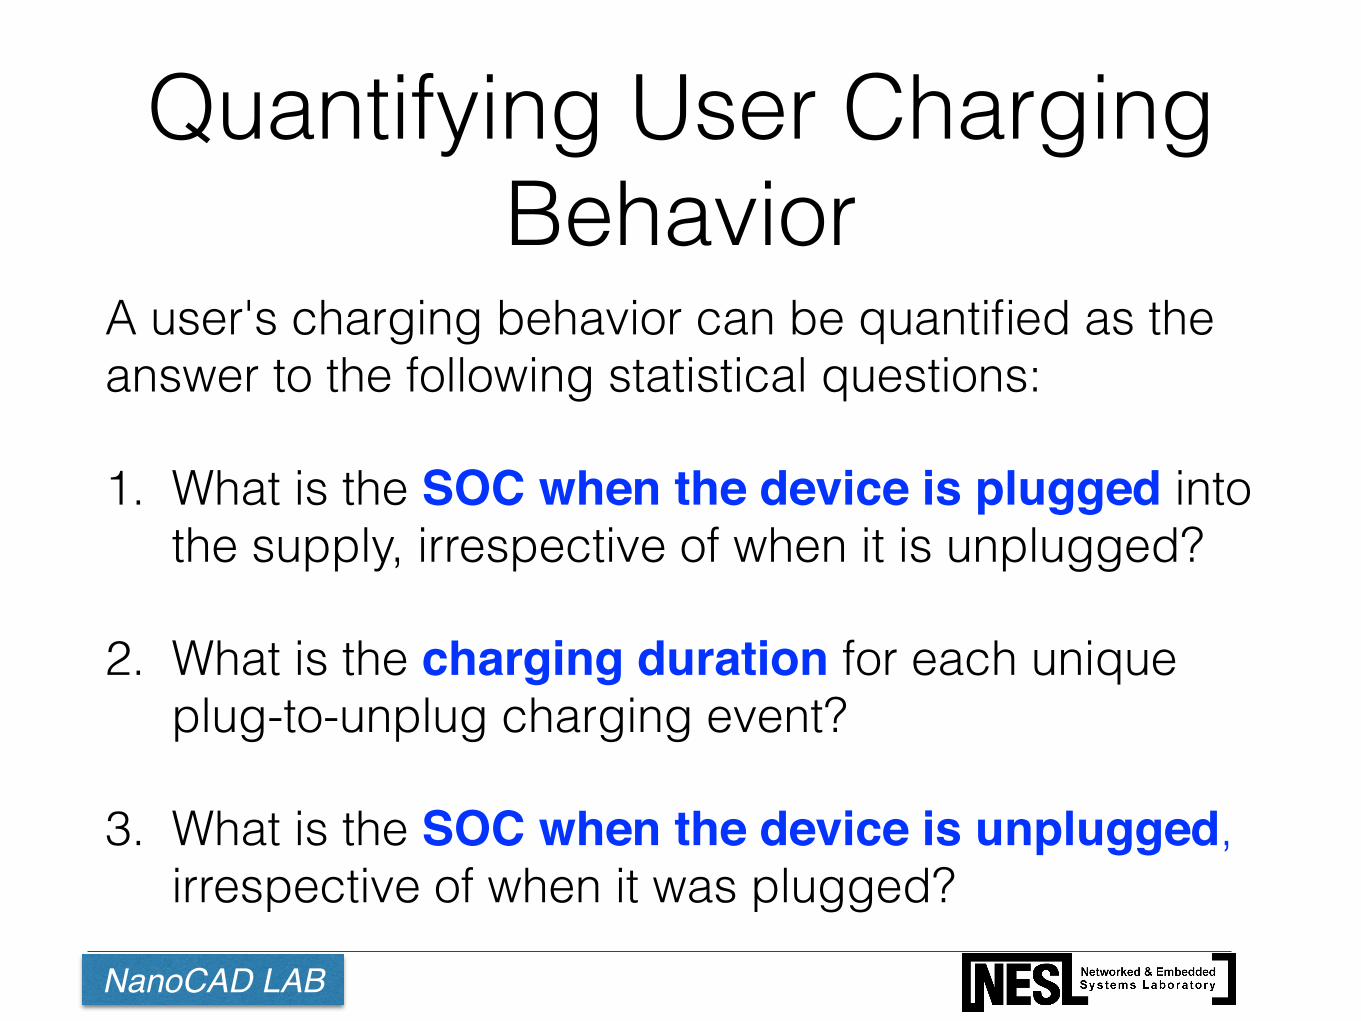
Quantifying User Charging Behavior
A user's charging behavior can be quantified as the answer to the following statistical questions:
1. What is the SOC when the device is plugged into the supply, irrespective of when it is unplugged?
2. What is the charging duration for each unique plug-to-unplug charging event?
3. What is the SOC when the device is unplugged, irrespective of when it was plugged?
NanoCAD LAB
User Data Set
• We study the user charging behavior of 40 randomly chosen and anonymous Nexus 4 users over a period of roughly six months using the Device Analyzer*
* WAGNER, D. T., RICE, A., AND BERESFORD, A. R. Device Analyzer: Understanding smartphone usage. In Proceedings of the International Conference on Mobile and Ubiquitous Systems: Computing, Networking and Services (Tokyo, Japan, 2013), ACM.
NanoCAD LAB
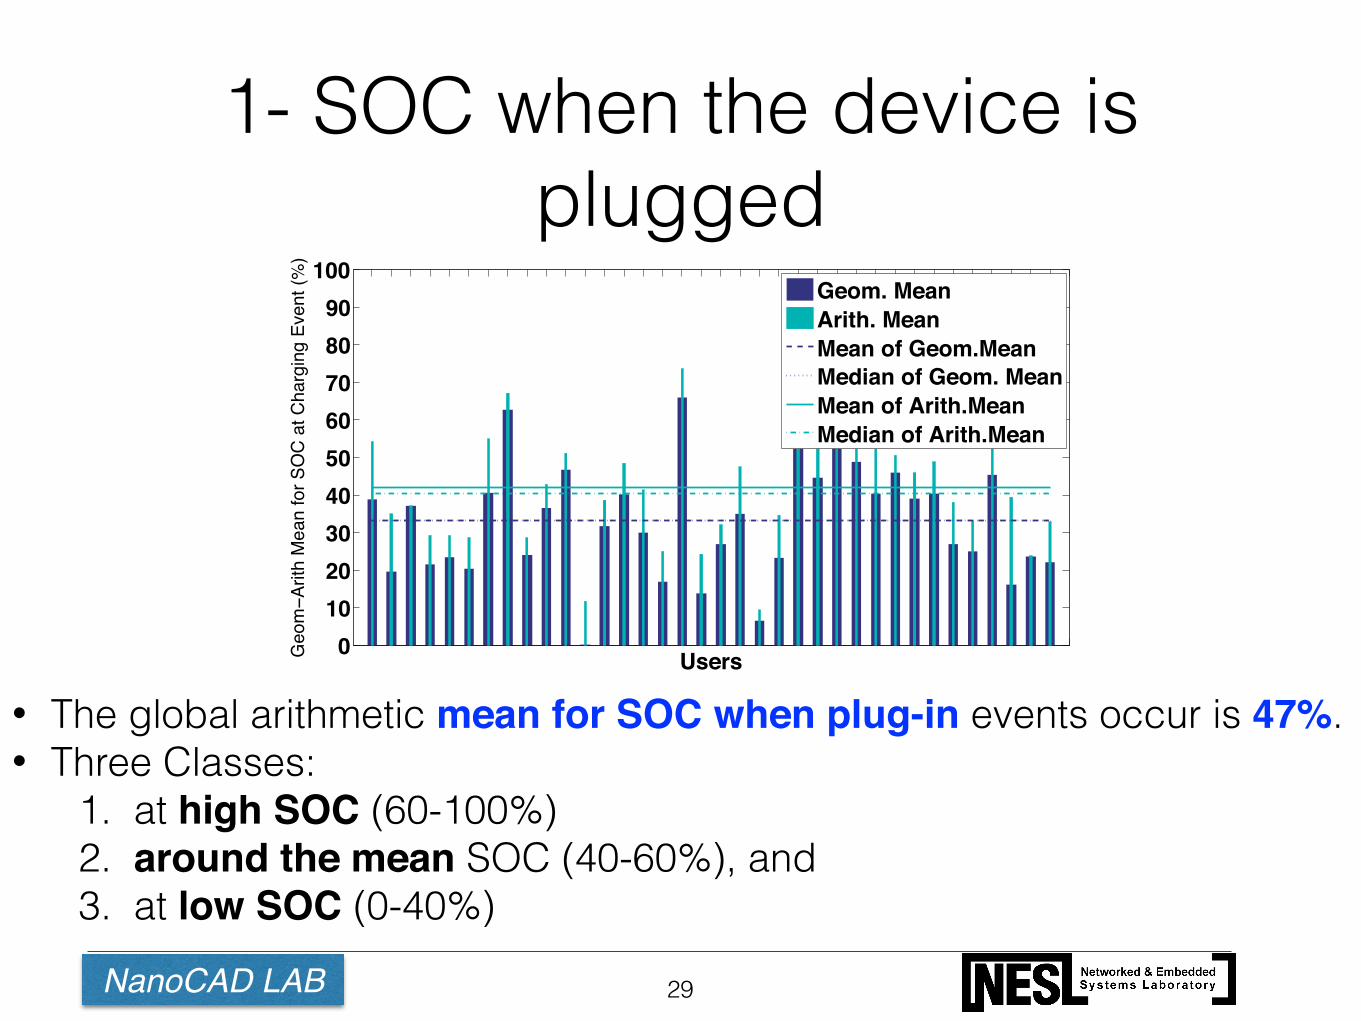
1- SOC when the device is plugged
29
0102030405060708090
100G
eom−A
rith
Mea
n fo
r SO
C at
Cha
rgin
g Ev
ent (
%)
Users
Geom. MeanArith. MeanMean of Geom.MeanMedian of Geom. MeanMean of Arith.MeanMedian of Arith.Mean
• The global arithmetic mean for SOC when plug-in events occur is 47%. • Three Classes:
1. at high SOC (60-100%) 2. around the mean SOC (40-60%), and 3. at low SOC (0-40%)
NanoCAD LAB
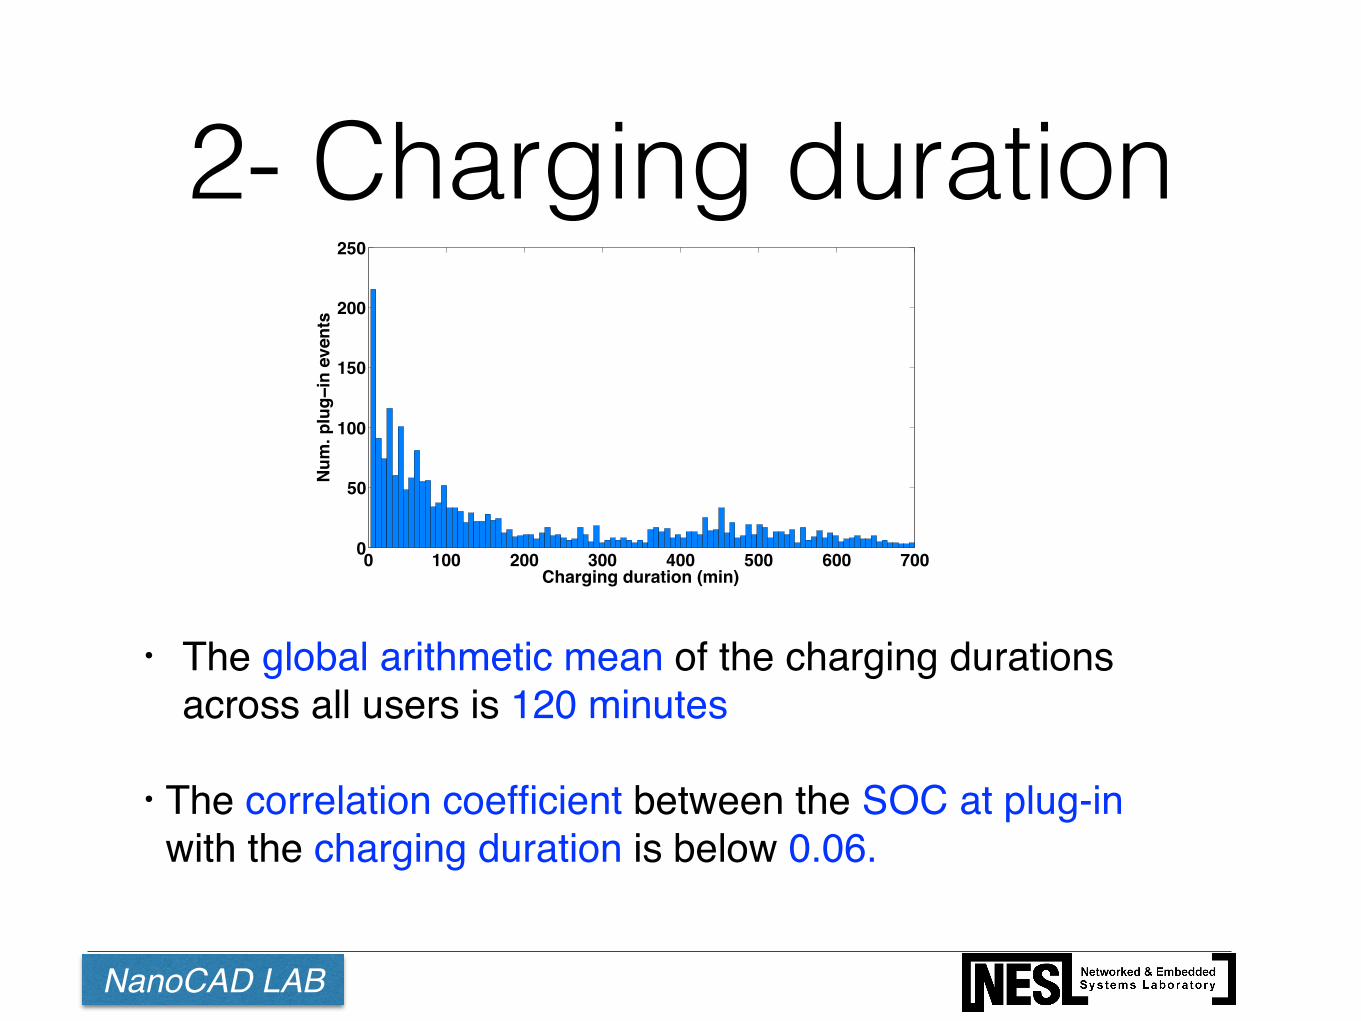
2- Charging duration
0 100 200 300 400 500 600 7000
50
100
150
200
250
Num
. plu
g−in
eve
nts
Charging duration (min)
• The global arithmetic mean of the charging durations across all users is 120 minutes!
!• The correlation coefficient between the SOC at plug-in with the charging duration is below 0.06.
NanoCAD LAB
3- SOC when the device is unplugged?
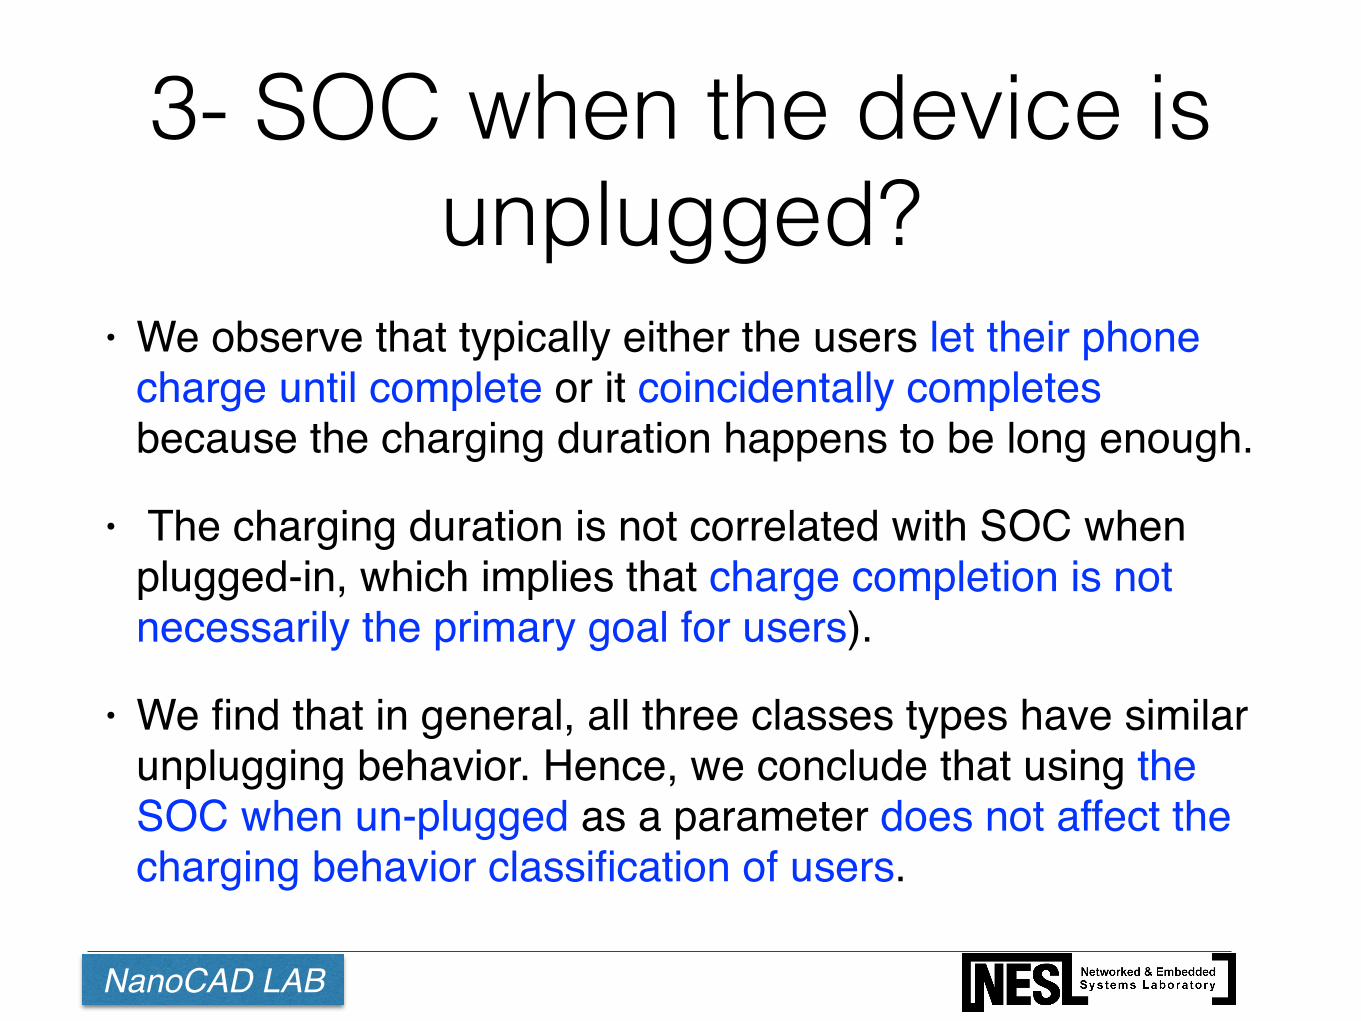
• We observe that typically either the users let their phone charge until complete or it coincidentally completes because the charging duration happens to be long enough.!
• The charging duration is not correlated with SOC when plugged-in, which implies that charge completion is not necessarily the primary goal for users). !
• We find that in general, all three classes types have similar unplugging behavior. Hence, we conclude that using the SOC when un-plugged as a parameter does not affect the charging behavior classification of users.
NanoCAD LAB
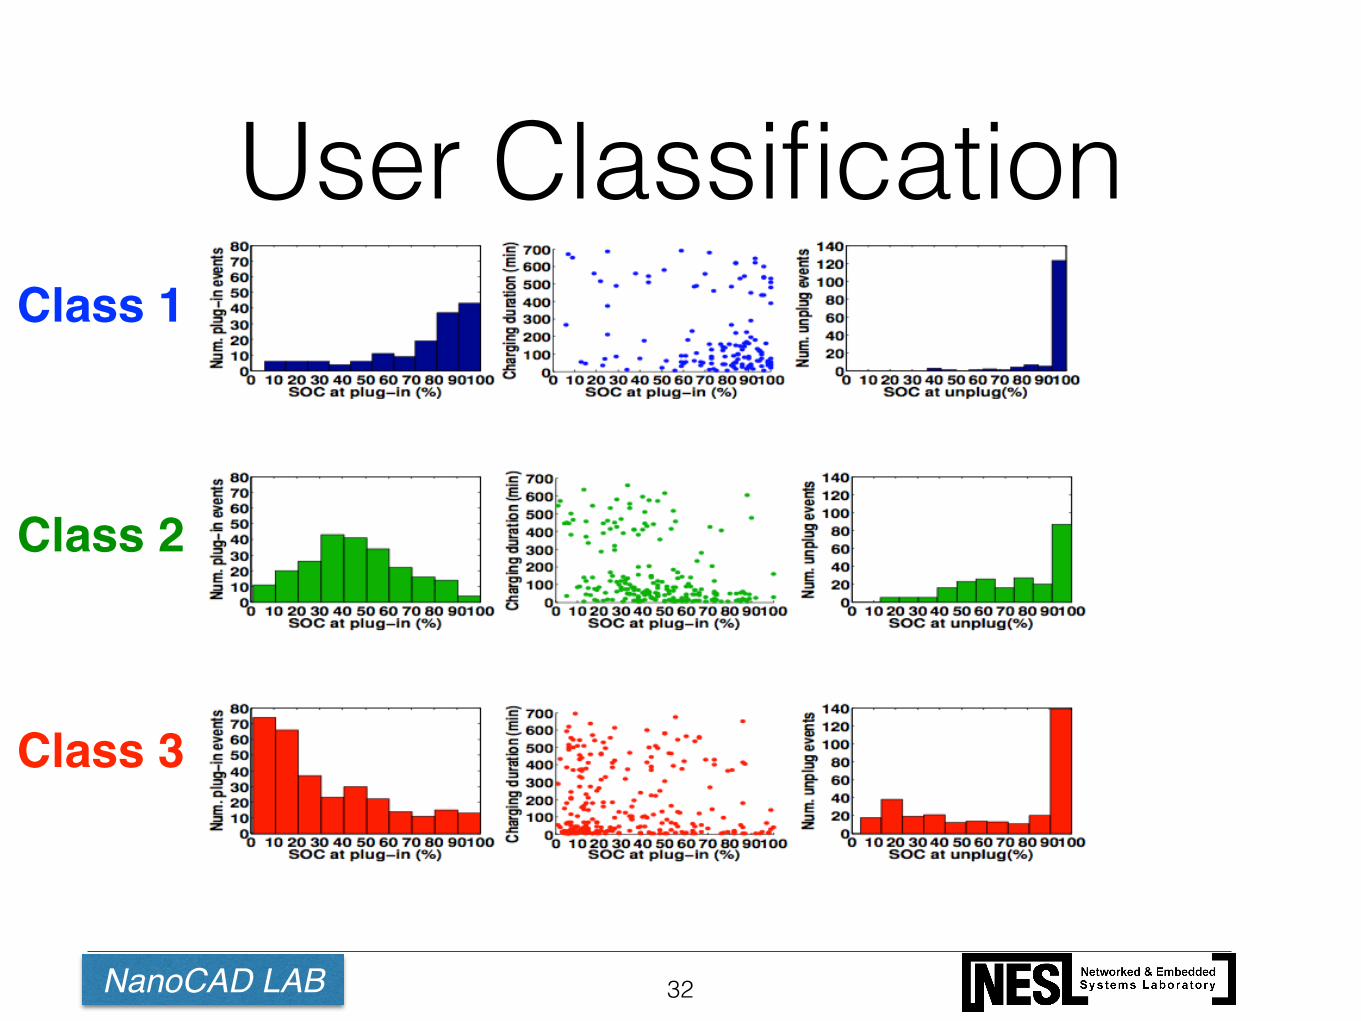
User Classification
32
Class 1
Class 2
Class 3
NanoCAD LAB
User Classification
33
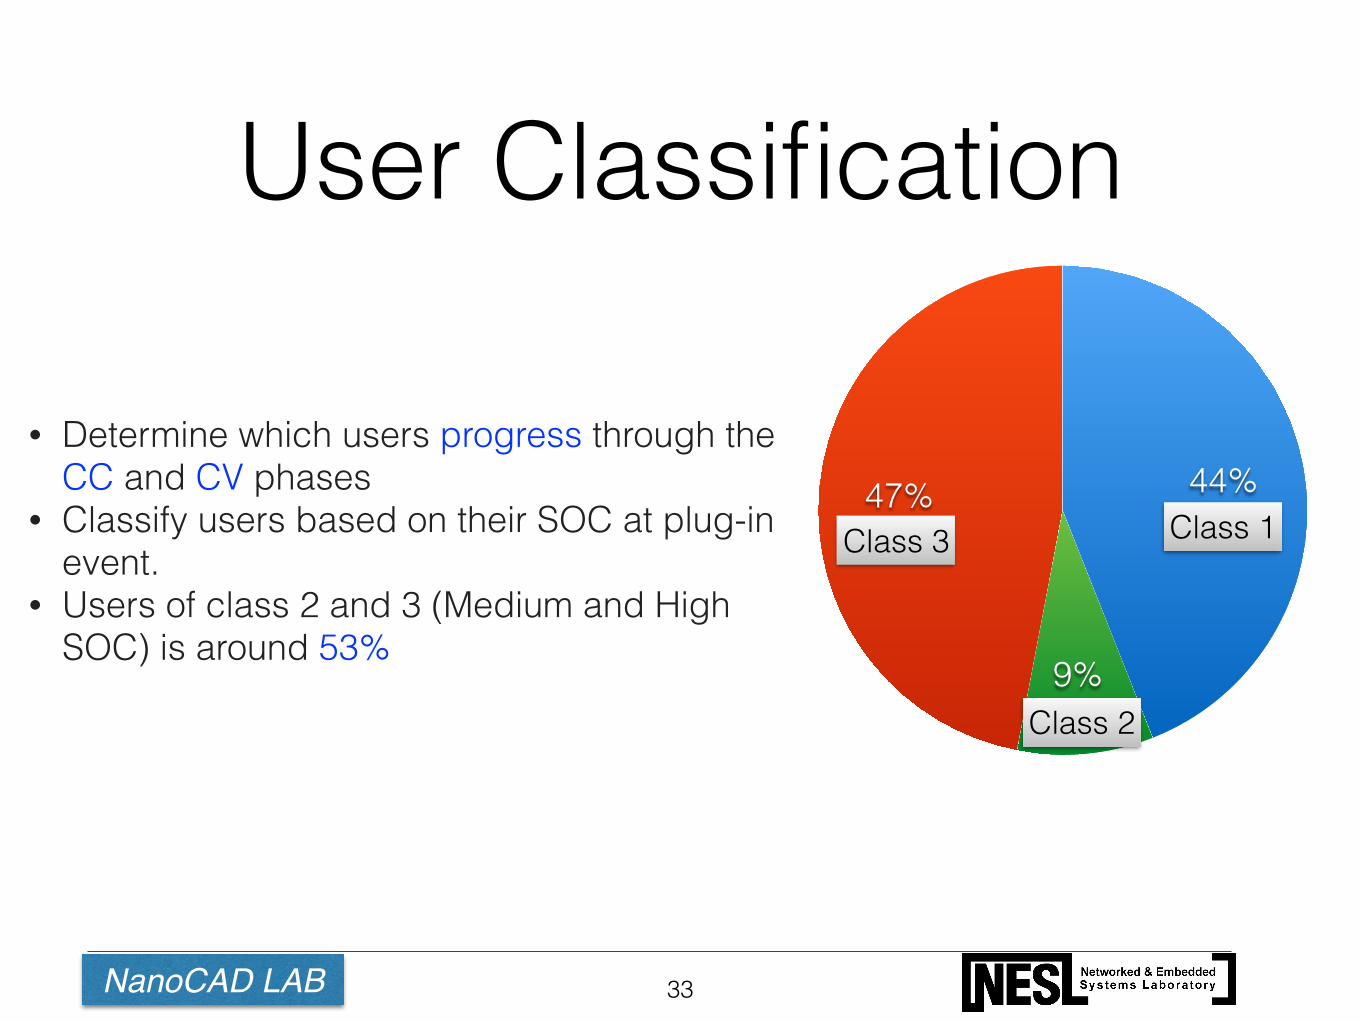
• Determine which users progress through the CC and CV phases
• Classify users based on their SOC at plug-in event.
• Users of class 2 and 3 (Medium and High SOC) is around 53%
47%
9%
44%Class 1
Class 2
Class 3
NanoCAD LAB
Charging Process
34
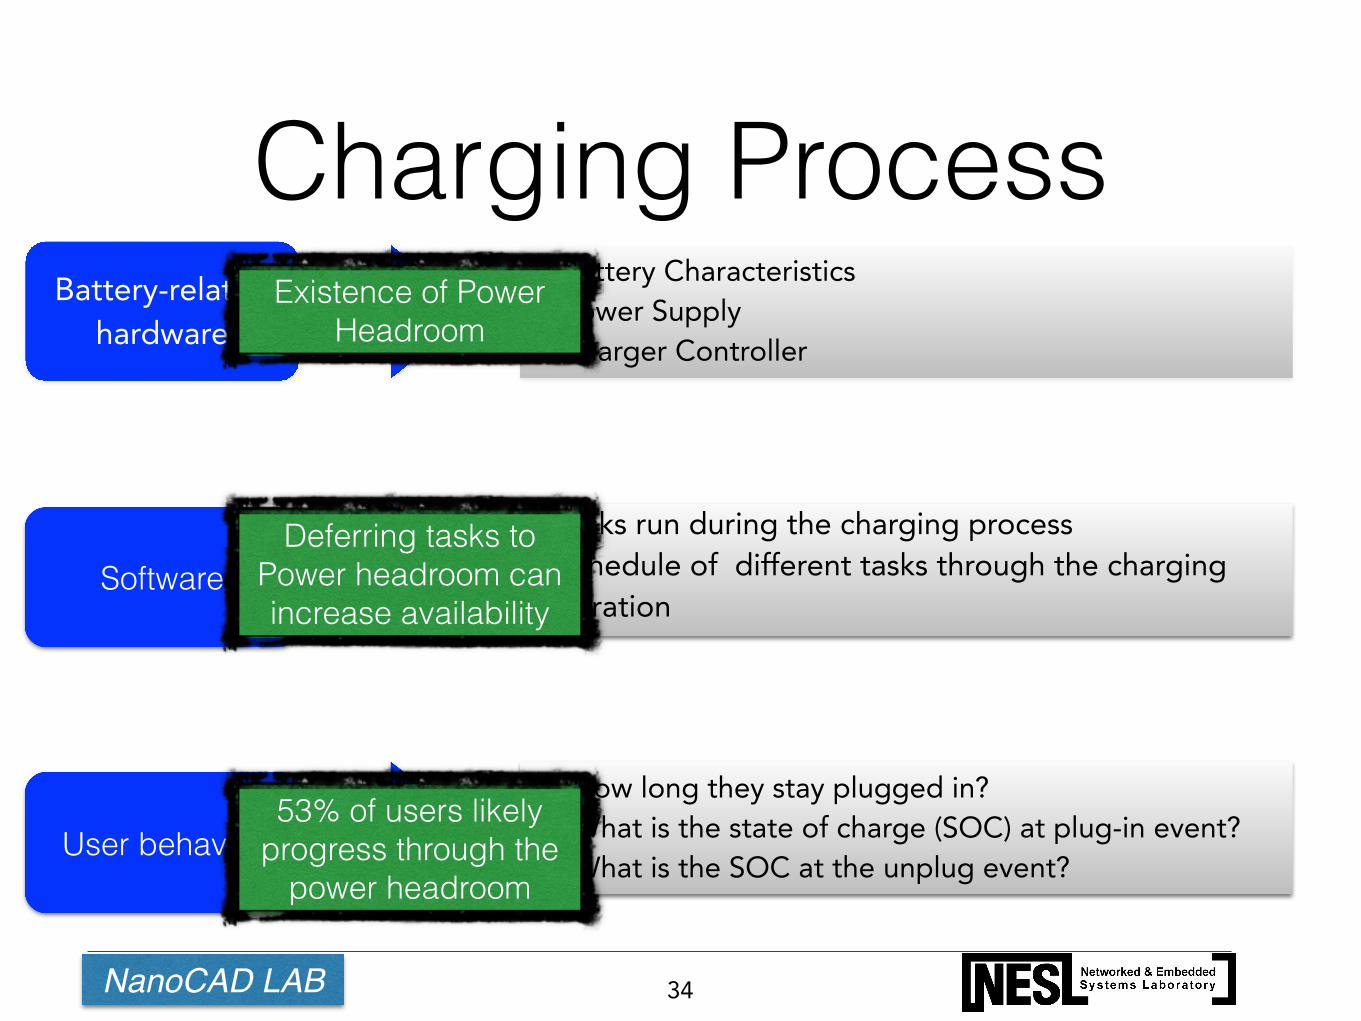
Battery-related hardware
Software
• Battery Characteristics • Power Supply • Charger Controller
• Tasks run during the charging process • Schedule of different tasks through the charging
duration
User behavior
• How long they stay plugged in? • What is the state of charge (SOC) at plug-in event? • What is the SOC at the unplug event?
Existence of Power Headroom
Deferring tasks to Power headroom can increase availability
53% of users likely progress through the
power headroom
NanoCAD LAB
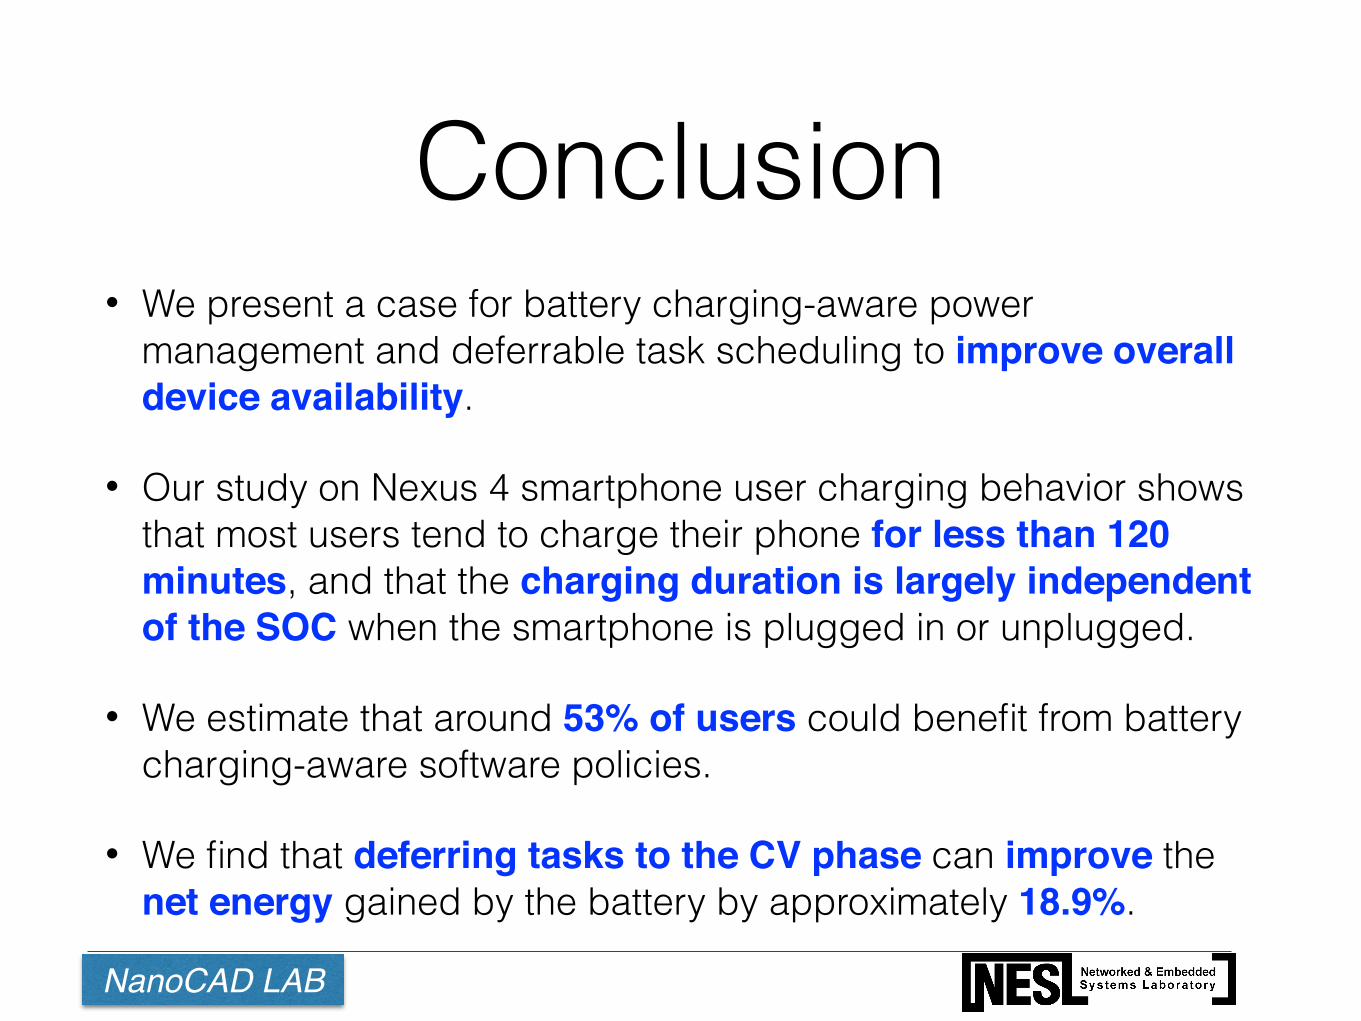
Conclusion• We present a case for battery charging-aware power
management and deferrable task scheduling to improve overall device availability.
• Our study on Nexus 4 smartphone user charging behavior shows that most users tend to charge their phone for less than 120 minutes, and that the charging duration is largely independent of the SOC when the smartphone is plugged in or unplugged.
• We estimate that around 53% of users could benefit from battery charging-aware software policies.
• We find that deferring tasks to the CV phase can improve the net energy gained by the battery by approximately 18.9%.
NanoCAD LAB
Future Work• Quantifying power headroom based on the
battery characteristics and the stage of the charging process to determine the number and type of tasks to be deferred based on their predicted energy requirements.
• User-specific models to predict whether a given user during some charging event is likely to reach a period with greater power headroom.

Thanks
NanoCAD LAB
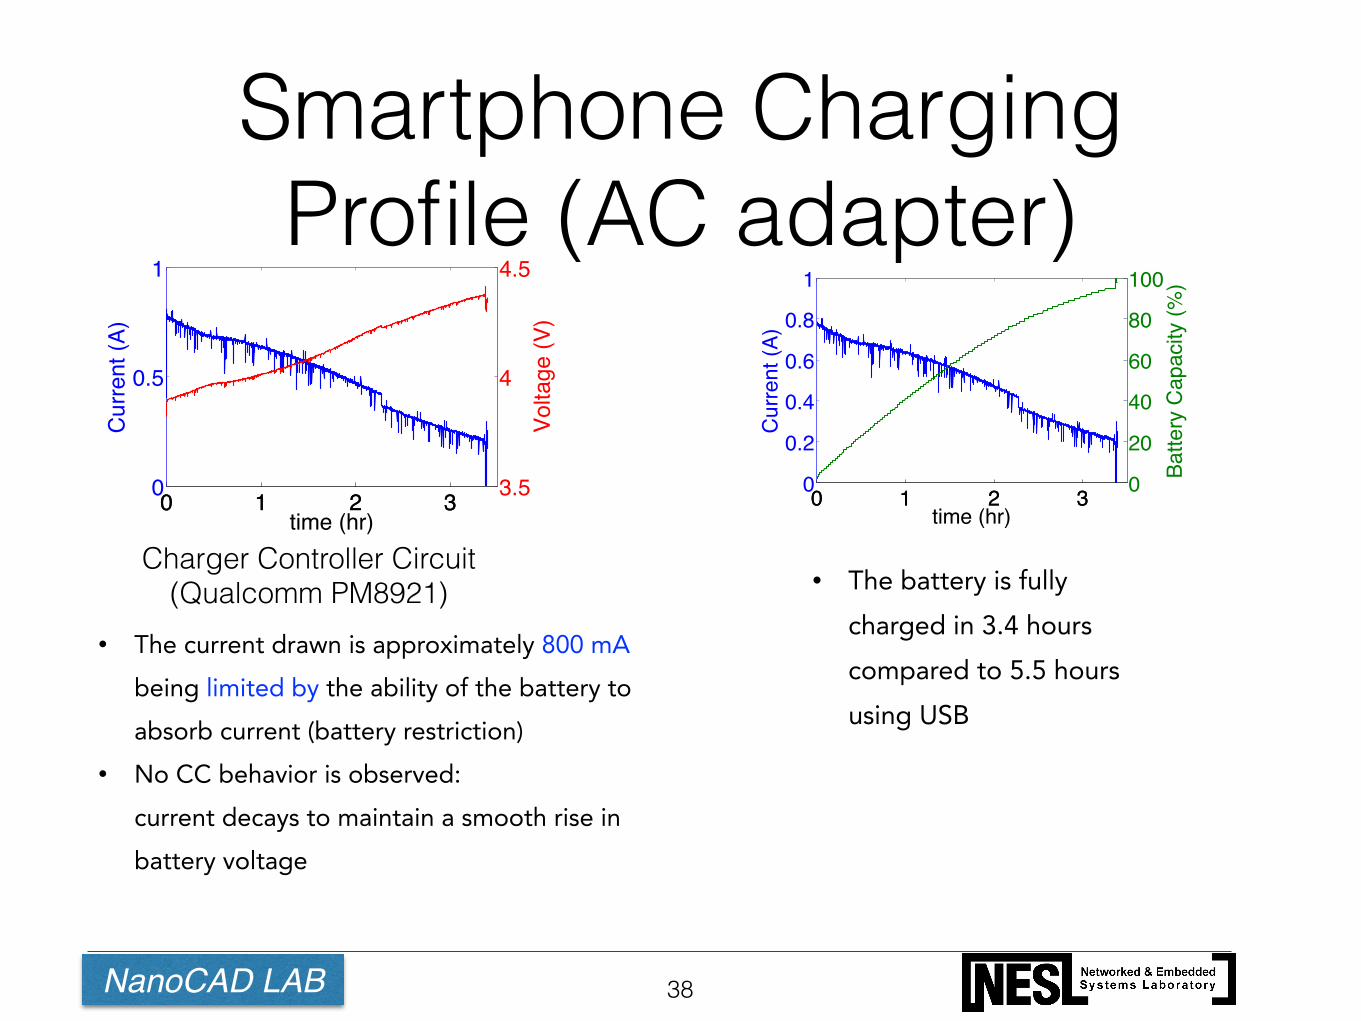
Smartphone Charging Profile (AC adapter)
38
Charger Controller Circuit (Qualcomm PM8921)
• The current drawn is approximately 800 mA being limited by the ability of the battery to absorb current (battery restriction)
• No CC behavior is observed: current decays to maintain a smooth rise in battery voltage
• The battery is fully charged in 3.4 hours compared to 5.5 hours using USB
0 1 2 30
0.5
1
time (hr)
Cur
rent
(A)
0 1 2 3 3.5
4
4.5
Volta
ge (V
)
0 1 2 30
0.2
0.4
0.6
0.8
1
time (hr)
Cur
rent
(A)
0 1 2 3 0
20
40
60
80
100
Batte
ry C
apac
ity (%
)