Embed Size (px)
Citation preview

A CASE STUDY ANALYSIS OF ORGANIZATIONAL COMMUNICATION EFFECTIVENESS
BETWEEN USER-MANAGERS AND INFORMATION SERVICE DEPARTMENT PERSONNEL
by
JIMMY WAYNE SPENCE, B.B.A., M.B.A.
A DISSERTATION
IN
BUSINESS ADMINISTRATION
Submitted to the Graduate Faculty of Texas Tech University in Partial Fulfillment of the Requirements for
the Degree of
DOCTOR OF BUSINESS ADMINISTRATION
Approved
December, 1978

ACKNOWLEDGMENTS
I am deeply indebted to Professor Norman R. Lyons for his
acceptance of the chairmanship of this dissertation and to the
other members of my committee. Professors Larry Austin, Duane
Hoover, and Douglas Andrews, for their helpful criticism. I
give a special note of thanks to Professor Douglas Andrews
without whose guidance and direction this study would not have
been possible. Finally, to my wife, Jan, I give a very special
thanks for the constant encouragement and assistance in the
preparation of the final draft.
11

TABLE OF CONTENTS
ACKNOWLEDGMENTS ii
ABSTRACT 1
LIST OF TABLES vi
LIST OF FIGURES AND ILLUSTRATIONS vii
I. INTRODUCTION 1
Statement of the Problem 2
Purpose of the Study A
Definition of Terms 7
Limitations 9
Organization of the Study 10
II. LITERATURE REVIEW 12
General Contributions to Management Involvement 12
Research Contributions to Management
Involvement 19
Contributions to Interpersonal and Organizational Communication 23
Summary 39
III. METHODOLOGY 42
The Pilot Study 42
Creation of the Questionnaires 43
Characteristics of the Pilot Study Sample 44
Pretest of the Questionnaires 44
iii

Construction of Communication Success Models . 49
Analysis of the Pilot Study Data 50
Construction of the Management
Communication Success Model 53
Construction of the ISD Communication
Success Model 58
The Post Study 62
The Post Study Questionnaire 63
Characteristics of the Post Study Sample . 64
Statement of Hypotheses 68
Statistical Analysis of Data 76
Summary 80
IV. RESULTS OF THE STUDY 82
The Post Study Sample 82
Analysis of Hypotheses 83
Analysis of the Management Communication
Success Model 89
Analysis of the ISD Communication Success Model 99
Comparison of Management and ISD Responses . . 103
Summary ^^2
V. CONCLUSIONS AND RECOMMENDATIONS 115
Conclusions 117
Recommendations l^^
LIST OF REFERENCES ^23
iv

APPENDIX 131
A. Pilot Study Questionnaires 132
B. Results of Factor Analysis 149
C. Wilcoxon Signed-Ranks Test for Questionnaire Stability 156
D. Modification of Questionnaires 160
E. Results of Data Analysis for Communication Success
Models 162
F. Post Study Questionnaires 167
G. Computational Procedure for Question Indexes 179
H. Index Conversion into Categories for Chi Square Tests . 181
I. Analysis of Hypotheses 183 J. Analysis of Variables in the Management Perceived
Communication Success Model 187
K. Analysis of Variables in the ISD Perceived
Communication Success Model 192
L. Comparative Analysis of Management Versus ISD Responses 199
M. Rationale for the Selection of the Berlo Communication
Model 203 N. Preliminary Testing of Questionnaires 211

LIST OF TABLES
1. Variables and Questions 46
2. Communication-Oriented Questions 51
3. Summary of Significant Variables in the Management Perceived Communication Success Model 98
4. Summary of Significant Variables in the ISD Perceived Communication Success Model 104
5. A Summary of the Significant Variables in Management and ISD Perceived Communication Success Models . . . . Ill
VI

LIST OF FIGURES AND ILLUSTRATIONS
1. A Basic Model of Communication 25
2. Communication Success Model (As Perceived by Managers) . 55
3. Communication Success Model (As Perceived by ISD Personnel) 59
Vll

CHAPTER I
INTRODUCTION
The involvement of management in the development of management
information systems (MIS) is suggested as one of the key factors of a
"successful" business system. As Sollenberger indicates:
Management involvement is . . . concerned with the participation of nonsystems personnel in shaping information systems development activities. VJhile the need for top-management involvement has been widely and convincingly argued, less familiar is the view that management involvement also means the participation of operating line managers and all other management users of data services in the company. Active collaboration between these users and systems personnel . . . is of key significance for success in every phase of system work. (31: 7)
Sollenberger is not alone in arguing for management involvement. Other
authors, including Hershman (63; 27) and Sanders (29; 141), have labeled
top management support of and participation in MIS development as one
of the key success variables. This "principle" has been extended by
Dearden and McFarlan (6: 49) and Canning (45: 4-10) to include middle
and operating-level managers.
Most authors who list the steps to successful MIS include manager
ial involvement in the development of a system; one has even labeled
this involvement as a "platitude." (33: 191) Concomitantly, several
authors cite the lack of managerial involvement as a principal cause for
the failure of management information systems. (78: 71-74; 40: 26, 29)

Thus, there appears to be a general agreement in the MIS field that an
organization's managerial personnel must participate in the development
of the MIS.
Statement of the Problem
While many of the leading authorities in the MIS field agree that
management involvement is an important consideration during systems
development, there are numerous opinions about the depth, form, and
degree of that involvement. Luthans has formulated a rather inclusive
definition of involvement:
Participation (involvement) as a technique means that an individual or group are involved in the decisionmaking process. It can be formal or informal, and it entails intellectual and emotional as well as physical involvement. (20: 277)
Although expressed in terms of involvement by employees in a superior-
subordinate relationship, this definition is also a useful frame of
reference for managerial involvement in systems development work. While
there is agreement that the "specialist must not dominate the installa
tion (of systems), and more responsibility should be given to the . . .
manager" (56: 10), the depth and form of involvement by managers
warrants additional investigation.
As an additional form of classification, the development of an
MIS will be divided into four phases: (1) system feasibility;
(2) system analysis, design, and planning; (3) system implementation;
and (4) system modification and maintenance. These four phases

generally may be referred to as the "Information Systems Application
Development Life Cycle." (5: 413)
The literature seems to indicate that the level of involvement
varies somewhat between the design and implementation phases, and it
varies even more between implementation and modification and mainten
ance phases. If a manager is involved only up to and including the
design phase, the implication drawn from the literature is that the
manager would have no contact with the system again until he received
the first reports. If the manager is involved through the implemen
tation phase, it is assumed he is actively participating in the systems
development up to the point that system results are verified. There
is little in the literature, however, that suggests the manager should
be involved through the maintenance and modification phase. While
not generally typical of the MIS literature, a statement from Gallagher
lends support to the fact that managers are expected to provide feed
back to the "Information Systems Manager" when changes in the system
are desired, i.e., modification and maintenance:
The user expresses his needs, wants, preference, etc. to the Information Systems Manager who compares these with the information systems' capabilities. Thereafter, the user provides feedback on deficiencies, changes, needs, etc. If all goes well, the system should, in theory, work well. (92: 6)
Because perceptions of involvement vary, the depth and degree of
management's participation in systems development lack concise defini
tion. This study will view involvement from two perspectives:

"pre-involvement," representing managerial involvement through the
implementation phase of the systems' life cycle; and "post-involvement,"
representing managerial involvement during the modification and main
tenance stage. Both pre- and post-involvement are combined in most
contemporary definitions of participation.
Additionally, several studies have been conducted to investigate
the impact of involvement on management satisfaction with an MIS.
These studies (discussed in Chapter II) are not in complete agreement
regarding the relationship between involvement and satisfaction. This
study will examine the impact of management satisfaction on pre- and
post-involvement. Finally, on the assumption that involvement in any
dimension may not be an adequate barometer of manager satisfaction, an
additional variable will be investigated: the impact of organizational
communication during systems development on management satisfaction.
Purpose of the Study
This study investigates five areas. First, the relationship of
pre-implementation involvement (pre-involvement) and post-implementation
involvement (post-involvement) to management satisfaction will be
examined. The first two research questions explore this involvement.
1. Is there a relationship between the manager's level of satisfaction with a management information system and the level of involvement exhibited by managers during the development of a system?
and

2. Is there a relationship between the manager's level of satisfaction with a management information system and the level of involvement exhibited by the manager after it has been implemented?
The relationship between involvement (both pre and post) has been
the subject of prior research. The preceding research questions (and
supporting analysis) are included in the study as a benchmark measure
ment—i.e., the answers to these questions will help determine the
relationship betv/een the results of this study and prior research.
The second area addresses the relationship between organizational
communication that takes place during the development and operation
of an MIS and management satisfaction. As explained in Chapter II,
effective organizational communication can improve job satisfaction
in superior-subordinate relations, and it also is employed to reduce
conflict in line-staff interaction. It has been suggested that reduc
tion of the "communication gap" would improve management satisfaction
and system performance. Because no supporting research exists, the
third research question asks
3. Is there a relationship between the effectiveness of management and Information Service Department personnel communication and the level of management satisfaction with an MIS?
The third area of the study examines those variables which may
promote or detract from effective organizational communication. If a
relationship between organizational communication and management satis
faction can be demonstrated, knowledge regarding those factors which

improve or deter effective communication would be important. Knowing
which factors improve communication could lead to a communication
strategy for system implementation. The fourth research question is:
4. Can a model be developed which indicates the success of organizational communication between managers and Information Service Department personnel during the "systems' life cycle?"
The scope of this portion of the study is limited to the identifica
tion of these factors, rather than presenting any generalized state
ments about the relationship of the factors to organizational communi
cation success. Consequently, the model may provide a basis for more
indepth research into the cause and effect relationships between
communication factors and communication success.
Finally, this study examines the responses of the two major
parties involved in MIS development: managers and systems personnel.
Because managers and systems personnel often seem to lack a shared
frame of reference with regard to building systems, the responses of
systems personnel will be compared with the responses of managers to
determine if they agree about any of the previously specified variables
and factors. Thus, the final research question:
5. Do managers and Information Service Department personnel tend to agree about: a) the level of pre-involvement of the manager? b) the level of post-involvement of the manager? c) the level of communication effectiveness
exhibited between managers and Information Service Department personnel?
d) the level of satisfaction of the managers with the MIS?

e) any of the communication factors which contribute to effective organizational communication?
Analysis of these questions will provide information which could
identify a common basis for the creation of successful MIS development
strategies.
This investigation contains two separate data collection and
analysis phases—a pilot study and a post study. The first phase
provides the means for testing questionnaires and refining the communi
cation models suggested by the fourth research question. The second
phase—the post study—is a case study. Though multiple cases are
involved in the analysis, the reader is cautioned against general
izing the results beyond the companies participating in the study.
Furthermore, this study is investigatory; it should be viewed as an
indication of variables and relationships that could be tested with
more rigorous methodological approaches to yield greater
generalizability.
Definition of Terms
To insure that terminology used in this study is clear, a brief
description of some of the key terms and concepts related to management
information systems is provided.
A management information system (MIS) is any computerized business
system created to supply managerial personnel within an organization
with decision-making information.
A programmed decision is a business decision made by an MIS
without human intervention. A programmed decision is any business
decision requiring some action on the part of the manager. Programmed
decisions are made directly by an MIS on the basis of a series of
decision rules. In a non-programmed, decision-making environment,
the manager is provided decision-making information from the MIS
because of the absence of decision rules within the MIS. More non-
programmed decisions are being made in a business environment than
are programmed decisions.
A user-manager (manager) is an individual within the firm
responsible for making decisions based, either totally or in part, on
the information provided by an MIS.
The Information Services Department (ISD) of the firm is the
organizational unit responsible for developing the MIS at the
direction of managers.
ISD personnel refers to individuals within the ISD possessing
the technical knowledge of computers and/or information systems
needed to perform the physical effort required to develop portions
of an MIS. This title includes the Information Analyst and the
System Designer positions. (5: 370-371)
The data administrator is the individual within the company
responsible for control of the company's data resources.
Involvement includes all acts of interaction between management
and ISD personnel during MIS development and is used interchangeably
with participation. Terms that apply more specifically to this study
are pre-involvement and post-involvement. Pre-involvement is that
interaction which takes place prior to the system becoming operational-

i.e., involvement during the system phases of feasibility; analysis,
design, and planning; and implementation. Post-involvement is that
interaction which takes place after a system has been placed into
operation—i.e., involvement during the modification and maintenance
phase.
The process of interpersonal communication involves the exchange
of understanding between two or more individuals. Organizational
communication, a subset of interpersonal communication, is the exchange
of knowledge between two or more employees of the same business entity.
Limitations
Because this study focuses on the involvement of the user-manager
in the development and modification of an organization's MIS, these
systems must be examined in their natural environment. That environ
ment is an MIS existing within a business enterprise. Firms included
in the study satisfy the following requirements.
1. The firm has an operational MIS which has been in existence for not less than five years.
2. The top, middle, and operating management of the firm have been involved in the MIS development effort.
3. The managers of the firm are receiving information from the MIS for decision-making purposes.
4. Both user-managers and ISD personnel are present at the same location.
5. There is a "sufficient" number of individuals in the company within the ISD.
6. There is a "sufficient" number of user-managers receiving information from the MIS.

10
Since human participants are involved, and they will be asked
their opinions about their involvement in the MIS development, the
possibility of bias exists. Part of this bias may result from try
ing to quantify qualitative factors; it also may be a result of past
experiences. (Some questions deal with the respondents' experiences
over a period of time; i.e., human memory may be a factor in measur
ing previous managerial involvement.)
While previous research efforts have been directed toward
assigning a value to the information provided by an MIS (92) , no
attempt will be made to quantify the value of the MIS or the informa
tion it produces. Rather, the user-managers' use of and "belief" in
the system and its information (as measured by his level of satisfac
tion) will be used to measure the performance of the system.
Organization of the Study
Chapter II reviews the literature relevant to the study. Included
in this chapter are literature of a general nature to introduce the
basic concepts of MIS, a review of research and non-research oriented
material of particular importance to this study, and literature related
to interpersonal and organizational communication. Chapter III presents
an indicative model of communication success on the bases of the liter
ature presented in Chapter II and refined through the pilot study. The
model will be used to create a communication framework. Chapter III
also includes a thorough presentation of the methodology to be employed
in the post study phase. In addition. Chapter III provides a discussion

11
on the creation and testing of questionnaires, the data collection
scheme employed, the expansion of the research questions into testable
hypotheses (where appropriate), and the statistical techniques utilized
in the analysis of post study data.
Chapter IV presents the results of the investigation. Included
in this presentation is a description of the level of response to the
questionnaires and individual discussion of the results achieved
for each of the five research questions, each broken down into the
results for the management group and the ISD group. The final chapter,
Chapter V, provides a summary of the findings of the study, conclusions
drawn from the study, and recommendations for further research.

CHAPTER II
LITERATURE REVIEW
The purpose of this chapter is to review the literature of
MIS and of organizational communication with particular attention
to those parts of the literature that address the problem of
communication inherent in the MIS-Management equation.
Section one is an examination of the general, rather than
research-based ideas, opinions, or concepts that appear in the
current MIS literature. Section two is an examination of research-
based conclusions relative to MIS. The final section is an exami
nation of literature related to organizational communication.
General Contributions to Management Involvement
An often-quoted article by Russel Ackoff offers a point of
departure for this consideration of general MIS literature. In
"Management Misinformation Systems," he presents a list of assump
tions that are often irrelevant to the design of an MIS:
1. A manager needs more information, when it is more probable that he needs more relevant information and a reduction in the quantity of unused or useless reports.
2. A manager needs the information he wants, when it could be that he may not know what he needs and is thus willing to accept any and all information.
12
13
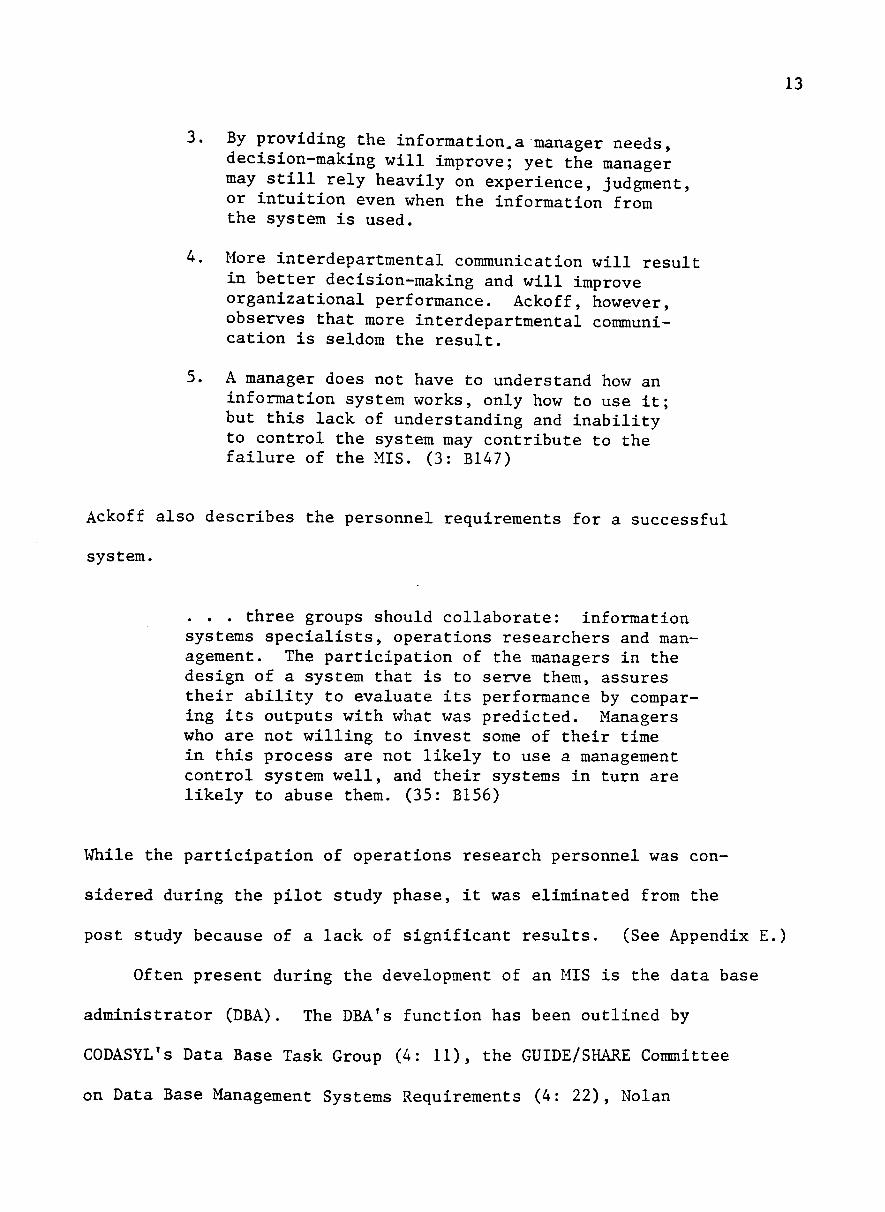
3. By providing the information,a manager needs, decision-making will improve; yet the manager may still rely heavily on experience, judgment, or intuition even when the information from the system is used.
4. More interdepartmental communication will result in better decision-making and will improve organizational performance. Ackoff, however, observes that more interdepartmental communication is seldom the result.
5. A manager does not have to understand how an information system works, only how to use it; but this lack of understanding and inability to control the system may contribute to the failure of the MIS. (3: B147)
Ackoff also describes the personnel requirements for a successful
system.
. . . three groups should collaborate: information systems specialists, operations researchers and management. The participation of the managers in the design of a system that is to serve them, assures their ability to evaluate its performance by comparing its outputs with what was predicted. Managers who are not willing to invest some of their time in this process are not likely to use a management control system well, and their systems in turn are likely to abuse them. (35: B156)
While the participation of operations research personnel was con
sidered during the pilot study phase, it was eliminated from the
post study because of a lack of significant results. (See Appendix E.)
Often present during the development of an MIS is the data base
administrator (DBA). The DBA's function has been outlined by
CODASYL's Data Base Task Group (4: 11), the GUIDE/SHARE Committee
on Data Base Management Systems Requirements (4: 22), Nolan

14
(74: 112-113), and Everest (90). While there is disagreement about
the function of the DBA, most sources seem to agree that the DBA
could have some contact with managerial and/or systems personnel
during MIS development. The DBA might provide a description of
currently available data and the possibilities of defining, acquiring,
and storing new data elements; this information could have an
influence on systems development.
The major parties involved in the MIS developmental process
are managers and ISD personnel. This study focuses on the interaction
of these two parties, but it is conceivable that the DBA function
might exist within any given firm. If the DBA function does exist
and is involved in the MIS development cycle, it could have a
definite impact on manager-ISD interaction. (The impact of DBA
contact on perceived communication success will be sought.)
There are several reasons for selecting and charging ISD
personnel with the design of new systems. Thurston lists several
reasons why the staff man should develop new systems: (1) systems
people are the principal source of new ideas due to their position;
they do not have to show an immediate return on investment and their
jobs are based upon examining and changing systems; (2) specialists
tend to be more highly trained in new methods and data-handling
equipment; and (3) there may be a commitment to systems development
by top management. (84)
Thurston adds that the appointment of specialists to handle
systems development is subject to a series of limitations including

15
(1) resistance by operating personnel to planning in which they have
no part; (2) the uniqueness of managerial positions, which tends to
limit the analyst's effectiveness due to his lack of familiarity with
the position; and (3) a disregard for practical considerations or
timing and cost aspects of a situation by systems personnel. (84: 137)
Dickson and Simmons point out that systems people, while acting
as change agents themselves, generally do not exhibit dysfuntional
behavior patterns; however, they have demonstrated an ability to
induce dysfunctional patterns in management personnel. (56: 8)
In part, these feelings come from inaccurate perceptions by users
of what the real impact of a new system will be, a fear of the unknown,
a threat to economic security, a fear of additional responsibility,
a threat to organizational status and a disruption of interpersonal
relationships. (49: 16)
Lucas provides a list of potential areas of conflict between
systems and managerial personnel including mutual dependence,
asymmetrical work relationships, differentiation and specialization
caused by system implementations, ambiguities and uncertainties
caused by the design process, competition for limited resources, and
obstacles in communication. (18: 30-31; 87: 327-328: 91: 3-4)
Stewart, Dalton, and Dickson and Simmons add conflict caused by dif
ferences in age, education, and outlook: these conflicts also are
found in line-staff relationships. (33: 196-198; 51: 344; 56: 8)
Dalton adds that " . . . complications arising from staff efforts
to justify its existence" and "incumbency of higher staff officers
16
were dependent on line approval." (51: 344) While some line mana
gers fear new techniques and systems, staff personnel fear the lack
of approval of their ideas. When line personnel resist their ideas,
staff personnel will attempt to acquire acceptance of their pro
posals in any form—even if the original idea has been so altered
that it no longer represents a solution to the problem. Staff per
sonnel may perform other acts of accommodation, including "keeping
quiet" about line practices or procedures.
Dalton also indicates that staff is cognizant of the authority
relationship between themselves and line personnel. Since the organ
izational structure of staff functions is "flat" (having few levels)
relative to line organizations, staff relies on line personnel for
promotions within staff departments or for lateral movement of staff
personnel into line positions. (51: 346) Reverse circumstances
rarely exist for line personnel, i.e., line managers generally do not
depend on staff officers for promotions or seek staff positions.
Browne and Golembiewski suggest that "essential collaboration
between these organizational subunits (line and staff) often results
in competition and conflict between departments rather than coopera
tion in working toward shared organizational goals." (44: 407) They
further demonstrate that differences between line and staff personnel
are real; that while little difference exists between line and staff
demographically (e.g. age, education, etc.), there are perceptual
differences on an "organizational image" dimension. They found that
line units characterized themselves as having:

17
1. high unit esteem or importance;
2. superior power and influence over other units;
3. low centrality (tend to be outer directed);
4. high affect (tend to like their department); and
5. high complexity (have a large number of dimensions by which departmental activities are measured). (44: 414)
Staff units, on the other hand, have low esteem, power, centrality,
affect, and complexity.
To minimize line-staff differentiation, Browne and Golembiewski
suggest that line and staff personnel should attend "workshops"
designed to inform them of the differences in organizational subunits
so that one group can better understand the other. (44: 416) Ainsworth
suggests that the data processing staff should attend departmental
meetings of their "clients." (38: 51) Furthermore, Browne and Golem
biewski suggest the consideration of alternate organizational patterns
which "encourage the integration and co-equal participation of both
line and staff units." (44: 416)
T fhile it generally is agreed that the staff specialist should
not have a free hand in designing systems for management, one should
consider having the manager totally control information inputs into
his own decision making environment. Thurston points out a number
of obvious advantages to this approach, including: (1) the manager's
knowledge of the job; (2) his greater capability to effect the required
changes in subordinates; and (3) his generally superior manpower

18
supply and acquisition capability. (84: 137-138) Thurston adds,
however, that making the manager his own systems designer also
presents problems: his limited knowledge of the methods of hand
ling data or other systems technologies; and his focus on his
own sphere of responsibility. (84: 138)
The involvement of management is necessary, but is not a
sufficient condition for the development of an MIS. (36) The
presence of the technical knowledge of ISD personnel also is
necessary, but by itself is not sufficient to successfully develop
systems. As a result of these limitations, managers and systems
personnel must work together to develop new systems, but their dif
ferences create a "communication gap" or a "lack of understanding"
between them. (38; 51; 84)
Diebold reported that "skill in motivating and communicating—
not technical knowledge—is the most important to executives in
fulfilling their responsibilities in data processing." (11: 10) In
addition Soden and Tucker indicated that the top two objectives of
MIS executives were to improve user communication and cooperation,
and to improve top management communication and support. (82: 29)
These objectives also are defined in a study by Gibson. (59: 21)
Thus, at least at the executive level, both management and systems
personnel seem to recognize the importance of communication.
All the responsibility for inadequate communication cannot be
placed on systems personnel. As Coleman points out, communication
difficulties are due, in part, to shortcomings of management:

19
A communication gap is . . . a reason for failure to obtain economic profits (from an MIS). We have a long way to go before the computer can speak management's language, and managers, by and large, are not about to speak the language of the computer (or the computer specialist). The result is a communication gap.
On the other hand, the analyst has little concept of the process of management or of the problems of management. Operation of the machine is their "thing", and their objective is frequently seen in terms of processing speed or pages of output. They have little knowledge of, or interest in, how the information is used to improve relations. (77: 56-57)
Dickson and Simmons also point out that effective communication and
user training by the ISD personnel assist in reducing dysfunctional
behavioral reactions to new systems. (56: 12)
In summary, it is probable that management and systems personnel
will interact when new systems or system extensions are necessary.
This interaction may produce dysfunctional behavioral patterns for
managers or conflict between managers and ISD personnel. This
conflict could stem from the organizational environment surrounding
line-staff relationships, demographic differences, or differences
in the "organizational image" of line and staff participants.
Effective communication has been found to be a useful weapon in
combating dysfunctional behavior and in closing the "gap" between
line and staff personnel.
Research Contributions to Management Involvement
This section discusses research-based evidence concerning the
concept of management involvement and its relationship to management

20
satisfaction. It should be noted that the findings presented do
not universally support a positive relationship between these
variables. Dickson and Powers indicate the necessity and depth of
user invo1vement.
User participation is crucial to the success of the MIS project. However, user participation must be taken literally: the actual manager who is to receive and use the products for the project, not staff personnel, should be the participants. (76: 149)
Sollenberger and Ainsworth support this position. (31: 41; 37: 47)
Furthermore, Anderson et provide a graphic portrayal of the
consequences of a lack of user involvement. (88: 5)
The basic "construct" on which many studies are based is that
the higher the degree of (total) involvement by the manager in the
development of an MIS application, the greater the success of that
application (as measured by user satisfaction). This construct
seems to be confirmed by the results of a study by Powers. (94: 100)
The earlier work of Coch and French indicated that the higher the
degree of participation by workers in the decision making process,
the higher their level of productive output and the less they tend
to resist change brought on by technological improvements. (3: 4)
In relation to Coch and Powers' findings, evidence presented by
Gallagher, Carter and Swanson tends to support the involvement-
satisfaction "construct." (58; 92; 46; 83)
Other studies, however, do not support the relationship between
involvement and satisfaction. Guthrie reports no significant
21
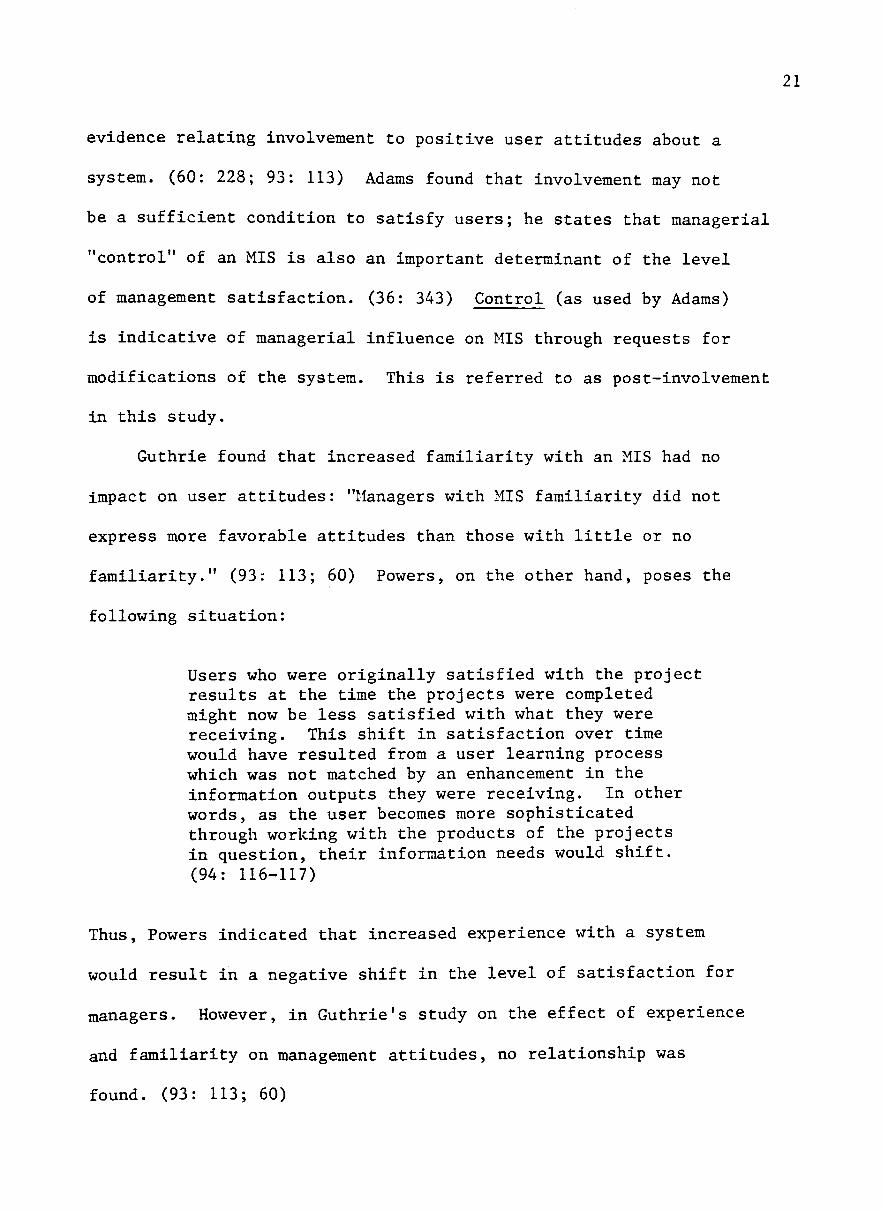
evidence relating involvement to positive user attitudes about a
system. (60: 228; 93: 113) Adams found that involvement may not
be a sufficient condition to satisfy users; he states that managerial
"control" of an MIS is also an important determinant of the level
of management satisfaction. (36: 343) Control (as used by Adams)
is indicative of managerial influence on MIS through requests for
modifications of the system. This is referred to as post-involvement
in this study.
Guthrie found that increased familiarity with an MIS had no
impact on user attitudes: "Managers with MIS familiarity did not
express more favorable attitudes than those with little or no
familiarity." (93: 113; 60) Powers, on the other hand, poses the
following situation:
Users who were originally satisfied with the project results at the time the projects were completed might now be less satisfied with what they were receiving. This shift in satisfaction over time would have resulted from a user learning process which was not matched by an enhancement in the information outputs they were receiving. In other words, as the user becomes more sophisticated through working with the products of the projects in question, their information needs would shift. (94: 116-117)
Thus, Powers indicated that increased experience with a system
would result in a negative shift in the level of satisfaction for
managers. However, in Guthrie's study on the effect of experience
and familiarity on management attitudes, no relationship was
found. (93: 113; 60)

22
These findings could possibly be explained by what Lucas refers
to as a "cycle" in the development of a system:
More management support leads to increases of computer potential which results in more favorable attitudes toward the EDP staff. These attitudes encourage the user to become more involved in the design of system which tend to increase the potential he perceives for the use of the computer. . . . As long as the cycle is a favorable one, so that force creates more favorable attitudes, greater potential, etc., then conflict should b'e reduced between users and the computer department. Hov7ever, if the cycle is a negative one, then it is important for management, users and computer departments to develop a strategy which changes the direction of the forces. (67: 64-65)
Gibson reached a similar conclusion. (59: 21)
The use of a programmer/analyst position led to poor time
performance but higher user satisfaction in Powers' study. He
states, " . . . the high user satisfaction seemed to be attributed to
the ability of the user to look to one person for any problem that
arose." (94: 107) This higher rate of satisfaction could be
attributed to the manager's looking to "one person" to solve problems,
suggesting that the degree of familiarity between managers and ISD
personnel improves communication. Lucas observes that the higher
the interaction rate, the worse the user's attitudes toward the
EDP staff. (18: 40; 66: 112)
The research findings presented in this section demonstrate a
relative state of knowledge about the relationship between involve
ment and satisfaction; and it is not intended to be an exhaustive
examination of all research efforts. While the state of knowledge
is incomplete, there seem to be many points of conflict in the
23
research regarding the relationship of satisfaction and involvement.
In light of the above findings, this study will attempt to determine
(for the participating companies) what relationship exists between
the manager's level of satisfaction, his level of involvement (pre-
involvement) and his capability to influence (post-involvement) an MIS,
The research studies reviewed above make one universal assumption
regarding involvement; that is, involvement and satisfaction are
positively related. This relationship could be viewed as a quasi-
linear function, with ever higher levels of involvement being assoc
iated with higher levels of satisfaction. No evidence has been
presented in the literature to suggest that there may be some point
of "diminishing returns." Beyond some point of an "adequate" level
of satisfaction, one might expect a downward shift in the level of
satisfaction. This could explain the lack of uniform results in
previous reseaiich. If "total" involvement does not lead to "total"
satisfaction, measuring the level of involvement could lead to
erroneous conclusions about the level of satisfaction. Thus, an
investigation for an additional barometer of management satisfaction—
perhaps the effectiveness of communication—might be warranted.
Contributions to Interpersonal and Organizational Communication
In Chapter I, the term "organizational communication" was
defined as:
. . . a subset of interpersonal communication which is confined to the mutual interchange of understanding between two or more employees of the same business entity.

24
As Haney suggests, organizational communication is the coordination
of people (by communication) who are interdependently related. (9)
This study will examine the area of organization communication between
two interdependent groups of employees—managers and ISD personnel.
Pettit et^ £l^ cite the importance of further research into organiza
tional communication because current research findings are inconsis
tent and lack application in business environments. (75: 47) They
suggest that a possible reason for this is that communication activi
ties in one organization may bear only slight resemblance to those in
another because of organizational variables. (74: 47) Davis adds:
Effective communication is not a substitute for other needed management qualities. It will not, for example, make up for poor planning. But the point is that even good plans must eventually be communicated to others in order to become effective. Communication is the bottleneck through which effective management ideas must pass, so it often is a key managerial problem. (52: 308)
Furthermore, management is sometimes prone to attack the symptoms
of communication problems, rather than make a direct attempt to
improve communication. (64: 680)
The discussion of the communication literature will be developed
around the Berlo model. The "SMCR" communication model, shown in
Figure 1, includes several components: the sender, the message, the
channel, and the receiver. (1: 30-72) In addition, Berlo suggested
that feedback is an important dimension (or "ingredient") of communi
cation. (1: 102) Finally, message filtering will be discussed in
relation to its impact on communication. (For further details see
Appendix M.)

25
H J
u § ^ u
w o <: en cy2 Ix]
2
C^ M
M c c M C -H -H C - H ^ , - t
•H S-i O i H 0) CO 3 0) (U (U O E
CO PC H C/D
<9 O 9 O
W cx; D H -U
o c i=) 4J OJ Pi C £ H (U -U CO 4J cd 0) "->» C tU -a cn o j o H U H U
M • 9 «
W
0£ C
•H 4-1 CO CO
•
cc; M H H-1 M ( j ^
Pi i i
> M
U
Pi
S <U
C £ 4 - 1 O <U CO
•H -U >^ +J CO CO CO CD 0) >^ O CO OJ 60 CO rH
•H i H 13 ^3 CO C i H 3 (U rH >-l 3 -H 4J T H CO 3 £ .i<; - H 5 -H +J £ CO 4J O a r-i O 4-1 C O 3
U < : tKi CO U
1 • •
^ C
< P C |J Ci pi
-1
~ w CJ
« s o en >. Pi w Q 2
w CO
« • 9
^ J r: 3 3 J J H
f= (U
^ c e •!-» O OJ CO
•H 4-J >^ 4J CO C/2 CO CO OJ >% cj CO a; &01/5 t - i
•H i H x ) "TS cO
3 .H 4-t i H to 3 g ^ -H > -H 4-t 6 CO 4J O O i H o 4J c a 3
O < ^ CO CJ
• • 9 <9 9
c o
•H 4-1 CO CJ
• H
c
o u <4-i
o
cu
o
o • H CO CO
pa
0)
3 ClO
•H

26
Figure 1 also includes the properties of communication identi
fied by Hunsicker. (64: 681) He indicated that communication is
related to three levels of analysis—technical, behavioral, and
structural. The technical level involves the media and methods of
message transmission, including communication skills. The behavioral
level incorporates an examination of attitudes and the dynamics of
interpersonal relationships. The structural level of analysis deals
with communication properties and problems which stem from the
formal organization structure.
The sender and receiver components of the model share many
properties—communication skills, attitudes, knowledge, and the
social-cultural system. Berlo identified at least five basic verbal
communication skills: writing, speaking, reading, listening, and
thought or reasoning. (1: 41-42) Although these communication
skills will not be investigated directly in this study, they are
imbedded in the message and channel components of the model. Thus,
the physical manifestations of these skills, rather than the skills
themselves, will be examined.
The second factor related to the sender is the attitude of
the sender—a predisposition or tendency. Berlo mentions attitudes
toward self, subject material, and receiver as being embodied in this
factor. (1: 46) The latter two are seen to have the greatest impact
on this study. It is obvious that new systems represent change,
and managers may resist change. That is, they may avoid the subject
matter. Also, Lucas has pointed out that there may be predispositions

27
on the part of managers toward ISD personnel—attitudes toward
receivers. (67)
The third factor is sender's knowledge level. Berlo succinctly
describes the problem:
It is obvious that the amount of knowledge a source (sender) has about his subject matter will affect his message. One cannot communicate what one does not know; one cannot communicate with maximum effectiveness content material that one does not understand. On the other hand if the source (sender) knows "too much", if he is overspecialized, he might err in that his particular communication skills are employed in so technical a manner that his receiver cannot understand him. (1: 48)
However, both Powers and Guthrie indicate that system experience
had little influence on project success. (94; 60; 93) In addition.
Powers, Schewe and Wiek noted that high formal education had an
inverse relationship to successful computer operations thus suppor
ting Berlo's position that "too much" knowledge might be detrimental.
(94; 80)
The social-cultural system is the next factor discussed by
Berlo. The social system of the sender is composed of organiza
tional variables such as rank, prestige, status, role, group member
ships, and so forth. The cultural system is composed of variables
such as nationality, religion, etc.
Some of the variables of the social-cultural system were dis
cussed in conjunction with line-staff relationships. It has been
noted that differences between line and staff personnel contribute

28
to difficulties stemming from their interaction. Thurston has
argued for training of line personnel through staff ranks to reduce
these differences. (84) \^ile this might be a practical objective,
it may not be desirable. Maier £jt , in a study of the backgrounds
of superiors and subordinates, point out the desirability of at
least minimal differences between line and staff personnel. (73)
In effect, subordinates had a tendency not to develop a "trusting
relationship" with superiors who had previously held their position.
(73: 9) Subordinates did not want to divulge problems to superiors
who may have faced and solved the same problem. The lack of common
experiences between a superior and his subordinate was suggested
as an environment under which a "trusting relationship" could be
more easily developed. (73: 9-10)
Differences also exist in the basic communication patterns of
line and staff personnel. Guetzkow points out that staff employees
tend to have wider or more dispersed formal communication networks
than their line counterparts. (8: 537) However, the higher level
of the individual in either line or staff, the wider his communica
tion network becomes.
Lillico indicates that "cognitive distance" plays a major role
in communication accuracy, (17) and that:
1. the higher the individual's position in a firm, the more accurate his communication; (17: 78)
2. communication parties do not tend to be as open when there is a difference between them in terms of status, prestige or power; (17: 41-44)
3. the greater the amount of trust, openness and confidence, the more accurate the communication. (17: 53-54)
29
The importance of status as a communication factor also was noted
by Guetzkow: "The larger the status differential, the more restric
ted the channels of communication, the greater the tendency of
information to flow from low to high status persons, and the more
distorted the content of messages." (8: 548)
In this study, status is dictated by two factors—organiza
tional position and technical knowledge. The manager has status
in the company due to his position and because he has an in-depth
knowledge of a particular decision-making situation. Lawrence
and Lorsch term this "position-based" influence. (14: 170) The ISD
personnel have status primarily due to their technical knowledge
of computers and systems design. Lawrence refers to this as "know
ledge-based" influence. (14: 170) In addition Lucas and Lillico
indicate that, over time, the EDP consultant may develop "trust-
based" influence. (72: 34; 17: 54) Also, influence may be gained
by initiating communication—"initiative-based" influence. (8: 536)
A study by Alter indicated that the source of MIS project initiation
is an important indicator of project success. He states that 11
of 15 non-userr-initiated systems had implementation problems, while
only 4 of 31 userr-initiated projects encountered such problems.
(39: 103)
The difficulty with communication is that if both task-oriented
and status-oriented messages are competing for reception, the
effectiveness of communication may be hampered. (16: 73) Thus,

30
status and its impact on the effectiveness of manager-ISD personnel
communication will be examined in this study.
Finally, in regard to the differences between managers and ISD
personnel, DeWhirst states that technically-oriented individuals
are not as likely to exhibit information-sharing behavior as manage
ment personnel. (53: 310-311) However, information-sharing norms
can be influenced by management by encouraging the use of interper
sonal (oral) channels—an indication of information-sharing behavior.
(53: 312)
The receiver component of the Berlo model has the same factors
as the sender component. That is, the receiver is also character
ized by communication skills, attitudes, knowledge and social-cultural
systems. More importantly, the presence of the receiver is indica
tive of a two-participant activity. That is, the sender transmits
information to the receiver. Potentially the receiver may become
the sender for the communication cycle. Thus, without a receiver
component, an analysis of the communication process would be
incomplete.
The next major component of the model is the message. Berlo
divides the message into codes, content, and treatment; each of which
has certain elements and structure. (1: 54) All codes have elements
(a vocabulary) which are organized in some meaningful manner (syntax
or structure). (1: 57) The content of messages is composed of ideas
which are arranged or ordered. (1: 59) The treatment of a message

31
relates to "the decisions which the communication source (sender)
makes in selecting and arranging both codes and contents." (1: 60)
The presence of status-oriented messages and task-oriented
messages has been mentioned. However, the focus of this study
will be on task-oriented messages—those messages which are
directly related to the development of information systems. In
that respect, task-oriented messages related to system feasibility,
analysis, design and planning, implementation, and modification
and maintenance will be examined. Status-oriented messages will
be examined only if they have an impact on successful communication.
The next model component is the channel. Berlo identifies
characteristics of the channel in terms of human senses—seeing,
hearing, touching, smelling and tasting. (1: 72) However, he
further classifies the sub-phases of the channel as the modes of
encoding and decoding messages, message vehicles, and message car
riers. (1: 64) Within the scope of this study, the human senses
of seeing and hearing are the most important; they are the primary
senses used in oral and written communication. In terms of the sub-
phases within the channel, oral and written communication fall
within the realm of message vehicles. Vehicle carriers (sound waves
traveling through the air or visual symbols appearing on paper)
are important, but do not fall within the scope of this study.
Also the modes of encoding and decoding messages will not be studied,
The necessity of incorporating the channel component into
the model is pointed out by Guetzkow:

32
As the technical base of the organization becomes more salient, problem solving communication seems to develop channels of its own . . . specialists engaged in organizational problem solving consistently evade official prescriptions in order to get the job done, especially in the matter of communication. (8: 945)
It should be evident that several modes of interaction are
possible when two parties are engaged in communication of either a
bilateral (two-way) or unilateral (one-way) form. The most often
used forms of communication are face-to-face, oral, written, and
telephone. Conrath conducted a study of these modes of interaction
and their relationship to organizational structure and found that
"not only was face-to-face traffic more likely to be associated
with task relationships, but it was the preferred mode for all
interaction." (50: 597) Also, face-to-face communication was
more frequent when the parties were within a few feet of one another,
(50: 598; 8: 536) Burns added to this by indicating that managers
spent as much as eighty percent of their time engaged in oral
communication. (75: 50)
These findings seem somewhat inconsistent with Woodward's
earlier works that indicate a greater reliance on written communica
tion in the "middle ranges" of managers in production-oriented com
panies. (34: 66-67) The extremes of the scale (top management and
operating management) tended to employ more verbal (oral) communica
tion. In addition, she reported a tendency toward written communi
cation in mechanistic (highly structured) companies. Baker also
found written communication to be used more in larger companies.

33
(8: 539) In organic (less structured) companies. Woodward found
a tendency to employ "verbal" communication utilizing face-to-face
contact and the telephone. (34: 24) Thus, the level of the communi
cation and internal structure of the organization seem to have a
direct impact on the media choice.
Included in the findings of another study by Level were indica
tions that superiors preferred oral communication when communicating
information requiring immediate action. (65) When action based on
communication was less immediate, written communication was pre
ferred. The same conclusion was reached when information was of
a general nature. The most effective form of communication for
policy changes, directives, orders, or work progress statements was
found to be oral communication with a written follow-up. Level
concluded that oral communication appeared to be best when immediacy
of action or personal contact—with on-the-spot feedback—were
required.
Davis conducted a study on downward communication between
superiors and subordinates in several levels of an organization,
and reached the same conclusion as Level. (52) Davis classified
messages as either task-oriented or non-task-oriented. He found
that oral communication (with a written follow-up) was the choice
of managerial personnel when communicating task-oriented messages
to subordinates. This form of transmission also was found through
several levels in the organization. Oral communication also was
preferred by managers for non-task-oriented messages, but those

34
messages were not as effective in reaching their final destination
as written messages.
The serial effect (the passage of information through a chain
of sender-receiver pairs in a serial or linear pattern) seems to
have a greater impact on oral communication than on written communi
cation. This conclusion is based on the observations of Merrihue.
He states that oral communication is less desirable when:
1. statements are qualified by the sender; 2. the recipient does not take notes; 3. the sender fails to ask for feedback; 4. the message is to be transmitted through
more than three levels (individuals); 5. the sender considers the message to be important; 6. the message contains complex or detailed elements;
and 7. when there is an ideological difference between
the sender and the receiver. (23: 177)
To take advantage of feedback afforded by face-to-face, oral
communication and to minimize the influence of the serial effect,
Merrihue suggests that "a combination of oral and written communi
cation must be used—with the heaviest reliance being placed on the
written media." (23: 179) However, the previously noted studies
by Level and Davis indicate the reverse is true.
DeWhirst indicates that information-seeking behavior of scien
tifically oriented professionals will "take the path of least
resistance," i.e., technically oriented individuals will seek
information from "colleagues within their own organization" and will
use oral, face-to-face channels of transmission. (53: 306)

35
Guetzkow agrees with this statement in part by observing that "the
direction of flow of messages would seem to be more one-way and ver
tical in the authority and information chains, while in expertise
chains, the flow would seem to be two-way and lateral." (8: 546)
He also states that "solicited" information is more readily retained
by the receiver than "volunteered" information. (8: 567) This is
consistent with a "theorem" stated by Berger and Calabrese that
the ''amount of communication and information-seeking behavior are
inversely related." (42: 107) That is, when specific information
is sought communication becomes more directed toward the targeted
area without the necessity of probing peripheral areas.
DeWhirst further stated that information-seekers would use
the oral channel only if the psychological "cost" of doing so is
not excessive. (53) That is, technical personnel will seek infor
mation through internal sources only if they do not encounter resis
tance. Webster indicates that there are "costs" associated with
using the written messages which clog channels with worthless, non
productive communication. (85) Also, Guetzkow points out that
written messages must compete with one another when they reach the
receiver. (8: 538)
The first component added to Berlo's model is filtering. Fil
tering generally has the effect of altering or distorting messages
as they are transmitted through an organization. "The 'content'
of a message undergoes various kinds of changes as the message is
passed along, in serial fashion, from one human 'link' to another."
(26: 105)
36
Usually several things can happen to messages as they travel serially in an organization: details are omitted (leveling), added (adding), highlighted (sharpening), modified to conform to the interest, needs and feelings of the reproducer (assimilating). (7: 17)
These reactions to messages can be classified broadly as filtering.
(8: 554)
Filtering might occur in an MIS development effort if a group
of managers is represented by one or more persons from the group
on the MIS project team, or if the ISD personnel assigned the MIS
development task are not directly responsible for translating the
manager's desire for information into the computerized procedure
for providing the information.
Davis recognized that filtering could occur, but was one of
the first to recognize that filtering occurs in both upward and
downward communication. (52: 305) He mentioned that certain task-
oriented messages transmitted from a superior to a subordinate
were assimilated by the subordinate to more clearly fit his parti
cular situation. (52: 306) This could be interpreted to mean that
all filtering is not necessarily dysfunctional.
Redding suggests that overload represents the excess of input
over the ability of the message receiver to "handle" such input.
(26: 87) Brown emphasizes that many of the filtering techniques
used in the serial transmission of (predominantly oral) messages
are also used under overload conditions. These devices include
leveling, approximating and assimilating. In addition, the

37
overloaded communicator may choose queueing (establishing a priority
for handling messages), error processing (correctly interpreting
messages, but taking an incorrect response) and escape (terminating
message flows). (43: 323-324)
Obviously, factors like queueing are more highly related to
written communication since they lend themselves more readily to
ordering and storage. For example, Hascal indicates that a pri
ority system may be used in the handling of memoranda—thereby
processing the most urgent messages, while "holding" those not
immediately required. (62: 83) Guetzkow noted the filtering
which occurs through omission (an indicator of overload) may be
circumvented through the use of specialized languages, i.e. techni
cal jargon. (8: 553) Other approaches for overcoming overload
(such as verification and redundancy of messages) tend to also add
to the overload problem. (8: 558-559)
In relation to MIS development, Dickson and Simmons emphasize
that systems designers should be careful not to overwhelm the user
with large volumes of output. (56: 12) Guthrie adds that time-
triggered and exception reports are not necessarily the answer to
"output" overload. Finally, Dickson and Chervany suggest that
statistical summarization is not the solution. (47: 1343)
The last component of the communication model is feedback.
Although not a component of his graphic model, Berlo describes the
importance of feedback in communication:

38
Feedback provides the source (sender) with information concerning his success in accomplishing his objectives. In doing this, it exerts control over future messages which the source (sender) encodes. (1: 111-112)
Bariff and Lusk found the need for feedback is not uniform
throughout the organization. They indicated that administrators
demonstrated a greater need for MIS progress reports than did
supervisory personnel. (41: 827) In the study by Powers, for
malized and regular progress reporting was not related to MIS
success. (94: 94-97) Sollenberger, however, insists that progress
reports serve as an important communication link between the
systems function and users. (31: 39)
Redding states that "the sender of a message has no way of dis
covering what kind of response his message is getting (or even
whether the message was received) except through some form of feed
back." (26: 39) Based on this concept of feedback. Redding insists
that bilateral (two-way) communication is essential. Haney indenti-
fies the following advantages of bilateral communication:
1. It tends to lead to less hostility or frustration due to the lack of restriction on feedback.
2. Due to feedback, it is more accurate. 3. It generates more confidence about the correct
interpretation of a message by the recipient. 4. It is more likely to result in a positive action
or decision. 5. It tends to stimulate morale or circumvent morale
problems. 6. It tends to reduce defensive behavior of the sender,
and to a lesser extent, the receiver. (61)

39
It also appears to be useful in the development of positive organiza
tional relationships. (8: 560) Berger and Calabrese indicate that
the more uncertainty there is in a communication situation the higher
the reciprocity (bilateral communication) rate. (42: 105) They
further indicate that dissimilarities between communicating parties
promotes uncertainty (42: 106), thus stimulating information-seeking
behavior on the part of the participants. (42: 103) Thus, a pro
cedure is demonstrated which might reduce the sources of conflict
which have been previously enumerated.
Bilateral communication has many additional characteristics.
Haney categorizes these characterstics as taking more time
1. When the sender has established a familiar and routine pattern of communicating messages to the receiver.
2. When the emotional reaction of the receiver should be minimized.
3. When orderliness is an important criterion. (61)
Leavitt and Lillico basically agree with the above statements. (15:
150-151; 17) However, Guetzkow adds to the second point by stating
that when message initiation becomes regularized between senders
and receivers, this results in more "output per input." (8: 539)
This " . . . indicates the importance of past experience in the
determination of communication flows." (8: 540)
Summary
This chapter addressed three main areas: general MIS litera
ture, research based literature, and literature related to

40
organizational communication. The first section discussed the
necessity of having both management and ISD personnel involved in
MIS development. Many areas of potential conflict exist between
management and the ISD; this conflict may stem from the introduction
of change brought about by the introduction of a new system or
through what appears to be inherent difficulties with line-staff
relationships. Improvements in communication may be at least a
partial remedy for this conflict generated during the development
of an MIS.
The second section of this chapter presented research-based
evidence concerning the involvement of management in MIS develop
mental activity. Coch and French found that in non-MIS related
activities participation of workers improves productivity and
decreases resistance to change. (3) MIS related studies by Powers,
Sollenberger, Ainsworth, Gallagher, Carter and Swanson found that
high levels of involvement are related to high levels of satisfac
tion. (94° 31; 37; 58; 92; 46; 83) However, no relationship was
found to exist between these two variables in a study by Guthrie.
(60) In the Adams study, involvement was found to be less strongly
related to management satisfaction than managerial influence over
the system after implementation. (36) Explaining the difference
in findings, Lucas suggested a negative "cycle" of development may
be present—initial negative feeling of management toward ISD per
sonnel are amplified with each successive contact. (18) Powers and
Guthrie identified an experience or maturity cycle. (93; 94) They

41
further suggested that because of experiences, what could have
once satisfied management might become less satisfying with increased
familiarity. Thus, there was some doubt about the universal effi
cacy of using involvement as a predictor of management satisfaction.
The final section was built aroung the Berlo "SMCR" model.
Research based evidence also identified variables which research
indicates to be related to effective communication. Variables such
as position, status, knowledge and initiation of contact were iden
tified in the sender component; status and task-oriented messages
were discussed. The channel component provided variables related
to the oral and written media, when these media tended to be used
and what types of messages were most effectively transmitted with
each medium.
The Berlo model also included a filter component. The effects
of leveling, adding, sharpening, and assimilating were discussed.
In addition, filtering resulting from information overload was
described. The receiver component had the same general qualities
as the sender component. Finally, the feedback component was
discussed. While not graphically presented in the SMCR model,
Berlo identified the necessity for feedback. The importance of
bilateral communication was discussed along with the impact of
variables such as information-seeking behavior on effective
communication.

CHAPTER III
METHODOLOGY
This study involves both a pilot study and a post study. This
chapter describes the methodology for both studies. First, the use
of pilot study data in pretesting questionnaires, the characteristics
of the pilot study sample, and the pretest methodology are discussed.
Second, the analysis procedures used to develop the communica
tion success models from the pilot study data are described. Third,
the post study methodology is described: (1) a description of
the revised post study questionnaire, (2) the characteristics of
the post study sample, (3) a description of the three companies
studied, (4) the hypotheses tested by the study, and (5) a descrip
tion of the analysis used on the post study data. The first part
of the analysis discussion deals with testing the hypotheses, while
the remainder presents the approach used to test the communication
success models. These test results are presented in Chapter IV.
The Pilot Study
This section, dealing with the pilot study as a pretest, examines
the creation of the questionnaires used in the pilot study, describes
the pilot study sample, and provides the details of the pretest
procedure.
42

43
Creation of the Questionnaires
Questions and scaling techniques that could provide appropriate
data for this study were generated from the five research questions
stated in Chapter I. The research of Powers, Lucas, and others was
reviewed to help determine the appropriate types of questions for the
measurement of management satisfaction, pre-involvement and post-
involvement. (94; 66; 67; 69; 71) A study by Downs and Hazen was
used as a source for questions dealing with communication satisfac
tion. (57) Guidelines formulated by Pettit and superior-subordinate
communication studies conducted by Davis, Maier, and others were used
in the development of communication factor questions. (75; 52; 73)
The questions were reviewed and those providing redundant data
were eliminated. The remaining questions were divided into two cate
gories: MIS-oriented questions and communication-oriented questions.
These categories were submitted to faculty members with expertise in
the two respective areas, resulting in a further refinement of the
questions. The remaining questions were placed in a questionnaire
format and submitted to a preliminary test. In this "trial run" a
small number of managers and ISD personnel from one company were asked
to complete the questionnaires. After the questionnaires were returned,
each respondent was interviewed to determine his or her reaction to
each question. As a result of the interview responses, some of the
questions were recast to minimize misinterpretation. The final version
of the questionnaires used in the pilot study appears in Appendix A.
(For further details about the preliminary test see Appendix N.)

44
Characteristics of the Pilot Study Sample
The pilot study sample served four purposes: (1) the data
collection provided an opportunity to test the procedures used to
gather the post study data, (2) it served as a questionnaire pre
test, (3) it acted as a refining mechanism for the post-study ques
tionnaires, and (4) it produced data for constructing the communica
tion success models.
The pilot study questionnaires (shown in Appendix A) were sent
to managers and ISD personnel in five Midwestern firms. The firms
selected met the requirements listed in Chapter I. (These require
ments are examined in greater detail later in this chapter.) Each
firm received 15 questionnaires; nine to managers and six to ISD
personnel. The total number of questionnaires in the pilot study was
75 (45 managers and 30 ISD personnel). A total of 51 (68%) were
returned with usable responses (58% of the managers and 83% of the
ISD personnel). The data from these questionnaires were coded and
punched as two separate files for analysis. One file contained
management data and the other contained data from ISD personnel. The
data then were sampled for accuracy and corrected where necessary.
Pretest of the Questionnaires
Because the post study questionnaires were to be completed by
individuals in a business environment, it was desirable to conduct
a field pretest; a pretest increases both the accuracy and reliability
of the questionnaires.

45
No attempt was made to disguise the information sought. Oper
ational definitions were included (in the introduction to the ques
tionnaire, in the instructions for segments of the questionnaire,
and within specific questions) to aid the respondent in supplying the
requested data. It is presumed that a high level of face validity
is associated with the questionnaires. However, Selltiz al . point
out the pitfalls of assuming face validity, and as a remedy, they
suggest the examination of questionnaires with regard to statisti
cal reliability. (30)
Reliability has two components: (1) an equivalence measurement
or the amount of internal consistency demonstrated by the respondent
when indicating a preferred answer to a series of similar items, and
(2) the stability of responses. Stability is a reflection of the
amount of variability in responses to the same or similar items
over some period of time. (30: 168) If a measurement tends to vary
over time, the results obtained from a respondent cannot be relied
upon due to their transitory nature.
Two objectives of the equivalence measurements are related spe
cifically to the pretest and the subsequent collection of data for
later analysis. The first objective is to determine if the question
naire is exploring the dimensions the writer is addressing. These
dimensions (or variables) are listed in Table 1, along with the asso
ciated questions on the pilot study questionnaire. The second objec
tive is to use a sufficient number of questions to accurately measure
the dimensions. That is, the writer should be aware that some

46
CO
o M H CO
D o-Q
<: CO W «
M Pd <: >
w pq <:
CO OJ M
• H CO
c c o •H 4J CO
o; 3
Cf 4J CO (U 4 J OJ
u ^
o 4-1
c o
• H 4J CO
i H (U Pi
cx) < ! •
1 cn •<3-
• vt
CJO
CO
e-s
CM CM
• r t
"4-1 A
(U r H CN
• W\.
^4-1
O CN
1 (1>
O CM
J 2 M
CO CN CN
• * , Q
M
CO rH CN
• M
J^ «\
CO O CN
T J
«\ a
CN CN
• M
T J A
o i H CM
« #k
T 3 # t
O O CN
i H
•« 1
^ en
o i n
.., ON >3-
• « i n CO
1
-^ CN
• CTi r H
I as
(U r H . Q CO
• H M CO
>
C o
•H 4-)
o CO
<+-4 CO
• H 4-1 CO
CO
4-t
c (U £ S GO CO
C CO
S
4-)
c cu £ (U >
i H O > C
M 1 (U U
A4
• u
C (U £ 0) M CO CI CO
S
c OJ
£ cu >
i H
o > c
M 1
4J CO
o p
4J
c (U £ <U 00 CO
c CO
s
CO CO (U o o 3
CO
C! o
•H 4-1 CO
o •H C 3 £ £ o u
CO >-i
o 4J
a CO
f t ,
c o
•H 4-1 CO
o • H
C 3 £ £ 0
U
CN m m

4 -»
questions may be nondiscriminatory or redundant, making it possible to
reduce the number of questions necessary to measure "management sat
isfaction," for example, to the two or three questions that provide
an ample measurement of that variable.
To achieve these objectives of equivalence measurements, the
questions in each of the categories of Table 1, except for category 5,
were factor analyzed. The communication factors are discussed,
analyzed and, in some cases, eliminated in the creation of communica
tion success models. This factor analysis generated an equivalence
measurement (and weightings) that represents the essence of those
questions (i.,e., to identify those questions that explain the
greatest amount of variance in the group of questions as a whole).
The factor analysis techniques were chosen because of their
ability to identify clustering or grouping of variables; in addition,
these techniques often are used for the purpose of data reduction.
(24; 469; 25; 289) (For the purpose of factor analysis, each question
was treated as a variable.) The specific techniques utilized the
Statistical Package for the Social Sciences (SPSS) program "FACTOR"
(factor analysis). (24: 468-514) The specific parameters applied
were for principal component (axes) factoring without iteration
(PAD and an orthogonal rotation (VARIMAX). The principal factoring
technique is designed to "improve" communality estimates (i.e. the
amount of total variance the variables have in common). (28: 103-105:
24: 480) The VARIMAX rotation maximizes the variance between factors
to make individual factors more identifiable. (24: 485) The result

48
of this process was a table of factor loadings—the correlation
between factors and the original variables—where a factor represents
a (weighted) linear combination of all variables. (25: 291) (See
Appendix B.)
The output from the procedure was index measurement based on
the questions used in the pilot study questionnaires and the factor
loadings of the pilot study data. This amounts to using a least
squares estimate as a predictor for each of the factor analyzed
categories of Table 1, based on standard factor scores and using the
factor loadings as weights for each factor. (25: 294) (See
Appendix G.)
To gather the data for the pretest, a procedure similar to
that used in the post study was used. A smaller number of respon
dents, representing five companies, was utilized to provide the
maximum possible variation. The results of this procedure provided
additional guidelines in the administration of the measurement
instrument.
The procedure followed in the pilot study differed from that
used in the post study in one other way—the respondents in the pilot
study were interviewed as a follow-up procedure. The interviews
accomplished several purposes: checking the wording of questions for
clarity; examining instructions completeness; determining the under
standing of the scaling procedures used; measuring the ease of using
the scaling devices; and establishing a level of stability for the
questionnaires as a whole.

49
Interviewing the pretest respondents involved asking the respon
dents to express their feelings about difficulties in completing the
questionnaire. A portion of the interview dealt with the stability
of responses. During the interview the respondents were again asked
to answer the questions. These oral responses were recorded and the
oral and written responses (i.e. pairs of individual question scores)
were subjected to analysis via the Wilcoxon Signed-Ranks Test. As
Spence et^ aJL note, this test is particularly well suited to the analy
sis of the matched (dependent) samples. (32: 216) It was presumed
that the same respondent answering the same questions (once in writing
and once orally) constituted a matched sample. (For a detailed des
cription of the Wilcoxon Signed-Ranks Test see Spence et^ al_. , Kirk,
Kurtz, Hays, or Mason (32: 216-218; 12: 500; 13: 181-183; 10: 635-637;
21: 464-467).) Generally, the test was used to determine if there
was a significant difference between two matched groups. The ques
tionnaire passed the stability test; the level of significance for
each question was .05 or less. (See Appendix C.)
Construction of Communication Success Models
In Chapter II, the impact of many identifiable factors on com
munication success was indicated. In this section, many of these
factors are analyzed and placed in the context of perceived communi
cation success models. It should be noted that these models are
indicative, not predictive, and are based on the perceptions of
the communicator as related through empirical evidence. No attempt

50
will be made to determine if a communicator's perceptions are
accurate portrayals of reality.
Analysis of the Pilot Study
The questions of interest in this section are listed in Table 2.
The data gathered through the use of these questions were analyzed
by the Statistical Package for the Social Sciences (SPSS) programs
NONPAR CORR (which produces Spearman correlation coefficients) and
CROSSTABS (which produces a corrected chi square statistic). For
the purposes of correlating the data to "communication success,"
questions 36 through 51 were summed for each respondent and an
"average score" was determined. (This average score was significantly
correlated with the factor weighted score for communication success
at or beyond the .002 level.) These data were correlated with all
the data represented by the remaining questions in Table 2. (See
Appendix E.)
In addition, the communication success scores were divided
into "successful" and "unsuccessful" categories for chi square analy
sis. If the average score fell within any of the "adequate" classi
fications (from the questionnaire), the score was judged to represent
a successful communication sequence as perceived by the respondent.
If the score fell at the midpoint or beyond on the questionnaire
scale, it was judged to represent an "unsuccessful" communication
sequence. (See Appendix E.)
Finally, the group of managers (N = 13) which fell within the
"successful communicators" category was further analyzed using
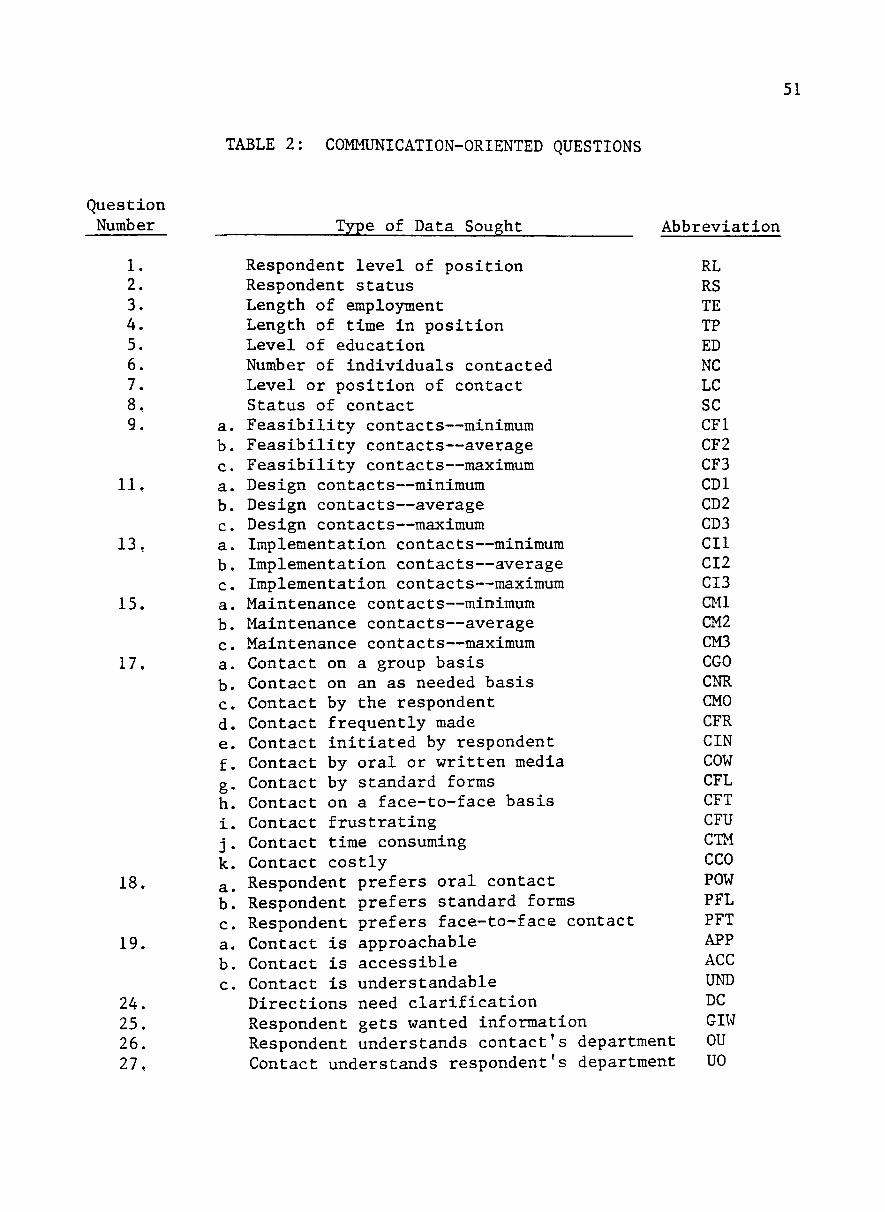
51
TABLE 2: COMMUNICATION-ORIENTED QUESTIONS
Question Number Type of Data Sought Abbreviation
1. 2. 3. 4. 5, 6. 7. 8. 9.
11,
13.
15.
17.
18.
19.
24. 25. 26. 27,
a. b. c. a. b. c. a. b. c. a. b. c. a. b. c. d. e. f. g-h.
i.
J-k.
a. b. c. a. b. c.
Respondent level of position RL Respondent status RS Length of employment TE Length of time in position TP Level of education ED Number of individuals contacted NC Level or position of contact LC Status of contact SC Feasibility contacts—minimum CFl Feasibility contacts—average CF2 Feasibility contacts—maximum CF3 Design contacts—minimum CDl Design contacts—average CD2 Design contacts—maximum CD3 Implementation contacts—minimum CIl Implementation contacts—average CI2 Implementation contacts—maximum CI3 Maintenance contacts—minimum Cl'U Maintenance contacts—average CM2 Maintenance contacts—maximum CM3 Contact on a group basis CGO Contact on an as needed basis CNR Contact by the respondent CMO Contact frequently made CFR Contact initiated by respondent GIN Contact by oral or written media COW Contact by standard forms CFL Contact on a face-to-face basis CFT Contact frustrating CFU Contact time consuming CTM Contact costly CCO Respondent prefers oral contact POW Respondent prefers standard forms PFL Respondent prefers face-to-face contact PFT Contact is approachable APP Contact is accessible ACC Contact is understandable UND Directions need clarification DC Respondent gets wanted information GIW Respondent understands contact's department OU Contact understands respondent's department UO

52
TABLE 2: COMMUNICATION-ORIENTED QUESTIONS (Continued)
Question Number
28. 29. 30. 31. 32. 33. 34. 35. 36. 37.
38. 39.
40.
41.
42. 49. 50.
Type of Data Sought
Respondent oversteps authority Contact oversteps authority Receipt of information delayed Written clarification needed Oral clarification needed Most efficient communication form Specification are unclear Contact cannot provide information Respondent's knowledge Respondent's communication of information need to contact
Contact's knowledge Contact's understanding of respondent's need
Contact's communication of capability to satisfy need
Respondent's understanding of contact's capability
Contact's relative status Data administrator contact Operations research staff contact
Abbreviation
lOA TOA TDO WC oc MEG SU CNP CSl CS2
CS3 CS4
CS5
CS6
SRM CDA COR

53
measures of correlation of "successful communication" to the other
questions in Table 2. The purpose of this analysis was to determine
whether a specific factor contributed to successful communication or
resulted in perceived communication difficulties. The results of
this analysis also are shown in Appendix E.
Construction of the Management Communication Model
The results shown in Appendix E were used in the construction
of the indicative communication success model for managers. To
construct the model, the results of analysis were coupled with the
Berlo model presented in Chapter II. The reader will recall the
components of the model were: the sender, the message, the channel,
the filter, the receiver, and feedback. Recall also that the filter
and feedback were added to Berlo's basic model. For the purpose of
the model, the factors listed in Table 2 will be placed in one of
these six component categories.
Not all factors present in the pilot study were found to be
significant. Thus, only those factors that were significant at the
.200 level or below were included in the model. (The .200 level was
chosen as the cut-off point so that any factor which was "relatively"
significant could be further examined in the post study.) The treat
ment of the analysis follows the pattern described below. (See
Appendix E.
If either the Spearman correlation coefficient or the chi
square statistic was significant at the .200 to the .150 level, it
is indicated in the model as a weak detractor from communication

54
success, and it received a code of -1. If the factor was significant
at the .149 to the .100 level, it received a code of -2, indicating
a moderately weak detractor from communication success. Significance
at the .099 to the .050 level is coded at -3, a moderately strong
detractor. Finally, a factor which was significant at the .049 level
or higher is coded at -4, representing a strong detractor.
The same coding sequence was employed for the Spearman correla
tion coefficients for the "successfully" communicating respondents,
with a plus sign rather than a minus sign. Thus, +1 is a weak
promoter of successful communication, +2 is moderately weak, +3
is moderately strong, and -f-4 is a strong promoter of communication
success.
The results of this process were used to produce Figure 2 (a
communication success model for managers). It should be pointed out
that those factors which are accompanied by a plus sign (a factor
perceived to contribute to successful communication) are of greatest
importance. Furthermore, those factors with higher codes are viewed
as being more important on the basis of a higher level of significance.
In Figure 2, the characteristics of the sender that were found
to be of greatest importance (listed by the strength of their rela
tionship to communication success) were:
1) the manager does not perceive himself as overstepping his authority when engaged in a contact with ISD personnel (-H4) ;
2) communication with ISD personnel is more successful when the manager is his own spokesman, rather than having someone act as his surrogate (+3);

55
H J
NNE
S o
Pd O <: CO CO w 2
^-s
<r u 1 o
v-^ CO
' O CU . ^ cu 4J CN CO o -f-
cO ••> 'O •H q! 0) ^3 <U CO
itten me
en writt
etters u
u
1 •H
i£ ""
X CO £
. . V
CO / ' N CO
4J ••< - f CO •• ^-N V - '
^-^ O CO 4-1 -H C
CO ^ ^ o 0) 'T3 'H M OJ > , 4J
r messa
) relat
sibilit
lementa
Pi M
M fe
/ ^ r - l
1 v,^
CO
c o •H 4J CO O
• H 14-1 •H O (U
^~\ C < r O 1
•H - ^ 4J >J-to -h
•H / - v <4-l <!• T ) •H 1 (U M - ^ £ CO CN 3
i H -f- CO
o ^ c , - s o 3 CN C CJ (U 1 o 4-t ->>, - H CU 4-1 s r -M £
a -H - f CO -H t o
}-i CO (U
t H CJ C
D
/-~v CO -1-N—'
C O (U
•H O •u C CO CO
Modifi
Mainte
<U £ CO cu t 3 T) 5 3 <U £ <U £ pLi M fe
c c CO CO
u ^^ U U 5 -u
TS CO i H (U <U 3 CO
i H T3 5-1 £ 4J CU "4-1 -H 4-1 <U £ •H C O -H i J S s
Pi
o < 2 ^
V w /
P«J M
2 U CO
^-v CM CM 1
1 ^^
CO i H 3 <U -M > CO CU 4-1
i H CO
^ 5 o o
H J H J
4-1
a CO
4-1
c o a
o 4J CO
4J CO
•H C
•H
£ TD CO
CO 4-1 CO
Q
/~s CN
-1-s_^
4J
(U £ >> o i H O. £ s tsO c o
H J
^ - N
CM 1
1 > , ^-^ rH
4J CO CO 3 O 4-1 O CO 4J Q CO CO
M CU
> .c •H 4-1 4-1 -H CO 5
rH (U 4J ^ o
.--N CO CM 0) 4-1
1 U C V-' o o
S u
/—\ O CO M
»^ Pi
> M
w CJ
w Pi
CO 1
1—1
-1-V w '
rH (U > (U
i H
4^ 00
•H IXl
/—\
n (+1)
(+1)
1)
act (-1
ms (-1)
O - H C -t- 4J }^ •H (U -H -^ C O 4J > O M-l •H (U TJ 4J O CO rH <U O t S O > CO C J-i a , 3 rH 4-1 OJ CO
O o r ^ C 4-1 TJ 3 -H > CO O -u 3
•H 4-1 £3 -1 - O -H CO CO -H ^ ^ }-l 4-1
<U O CO 5 CO £ 3 >^ 4-» OJ
•H T3 rH O -Ul CO CO 4-1 (U -P CO CO .j M
O 4-1 -H 0) OJ
tsox: <U c -U ^ ^ 3 M >-i O -H CU <1> O -H -H O (3 M t-i
H3 ffi Q (H PL, PL,
/--N
^ 1 / - s
•<r 1
m ^^ <r 1 -1-
N~,' a) >—' i H
CO .Q (U 3 CO rH 4-1 43 J3 CO O -H 4-1 CO CD CD O CO
U (U :? a o O D- o t - i < J <
ISD's
TJ
c &, CO (U 4-J 4J / ^ CO CO < t >-l V -h (U 0) ^—' ^3 > c O >^ 3 4-1 4-1 - H 4J O J^ O
c o c CO 4-1 CD 0) 3 (U O CO o Q Q
>» 4J •H
o ' ^ x: < r 4-1
1 3 " - - CO
-f a •>—' <u
4-1 <U CO
r-l u Xi cu CO >
T3 O c CO -U / - s U O <f CO 3 1 V< ^-^ CU CO -<i-
-O CU 4-C O ^ '
: = Q
/"-v < t
1 N ^
c o •H 4J •H CO
o a
CD
^ CU C>0 CO 3 0) CO £ £ -H
4J 13 C O CO 4-1 / - ^ 4J CVJ CO (U 1 }-l / - v 3 ^ ^ <U -vT n3
-O 1 CO 3 N_^ cu -U 3 rH C
C X I -H 4-t O CO CO O -H rH >-l 3 i J v-l i J
•H CO CO CO CO > 3 <U O CO o O O. C o Q t 3
t»:i CJ
P5 Q W W fLi
13 (U <U 4J -—N 13 a <t '<-f ' ^ CO I > en 5 ^-^ o 1
! - i
4-1 3 a . d QJ O O txO -H 4-1 -H
4J O 4J 4J CO 3 CO
o £ d £ d V4 CO ^
G O O CO M-l '-I-I <u d Q d O "H CO -H
Q M
CD S-i d)
CO
d CO
XI
13 CU >
•H 0) O u cu p
CM CD
< V4 3 <-\ bO (U
•H T3 Pn O
CD CD (U o o 3
CO
d o
•H 4-1 CO CJ
• H
d 3
o CJ

56
3) the longer a manager is employed by a company, the more successful his communication (+2); and
4) the longer the manager holds a position, the higher his level of education with respect to "computers" and "information systems," and the more he initiates contact with ISD personnel, the more likely his communication is to be successful (-f-1).
Those factors found to be negatively correlated with communication
success for the manager were:
1) not understanding the position of the ISD personnel (-4);
2) a lower level and status in the organization (-2); and
3) a preference for written forms of communication, especially standard forms and reports (-1).
Between the manager and ISD personnel, successful communicators
tend toward fewer messages (especially at the maximum level)
related to feasibility, design, or implementation of systems (+3).
The same basic pattern also was present for system modification and
maintenance messages.
In the third component—the channel—management respondents
indicated that when a written mode of communication was employed,
successful managers preferred notes or letters over standard report
formats (+2). However, the use of written media versus other media
choices was highly associated with unsuccessful communication (-4).
The fourth component of the model was the filter. Filtering
does have an impact on communication, as noted in Chapter II. The

57
manager's model indicates that successful communicators found little
need to have written messages clarified, and they felt the time
spent with ISD personnel was minimal. They also felt little
frustration (+2).
Unsuccessful communicators found contact with ISD personnel
frustrating and time consuming (-4). They further indicated that
contact was costly, written messages needed clarification, and
communication with a data administrator was counter-productive
(-2). They also suggested that system specifications were unclear,
and if they held a status superiority over the ISD personnel,
communication suffered (-1).
The receiver characteristics the successful manager found
associated with ISD personnel were that they are accessible, approach
able, understandable, and do not overstep the limits of their
authority (-f-4). If managers felt ISD personnel did not possess these
characteristics, it was extremely detrimental to communication
success (-4). The managers perceived that a high level ISD indivi
dual contributed more to communication success (-t-1) than an indivi
dual at a lower rank (-3). The manager perceived communication
difficulties stemming from a lack of knowledge of ISD personnel about
the manager's position (-4). In addition, managers felt communication
problems arose when the ISD personnel held low status (-3) and were
unavailable for interaction because their jobs required them to
perform other duties (-2).

58
The final component—feedback—also was added to Berlo's model.
It was not found to have any positive impact on communication success
as perceived by the managers. Managers felt that communication prob
lems were associated with not receiving information they had requested
from ISD personnel (-4) or the inability of ISD personnel to provide
requested information (-3). This could be interpreted to mean that
managers expect adequate feedback and were influenced only if the
anticipated feedback was not forthcoming.
Construction of the ISD Communication Model
The preceding discussion dealt with the creation of the manage
ment communication success model. During the analysis of data
provided by managers and ISD personnel, it was discovered that the
responses of these two groups were similar, but not the same.
Slightly different patterns of association were found between communi
cation success and the variable set. As a consequence, the ISD
communication success model was developed separate from the
management model.
The questions used in the analysis of ISD data were the same
questions presented in Table 2 for management respondents. The
analysis procedure used on the management data was duplicated for the
ISD data. (See Appendix E.) The results were coded (using plus,
minus, and levels of significance) in the same manner as described
for management data.
The consequences of this procedure are reflected in Figure 3 —
the ISD communication success model. As seen in this illustration.

59 NEL
2: <3 P3 CJ
w o < CO CO
w S
^—s r - l
sr -1-- ^
O A-^ U T-i CO CD 1
o <u - ^ £ *J -vT o -1-
13 d ^ ^ (U CO ••• T3 3 d <u
ral media
hen writte
letters us
o
A-'
12
£ CO 3 1 £ >-• 13
•H d d >» CO
• H 4-1 £ 'H ••>
t H / ^ CO ' H <d-
, Q 1 4J - H '^-^ CO CD
^-^ CO d (U o
CO Et. - H
message
ted to
ementat
CO r-^
A~\
CN
+ V — '
4-t
tac
d o o
ne-to-one
o
/ ^ N
C J 13 1 d "^ CO
d
tenance
ficatio
d -H 0) rH CL«H 13 ^t <U £ O >-i M S
CO O S S
Pi w H rJ M ^
<^ /-^ ^ ^ -vT r- (
-d- CD I I I d --- --^
— . O CO > ^
^ -H 4- -1-4 - 4J Nw' v_^ ^ - ^ O r H / - N
tU CO 1 3 >3- 1 3 M ;-i S-I (U 1 CU CO ' H O 1 3 — £ (U 1 3 CU <J- 3
r H M CU -f- CD
a MH o d "^ d o o CD d d d CJ
d d <u o o O O /-N U -H -H (U
•H -H »^ 4-1 4J 4J £ 4J 4-1 1 "H CO CO 'H CO CO ^-^ >-t a >-i 4-t O O 13 -H 4J
•H -H 13 M-l CD rH <4-l <4-l (U <U -H 3 CO •H -H 13 rH >-i J-I £ O >-l (U 4J CO IM -H (U CO 0) 4-1 rH d Q. rH d -H CJ O -H CO CJ HJ Z S
/ ^ CN
1 > ^ U o CO
ar cont
r-i 3 00 <u Pi
/ ' -N
o CO M Vw<'
Q Z
CO
-1- ' ^ ^-^ ^-^ CO <r 1 /-N
1 d ^- ' fM --~ o -1-<3- 'H rH ^-^ + U (]} ^-^ 'H > 4-t
-—N CO (U O CN 4-t O rH CO -1- d CJ- +J ^-^ CU C C
E d o o CO > . -H "H O
igh statu
ong emplo
ong time
ow educat
nitiates
ffi HJ HJ hJ M
>s r-t
4-1 4-1
CJ CD CO O 4J O
d O CO
a u 0)
U 00 O CO •u d CO CO U £
4.1
CD . d •H 4J d -H
£ 1 3 4J CO O
/ - ^ CO A-^ CO CO -U CN
•p -t- d 1 CO N - ' o ^ - ' p a
/—s Pi w CJ <3 2
s_^
Pi
>
CEI
w Pi
—\ CO
/ - N 1 < ) • > ^ ^—X
1 ^r • ^ QJ 1 < • r H - > ^
A^ + ^ <t CO ^-' CO -H
1 43 ^^ v ^ CO o
3 CO 0) rH 4J O rH 0) CO M XI > 4J a -H OJ CD CU CO
rH CO CO J3 QJ
IS 00 4J a O -H O CJ
H4 s z <:
-i-CD
4-t -O >-l CO <U U 00^-v d CO <t o d 1 CJ CO ^
£ <N r H -f-cO CD "-^
refers or
nderstand
position
cu 1=1
i4 u
DBA
w Cl4
X - N
13 -^t OJ 1 4-1 /—s ^-,^ d < r CD CN CO 1 0) - f 5 ^^ 13 '•-
•H 4-1 d > d <u o o o
oes not g
informati
anager pr
informati
P S
d o
/ - N - H CM 4-t
1 -H N w ' CO
O > . D.
4J • H CO >-l -O P
x : CO
3 CO CO
1 3 CO d O . CO /'-^ Q) 4J - 3 -4-1 CO 1 CO !-l ^ > ^ l-l QJ ^ QJ 1 3 -H
c ^ : ^ ^
CO 4-1 d
• H CO U 4J CD
d o o 0)
tim
^—s 14-1 ^ r O 1
M <r a -1-cO ^ - '
r4
•
QJ d d o CD u Q)
PU
P CO
1 3 QJ >
•H 0) a
• • j - i CO QJ
QJ U CD 3 < 0 0 ^ - '
•H fi^ rH
QJ 1 3
O

60
ISD personnel perceived communication to be more successful
1. if they had been employed and held their position for a long period of time (-H4) , they preferred oral contact (-1-4); and
2. if they had high status, initiated contact with managers, and understood the manager's position (+2)
The ISD personnel perceived communication to be less successful
1. if they had been employed only a short time and did not understand the manager's position (-4); and
2. if their level of education about "management" was low (-3).
ISD personnel indicated that several factors of composition
and message orientation were related to communication problems.
These factors included messages related to system implementation
(-4), system feasibility and design (-3), and system modification
and maintenance (-2). That is, communication deteriorated when
more messages containing these elements were transmitted. Finally,
poor communication and lack of regular contact with managers was
perceived as being related (-2).
The variables of the channel component were found to be highly
significant for successful communicators. Successful communication
was marked by a high use of oral messages (-1-4) , while poor communi
cation was associated with the written media (-1) . -Jhen written
media were used, successful communicators used letters or notes (-1-4),
while less successful ISD personnel used standardized forms or reports

61
(-1). Finally, those ISD personnel indicating the use of a one-to-
one interface with managers also perceived their communication to
be more successful (-1-2).
The filtering which seemed to be present in the ISD data sug
gests that communication success is related to clear system speci
fications, little frustration and a minimal amount of time consumed
in the communication process (4-4). Communication also was viewed
as being successful when contact was made with the data administra
tor and written or oral messages from management needed little
clarification (-1-3).
Communication difficulties arose when specifications were
unclear, directions and written or oral messages needed clarifica
tion, and when frustration was present (-4). Perceived high cost
of contact with managers (-2) and interaction being viewed as a
time consuming process (-1) were less detrimental.
ISD personnel perceived that the reception of their messages
was improved when the manager was accessible, understood the position
of ISD personnel, and when the manager was not constrained by
other demands on his time (-1-4). Improved message reception was also
slightly associated with high levels of status of the manager (-Hi) .
All of the above factors were reversed when communication difficul
ties occurred. In addition, when the manager held a low level
position or was unapproachable, communication performance decreased
(-3). Finally, communication was not as successful when ISD personnel
were overstepping their authority (-2).
62
The impact of feedback on communication success for the ISD
model is very similar to that demonstrated in the management model.
That is, feedback is accepted as a "given" unless it is not present.
Both the lack of information from the manager and his inability to
provide some types of information had a negative effect on communi
cation. However, ISD personnel did indicate that the manager's
ability to provide information acted as a limited plus for success
ful communication (-1-2) .
The objective of this section has been to create communication
models that reflect the perceptions of the respondents in the pilot
study. The data were subjected to analyses that indicate there
are some fundamental differences between the perceptions of
managers and ISD personnel.
The data were subdivided into a management group and an ISD
group. The management data were analyzed and further subdivided
into a "successful" communicating group and a "less successful" group.
The model used was Berlo's communication model, with filter and feed
back components added. The data representing significant factors of
communication success were placed within the framework for the comple
tion of the management communication success model. The same proce
dure was followed for the ISD data to derive the communication success
model for ISD personnel.
The Post Study
As previously stated, the pilot study was used to develop, test,
and refine the questionnaires used in the post study; in addition.

63
pilot study data permitted the construction of the communication
success models tested in the post study, \ fhile much of the post
study development occurred during the pilot study, a few additional
details need explanation: (1) the development of the post study
questionnaire; (2) the general characteristics of the post study
sample accompanied by a brief description of each of the participating
companies; (3) a list of hypotheses to be tested, stated in terms of
relationships among management satisfaction, pre-involvement, post-
involvement, and communication success; and (4) a description of
the methods used to analyze the hypotheses and communication
success models.
The Post Study Questionnaire
A portion of the pretest was dedicated to a factor analytic
study of the questions placed in the management satisfaction, pre-
involvement, post-involvement, and communication success categories.
The results of the factor analysis are provided in Appendix B.
Thus, the battery of questions in each of the four categories on the
pilot study questionnaire were condensed to a list that provided
the most discriminating results.
The final category on the pilot study questionnaire dealt with
communication factors; these questions were analyzed in conjunction
with communication success. Only those questions (communication
factors) which were relatively significant in relation to communica
tion success were retained for the post study questionnaire. As a

64
consequence of the pretest and model construction, a rather lengthy
pilot study questionnaire was condensed into the more manageable
post study questionnaire.
Characteristics of the Post Study Sample
In Chapter I, several limitations were mentioned in relation
to the companies which took part in the post study. The firms were
selected on the basis of the following limitations.
First, all firms had had an operational MIS for a portion of
their organization for a period of not less than five years; managers
had had the reports from the MIS for not less than five years. There
are three reasons for this limitation:
1. with the initial installation of an MIS there may be some technical adjustments in the system while both managers and ISD personnel become accustomed to a new, "modified" environment. Such internal dynamics could alter behavior patterns in an unpredictable manner. Therefore, a firm which has had a chance to "mature with a new environment"—a firm in which equilibrium adjustments have been made— is viewed by this writer as a more stable source of data;
2. although a manager may have been involved in the development of a system, this does not mean he has worked with the resulting system. Five years should provide the manager with an opportunity to work with and make decisions from MIS-produced reports; and
3. a portion of this research deals with the feedback of information after the MIS has been used and the capability of the manager to influence the system. Thus, some time period must be set aside for the manager to react to what is produced by an MIS.

65
Second, all levels of management (top, middle, and operating
level managers) should be receiving some product of the MIS. The
receipt of MIS-generated reports is a prerequisite to managerial
involvement (i.e., if a manager is not receiving reports, it is
unlikely he has been involved in any MIS development efforts).
Third, since the objective of an MIS is to assist the manager
in his decision-making activities by providing information, it is
necessary for the manager to take some action on the basis of the
MIS products; i.e., using the information. Although there was no
way of assuring that managers were using the information, the
management participants received the information and were presumed
to have used it to make decisions.
Fourth, both managers and ISD personnel were working at the
same location. This requirement was necessary so that oral, face-
to-face contact might be analyzed with a minimum of obstruction.
Physical distance between communicating parties represents one
possible obstruction, as noted in Chapter II.
The fifth and sixth limitation dealt with the number of managers
in an organization receiving MIS reports and the number of ISD per
sonnel employed by the firm, respectively. An arbitrary acceptable
minimum of 100 managers and 25 members of the ISD for each firm was
established so a number of alternative forms of system development
might be possible, i.e., from project teams to one-to-one relation
ships. That is, individual managers may not always come in contact
66
with the same representative from the ISD. These numbers for managers
and ISD personnel also increase the likelihood that the data admin
istrator function would be present in the companies.
The three companies selected to participate in the study meet
or exceed each of the above criteria. In addition, all of the firms
in the post study sample could be classified as large corporations—
they are among the 500 largest corporations operating in the United
States. However, additional characteristics are important to note
for at least two reasons. First, the models developed earlier in
this chapter were based on a "composite" company; i.e., the data
used in the creation of the models came from five separate companies.
Consequently, the models themselves are not based on any one exist
ing company. The data gathered in the post study provided the oppor
tunity to compare the models with three existing companies, thus allow
ing a comparison of the conceptual aggregate model with existing
organizations.
Second, as mentioned in Chapter II, ". . . due to organizational
variables, communication activities in one organization may bear only
slight resemblance to those in another." (76: 47) The three companies
used for model comparison purposes have different organizational
characteristics. This provided the opportunity to compare the
models with firms which operate in different organizational environ
ments. Thus, the three companies of the post study provided the
opportunity to test the models with three separate sets of data.
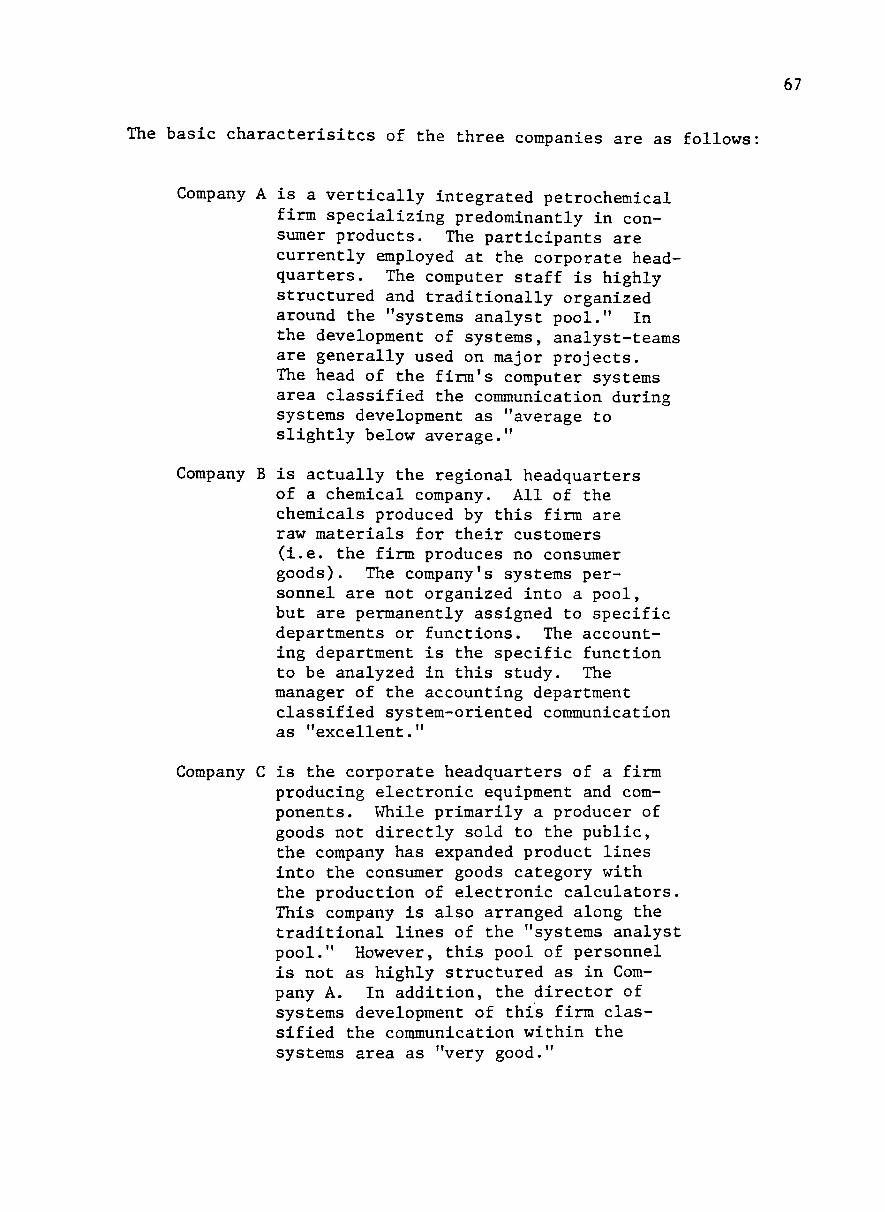
67
The basic characterisitcs of the three companies are as follows:
Company A is a vertically integrated petrochemical firm specializing predominantly in consumer products. The participants are currently employed at the corporate headquarters. The computer staff is highly structured and traditionally organized around the "systems analyst pool." In the development of systems, analyst-teams are generally used on major projects. The head of the firm's computer systems area classified the communication during systems development as "average to slightly below average."
Company B is actually the regional headquarters of a chemical company. All of the chemicals produced by this firm are raw materials for their customers (i.e. the firm produces no consumer goods). The company's systems personnel are not organized into a pool, but are permanently assigned to specific departments or functions. The accounting department is the specific function to be analyzed in this study. The manager of the accounting department classified system-oriented communication as "excellent."
Company C is the corporate headquarters of a firm producing electronic equipment and components. While primarily a producer of goods not directly sold to the public, the company has expanded product lines into the consumer goods category with the production of electronic calculators. This company is also arranged along the traditional lines of the "systems analyst pool." However, this pool of personnel is not as highly structured as in Company A. In addition, the director of systems development of this firm classified the communication within the systems area as "very good."

68
Statement of Hypotheses
In Chapter I, five research questions were presented to explain
the purpose of the study, but those questions are not sufficiently
explicit to represent testable hypotheses. Thus, it was necessary to
construct testable hypotheses that represent the essence of the
previously stated research questions. It also was necessary to
establish the relationship between the hypotheses and the questions
that appear on the measurement instrument.
From Chapter I, the first research question was:
Is there a relationship between the manager's level of satisfaction with a management information system and the level of involvement exhibited by the manager during the development of a system?
As pointed out in Chapter II, there is some current research that
suggests this relationship does exist. There are three reasons,
however, for examining this relationship. First, it was important
to determine if the post sample had properties which are related
to the samples of previous studies. Second, the communication
factors (presented in the communication models) may have some rela
tionship to pre-involvement and its effect on satisfaction; conse
quently, this relationship has an impact on other portions of the
study and cannot be assumed. Finally, each hypothesis will be
checked against two sets of data—one set of data from managers and
one from ISD personnel—to determine the level of agreement. This
is a departure from the approach used in most studies. In this manner

69
the fifth research question will be operationalized. The reader
may recall from Chapter I that the fifth research question was:
5. Do managers and Information Service Department Personnel tend to agree about: a) the level of pre-involvement of the manager? b) the level of post-involvement of the manager? c) the level of communication effectiveness
exhibited between managers and Information Service Department personnel?
d) the level of satisfaction of the managers with the MIS?
e) any of the communication factors which contribute to effective organizational communication?
Parellel testing of hypotheses on two sets of data from the same
source (company) is one way to determine the amount of agreement.
In addition to parallel tests of hypotheses, the data will be com
bined in another set of tests that will be referred to as the
"agreement" hypotheses.
The writer feels that conducting the study in this manner may
yield two important conclusions. First, if there is a wide disparity
between the manager's viewpoint and the feelings of ISD personnel
this could mean managers and ISD personnel are not communicating
effectively. If this is true, then any future research into the
"manager-analyst" interface problem should consider the viewpoint
of both parties rather than only the manager or only systems per
sonnel. If there is a difference between the viewpoints of managers
and ISD personnel, then selecting only one group for analysis may
yield biased results.
70
The null hypothesis, alternate hypothesis, and the entries on
the questionnaire employed to evaluate the hypothesis generated
from the first research question are stated below. The null hypo
thesis is:
HI-A: There is no relationship between the manager's level of satisfaction with a management information system and the manager's level of pre-involvement in the development of the system.
The alternate hypothesis is:
HI-A': There is a positive relationship between management pre-involvement in the development of a system and his level of satisfaction with that system.
The entries on the questionnaire used to investigate this hypothesis
are provided in the form of two indexes. The indexes used are the
"Management Satisfaction" index (I^) and the "l>lanagement Pre-involve
ment" index (I< ). (See Appendix G.)
On the basis of an analysis of pilot study data, the alternate
hypothesis (Hl-A') is supported. Both managers and ISD personnel
feel there is a relatively significant positive relationship between
management satisfaction and managerial pre-involvement in the MIS
development effort. However, pre-involvement and satisfaction are
somewhat more strongly related for managers than for ISD personnel.
The null hypothesis for the agreement between managers and
ISD personnel with regard to satisfaction is:

71
Hl-B: The manager's view about his level of satisfaction with an MIS is not related to the view of ISD personnel.
The alternate hypothesis is:
Hl-B': Managers and ISD personnel disagree about the manager's satisfaction with an MIS.
To evaluate this hypothesis, two sets of I will be used (one set
from management respondents and one from ISD personnel). The null
hypothesis for pre-involvement is:
Hl-C: The manager's view about his level of involvement in MIS development is not related to the view of ISD personnel.
The alternate hypothesis is:
Hl-B': Managers and ISD personnel disagree about the manager's satisfaction with an MIS.
The second research question for this study was:
Is there a relationship between the manager's level of satisfaction with a management information system and the level of involvement exhibited by the manager over the system after it has been implemented?
There is limited research evidence which indicates a positive rela
tionship between post-involvement and satisfaction as measured by
the manager's ability to make specific modifications to an existing
MIS. (35)

72
Since there is some evidence that post-involvement may be an
indicator of management satisfaction, its presence or absence in
the sample is important. This condition also could have an impact
on the communication between managers and the ISD. In addition, if
there is a disparity between managers and ISD personnel regarding
the adequacy of post-involvement, both managers and the ISD should
be made aware of the problem.
The null hypothesis, alternate hypothesis and the means of
evaluation for the second research question are stated below. The
null hypothesis is:
H2-A: There is no relationship between the manager's level of satisfaction with a management information system and his post-involvement with an existing system.
The alternate hypothesis is:
H2-A': There is a positive relationship between post-involvement and the manager's level of satisfaction with a system.
The entries on the questionnaire used to analyze this hypothesis
are represented by the "Management Satisfaction" index (I.) and
the "Management Influence Capability" index (I-). (See Appendix G.)
The pilot study data suggest that management's post-involvement
is somewhat related to management satisfaction. However, this rela
tion was positively correlated only for managers, while ISD personnel
demonstrated a negative correlation.

73
The null hypothesis for the agreement of managers and ISD per
sonnel with respect to post-involvement is: .
H2-B: The manager's view of their post-involvement with an MIS is not related to the view of ISD personnel.
The alternate hypothesis is
H2-B': Managers and ISD personnel disagree about the level of post-involvement of managers with an MIS.
The evaluation of this hypothesis is based on two sets of I_,
The third research question, on which no direct research-based
evidence exists, and the fourth research question, represent the
main focus of the study. The third research question is:
Is there a relationship between the effectiveness of management and Information Service Department personnel communication and the level of management satisfaction with an MIS?
The writer contends that the effectiveness of communication between
managers and ISD personnel may be as much a determinant of manage
ment satisfaction as a high level of pre- or post-involvement. Thus,
communication may be a more essential concern than either pre- or
post-involvement. There is a definite need for the opinions of
both managers and ISD personnel, since they are the major participants
in the development of systems. To get a clear picture of the com
munication pattern, both senders and receivers need to be studied.
74
The null hypothesis, alternate hypothesis and basis for measure
ment of the third research question are stated below. The null hypo
thesis is:
H3-A: There is no relationship between a manager's level of satisfaction with a management information system and the perceived effectiveness of his communication with ISD personnel.
The alternate hypothesis is:
H3-A': There is a positive relationship between the perceived effectiveness of communication between managers and ISD personnel and the manager's level of satisfaction.
This hypothesis is evaluated through the "Management Satisfaction"
index (I^) and the "Communication Success" index (I,). (See
Appendix G.)
Analysis of pilot study data produced some interesting findings,
The responses by managers indicated a slight relationship between
management satisfaction and successful communication, but ISD
personnel perceived satisfaction and communication success as being
very highly related. This could represent a possible split between
managers and ISD personnel with regard to the third hypothesis.
The agreement between the manager and ISD personnel on the
relationship between communication success and satisfaction could
suggest a number of important conclusions. For example, if the
manager feels a good relationship exists, and this is not the view

75
of the ISD personnel, the effort expended toward effective communi
cation by the ISD could well improve the manager's level of satis
faction. The null hypothesis for this agreement is:
H3-B: The manager's view of his communication success is not related to the view of ISD personnel.
The alternate hypothesis is:
H3-B': Managers and ISD personnel disagree about the effectiveness of their communication.
This hypothesis is evaluated on the basis of two sets of I,.
As indicated above, management respondents in the pilot study
indicated a slight relationship between the level of management
satisfaction and their perceived communication success. ISD personnel
produced a much stronger interaction between management satisfaction
and successful communication. This difference suggests the possibility
of disagreement between managers and ISD personnel in this area.
If there is a relationship between communication success and
satisfaction, knowing the factors which contribute to communication
success is desirable. The fourth research question investigates
those factors related to communication success between managers and
ISD personnel. No hypotheses are stated for this portion of the
study. Instead, models of perceived communication success were
developed. The models will be examined on an exploratory basis;
thus, the investigation is designed to identify those variables
which appear to contribute to communication success.

76
Statistical Analysis of Data
The statistical techniques which are generally employed and
considered acceptable in research activities can be grouped accord
ing to the dichotomy of parametric or non-parametric statistical
methods. Non-parametric techniques were selected for use in the
study because of the difficulty in meeting all the underlying assump
tions of parametric methods. (The reader who is unfamiliar with
these techniques is referred to Bradley, Haynes, Mills, Spence et al.,
or Cochran for a comparison of parametric and non-parametric
techniques.) (2; 10; 22; 32; 49)
As the reader will recall from the previous section, measure
ments used to evaluate hypotheses are in two forms. The first form
represents the use of measurements directly from the questionnaire
(for example, questions 1, 3, and 4). The questions yield categor
ized data, and this should be taken into account in the selection of
an appropriate technique for statistically evaluating the hypotheses.
The second form of measurement is represented as indexes. (See
Appendix G.) These indexes were created through the combination
of several questions from the measurement instrument (and appropriate
weighting as indicated by the factor analysis of the pilot study ques
tionnaires). The results of these "profiles" is translated into
rank-ordered data. Thus, the fact that "ranked" data will be used in
the evaluation of the hypotheses is another important consideration
in the selection of appropriate statistical tools.

77
On the basis of the above observations, three non-parametric
techniques were selected to analyze the data. The three techniques
are the chi square test, the Mann-Whitney "U" test, and Spearman's
coefficient of rank correlation. The chi-square test is employed
in the analysis of all hypotheses. The Mann-Whitney "U" test is
used in the analysis of the communication success models. Spearman's
correlation coefficients are computed in conjunction with each use
of chi square and the Mann-Whitney statistic.
For the chi square test, a 2 X 2 table was constructed to test
the significance of the relationship between two indexes. An example
of how the test was applied is given below in terms of the first
hypothesis (Hl-A). In this hypothesis, the purpose of the statistical
test is to determine whether or not a significant relationship exists
between the manager's level of pre-involvement and his level of satis
faction with a management information system. Thus, a 2 X 2 table
could be represented as:
Management
Pre-involvement
(from index I)
Involved
Unin-
volved
Management Satisfaction (from index I,)
Satisfied
Involved
and
Satisfied
Uninvolved
and
Satisfied
Dissatisfied
Involved
and
Dissatisfied
Uninvolved
and
Dissatisfied

78
On the basis of this design, each possible index would have to be
divided into "positive" and "negative" categories. This division
process was performed for each index used in the study. For each
index (in Appendix G), the maximum and minimum values were computed.
This range was divided by two to determine the mid-point. For all
indexes, the positive measure is from the maximum value to the mid
point; the negative values are from the mid-point to the minimum
value. (See Appendix H.)
The Mann-Whitney "U" test is used in the analysis of the communi
cation success models. The Mann-I Hiitney test is used to determine,
from ranked data, whether two samples come from the same parent
population. Ths U statistic computed in the Mann-Whitney procedure
is translated into a standard "z" score (since the statistic is
approximately normally distributed with a sample size over 20) for
determining the significance of the U statistic. The basic analysis
will be to compare the data of the "composite" company from the
pilot study with each of the three companies in the post study.
This approach determines the presence or absence of agreement between
the characteristics of the models and the characteristics of each of
the three companies in the post study.
As an illustration of how the data are analyzed by the Mann-
Whitney procedure, the pilot study "respondent level" data are com
pared with the "respondent level" data of the participants from
Company A. This arrangement of data is demonstrated below.

79
Composite Company Company A
(Pilot Study) (Post Study)
Respondent Respondent Level Rank Level Rank
The U statistic and the z score are also computed for Company B and
C. Furthermore, all factors presented in the communication success
models are tested using the same procedure.
After it was determined if each company in the post study came
from the same parent population as the pilot study (i.e., if there
is an agreement between the models and the actual companies), the
data in the post study were divided into "successful" and "unsuccess
ful" categories (as was done with the pilot study data). This
allows an analysis of the communication success "promoters" as
presented in the models. That is, is there an agreement between
pilot study and post study companies with regard to those communi
cation factors which tend to be associated with communication suc
cess? The procedure for the computation of the U statistic and the
z score was repeated for the successful communicators as described
above.
The final statistical technique applied in the study is the
calculation of the Spearman correlation coefficient. The coefficient
is computed for each h3rpothesis and for each application of the Mann-
Whitney test. The sole purpose for the computation of the correlation
coefficient is to determine the direction of association for the

80
variable (or index) under consideration. Thus, for the hypotheses,
the correlation coefficient was used to determine whether the alter
native hypothesis (as stated) is supported, or perhaps an alternative
hypothesis which was not stated.
The level of significance used for acceptance/rejection of
the null hypotheses is the .05 level. If the null hypothesis was
initially rejected, the level of significance at which it would be
accepted is stated. If, on the other hand, the null hypothesis
was initially accepted, the level of significance necessary to
reject the null hypothesis is stated. This is done to establish
an acceptance/rejection "region" for each of the hypotheses. The
same approach was also used for testing communication factors in
the models. Furthermore, it should be emphasized that the correla
tion coefficients were used only to determine the direction of
association between two variables and were not the basis for deter
mining the acceptance or rejection of hypotheses or communication
factors.
Summary
This chapter has provided an overview of the methodology used
in the study. The study is divided into two phases—the pilot study
and the post study. The discussion of the pilot study provided a
description of the study itself and the construction of the perceived
communication success models for managers and ISD personnel. The
description of the pilot study included references to creating the

81
questionnaire, characteristics of the sample, and pretesting the
questionnaire. The pilot study data were then used in the construc
tion of the communication success models. The discussion of the
models included the type of analysis used and the separate deriva
tions of management and ISD models.
The second phase of the study is the post study. The chapter
discusses the creation of the post-study questionnaire, character
istics of the sample, statement of hypotheses and the selection of
analysis techniques. The results of this analysis are presented
in Chapter IV.

CHAPTER IV
RESULTS OF THE STUDY
This chapter contains the analysis and interpretation of
data generated by the testing of hypotheses that examine relation
ships among management satisfaction, managerial pre-implementation
involvement (pre-involvement), post-operation involvement (post-
involvement) and communication success. Following some brief
comments about the post study sample, this chapter provides
the results of these tests for both the management and ISD groups
of each company, the tests of the variables comprising the per
ceived management communication success model, a similar analysis
of the ISD-perceived communication success model, and a comparison
of management and ISD data (e.g., each of the variables tested in
the first section—satisfaction, pre-involvement, post-involvement
and communication success—plus all variables found jointly in the
management- and ISD-perceived communication success models were
compared to uncover divergent views between managers and ISD
personnel).
The Post Study Sample
It should be reiterated that this is a case study. Three com
panies were selected for participation on the basis of certain pre
requisites outlined in Chapter II.
82

83
Each company received questionnaires for both management
and ISD personnel. Company A received 100 management questionnaires
and 25 ISD questionnaires. Of these, 65 (65 percent) of the manage
ment questionnaires were returned and 23 (92 percent) of the ISD
questionnaires were returned. Company B management returned 12 of
25 questionnaires (48 percent) and ISD personnel returned 13 of 25
questionnaires (52 percent). In Company C, 50 managers and 25 ISD
personnel received questionnaires. Management personnel returned
three questionnaires (6 percent), while ISD personnel returned 15
of 25 questionnaires (60 percent).
Because of the low return rate for Company C management, this
group was eliminated from the study. ISD data from Company C were
retained for testing hypotheses regarding satisfaction, pre-involve
ment, post-involvement and communication success and for testing
the variables of the ISD-perceived communication success model. With
the elimination of the management respondents of Company C, the
overall management response rate was 61.6 percent (78 of 125 ques
tionnaires returned). The overall ISD response rate was 68 percent
(51 of 75 questionnaires returned).
Analysis of Hypotheses
In Chapter III, hypotheses were stated in terms of the relation
ship between management satisfaction and pre-involvement, post-
involvement, and communication success. This section presents the
results of chi square tests used in the analysis of these hypotheses,
(See Appendix I.)
84
The first null hypothesis (Hl-A) was stated as:
There is no relationship between the manager's level of satisfaction with a management information system and the manager's level of pre-involvement in the development of the system.
The analysis of Company A management data suggests that satisfaction
and pre-implementation involvement are positively related, but this
relationship is not statistically significant ( «< = .135). In Com
pany B, even less of a relationship between satisfaction and pre-
involvement was demonstrated. Thus, for the management of these
two companies, the null hypothesis is supported. There was no statis
tically significant relationship between management satisfaction with
an MIS and pre-implementation involvement with the system.
The second hypothesis (H2-A) expressed a relationship between
management satisfaction and post-operation involvement. The null
hypothesis was:
There is no relationship between the manager's level of satisfaction with a management information system and his post-involvement with an existing system.
The analysis of management data from Company A does not reject the
null hypothesis. A similar, but less significant, pattern is
demonstrated by Company B. Thus, the null hypothesis is confirmed
by the management group of both companies.
These findings are contrary to the majority of evidence pre
sented in Chapter II. Powers, Gallagher, Carter and Swanson
85
supported the relationship between satisfaction and pre-involvement.
(94; 58; 92; 46; 83) In addition, while Adams argues that satisfac
tion and pre-involvement are not related, he does indicate the pre
sence of a satisfaction/post-involvement relationship. (36) Thus,
the findings presented above tend to be in agreement only with
Guthrie. (60: 93) Because the research of Guthrie was a case study
(all others represented aggregate analysis), it may be that the
significance of relationships between satisfaction, pre-involvement,
and post-involvement are composite relationships and are not neces
sarily significant for the individual organization.
The final hypothesis provides for an examination of the rela
tionship between management satisfaction and perceived communication
success. This null hypothesis states:
There is no relationship between a manager's level of satisfaction with a management information system and the perceived effectiveness of his communication with ISD personnel.
The analysis of management data of both Company A and Company B
indicates that the null hypothesis is supported. Thus, the pilot
study suggestion of a possible relationship between satisfaction
and communication success was not confirmed by either participating
post study company. Pettit's suggestion that the communication
environment in one organization might bear only slight resemblance
to that in another organization seems a reasonable statement
considering the data provided by Companies A and B. (75)

86
While not stated in terms of hypotheses in Chapter III, some
relationships were found among pre-involvement, post-involvement,
and communication success. In the first test, the relationship
between pre-involvement and post-involvement was examined. Company
B data revealed no relationship. However, the management respon
dents from Company A expressed an extremely intense relationship
(c< = .006). That is, the Company A managers who were highly
involved in the development of an MIS up to the point of implemen
tation were the same managers involved in the continued operation
and maintenance of the system. Managers who demonstrated less
pre-involvement indicated less post-involvement.
The second test examined the relationship between pre-involve
ment and communication success. The same pattern was present for
this test as was demonstrated for the previous examination. For
Company B, although the variables were highly correlated, the rela
tionship as indicated by the chi square test was not significant,
but for Company A a strong, significant relationship was found
(o< = .006). For the management personnel of Company A, those
managers who were more highly involved during the development of an
MIS also perceived their communication to be successful. Less invol
ved managers perceived their communication to be less successful.
The final test examined the relationship between post-involve
ment and communication success. As before, the management of Company
A indicated a significant relationship between the two variables
(^ = .030), while for Company B no relationship was indicated.

87
Thus, the managers of Company A indicated that the higher their level
of involvement with an MIS during operation and maintenance, the more
successful they perceived their communication with ISD personnel to
be. Low level post-involvement was associated with less successful
communicat ion.
In summary, the management personnel of the two participating
companies present different images. In Company A, with a separate
ISD staff function, management personnel appeared to have more
successful communication with respect to both involvement factors.
In Company B, the ISD personnel were members of line-oriented depart
ments, but the "closeness" to the situation of ISD personnel did not
appear to improve the communication between managers and ISD personnel
(as viewed by the managers). Finally, the management satisfaction
variable was not statistically related to either dimension of involve
ment or communication success. Thus, it appears that the interrela
tionships between management satisfaction, pre-involvement, post-
involvement, and communication success are highly situation-dependent.
The previously stated hypotheses were also examined for ISD
personnel. For ISD personnel, data from all three participating
companies were used. In testing the null hypothesis regarding the
relationship between management satisfaction and pre-involvement, all
three companies responded with a similar pattern. The data from
Company A, Company B, and Company C support the null hypothesis.
Thus, ISD personnel perceived no statistically significant relation
ship between the manager's satisfaction with an MIS and the involvement
of management during the development of such a system.
88
The second hypothesis examined the relationship between manage
ment satisfaction and post-involvement. Following the same pattern
as demonstrated for the first test, the second null hypothesis was
supported. ISD personnel of all three companies felt that there
was no relationship between the manager's level of satisfaction with
an MIS and the level of involvement of management personnel during
the operation and maintenance phase of the project.
The third hypothesis stated a relationship between management
satisfacion and communication success. All companies were in agree
ment that there was no significant relationship between the manager's
satisfaction with an MIS and ISD personnel's perceived communication
success during the development and operation of the system.
The interrelationships between pre-involvement, post-involvement,
and communication success which were analyzed for management respon
dents were also examined for ISD personnel. In testing the relation
ship between pre-involvement and post-involvement, ISD personnel of
all three companies indicated that there was no relationship between
the manager's level of involvement during the development of a system
and the manager's involvement after the system was implemented.
The second interrelationship examined tested the interaction
between pre-involvement and communication success. This relationship
was not statistically significant for any of the three firms. No
relationship between the manager's involvement during the development
of an MIS and the perceived communication success of ISD personnel
was found.

89
The final test examined the interrelationship between post-
involvement and communication success. None of the ISD personnel
of the three firms indicated a significant relationship between
the manager's level of involvement with an MIS during the post-
implementation phase and the perceived communication success
during system development.
In summary, ISD personnel of all three firms indicated the
lack of any significant relationship among management satisfaction,
pre-involvement, post-involvement, and communication success.
Analysis of the Management Communication Success Model
In this section, the perceived communication success model is
examined on the basis of post study data from the participating
companies. Recall that management data from only Company A and
Company B were available. Thus, only two cases are presented in
the analysis of the management communication success model. In
Chapter III, the pilot study data were divided into two groups. The
first group was referred to as the less successful communicator
group and the second group was labeled the successful communicator
group. The less successful communicator group was composed of all
respondents, while the successful communicator group was represented
by only those respondents indicating the top two response categories
to the communication success question. The same pattern was also
used in the analysis of the model with respect to the participating

90
post study companies. Also recall that the Mann-Whitney U test is
used for tests of significance. (See Appendix J.)
The sender component of the management model was composed of
variables representing the level (position), status, length of
employment, time in position, and education level of the manager.
The model also included variables representing the type and initia
tion of contact, media preference, exceeding authority limits, and
understanding of the ISD's position.
The level of the manager was presented as a detractor in com
munication success. That is, if the manager held a low level
position within the company, he felt his communication was less
successful. This was confirmed to exist in both Company A (-i = .018)
and Company B (•-< = .020). The findings indicate that the higher
one's position in an organization, the more accurate his communica
tion. (17) The complement of this is supported by the post study.
It was found that a low level position was related to poor perceived
communication success.
The second variable of the sender component was the organiza
tional status of the sender. This variable had a negative impact
on communication success in the model. This relationship was con
firmed to exist for Company A (< = .001), but was not significant
for Company B. Thus, Company A indicated that low organizational
status detracts from communication success. In addition, a rela
tionship between high status and communication success was found
to exist for Company A (>=< = .020); however, the direction of

91
this association was unclear due to a low correlation coefficient.
Thus, if the manager views his position as having low status
significance, his perceived communication success rate is likely
to be poor.
The length of emplo3mient was presented in the model as a
variable which promotes communication success. This was not con
firmed by the successful group of either company, but the reverse
relationship was supported for the less successful group of Company
A (" = .004). The respondents of Company A indicated that a short
employment period was detrimental to communication success.
Direct involvement in the communication by the manager (as
opposed to having others perform the communication) was not supported
by the successful group of either company. However, the less suc
cessful group of Company B indicated a relationship between direct
contact and communication success («K = .010), but again the corre
lation coefficient was low. The model also indicated that sender-
initiated communication was more successful. The successful
groups of both companies indicated no relationship; however, the
less successful group of Company B indicated that communication
initiated by ISD personnel was associated with less successful
communication (- = .020). This result is similar to the success
rate of user-initiated projects presented by Alter. (39)
The next two sender variables dealt with a preference for
types of communication media. Managers indicated no significant
preference for the written or oral media, despite the earlier

92
findings of Baker, Burns, Conrath, Davis, Level, and Woodward.
(8; 75; 50; 52; 65; 34)
The final variable in the sender component indicated that a
lack of understanding of the ISD by managers was related to less
successful communication. The less successful groups of both
companies failed to support this relationship. However, the test
was significant for the successful group of Company B (' = .050),
indicating for this firm that greater understanding of the ISD
promoted more successful communication.
In summary, different results were obtained from the two
companies. For Company A, communication was less successful when
the manager held a low level position, had low status, or was
employed for only a short time. For Company B, communication was
less successful where the manager held a low position, was not
directly involved in the communication, or did not initiate the
contact. Thus, with the exception of the role played by status,
no variable in the sender component of the model was sustained by
the post study analysis.
The second component of the communication success model was the
message component. The messages were classified in this subsystem
according to basic content; i.e., feasibility, implementation, and
modification and maintenance. The model suggested that when fewer
messages of these types were transmitted, more successful communi
cation resulted. For the more successful group of managers from
Company A, the number of messages at all levels regarding feasibility

93
were found to be significantly related to communication success
(highest «t value = .020). However, the correlation coefficients
for all three feasibility categories were negative. The relation
ship for the less successful group was even more pronounced (highest
•X value = .0004) and negatively correlated. This means that for
Company A, managers associate higher levels of feasibility message
transmission with more successful communication. For Company B,
none of the levels of feasibility message transmission were found
to be significant.
The second type of message dealt with system implementation.
The only significant U statistic produced was for the minimum level
of implementation messages for Company A (^ = .050). Again, a
negative correlation coefficient suggests that more implementation
messages were related to communication success. For Company B,
none of the U statistics produced a significant result.
The last category dealt with modification and maintenance
messages. Company A demonstrated the strongest set of relation
ships. At the average and maximum levels of message transmission.
Company A indicated a relationship between the number of messages
and communication success (in both cases^^ = .050); and the corre
lation coefficients were negative. Thus, the more messages trans
mitted the greater the communication success. For Company B, no
relationship was suggested.
Although not included in the model, one of the most interesting
relationships between numbers of messages and communication success

94
came from an examination of analysis and design-oriented messages.
For the less successful groups of both companies, U statistics were
found to be significant. For Company A, significance was found at
the minimum and average levels. For Company B, the statistic was
significant at all three levels. However, it is important to note
that the correlation coefficients for Company A were negative, while
positive for Company B.
Overall, Company A indicated the strongest set of relation
ships between the number of messages transmitted and perceived
communication success. The type of message (i.e. feasibility,
implementation, or maintenance and modification) did not appear to
have any particular impact on significance for the two companies.
However, the individuality of companies was again demonstrated
when Company B showed no significance between communication success
^nd any type of message transmission.
The next model component was the channel. The first variable
suggested that the use of written media to transmit messages detrac
ted from communication success. The relationship was found to be
significant for Company B's successful group (*= = .050), which
indicated that more successful communication was negatively related
to the use of written communication. Thus, the findings of Baker
and Woodward seem to be confirmed for Company B. (8; 34) The channel
component also indicated that the use of less formal written com
munication was related to communication success. This variable was
significant for the less successful group of Company A ( = .05).

95
For Company A, more formal standard forms and reports detracted
from communication success. Thus, formalized documents were found
to be related to poor communication in Company A, and the use of
written media was negatively related to successful communication
in Company B.
The fourth component of the communication success model was
the filter. The model suggested that both successful and less suc
cessful groups felt the need for clarification of written messages.
The successful group in the model felt that the need for written
clarification was inversely related to communication success. The
model was supported on this point by only Company B ('A = .05).
However, the less successful group of Company A (- = .027), and
Company B ("^ = .010) suggested that the greater the need for clari
fication of written messages, the less successful the communication.
Frustration was presented in the filter component as having
an impact on communication success. The less successful group repre
sented by the model indicated that frustration was associated with
less successful communication. This was supported by Company B
(« = .01), but failed to be supported by Company A.
The filter component also included an indication of relative
status between managers and ISD personnel. The relationship indicated
in the model was that if managers perceived ISD personnel as having
greater status, communication suffered. The less successful group
of Company A (' = .001) and Company B (- = .010) supported this
relationship. This seems to confirm Guetzkow's findings that the

96
larger the status differential, the more distorted the content of
messages. (8) This seems to be especially true when managers per
ceive ISD personnel as having greater status.
The final variable of the filter component was the cost of con
tact with ISD personnel. The less successful group of the model
indicated that high cost was related to less successful communica
tion. This relationship was supported by only Company B («-<' = .02).
For Company A, the need for clarification of written messages
and the relative status of the parties had an impact on communica
tion success. For Company B, frustration and the cost of contact
were added to the list. Thus, both "psychological" and "real"
costs seem to play a part in promoting poor communication. Fur
thermore, there was more agreement between the two companies on the
variables of the filter component than any other component. Despite
this agreement, there remained a lack of agreement between the
two companies on the frustration and cost variables.
The fifth component of the communication success model was the
receiver. Although relationships were presented for both groups
in the model, none of the groups from either post-study company sug
gested the presence of a relationship on any variable.
The final component of the communication success model was
feedback. Feedback was stated in terms of two variables—the
manager's getting the information he wanted and ISD's ability to
provide the information requested by management. Both were pre
sented in the model as having a negative impact on communication.
97
In the post study. Company B (- = .050) supported the model in
that the more often the manager failed to receive wanted informa
tion, the less successful his communication. The relationship
between communication success and the inability of the ISD to
provide wanted information was also supported by the successful
group of Company B (-< = .020). This group indicated an extremely
strong relationship between communication success and the perfor
mance of the ISD in providing requested information. Neither var
iable was supported by Company A.
A summary of the results obtained in the analysis of the
preceived communication success model for management is presented
in Table 3. For Company A, low level positions, low status, short
periods of employment (sender component), few feasibility-oriented
messages (message component), the need for written clarification
and ISD's having greater relative status (filter component) were
associated with a lack of communication success. Greater numbers
of messages dealing with feasibility, implementation, modification
(message component), and the use of letters or notes (channel com
ponent) were found to be associated with communication success for
Company A. For Company B, low level positions, lack of direct
involvement, not initiating contact (sender component), need for
written clarification, frustration, ISD's having greater status,
cost (filter component) and not receiving wanted information (feed
back component) were associated with a lack of communication success.
Only an understanding of the ISD's function (sender component), use

98
TABLE 3: SUMMARY OF SIGNIFICANT VARIABLES IN THE MANAGEMENT PERCEIVED COMMUNICATION
SUCCESS MODEL
Company A
Sender
Company B
*Level -Status -Length of Employment
*Level -Lack of direct involvement -
Did not initiate contact -
Understands ISD +
Message
All feasibility (-1- -) Minimxim implementation -f-Average and Maximum Modification and maintenance +
(None)
Channel
Use of less formal forms 4- Use of written media +
Filter
^Written clarification -*Relative status -
*Written clarification -
Frustration -^Relative status Cost -
(None)
Receiver
Feedback
(None)
(None) Did not receive information -
ISD could provide -I-
* Variables found to be significant for both participating companies,

99
of the written media (channel component), and the ISD's providing
of wanted information (feedback component) were associated with
communication success for Company B.
Of the variables studied, only three were found to be sup
ported by both companies. In the sender component, both Companies
A and B indicated that low level positions were associated with a
lack of communication success. In the filter component, the need
for written clarification and ISD's having greater perceived status
than managers were associated with poor communication. With only
three of 51 variables supported by the participating companies,
the model of perceived communication success for the manager was
not confirmed by this study.
Analysis of the ISD Communication Success Model
This section is dedicated to the analysis of the ISD per
ceived communication success model. Analysis of data from all three
participating companies is presented. (See Appendix K.)
ISD personnel surveyed in the pilot study indicated that high
status was associated with communication success for the successful
group. The relationship was significant for the less successful
group of Company A («K = .001). On the basis of the correlation
coefficient, the interpretation is that greater organizational
status is related to less successful communication. I'Jhen comparing
this result to the management model, recall that poor communication
was attributed to high relative status of ISD personnel (filter

100
component). The model also indicated that the successful group
felt a relationship existed between the length of time a person
held his position and communication success. Only Company A
(-<: = .050) supported the relationship; i.e. longer time spans in
a position were related to better communication.
The next variable of the sender component, the length of time
in a position, demonstrated a weak relationship to communication
success. This relationship was supported by the successful group
of Company A (c = .050). For Company A, the longer ISD personnel
held a position the greater was their communication success.
The education level variable of the model indicated the
tendency to detract from communication success. Only Company C
(o*' = .050) indicated a significant relationship between the two
variables. For this company, a low education level was related to
less successful communication. That is, the less ISD personnel
know about management, the less successful their communication.
In the sender component, there was no agreement among the
three companies regarding those variables which contribute to or
detract from communication success. No variables were found to be
statistically significant for Company B. Three variables were sig
nificant for Company A—status, length of employment and length
of time in a position. Only education level was found to be signifi
cant for Company C. Thus, the individuality of companies is dem
onstrated in this analysis of sender component variables for ISD
personnel.

101
The channel component of the ISD model included variables
related to the type of media used and the width of the channel. The
first variable indicated that both successful and less successful
groups in the pilot study felt a relationship existed between the
use of oral media and communication success. Both the successful
group (-< = .020) and the less successful group {-^ = .020) of
Company B supported this relationship. That is, the use of oral
media was associated with communication success for the successful
group. Written media tended to be related to a lack of communica
tion success by the less successful group. Further, recall that
the management group of Company B indicated that the use of the
written media was associated with communication success.
The next variable in the channel component was based on the
type of written media used. In the model, the use of letters and
no>tes (less formalized written communication) was related to success
ful coimnunication, while the use of standardized forms was associated
with less successful communication. The successful group (Companies
A and B) indicated the presence of such a relationship. For Company
A (°< = .050), the indication was an association between the use
of letters and notes and communication success ( the same associa
tion found for Company A's management). However, for Company B
(c = .050), the use of standard reports was related to successful
communication.
In summary, none of the channel variables was found to be
related to communication success for Company C. For Company A,

102
only the use of non-standard reports (letters or notes) was found
to be significant. Company B indicated that more successful communi
cation was related to the use of standard forms. However, they
further suggested that oral communication was more successful than
written communication. The filter component of the ISD model
contained variables related to the clarity of messages and to
"screening" messages through frustration, time usage, cost, and
other communication participants. None of these variables was
found to be statistically related to communication success.
The first variable of the receiver component suggested that if
ISD personnel perceived the manager as having a low level position,
communication was negatively affected. This relationship was
supported by Company A («: = .019), The status variable in the
model suggested that high status of the receiver had a positive
influence on communication success. Low status was only slightly
associated with a lack of communication success. Only the less
successful group (Company A) supported this relationship (=•< = ,009).
For the receiver component, no variables were found to be
significantly related to communication success for Companies B and
C. In Company A, when ISD personnel perceived managers as having
either a low level position or low status, communication was
adversely affected.
The final component of the ISD model was feedback. The variables
presented in the feedback component of the model were not found to be
statistically related to communication success in the post study.

103
To recapitulate the findings with regard to the perceived
communication success model for ISD personnel, no single variable
was supported by more than a single firm in any model component.
A summary of the results is presented in Table 4. In Company A,
the length of employment, the length of time in a position (sender
component), and the use of non-standard forms and reports were
associated with communication success. High status of ISD per
sonnel (sender component), low level position and status of the
manager (receiver component) were related to less successful commu
nication. Company B indicated that use of oral media and standard
forms of written media were related to communication success, while
use of written media per se was associated with less success (channel
component). Only one variable was found to be significant for Company
C—education level. ISD personnel indicated that a lack of knowledge
about management (sender component) was associated with less
successful communication.
On the basis of the foregoing discussion, it is not possible to
confirm the communication success model for ISD personnel. Further
more, without a single variable which was agreed upon by all partici
pating companies, the likelihood of constructing a revised model
seems remote.
Comparison of Management and ISD Responses
The final portion of the analysis presented in this chapter
deals with a comparison of the responses given by management and

104
TABLE 4: SUMllARY OF SIGNIFICANT VARIABLES IN THE ISD PERCEIVED COMMUNICATION SUCCESS MODEL
COMPANY A
High status -Long time employed + Long time in position -f
(None)
COMPANY B
Sender
(None)
Message
(None)
COMPANY C
Education -
(None)
Letters or notes -f-
Channel
Oral + Written -
Standard forms +
(None)
(None)
Low level -Low status -
(None)
Filter
(None)
Receiver
(None)
Feedback
(None)
(None)
(None)
(None)

105
ISD personnel. This analysis was made to determine (for the respond
ing companies) those areas which represent a "common ground" between
management and ISD personnel. In addition, this analysis is useful
in isolating those areas where management and ISD personnel hold
divergent points of view.
The analysis is presented in two parts. First, the hypotheses
in Chapter III were stated in terms of "part A" and "part B." The
presentation of hypotheses earlier in this chapter dealt only with
"part A." One portion of this section is dedicated to an analysis
of "part B"—those hypotheses which were stated in terms of a
relationship between the beliefs of management and those of ISD
personnel. The second part presents a comparison of those variables
which are presented jointly in the perceived communication success
model for management and the perceived communication success model
for ISD personnel. The analysis required a group of respondents
from both management and the ISD. Only Company A and Company B are
presented in this analysis. (The management group from Company C
was eliminated as previously noted.) The chi square test was used
to analyze the hypotheses, while the Mann-Whitney U test was used
for the comparison of variables in the models. (See Appendix L.)
The first hypothesis utilizing both management and ISD data
indicated a lack of agreement about management satisfaction. While
no relationship was found for Company A, the combined responses of
Company B indicated a disagreement about management satisfaction
(o< = .028). On the basis of the correlation coefficient for

106
Company B (r = -.519), ISD personnel perceived management as being
more satisfied than the managers themselves indicated. These
perceptual differences between management and ISD on the satisfac
tion variable could be highly detrimental to the future success of
their interaction. The pre-involvement variable did not indicate
a statistically significant relationship for either company.
The post-involvement variable was significant for both
Company A (-< = ,002) and Company B (o< = .018). Thus, the managers
and ISD personnel of both companies disagree about management's
level of involvement during the maintenance and modification phase.
However, the correlation coefficients failed to identify which
party felt management was more highly involved in this phase.
The final variable was communication success. The variable
was significant for both Company A (=^ = ,009) and Company B
(M = .036). The management and ISD personnel of both companies
disagreed about the success of their communication. On the basis
of correlation coefficients, ISD personnel of Company A perceived
their communication to be more successful than did management
(r = -.568), However, the reverse relationship was indicated for
Company B (r = .520)
For Company A, managers and ISD personnel disagreed about two
of the four variables—post-involvement and communication success.
Company B personnel disagreed about three of the four variables—
management satisfaction, post-involvement, and communication success
The discussion which follows considers the agreement of management

107
and ISD personnel on the variables included in both perceived
communication success models.
The sender component of the models contained references to
status, length of employment, length of time in a position, educa
tion level, initiation of contact, preference for type of (oral/
written) contact and understanding other's position variables. In
addition, the "level or position" question was included on the ISD
questionnaire for comparison purposes.
In comparing the organizational status variable, neither
Company A nor Company B indicated an agreement between managers and
ISD personnel. There was also a lack of agreement on the length of
employment variable. The third common variable was the length of time
an individual held his position. Company A (^ = .010) indicated the
response patterns were the same. Thus, for Company A both managers
and ISD personnel tended to hold a position about the same length of
time. The education variable presented no pattern for either company.
The lack of a pattern resulting from examination of the educa
tion variable was repeated for the initiation-of-contact variable.
The next variable shared by both models was the preference for
oral rather than written communication. The managers of Company A
responded the same as ISD personnel (•^<.001).
The final variable shared by the sender component of both models
was understanding the other's department. The respondents from
Company A (°< = .016) demonstrated the same response pattern.
Although the position variable was not present in the sender

108
component of the ISD model, it was present on the ISD questionnaire.
Company A («=< <.001) produced the same type of responses for both
managers and ISD personnel.
The message component of both the management and ISD models
contained the number of feasibility, analysis and design, implemen
tation and modification and maintenance message variables. For
Company A (= = .003) the responses for the minimum number of feasi
bility messages were the same for management and ISD personnel.
Although not present in either model, the level of analysis and
design-oriented messages was included on both questionnaires. The
analysis indicated the same pattern of responses for the maximum
level of message transmission for Company A ( = . 002). The
number of implementation messages at the minimum and average levels
for Company A (•=< = .008 and .006, respectively) produced the
same response patterns for managers and ISD personnel. The last
type of messages present in both models was modification and main
tenance messages. Neither company produced a significant pattern
of message transmission at any level.
The channel component of both models shared two variables—
the type of media (oral or written) most often used and the use
of letters and notes when the written media was used. No pattern
was produced for either of these variables by either company.
The next component of the models was the filter. The variables
shared by the filter component of both models were the need for
clarification of written messages, the level of frustration.

109
contact with the data administrator and the cost of contact with
the other party. The same pattern was produced by Company A
{o< less than .001) on the need for written clarification variable.
The response by managers and ISD personnel of Company A on the
frustration variable {<^ < .001) indicated the same pattern.
The variable representing the data administrator contact was
the first to be supported by both companies. For Company A (-< = .105)
the pattern was stronger than for Company B (c = .050). While
the same pattern was suggested by the U statistic of both companies,
the correlation coefficients suggested that the ISD personnel had
greater contact with the data administrator in Company A, while
managers had the more active communication in Company B.
The fifth component of the communication success models was
the receiver. The shared variables of this component included the
level and status of the receiver, receiver approachability and
accessibility, the receiver's overstepping his authority, the
receiver's understanding of the sender's position, and the avail
ability of the receiver. Analysis of the position of the receiver
variable resulted in the same pattern of responses for Company A
(c = .038). The management respondents seemed to have rated the
position of the ISD personnel higher for Company A than did the ISD
for management. The next significant variable was the approachability
of the contact. For Company A (c^ = .023), the indication was that
the response pattern for managers and ISD personnel were the same.

110
The final significant variable was the demands on the time
availability of the contact. Both Company A (=^ = .002) and Company
B (°< = .050) indicated similar responses by management and ISD
personnel.
The final component of the models was feedback. Two variables—
getting wanted information and contact providing requested informa
tion—were present in the models. Both managers and ISD personnel
of Company A (cX = .008) presented a similar pattern with respect
to getting wanted information. The final variable presented in the
model was the ability of the contact to provide wanted information.
The response pattern for managers and ISD personnel for Company A
(<»< < .001) was the same.
The results presented in this section have been summarized in
Table 5. There are 26 variables represented in this illustration
on which comparisons were made. Of these variables, the combined
management and ISD personnel of Company A agreed on 14 of the vari
ables (53,8 percent agreement). Thus, on the basis of these two
companies, there was greater agreement between managers and ISD
personnel in Company A than in Company B.
Recall from the first section of this chapter that only the
managers of Company A indicated the presence of a relationship
among pre-involvement, post-involvement, and communication success.
It is unclear from this analysis whether or not the agreement
between managers and ISD personnel of Company A was associated with
this interrelationship. Furthermore, it is unknown whether or not

Ill
TABLE 5: A SUl MARY OF THE SIGNIFICANT VARIABLES IN MANAGEMENT AND ISD PERCEIVED COMMUNICATION SUCCESS MODELS
COMPANY A
Mgt higher status Mgt employed longer Same No pattern No pattern Same Same Same
Same Same No pattern ISD transmits more
MODEL COMPONENT
Sender status
length of employment time in position
education initiation of contact
oral/written preference understanding other's dept.
COMPANY B
Mgt higher status ISD employed longer
No No No No No
position/level
Message feasibility
implementation modification/maintenance
analysis/design
pattern pattern pattern pattern pattern
ISD held higher position
No pattern No pattern No pattern No pattern
No pattern No pattern
Channel oral/written media
use of letters or notes No pattern No pattern
Same
Same Same Mgr's felt contact more costly
Filter clarification of written Mgr's sought more
messages frustration Mgr's more frustrated
data administration contact Same cost No pattern
Same Mgr greater status Same ISD oversteps Same
Receiver position of receiver
status approachable
receiver oversteps authority receiver available
No pattern Mgr greater status
No pattern ISD oversteps
Same
Same Same
Feedback get wanted information contact provided wanted
information
No pattern No pattern

112
the level of agreement between the respondent groups of Company A
is sufficiently strong or in the appropriate areas to suggest a
common basis for communication between the groups in that company.
However, the presence of this relationship could be established
through further study.
Summary
The chapter has presented the results of the study. None of
the null hypotheses for the relationships between management satis
faction and pre-involvement, post-involvement, and communication
success were rejected by any group of the participating post-
study companies. However, management respondents of Company A
indicated a positive relationship between pre-involvement and post-
involvement, pre-involvement and communication success, and post-
involvement and communication success.
In the analysis of the management perceived communication
success model, variables related to level, status, length of
employment, messages related to feasibility, implementation, and
modification and maintenance, use of less formalized forms of
communication , the need for written clarification and relative
status of communicators were found significantly related to effec
tive communication for Company A. For Company B, the respondents'
level, lack of direct involvement, not initiating contact, under
standing the ISD, use of written media, need for written clarifi
cation relative status, the cost of contact, not receiving wanted

113
information and the ISD's inability to provide information were
related to effective communication.
The analysis of the ISD perceived communication success models
indicated that status, length of employment, length of time in a
position, use of less formalized forms of communication and the
level and status of the receivers were significantly related to
effective communication for Company A. Company B ISD respondents
suggested that the use of oral and written media and the use of
standardized forms had an impact on successful communication. For
Company C only the education level of the ISD had an effect on
communication success.
As a consequence of these results, neither communication model
was confirmed. Between the two companies analyzed in conjunction
with the management model, only three variables were significant—
level of the sender, the need for written clarification and the
relative status between the communicators. In conjunction with the
ISD model, none of the variables were significant for all three
companies. (In fact, none of the variables were significant for
even two of the three companies.)
The final series of tests dealt with a comparison of the
responses of managers and ISD personnel. In Company A, managers
and ISD personnel disagreed about the manager's post-involvement
and communication success. For the communication success models.
Company A respondents were in agreement on 14 of 26 variables.
The personnel of Company B disagreed about management satisfaction.

114
post-involvement and communication success. In conjunction with
the models. Company B respondents agreed on only 2 of 26 variables.
From these observations, it was concluded that management and ISD
personnel were more in agreement with one another in Company A
than in Company B.

CHAPTER V
CONCLUSIONS AND RECOMMENDATIONS
The analysis presented in Chapter IV offers a number of dif
ferences between the results of this study and previous research.
While Powers, Gallagher, Carter and Swanson have documented the
positive association between management satisfaction and management
involvement, this study has revealed no apparent association between
management satisfaction and involvement. In addition, the results
of this study differ from those presented in the communication
literature with respect to the impact of effective communication
on job performance.
In this writer's opinion, these differences are the result of
using different techniques and methodologies. While a similar
technique was used to measure management satisfaction, management
involvement and communication success were based on different para
meters. First, management involvement was divided into two parts—
pre-implementation involvement and post-implementation involvement.
The only other study making such a distinction was an investigation
by Adams that indicated that while both variables were related to
management satisfaction, post-involvement was more closely associated
with satisfaction. (36) Prior research employed a count of the
number of contacts as the basic measure of involvement while this
study used a measurement of involvement activities (e.g., approving
115

116
and changing the products of an MIS). Prior communication research
measured effective communication by analyzing the flow of specific
documents or the chain of events which occurred in the oral trans
mission of a message. In effect, communication effectiveness was
based on a third party assessment of effectiveness; effectiveness
was measured on the basis of "did the message get through" or "did
the message receive the proper response." In this study, however,
the perceptions of the sender were used as the basic measurement
of effective communication. Therefore, the basic unit of measure
ment for both involvement and communication success was different
from those utilized in prior research.
Second, the studies of the relationship between management
satisfaction and involvement previously mentioned were based on an
analysis of aggregate data. The only study not included in the
above list (a case by Guthrie) agreed with this study in the lack
of verification of the relationship between management involvement
and satisfaction. (60; 93) It has been theorized that more effec
tive communication leads to more effective job performance. (11; 52;
56; 82) Studies in support of this proposition were all based on
aggregate analysis. The results of this study produced no signifi
cant relationship between perceived communication success and manage
ment satisfaction—the variable used as a surrogate of effective
MIS implementation.
Two existing conditions might explain the differences between
this case study and previous aggregate studies. First, the smoothing
117
effect of aggregation may have resulted in a sufficient reduction
in detail as to render the findings of aggregate analysis non-
applicable to a specific case. That is, the situation-dependent
factors present in each organization may have such variability that
the "hypothetical composite organization" resulting from aggregate
analysis fails to project the conditions in any individual organiza
tion. Second, differences between aggregate and case results may
be due to population differences. The environments previously men
tioned may no longer exist. Perhaps there has been a sufficient
level of change in organizations with the passage of time that new
forms of organizational behavior are now present. Or, perhaps, the
three firms examined in this study are not representative of the
population of firms. These two conditions then, might equally
contribute to differences in results based on difference in
methodology.
Conclusions
Three major areas have been investigated in this study—the
relationship between management involvement and management satisfac
tion, the impact of organizational communication on management sat
isfaction, and the development of perceived communication success
models. Management involvement was segmented into pre-involvement
and post-involvement. However, neither definition of involvement
was significantly related to management satisfaction. Thus, for
both management and ISD groups of all participating companies, the

118 level of management involvement prior to MIS implementation or
management involvement after MIS implementation has no impact
on the level of management satisfaction.
Powers and Lucas suggested that management satisfaction is
a transitory phenomenon. (94; 18; 67; 69) Management's level of
satisfaction changes over time. The reason for this variability
stems from an increase in the knowledge level of managers and their
maturity with computers in general. Managers are demanding better
infoirmation from an MIS than they received in the past; and they
expect the lead time between the inception of a new project to its
completion to be shortened. The manager's level of expectation
vis a vis ISD production is greater now than ever before.
Management involvement is not, as previously presumed, an ever-
increasing linear function. It has been argued that a higher level
of involvement will result in a higher level of management satis
faction. However, at some level of involvement, an additional
unit of involvement must result in a lower level of satisfaction.
That is, there must be some level of involvement by management beyond
which the manager views increased contact with ISD personnel as
too costly relative to expected benefits.
The second area of investigation dealt with the relationship
between communication success and managemtent satisfaction. For both
the management and ISD groups of all participating companies, there
is no relationship between management satisfaction and perceived
communication success. Previous research established a relationship

119
between effective communication and improved job performance. Thus,
with communication success as an indicator of performance, the only
conclusion which may be drawn is that the sender's perception of
communication success is not an accurate measure of actual results.
The final area investigated the possible existence of per
ceived communication success models. The variables used to create
models were separately identified in previous organizational com
munication studies and were selected, organized, tested, and refined
to develop the models for the post study. However, of the variables
in the management model, only two were found to be statistically
significant for both participating companies—the need for written
clarification and the negative impact of status differences between
senders and receivers. No variables were found to be statistically
significant in the ISD model. Thus, for the participating companies,
the indicative model of perceived communication success was not
verified.
Based on these findings, if a model of perceived communication
success does exist, it must be developed on a case-by-case (company-
by-company) basis. As evidence of the situation-dependent nature of
the variables in the model, the comparative results within the com
panies indicated a higher level of agreement between the respondents
of Company A than for Company B, Thus, each company possesses its
own set of dynamically interacting variables which dictates exami
nation of the properties of organizational communication on a
case basis.

120
Recommendations
This study has examined communication activities between manage
ment and ISD personnel in an MIS setting—a setting principally aimed
at communicating information to managers for the enhancement of the
decision-making process. In this study, a number of assumptions
have not been verified. Among these assumptions: (1) there is a
positive relationship between management satisfaction and management
involvement; (2) there is a positive relationship between management
satisfaction and communication success; and (3) there is a sufficient
similarity among organizations on organizational communication
dimensions in an MIS setting to permit the creation of communi
cation success models. The results of this study indicate a dynamic
set of variables which are highly influenced by time. This study
has identified a number of variables which are highly influenced
by the specific environment under study. Greater attention must
be paid to the characteristics of individual operating environments;
specifically future organizational communication studies with an
MIS setting should more closely examine the details of operation
(situational-dependent factors) which tend to vary from one organiza
tion to another. Areas which might be investigated could be based
on the type of application, department, management structure, inter
nal structure of the ISD and so forth. The impact of these variables
on management satisfaction, management involvement and communication
success should be investigated.

121
In addition to examining situational dependent factors, more
attention should be given to the technique of measurement. Since
the impact of management involvement on management satisfaction
seems to vary over time, involvement should be examined on a longi
tudinal, rather than a static, basis. Furthermore, the influence
of time on the effectiveness of organizational communication should
be studied on a similar basis.
The next recommendation calls for the reexamination of manage
ment satisfaction as the "MIS success" criterion. There seems to
be a number of factors which would cause management satisfaction to
shift over time. Factors such as increased familiarity with com
puters, attitude problems between management and ISD personnel,
management maturity with an application, and insight by management for
more or different information before an application has been com
pleted could cause a negative shift in satisfaction. Perhaps future
research should be aimed at the causes of dissatisfaction or perhaps
future research should strive to measure a more fundamental issue—
the factors which contribute to improved performance by management
as a result of using an MIS,
Of course, additional experimentation may not lead to generaliz-
able findings. Thus, it may be necessary to establish a test or
a battery of test designed for use by individual organizations or
organizational subunits. In the absence of "universal laws" of
organizational communication, a means should be provided whereby

122
organizations can conduct internal investigations to provide manage
ment with guidelines for the improvement of communication.
Further research has been indicated in both the MIS and the
organizational communication areas. As a result of this study, the
avenues of future research may be wider than previously believed.
Further research should proceed vigorously, but with caution. To
be of greatest value, future research must produce generalizable
findings. Short of this, research on the individual organization
level must be capable of supplying those variables which contribute
to the differences between the results from one organization to
another.

LIST OF REFERENCES
Books
1. Berlo, David K. The Process of Communication; Introduction
to Theory and Practice. New York: Holt, Rinehart and Winston, Inc., 1960.
2. Bradley, James V. Distribution-free Statistical Tests, Engle-wood Cliffs, New Jersey. Prentice-Hall, Inc., 1968.
3. Coch, Lester and French, R, P, Leadership Patterns and Organizational Communication, Ann Arbor, Michigan: Foundation for Research on Human Behavior, 1964,
4. Conference of Data Systems Languages Special Committee, Feature Analysis of Generalized Data Base Management Systems. New York: Association for Computing Machinery, 1971.
5. Davis, Gordon B. Management Information Systems: Conceptual Foundations, Structure and Development. New York: McGraw-Hill Book Company, 1974.
6. Dearden, John and McFarlan, F. Warren. Management Information Systems: Text and Cases. Homewood, Illinois; Richard D. Irwin, Inc., 1966.
7. Goldhaber, Gerald M. Organizational Communication. Dubuque, Iowa: William C. Brown Publishers, 1974.
8. Guetzkow, Harold. "Communication in Organizations" in Handbook of Organizations, (ed. James G. March) Chicago, Illinois: Rand McNally and Company, 1965.
9. Haney, William V. Communication and Organizational Behavior. Homewood, Illinois: Richard D. Irwin, Inc., 1973.
10. Hays, William L, Statistics for Psychologists. New York: Holt, Rinehart and Winston, Inc., 1963.
11. Joslin, Edward 0, Computer Reading Series: Management and Computer Systems. Arlington, Virginia: College Readings, Inc., 1970,
12. Kirk, Roger E. Experimental Design: Procedures for the Behavioral Sciences. Belmont, California: Brooks-Cole Publishing Company, 1968,
123

124
13. Kurtz, Kenneth H. Foundations of Psychological Research. Boston: Allyn and Bacon, Inc., 1969.
14. Lawrence, Paul R. and Lorsch, Jay W. Organization and Environment: Managing Differentiation and Integration. Homewood, Illinois: Richard D. Irwin, Inc., 1969.
15. Leavitt, Harold J. Managerial Psychology. (2nd Ed.) Chicago: University of Chicago Press, 1964,
16. Lewis, Phillip V, Organizational Communication; The Essence of Effective Management. Columbus, Ohio: Grid, Inc., 1975.
17. Lillico, T. M. Managerial Communication. New York: Pergamon Press, 1972.
18. Lucas, Henry C. Toward Creative Systems Design, New York: Columbia University Press, 1974.
19. Lucas, Henry C. Why Information Systems Fail. New York: Colvmibia University Press, 1975.
20. Luthans, Fred. Organizational Behavior: A Modern Behavioral Approach to Management. New York: McGraw-Hill Book Company, 1973.
21. Mason, Robert D. Statistical Techniques in Business and Economics. Homewood, Illinois: Richard D, Irwin, Inc, 1967.
22. Mills, Frederick C. Statistical Methods. New York; Henry Holt and Company, 1955.
23. Merrihue, Willard V. Managing By Communicating, New York: McGraw-Hill Book Company, Inc, 1960.
24. Nie, Normal H. et al. Statistical Package for the Social Sciences. (2nd Ed.) New York: McGraw-Hill Book Company, Inc., 1970.
25. Nunnally, Jum C. Psychometric Theory. New York: McGraw-Hill Book Company, Inc., 1969.
26. Redding, W. Charles. Communication Within the Organization. New York: Industrial Communication Council, Inc., 1972,

125
27. Rigby, Paul H. Conceptual Foundations of Business Research. New York: John Wiley and Sons, Inc., 1965.
28. Rummell, R. J. Applied Factor Analysis. Evanston, Illinois: Northwestern University Press, 1970.
29. Sanders, Donald H. Computers and Management, New York: McGraw-Hill Book Company, Inc, 1970,
30. Selltiz, Clare, et al. Research Methods in Social Relations. New York: Holt, Rinehart and Winston, Inc., 1962.
31. Sollenberger, Harold M. Management Control of Information on System Development. New York: National Association of Accountants, 1971.
32. Spence, Janet T. et al. Elementary Statistics. (2nd Ed.) New York: Appleton-Century-Crofts, 1968.
33. Stewart, Rosemary. How Computers Affect Management. Cambridge, Massachusetts: The M.I.T. Press, 1971.
34. Woodward, Joan. Industrial Organization: Theory and Practice. New York; Oxford University Press, 1965.
Periodicals
35. Ackoff, Russel. "Management Misinformation Systems." Management Sciences, (December, 1967), B147-B156.
36. Adams, Carl R. "How Management Users View Information Systems." Decision Sciences, (April, 1975), 337-345.
37. Ainsworth, William. "The Priniacy of the User," Infosystems, (April, 1977), 46-48.
38. Ainsworth, William. "The Primacy of the User." Infosystems, (I-Iay, 1977), 50-54.
39. Alter, Steven L. "How Effective Managers Use Information Systems." Harvard Business Review, (November-December, 1976), 97-104.
40. Axelson, Charles F, "How to Avoid the Pitfalls of Information Systems Development," Financial Executive, (April, 1976), 25-31.
126
41. Bariff, M. L. and Lusk, E. J. "Cognitive and Personality Tests for the Design of Management Information Systems." Management Sciences, (April, 1977), 800-829.
42. Berger, Charles R. and Calabrese, Richard J. "Some Explorations in Initial Interaction and Beyond; Toward a Developmental Theory of Interpersonal Communication." Human Communication Research, (Winter, 1975), 98-112.
43. Brown, Warren G. "Systems, Boundaries, and Information Flow." Academy of Management Journal, (December, 1966), 318-328.
44. Browne, Philip Jr. and Golembiewski, Robert T. "The Line-Staff Concept Revisited; An Empirical Study of Organizational Images." Academy of Management Journal, (September, 1974), 406-417.
45. Canning, Richard G. "Management of Systems Analysis." EDP Analyzer, (July, 1968), 4-10.
46. Carter, Deane M. "Determining Systems Success." Journal of Systems Management, (July, 1976), 24-27.
47. Chervany, Norman L. and Dickson, Gary W. "An Experimental Evaluation of Information Overload on a Production Environment." Management Sciences, (June, 1974), 1335-1344.
48. Cochran, W. G. "Perspectives on Chi Square." Journal of Applied Mathematics, (October, 1948), 218-238,
49. Coleman, Raymond J. and Riley, M. J. "Organizational Impact of MIS." Journal of Systems Management, (March, 1972), 13-19.
50. Conrath, David W. "Communications Environment and Its Relationship to Organizational Structure." Management Sciences, (December, 1973), 586-603.
51. Dalton, Melville. "Conflict Between Staff and Line Managerial Officers." American Sociological Review, (June, 1950), 342-351.
52. Davis, Keith. "Success of Chain-of-Command Oral Communication in a Manufacturing Management Group." Academy of Management Journal, (December, 1971), 305-315.

127
53. DeWhirst, H. Dudley. "Influence of Perceived Information-Sharing Norms on Communication Channel Utilization." Academy of Management Journal, (September, 1971), 305-315.
54. Dickson, Gary W. "Management Information Decision Systems." Business Horizons, (December, 1968), 17-26.
55. Dickson, Gary W., Senn, James A., and Chervany, Norman L. "Research in Management Information Systems; The Minnesota Experiments." Management Sciences, (May, 1977), 913-923.
56. Dickson, G. W. and Simmons, Josh K. "The Behavorial Side of MIS." Business Horizons, (December, 1968), 1-13.
57. Downs, Cal W. and Hazen, Michael D. "Factor Analytic Study of Communication Satisfaction." The Journal of Business Communication, (Spring, 1977), 63-73.
58. Gallagher, Charles A. "Perceptions of the Value of a Management Information System." Academy of Management Journal, (March, 1974), 46-55.
59. Gobson, Harry L. "Determining User Involvement." Journal of System Management, (August, 1977), 20-22.
60. Guthrie, Art. "Attitudes of User-managers towards Management Information Systems." Management Informatics, (October, 1974), 221-232.
61. Haney, William V. "A Comparative Study of Unilateral and Bilateral Communication." Academy of Management Journal, (June, 1974), 128-136.
62. Hascal, Albert. "Handling Memos Efficiently." The Journal of Accountancy, (January, 1971), 82-83.
63. Hershman, Arlene. "A Mess in MIS?" Dun's Review, (January, 1968), 27-27ff.
64. Hunsicker, Frank R. "How to Approach Communication Difficulties." Personnel Journal, (September, 1972), 680-683.
65. Level, Dale A. "Communication Effectiveness: Method and Situation." Journal of Business Communication, (Spring, 1972), 19-25.
128
66. Lucas, Henry C. "An Empirical Study of a Framework for Information Systems." Decision Sciences, (January, 1974), 102-114. ""
67. Lucas, Henry C. "Measuring Employee Reaction to Computer Operations." Sloan Management Review, (Spring, 1974), 59-67.
68. Lucas, Henry C. "Performance and the Use of Information Systems." Management Sciences, (April, 1975), 908-919.
69. Lucas, Henry C. "System Quality, User Reaction and the Use of Information Systems." Management Informatics, (August, 1974), 207-212.
70. Lucas, Henry C. "Use of an Accounting Information System." Accounting Review, (October, 1975), 735-746.
71. Lucas, Henry C. "User Reactions and the Management of Information Services." Management Informatics, (August, 1973), 165-172.
72. Lucas, Henry C. and Plimpton, Rodney B. "Technological Consulting in a Grass Roots, Action Oriented Organization." Sloan Management Review, (Fall, 1972), 17-36.
73. Maier, Norman R. F., Hoffman, L. Richard, and Read, William H. "Superior-Subordinate Communication; The Relative Effectiveness of Managers \^o Held Their Subordinates' Position." Personnel Psychology, (January, 1963), 1-11.
74. Nolan, Richard L. "Computer Data Bases: The Future is Now." Harvard Business Review, (September-October, 1973), 98-114.
75. Pettit, John D. et al. "Guidelines and Suggestions for Research in Business Communication." Journal of Business Communication, (Fall, 1971), 37-60.
76. Powers, Richard F. and Dickson, Gary W. "MIS-Project Management: Myths, Opinions and Reality." California Management Review, (Spring, 1973), 147-156.
77. Ross, E. "Computers: Their Use and Misuses." Business Horizons, (April, 1970), 55-60.

129
78. Ross, Joel E. "Why Computers Fail." Business, (July, 1972), 71-74.
79. Schewe, Charles D. "The Management Information System User; An Exploratory Behavioral Analysis." Academy of Management Journal, (December, 1976), 577-590.
80. Schewe, Charles D. and Wiek, James L. "Guide to MIS User Satisfaction." Journal of Systems Management, (June, 1977), 6-10.
81. Smith, Peter C. "Resolving User/Systems Differences." Journal of Systems Management, (July, 1977), 16-21.
82. Soden, Dr. V. and Tucker, Charles C. "Long-range MIS Planning." Journal of Systems Management, (July, 1976), 28-33.
83. Swanson, E. Burton. "Management Information Systems: Appreciation and Involvement." Management Science, (October, 1974), 178-188.
84. Thurston, Philip H. "Who Should Control Information Systems?" Harvard Business Review, (January-February, 1965), 135-139,
85. Webster, Eric. "Memo Mania: Its Causes, Carriers and Cures." Management Review, (September, 1967), 32-36.
86. Weinwurn, George F. "Managing Management Information." Management International Review, (January, 1970).
Proceedings
87. Lucas, Henry C. "A User-Oriented Approach to Systems Design." Proceedings of the 1971 Annual Conference, Association for Computing Machinery, August, 1971, pp. 325-338.
88. Anderson, J., Dickson, G. and Simmons, J. Behavioral Reactions to the Introduction of a Management Information System at the U. S. Post Office: Some Empirical Observations. Minneapolis, Minnesota, March, 1973.
89. Dickson, Gary W. and Powers, Richard F. MIS Project Management Myths, Opinions and Reality. University of Minnesota, Minneapolis, Minnesota, May, 1971.

130
90. Everest, Gordon C. Database Administrator: Organizational Role and Functions. University of Minnesota, Minneapolis, Minnesota, May, 1971.
91. Lucas, Henry C. The User-Data Processing Interface. Working Paper, Graduate School of Business, Stanford University, 1970.
Unpublished Material
92. Gallagher, Charles A. "Measurement and Analysis of Managers' Perceptions of the Value of Selected Management Information." Unpublished D. B. A. dissertation, Florida State University, 1971.
93. Guthrie, Arthur. "Attitudes of Middle Managers toward Management Information Systems." Unpublished D. B. A. dissertation. University of Washington, 1971.
94. Powers, Richard F. "An Empirical Investigation of Selected Hypotheses Related to the Success of Management Information System Projects." Unpublished Ph. D. dissertation. University of Minnesota, 1971.

APPENDIX
131

APPENDIX A
Pilot Study Questionnaires
132

MIS RESEARCH QUESTIONNAIRE ,33 (MANAGEMENT RESPONDENT)
1. How would you classify your position within your company? (Check one)
Top Management Middle Management Operating Management 2. How much organizational status do you feel is attached to your
position? (Check the position which most closely represents your feelings.)
A Lot Little 3. How long have you worked for your present employer?
5 years or less 15 to 20 years 5 to 10 years over 20 years 10 to 15 years
4. How long have you held your present position? 1 year or less 3 to 4 years 1 to 2 years 4 to 5 years 2 to 3 years over 5 years
5. Have you ever had any training in the areas of "computers" or "management information systems?" YES NO
If YES, was the training provided by (multiple responses permitted);
Academic training (e.g. college or university) If so, how many classes did you take?
Training provided by your present employer? If so, how much was: On-the-job training— Weeks.
Classroom training Hours. Other (specify)
Training provided by a previous employer? If so, how much was; On-the-job training— Weeks.
Classroom training Hours. Other (specify)
MANY OF THE FOLLOWING QUESTIONS DEAL WITH CONTACT BETWEEN YOU AND PERSONNEL IN THE INFORMATION SERVICES DEPARTMENT (ISD). THIS IS THE DEPARTMENT IN YOUR COMPANY CONTAINING THE "COMPUTER SYSTEMS ANALYST" FUNCTION. PLEASE KEEP THIS IN MIND WHILE ANSWERING THE QUESTIONS.
6. How many people in the INFORMATION SERVICES DEPARTMENT (ISD) have you come in contact within the past year? (number)
7. From your perspective, what level within the ISD is the person(s) with whom you work most closely?
Top Level Middle Level Lower Level 8. How much organizational status do you feel is attached to the
position of the ISD personnel with whom you work most closely? A Lot Little

134 9.
10.
11.
12,
13,
14,
15,
How many times did you communicate with ISD personnel (in either a written or oral form) when the main purpose of the contact was to determine the feasibility of a particular system to provide you with information? (Check one in each column.) (Feasibility is used to mean an assessment of the need, cost, benefits and impact on existing personnel of a tentative or proposed system.)
Minimum Average Maximum none 1 or 2 times 3 or 4 times 5 or 6 times over 6 times
I feel that contact with ISD personnel during system feasibility is: Important Unimportant How many times did you communicate when the main purpose of the contact was systems analysis, design and planning? (Analysis, design and planning is used to mean the determination of specific information needs, selecting a procedure to meet those needs and scheduling resources to create the procedure.)
Minimum Average Maximum none 1 or 2 times 3 or 4 times 5 or 6 times over 6 times
I feel that contact with ISD personnel during systems analysis, design and planning is:
Important Unimportant How many times did you communicate when the main purpose of the contact was system implementation? (Implementation is used to mean the activities such as designing report formats, creating and testing programs and procedures, training necessary personnel and converting to the new system.)
Minimum Average Maximum none 1 or 3 or 5 or over 6
times times times times
I feel that contact with ISD personnel during system implementation is: Important Unimportant How many times did you communicate when the main purpose of the contact was system modification and maintenance? (Modification is used to mean changes to an existing system which are not part of the original plan or planned changes of a major significance. Maintenance is used to mean periodic changes to a system on a planned basis, but not of major significance.)
Minimum Average Maximum none 1 or 2 times 3 or 4 times 5 or 6 times over 6 times

135 16. I feel that contact with ISD personnel during system modification
and maintenance is: Important Unimportant
THE QUESTIONS BELOW DEAL WITH YOUR CONTACT WITH ISD PERSONNEL AND THE INFORMATION WHICH YOU RECEIVE FROM YOUR FIRM'S COMPUTERIZED BUSINESS SYSTEM. PLEASE KEEP THIS IN MIND WHILE ANSWERING THE QUESTIONS.
17. During the development of a system for my use, contact with ISD personnel was generally (check one in each category):
by committee, group on "as needed" base
made by me frequent
initiated by me oral
by standard forms or reports
face-to-face
frustrating time consuming
costly relative to benefits
a one-to-one basis on a regular basis made by others infrequent intiated by the ISD written by letters or notes
by telephone or other devices not frustrating not time consuming inexpensive relative to benefits
18. When communicating with ISD personnel, I generally prefer:
oral communication standard forms
or reports face-to-face contact
written communication letters or notes
contact through the telephone or other device
19. I generally find ISD personnel:
approachable accessable
use terms I do not understand
unapproachable not accessable use terms I understand
20. With regard to the contents of generally:
approve it before I start receiving it feel it is important for me to approve it can change it after I start receiving it feel it is important
to be able to change feel it is accurate
a report (what it contains), I
do not approve it before I start receiving it do not feel it is important for me to approve it cannot change it after I start receiving it feel it is not important to be able to change it feel it not accurate

136 (20. Continued With regard to the contents of a report, I generally:)
feel accuracy is important
feel it is current feel it is important that the contents be current
feel accuracy is unimportant
feel it is not current feel it is not important that the contents be current
21, With regard to the format of a report (how it looks), I generally;
approve it before I start receiving it
feel it is important for me to approve it can change it after I start receiving it feel it is important to be able to change
feel satisfied with it
feel it is important to my satisfaction
22. With regard to the frequency of a report receipt), I generally:
approve it before I start receiving it
feel it is important for me to approve it can change it after I start receiving it feel it is important
to be able to change it
feel reports are delivered on time
feel it is important for reports to be delivered on time
do not approve it before I start receiving it do not feel it is important for me to approve it cannot change it after I start receiving it feel it is not important to be able to change it do not feel satisfied with it do not feel it is important to my satisfaction
(the timing of a report's
do not approve it before I start receiving it do not feel it is important for me to approve it cannot change it after I start receiving it feel it is not important to be able to change it
feel reports are not delivered on time feel it is not important for reports to be delivered on time
23. With regard to the quantity of information on reports I receive, I am generally;
satisfied dissatisfied
24. My directions to ISD personnel need clarification;
rarely often
25. When I ask ISD personnel for information, I generally;
get what I want don't get what I want

137
26. The understanding of ISD personnel of how my department or function works is;
adequate inadequate
27. My understanding of how the Information Services Department works is
adequate inadequate
28. Communications breakdown between the ISD and myself occur because I have overstepped my authority:
rarely often
29. Communications breakdown between the ISD and myself occur because the ISD overstepped its authority;
rarely often
30. I experience delays in getting information from ISD personnel because of the demands on their time by other members of the company;
rarely often
31. Written messages ot ISD personnel (which include instructions) need clarification;
rarely often
32. Spoken (oral) messages to ISD personnel (which include instructions) need clarification;
rarely often
33. On the whole, the most efficient means of communicating with ISD personnel is via a;
written message spoken (oral) message
34. When I ask the ISD for information and I do not get the information it is because the specifications were unclear:
rarely often
35. When I ask the ISD for information and I do not get the information it is because the ISD could not provide the information:
rarely often
36. For the purpose of explaining my information needs to the ISD, I feel my knowledge of "computers" and "management information systems" is;
adequate inadequate

138
37. I feel my communication of information needs to the ISD is:
adequate inadequate
38. For the purpose of understanding my information needs, I feel the ISD's knowledge of my job is:
adequate inadequate
39. Once my information needs have been communicated to the ISD, their communication of their understanding of my information needs is;
adequate inadequate
40. I feel that the ISD's communication of what they can do to satisfy my information needs is;
adequate inadequate
41. Once the ISD has communicated their capability to satisfy my information needs, I feel my communication of my understanding of their capability is:
adequate inadequate
42. Relative to my position in the company, I feel that the ISD personnel with whom I come in contact have:
more status less status
43. How long does it take to receive the first production of a report, once the initial request has been made? (Check one in each column.)
Minimum Average Maximum 1 week or less 1 to 2 weeks 2 weeks to 1 month 1 to 3 months 3 to 6 months 6 months to 1 year over 1 year
44. How long do you feel it should take? Minimum Average Maximum
1 week or less 1 to 2 weeks 2 weeks to 1 month 1 to 3 months 3 to 6 months 6 months to 1 year over 1 year
45. How important is the lag between the request for a report and its receipt?
important unimportant

139 46. Approximately how many different reports do you receive at least
once a year? 5 or less 21 to 25 6 to 10 26 to 30 11 to 15 • over 30 16 to 20
47. Approximately how many different reports do you receive at least once a year?
5 or less 21 to 25 6 to 10 26 to 30 11 to 15 over 30 16 to 20
48. How important is it that you receive the right number of reports?
important unimportant
49. Does your firm have a data administrator or data librarian (an individual or group who is responsible for maintaining, controlling and granting access to data)?
Yes, it is part of the Information Services Department Yes, but it is not part of the Information Services Department Yes, but I'm not sure which department it is in No, not to my knowledge I do not know
IF YOU ANSWERED YES TO QUESTION #49, PLEASE ANSWER THE FOLLOWING: OTHERWISE, PROCEED TO QUESTION #50.
A. How often are you likely to have contact with the data administrator?
rarely often
B. If you have contact with the data administrator, at what stage(s) are you most likely to ahve that contact? (Multiple responses permitted.)
feasibility analysis, design and planning implementation modification and maintenance
C. I feel that contact with the data administrator during system development is;
important unimportant

140
50. Does your firm have an operations research, management science or applied mathematics group (in addition to or in conjunction with an engineering department)?
Yes, it is part of the Information Services Department Yes, but it is not part of the Information Services Department Yes, but I'm not sure which department it is in No, not to my knowledge I do not know
IF YOU ANSWERED YES TO QUESTION #50, PLEASE ANSWER THE FOLLOWING; OTHERWISE, PROCEED TO THE INSTRUCTIONS AT THE BOTTOM OF THE PAGE.
A. How often are you likely to have contact with the operations research group in conjunction with the development of a computerized system?
rarely often
B. If you have contact with the operations research staff, at what stage(s) are you most likely to have that contact? (Multiple responses permitted.)
feasibility analysis, design and planning implementation modification and maintenance
C. I feel that contact with the operations research staff during system development is:
important unimportant
THANK YOU FOR YOUR HELP. WILL YOU NOW INSERT THE QUESTIONNAIRE IN THE ENCLOSED ENVELOPE AND PLACE IT IN THE MAIL AS SOON AS POSSIBLE.

141
MIS RESEARCH QUESTIONNAIRE (INFORMATION SERVICES DEPARTMENT RESPONDENT)
1. How would you classify your position within your department? (Check one) Top Level Middle Level Lower Level
2. How much organizational status do you feel is attached to your position? (Check the position which most closely represents your feelings.)
A Lot Little
3. How long have you worked for your present employer? 5 years or less 15 to 20 years 5 to 10 years over 20 years 10 to 15 years
4. How long have you held your present position? 1 year or less 3 to 4 years 1 to 2 years 4 to 5 years 2 to 3 years over 5 years
5. Have you ever had any training in the areas of "management" or "the functions of management?" YES NO
If YES, was the training provided by (multiple responses permitted);
Academic training (e.g. college or university) If so, how many classes did you take?
Training provided by you present employer? If so, how much was: On-the-job training— Weeks.
Classroom training Hours. Other (specify)
Training provided by a previous employer? If so, how much was; On-the-job training— Weeks.
Classroom training Hours. Other (specify)
MANY OF THE FOLLOWING QUESTIONS DEAL WITH CONTACT BETWEEN YOU AND PERSONNEL IN A MANAGEMENT POSITION. THE TERM "MANAGEMENT" AS USED IN THIS QUESTIONNAIRE EXPRESSLY EXCLUDES THOSE INDIVIDUALS IN A MANAGEMENT POSITION IN YOUR DEPARTMENT. PLEASE KEEP THIS IN MIND WHILE ANSWERING THE QUESTIONS.
6. How many people in a management position have you come in contact with in the past year in the performance of your job? (number)
7. From your perspective, what level within the company is the manager or group of managers with whom you work most closely? Top management Middle management Operating Management

142 8. How much organizational status do you feel is attached to the
position of the manager(s) with whom you work most closely? A Lot Little
9. How many times did you communicate with a manager (in either a written or oral form) when the main purpose of the contact was to determine the feasibility of a particular system to provide the manager with information? (Check one in each column.) (Feasibility is used to mean an assessment of the need, cost, benefits and impact on existing personnel of a tentative or proposed system.)
Minimum Average Maximum
none 1 or 3 or 5 or over
2 4 6 6
times times times times
10. I feel that contact with managers during system feasibility is: important unimportant
11. How many times did you communicate when the main purpose of the contact was systems analysis, design and planning? (Analysis, design and planning is used to mean the determination of specific information needs, selecting a procedure to meet those needs and scheduling resources to create the procedure,)
Minimum Average Maximum nc 1 3 5 OS
)ne or or or
rev
2 4 6 6
times times times times
12. I feel that contact with managers during systems analysis, design and planning is:
important unimportant
13. How many times did you communicate when the main purpose of the contact was system implementation? (Implementation is used to mean the activities such as designing report formats, creating and testing programs and procedures, training necessary personnel and converting to the new system.)
Minimum Average Maximum none 1 or 3 or 5 or over
2 4 6 6
times times times times
14. I feel that contact with managers during implementation is: important unimportant

143
15. How many times did you communicate when the main purpose of the contact was system modification and maintenance? (Modification la used to mean changes to an existing system which are not part of the original plan or planned changes of a major significance. Maintenance is used to mean periodic changes to a system on a planned basis, but not of major significance.)
Minimum Average Maximum nc 1 3 5 o\
)ne or or or er
2 4 6 6
times times times times
16. I feel that contact with managers during system modification and maintenance is;
important unimportant
THE QUESTIONS BELOW DEAL WITH YOUR CONTACT WITH MANAGERS AND THE INFORMATION WHICH MANAGERS RECEIVE FROM YOUR FIRM'S COMPUTERIZED BUSINESS SYSTEM. PLEASE KEEP THIS IN MIND WHILE ANSWERING THE QUESTIONS.
17. During the development of a system for the manager's use, contact with the managers was generally (check one in each category):
by committee, group on a one-to-one basis on "as needed" basis on a regular basis made by the manager made by others
frequent infrequent initiated by me intiated by the manager
oral written by standard forms by letters or notes
or reports face-to-face by telephone or other
device frustrating not frustrating
time consuming not time consuming costly relative to inexpensive relative to
benefits benefits
18. When communicating with managers, I generally prefer:
oral communication written communication standard forms letters or notes
or reports face-to-face contact contact through the telephone
or other device
19. I generally find managers:
approachable unapproachable accessable not accessable
use terms I do not use terms I understand understand

20. With regard to the contents of a report generally;
approve it before they start recei
ving it feel it is important for them to approve can change it after
they start receiving it
feel it is important to be able to change feel it is accurate
feel accuracy is important
feel it is current feel it is important
that the contents be current
144
(what it contains), managers
do not approve it before they start receiving it
do not feel it is important for them to approve it cannot change it after they start receiving it
feel it is not important to be able to change it feel it is not accurate feel accuracy is unimportant
feel it is not current feel it is not important that the contents be current
21. With regard to the generally:
approve it before they start
receiving it fe^l it is important
for them to approve it
can change it after they receive it
feel it is important to be able to
change it feel satisfied
with it feel it is important to their satisfaction
format of a report (how it looks), managers
do not approve it before they start receiving it
22. With regard to the frequency of a report of a report), managers generally:
approve it before they start
receiving it feel it is important
to approve it can change it after
they receive it feel it is important
to be able to change it
feel reports are delivered on time
do not feel it is important for them to approve it
cannot change it after they start receiving it feel it is not important to be able to change it
do not feel satisfied with it do not feel it is important to their satisfaction
(the timing of the receipt
do not approve it before they start receiving it
do not feel it is important for them to approve it cannot change it after they receive it do not feel it is important to be able to change it
feel reports are not delivered on time

145 (22. Continued. With regard to the frequency of a report (the timing
of the receipt of a report), managers generally:
feel it is important do not feel it is impor-for reports to be tant for reports to be delivered on time delivered on time
23. With regard to the quantity of information on reports managers now receive, they are generally:
satisfied dissatisfied
24. My directions to managers need clarification:
rarely often
25. When I ask managers for information, I generally:
get what I want don't get what I want
26. The understanding of management of how my department works is;
adequate inadequate
27. My understnading of how the manager's department or function works is:
adequate inadequate
28. Communications breakdown between managers and myself occur because I have overstepped my authority;
rarely often
29. Communications breakdown between managers and myself occur because the managers have overstepped their authority:
rarely often
30. I experience delays in getting information from managers because of demands on their time by other members of the company:
rarely often
31. Written messages to managers (which include instructions) need clarification:
rarely often
32. Spoken (oral) messages to managers (which include instructions) need clarification:
rarely often
33. On the whole, the most efficient means of communicating with managers is via a:
written message spoken (oral) message

146
34. When I ask managers for information and I do not get the information it is because the specifications were unclear:
rarely often
35. When I ask managers for information and I do not get the information it is because the managers could not provide the information;
rarely often
36. For the purpose of explaining his needs for information to me, I feel the manager's knowledge of "computers" and "management information systems" is:
adequate inadequate
37. I feel the manager's communication of information needs to me is;
adequate inadequate
38. Once the manager's information needs have been communicated to me, my communication of my understanding of the manager's information needs is;
adequate inadequate
39. For the purpose of understanding the manager's information needs, I feel my knowledge of the manager's job is:
adequate inadequate
40. I feel that my communication of what I can do to satisfy the manager's information needs is:
adequate . inadequate
41. Once I have communicated my capability to satisfy the manager's information needs, I feel the manager's communication of his understanding of my capability is:
adequate inadequate
42. Relative to my position in the company, I feel that the manager's with whom I come in contact have;
more status less status
43. How long does it take for the manager to receive the first production of a report once the initial request has been made?
Minimum Average Maximum 1 week or less 1 to 2 weeks 2 weeks to 1 month 1 to 3 months 3 to 6 months
^^^^^ 6 months to 1 year over 1 year
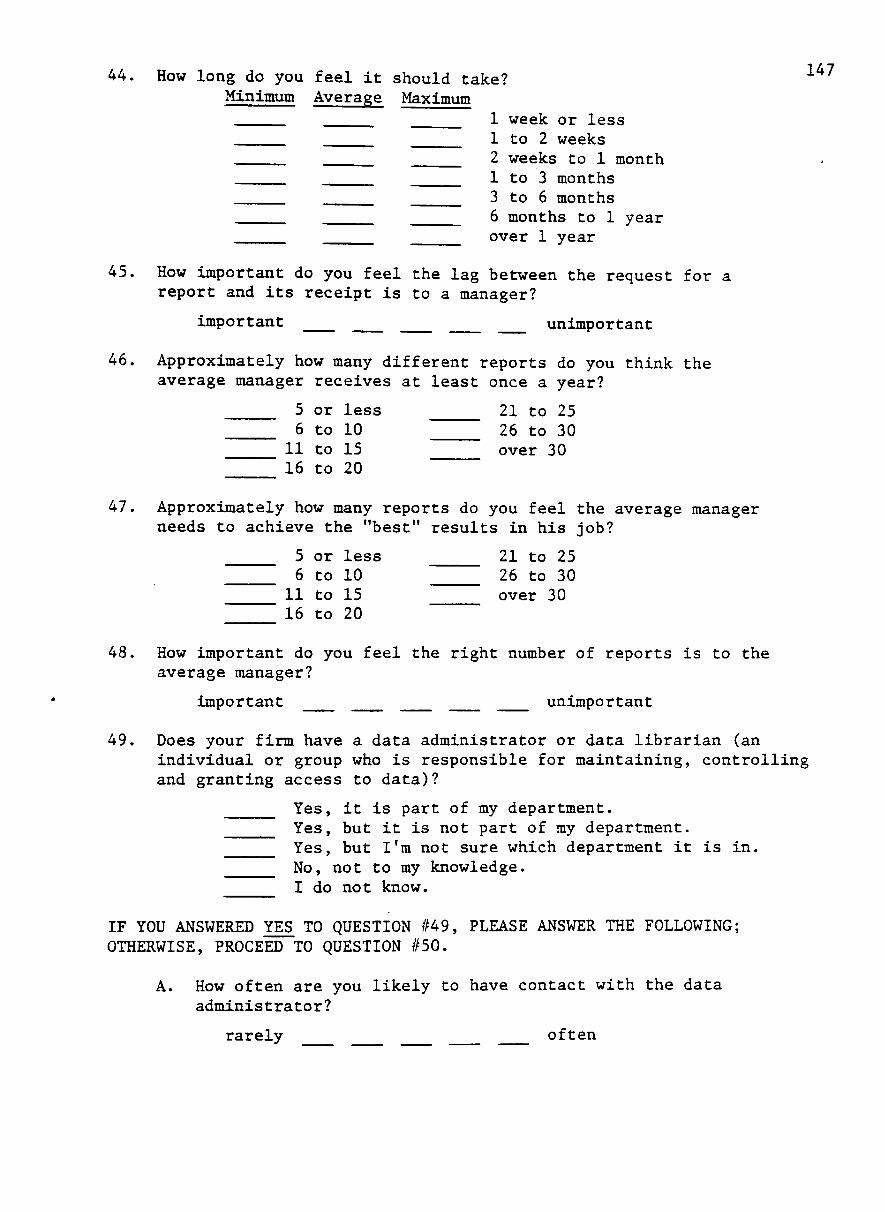
44. How long do you feel it should take? Minimum Average Maximum
1 week or less 1 to 2 weeks 2 weeks to 1 month 1 to 3 months 3 to 6 months 6 months to 1 year over 1 year
45. How important do you feel the lag between the request for a report and its receipt is to a manager?
important unimportant
46. Approximately how many different reports do you think the average manager receives at least once a year?
5 or less 21 to 25 6 to 10 26 to 30
11 to 15 over 30 16 to 20
47. Approximately how many reports do you feel the average manager needs to achieve the "best" results in his job?
5 or less 21 to 25 6 to 10 26 to 30 11 to 15 over 30 16 to 20
48. How important do you feel the right number of reports is to the average manager?
important unimportant
49. Does your firm have a data administrator or data librarian (an individual or group who is responsible for maintaining, controlling and granting access to data)?
Yes, it is part of my department. Yes, but it is not part of my department. Yes, but I'm not sure which department it is in. No, not to my knowledge. I do not know.
IF YOU ANSWERED YES TO QUESTION #49, PLEASE ANSWER THE FOLLOWING; OTHERWISE, PROCEED TO QUESTION #50.
A. How often are you likely to have contact with the data administrator?
rarely often

148
B. If you have contact with the data administrator, at what stage(s) are you most likely to have that contact? (Multiple responses permitted)
feasibility analysis, design and planning implementation modification and maintenance
C. I feel that contact with the data administrator during system development is:
important unimportant
50. Does your firm have an operations research, management science or applied mathematics group (in addition to or in conjunction with an engineering department)?
Yes, it is part of my department. Yes, but it is not part of my department. Yes, but I'm not sure which department it is in. No, not to my knowledge. I do not know.
IF YOU ANSWERED YES TO QUESTION #50, PLEASE ANSWER THE FOLLOWING; OTHERWISE, PROCEED TO THE INSTRUCTIONS AT THE BOTTOM OF THE PAGE.
A. How often are you likely to have contact with the operations research group in.conjunction with the development of a computerized system?
rarely often
B. If you have contact with the operations research staff, at what stage(s) are you most likely to have that contact? (Multiple responses permitted)
feasibility analysis, design and planning implementation modification and maintenance
C. I feel that contact with the operations research staff during system development is:
important unimportant
THANK YOU FOR YOUR HELP. WILL YOU NOW INSERT THE QUESTIONNAIRE IN THE ENCLOSED ENVELOPE AND PLACE IT IN THE MAIL AS SOON AS POSSIBLE.

APPENDIX B
Results of Factor Analysis
149
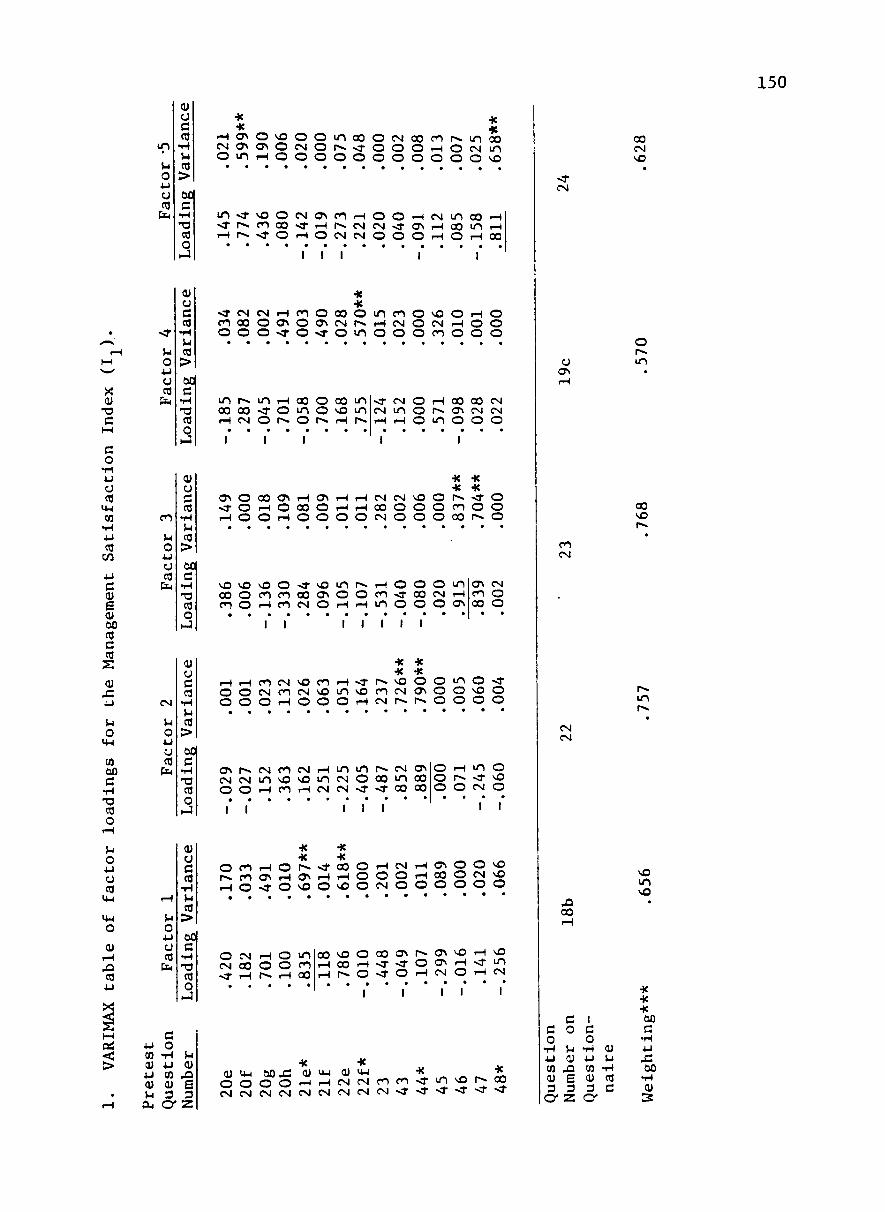
150
<-i
X QJ
13 d
M
d o
T-l 4J
a CO
t4-l CO
•H 4-1 CO
CO
4-1 d QJ
e QJ 00 CO d CO S QJ .d ;-) S-I
o <4H
CO 00 d
•H 13 CO O
r-i
U 0 4J
o CO
i*.i
U.4
o QJ
r-i JH CO • u
M [3^
<J >
.
i n
u o 4-1
a CO
UL4
-sP
V4
o 4-1
o CO f::
QJ O d CO
•H
CO > 00 d
ance
L
oad
!
•H
CO > OC d
•H 13 CO o
I - !
CO
u o 4-1
a CO b
QJ a r^ CO
• H
^ CO
> oo d
•H 13 CO O
r J
CN
; O 4J CJ CO
PC4
OJ CJ
d CO
>-i CO > OC d
• H 1 3 CO O »-)
r H
M O i J
a CO b
QJ O d CO
•H
CO > OC d
•H 13 CO O
1-3
d 4J O CD "H m 0) 4J QJ 4J CO X> 0) QJ £ V 3 3
OH C D ' Z
•K •K
•JC
r H O N O v O O O m o o O c N c o f o r > . i n o o C N O N O N O C N O r > > . - * O O O r H O C N i n o m r H O o o o o o o o o o o v o
i n < f v O O C N 0 N C 0 r H O O r H C N i n 0 0 r H > T P « « f O a O > 3 " r H I ^ C N C N > 3 - a N r H a O i n r H r H r - » > d - O r H O C < g C N O O O r H O r H C X :
I I I
He •K
^ T C N C N r H r O O O O O m c O O v O O r H O C 0 0 0 O O > O 0 \ C N r » r H C N O C N r H O O
o o o s r o ^ o m o o o c o o o o
m 00 r H
1
t ^ 0 0 CVJ
m -cr o
1
r-{
o r»
CO m o
1
o o r^
00 vO <-{
i n m r-»
<r CN
1
CN
m >-{
o o o
r H r^ t n
CX3 o o
1
00 CN
o
CN CN
o
•K -K He HC
O N O O O C T N r H O N r H r H C N C N v O O r ^ - ^ O » c r O r H O Q O O r H r H O O O O O f O O O r H O O r H O O O O C N O O O O O r ^ O
00 CVJ S O
a o i n
vO 0 0 CO
vO O o
vO CO r-i
o CO CO
>a-0 0 CN
vO CJN
o
m o r-i
r>. O r-^
^^ CO
m
o < •
o
o oo o
o CM
o
i n
<-\ (js
<y\ CO 0 0
CM
o o
I I I I I I
He He He He
r H r H C O C N v O C O r H v r r ^ ^ O O m O v r O O C ^ I C 0 C N v 0 l n ^ 0 C 0 C N 0 ^ O O ' > 0 O O O O r H O O O r H C v j r ^ r - ^ O O O O
O N r » » c M c o c N r H t n i n r ^ c N < T i c N r s i m v o v o m c M O a o m o o O O r H C O r H C N e N > 3 " « ^ Q O O O
I I I I I
O rH m O O r-* <r ^ O O CM o
I I
O CO r-* CO ON rH o <r
r^ O
He He He He r > - « ^ 0 0 O r H C N r H a N O O » ^
, , 0 > r H r H O O O r H 0 0 O C N \ O O v O O ^ O C v J O O O O O O
00
CO CN
in
CN CM
00
m
o CN rH o in CM 00 O O CO ^ rH r^ rH 00
0 0 ' > o O a 0 0 N r ^ < 3 N ' > 0 r H v o t H O O r H - v f - d - O C y i r H ^ i n r H r ^ O - J - O r H C N O r H C N
I I I I I
* -^ ^ J . Q J i w O O j T Q J u ^ Q J ' J - i * ^ « , ^ 2 «
O O O O r H - H r s l C N C O C O ^ ^ i n v O r - O O C M C N C M C N C M C N C N C N C N - , 3 ' « 3 - < r ^ ' ^ ' ^
d o
•H U 4-1 QJ CD J^ QJ £ 3 3
C 2 C
I d o
• H QJ 4 J >-l
CO - H QJ CO 3 d
He He He 00 d
00 •H QJ 2

151
2. VARIMAX table of factor loadings for the Management Involvement Index
Prestes Question Number
20a* 20b 21a 21b 22a 22b*
Question Number on Questionnaire
Weighting'
(l2)-
I t * *
Factor 1 Loading
.889
.016
.861
.275
.876
.172
Variance
17
.757
.790**
.000
.741**
.076
.740**
.030
-
Factor 2 Loading
.126
.641
.301
.764
.071
.859
Variance
.016
.372
.091
.584**
.005
.739**
19c
.657
3. VARIMAX table of factor loadings for the Management Influence Capability Index (I-).
Pretest Question Number
20c 20d 21c 21d 22c 22d*
Question Number on Questionnaire
Weighting***
Factor 1 Loading
.873
.003
.929
.247 ,831 .199
Variance
.762** ,000 .863 .061 .691** .040
18a
,769
Factor Loading
.105
.873
.126
.877
.183
.881
2 Variance
19b
.769
.011
.762**
.016
.769**
.033
.776
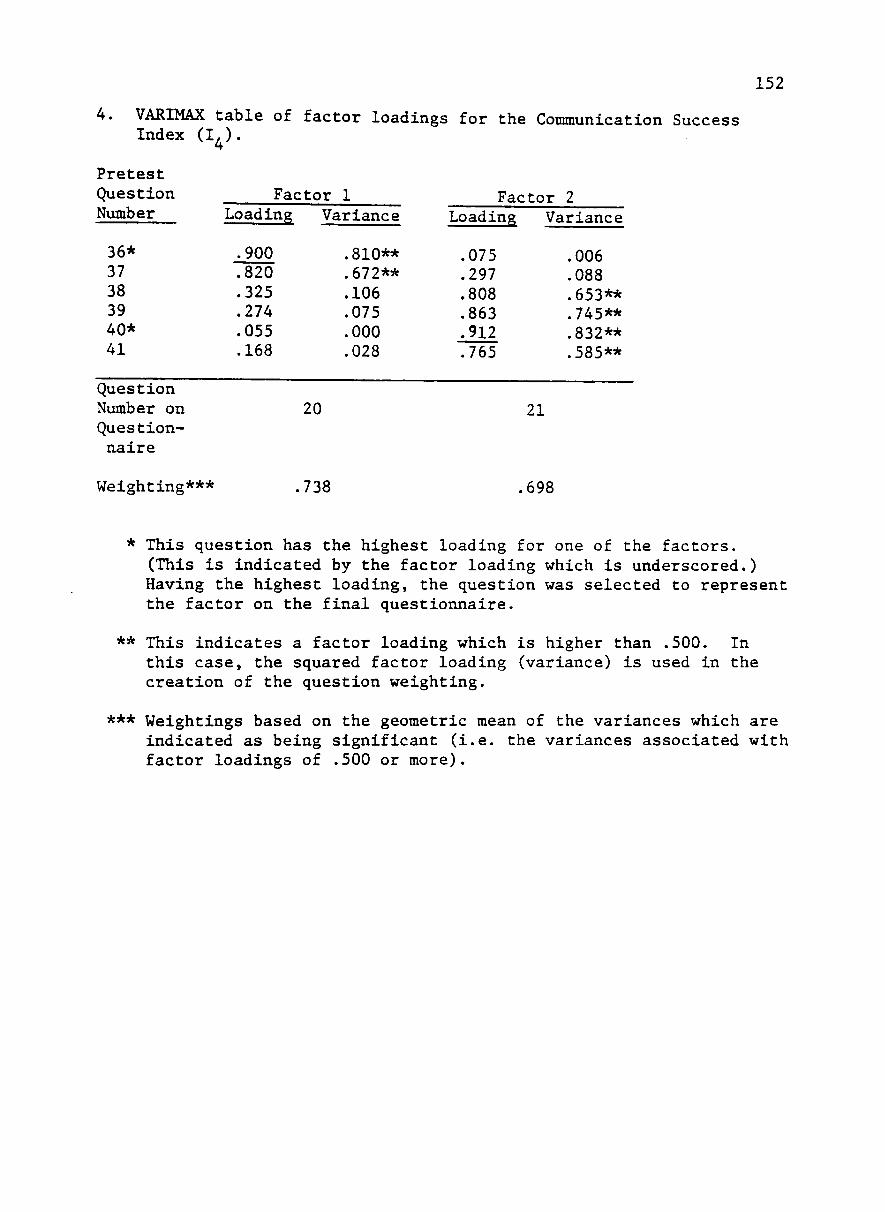
152
4. VARIMAX table of factor loadings for the Communication Success Index
Pretest Question Number
36* 37 38 39 40* 41
Question Number on Questionnaire
<i, '?•
Factor Loading
.900
.820
.325
.274
.055
.168
1 Variance
20
,810** .672** ,106 .075 .000 .028
Factor Loading
.075
.297
.808
.863
.912
.765
2 Variance
21
.006
.088
.653**
.745**
.832**
.585**
Weighting*** .738 .698
* This question has the highest loading for one of the factors. (This is indicated by the factor loading which is underscored.) Having the highest loading, the question was selected to represent the factor on the final questionnaire.
** This indicates a factor loading which is higher than .500. In this case, the squared factor loading (variance) is used in the creation of the question weighting.
*** Weightings based on the geometric mean of the variances which are indicated as being significant (i.e. the variances associated with factor loadings of ,500 or more).

153
1. VARIMAX table of factor loadings for the Management Satisfaction Index
Pretest Question Number
20e 20f 20g 20h* 21e 21f 22e 22f 23* 43 44* 45 47 48
Question Number on Questionnaire
(1^).
Factor Loading
.376
.725
.649
.809
.310
.782
.668
.758 -.114 .031 .012 .091 .067 .006
Weighting***
1 Variance
16c
.141
.526**
.434
.654**
.096
.612**
.446
.575
.013
.001
.000
.008
.004
.000
.590
Factor 2 Loading Variance
.692
.248
.503 -.007 .602 .062 .180
-.117 .904 .471 .166 .653 .074 .119
18
.817
.479
.062
.253
.000
.362
.004
.032
.014
.817**
.222
.028
.426
.005
.014
Factor 3 Loading
.060 -.271 -.093 -.155 .174 .219 .104 .185 .037 .787 .856 .212
-.006 -.655
Variance
.004
.033
.008
.024 ,030 ,040 .011 .034 .001 .619** .733** .045 .000 ,429
21
.674
VARIMAX table of factor loadings for the Management Involvement Index
Pretest Question Number
20a 20b* 21a 21b 22a* 22b
Question Number on Questionnaire
(I2) •
Factor Loading
Weighting***
,874 .179 .840 .260 .939 .750
1 Variance
17a
.71S
.764**
.032
.706**
.068
.882**
.563**
1
Factor 2 Loading Variance
.097
.944
.285
.927
.187
.283
16a
.875
.009
.891**
.081
.859**
.035
.080

3. VARIMAX table of factor loadings for the Management Influence Capability Index (I^).
154
Pretest Question Number
20c* 20d 21c 22c 22d*
Question Number on Questionnaire
Factor 1 Loading Variance
.053
.755
.434
.811
.962
.003
.570
.188
.658**
.925**
17b
Factor Loading
.941
.396
.766
.253
.020
2 Variance
16b
.885**
.157
.589**
.064
.000
Weighting*** 703 722
4, VARIMAX table of factor loadings for the Communication Success Index
Pretest Question Number
36 37 38 39* 40 41
Question Number on Questionnaire
(I, * > •
Factor 1 Loading
,457 .701 .596
-.044 .823 .928
20
Variance
.201
.491
.355 ,002 .677** .861**
Facte Loadin
.619
.435
.621
.903
.247 -.005
•S
19
Dr 2 Variance
.383
.188
.386
.815**
.061
.000
Weighting*** .763 .815
* This question has the highest loading for one of the factors. (This is indicated by the factor loading which is underscored.) Having the highest loading, the question was selected to represent the factor on the final questionnaire.
** This indicates a factor loading which is higher than .500. In this case, the squared factor loading (variance) is used in the creation of the question weightings.

155
4. Continued.
*** Weightings based on the geometric mean of the variances which are indicated as being significant (i.e. the variances associated with factor loadings of .500 or more).

APPENDIX C
Wilcoxon Signed-Ranked Test for
Questionnaire Stability
156

157
Results of the Wilcoxon Signed-Ranks Test for
Questionnaire Stability
The following table presents the findings of the Wilcoxon
Signed-Ranks test. The test analyzes the difference in responses
between the questionnaires and the results of a follow-up interview
with the respondents during the week of November 15, 1976. The total
number of respondents in the follow-up interviews was thirty-seven
participants from three companies. The indication of significance
in the table below was taken from Spence et al (23: 241).
Pretest Question Number
1 2 3 4 5 6 7 8 9a 9b 9c 10 11a lib lie 12 13a 13b 13c 14 15a 15b 15c 16 17a
Wilcoxon Ranks
Signed-Test (T)
Statis
0 5 3 6 29 13 7 7 12 10 25 18 30 38 37 20 20 25 24 9 22 16 11 13 26
tic
Significance Level (1 than or
1 5 5 1 1 1 5 5 5 5 5 5 5 5 5 5 5 5 5 1 5 5 5 5 5
.ess equal)
Number of Untied Ranks
7 9 8 12 19 14 11 10 13 11 17 15 16 18 18 14 14 15 15 13 15 13 12 12 16

158
Pretest Question Number
17b 17c 17d 17e 17f 17g 17h 171 17j 17k 18a 18b 18c 19a 19b 19c 20a 20b 20c 20d 20e 20f 20g 20h 21a 21b 21c 21d 21e 21f 22a 22b 22c 22d 22e 22f 23 24 25 26 27 28 29 30
Wilcoxon Signed-Ranks Test (T)
Statistic
6 0 37 42 1 37 38 4 22 16 24 7 7 16 7 2 17 12 19 33 44 6 24 24 18 36 34 3 13 14 13 11 16 22 23 37 3 15 8 25 40 35 12 16
Significance Level (less than or equal)
5 •
1 5 5 1 5 5 5 5 5 5 1 5 5 5 1 1 1 5 5 5 5 1 5 1 1 1 5 5 5 1 1 5 1 5 5 5 5 5 5 5 1 5 5
Number of Untied Ranks
9 2 18 19 2 18 18 8 15 13 15 12 10 14 11 10 16 14 14 17 19 9 18 15 16 20 20 8 12 12 14 14 13 17 15 18 7 13 10 15 19 18 13 14

159
Pretest Question Number
31 32 33 34 35 36 37 38 39 40 41 42 43a 43b 43c 44a 44b 44c 45 46 47 48 49 49A 49B 49C 50 50A 50B 50C
Wilcoxon Signed-Ranks Test (T) Statistics
16 5 35 26 42 24 10 12 23 9 20 28 25 23 20 25 28 17 24 15 18 0 0 6 12 19 0 9 8 4
Significance Level than or
5 5 5 5 5 5 1 5 5 5 5 5 5 5 5 5 5 5 5 5 5 5 1 1 1 1 1 1 1 1
(less equal)
Number of Untied Ranks
18 10 17 17 19 15 13 12 15 11 14 16 15 16 16 15 15 15 16 13 14 6 0 6 5 4 1 7 3 5

APPENDIX D
Modifications of Questionnaires
160

161
Modification of Questionnaires
As a result of the pretest of the questionnaires and the
follow-up interviews with the respondents, there was one modification
which was necessary. During the pretest, it became apparent that the
scaling used on questions 9, 11, 13 and 15 were not totally adequate.
That is, some respondents indicated that their contact with the other
party in the development of a system was well above the number ("over
6 times") provided on the questionnaire. This tended to be a greater
problem for the managers in the pretest than for ISD personnel,
with one manager indicating contacts in the 100 to 200 range. Thus,
on the final questionnaire, the scale was modified to allow a larger
upper limit. This was the only change of major consequence resulting
from the pretest.
APPENDIX E
Results of Data Analysis for
Communication Success Model
Development
162

163
He He He CO H Z
Q Z o 04 CO u
&-z
CJ5
<4-l
o CO •H CO
to c <:
CO iJ d Q)
1 3 d o a CO QJ Pi
d QJ / - v S CO QJ rH 00 CO II d CO Z S >^ 00 d
•H U CO CJ
CO r-t QJ P ) - l
O CJ
d CO £ V.I CO OJ
a CO
d 3 £ £ o
CJ
aouBo -TjTnSxs
^uaro •TJJ3O0
i n r * . O O c M a > r ^ o o s o c M O r H r H C M C N r » . c N o o o o - , * i n c N e N - * r ^ ^ s I • o o > 3 • o o ^ » . r * « > 3 • o o o ^ L n r ^ r H o o o ^ o ^ c o ^ o O l n s l • C O C M O O O C O C M C O s r > 3 - C M C M C N r H C O C O r - i C N « J - r O - 3 - C M C N
O 00 O O rH rH m m
r-^ CM ^ r rH rH
f ^ o ^ CM < r r>> vO o o o » r
r H o o m o o ^ O v o m o r ^ O C M C M r H O C N r H O r H O C N CN
I I I I I I I
CO 4J d
I QJ rH 13 < d
o O CO vO
QJ CM CD oi
• H U CO 4 J >s d z
rH QJ ^ ^ CO £ d QJ
< 00 CO
d CO
S
QJ U CO 3
cri CO
d o
T 4 4-1 CO
rH QJ U U o u d CO £ u CO QJ
CM CO
aouBo -TjTnSTS
OT:IST: IB3S
aouBo
-TJTnSxs
^uaro -TJjaoQ
r H t ^ e N r H C 0 « a - i n i n v O O 0 0 r H i n % 3 - C M r H 0 0 r - 4 . ^ O r H r - . r ^ o ^ c o o c M t n r H ^ » » c o c o c o o ^ l n c o r » » O l n o ^ c N l n o o c M l n c 3 ^ r H c o o ^ a ^ c o v O f O l n r ^ v o ^ l n l n r » • o ^ l n ^ o a ^ c o v o o c N r ^
He He He
CN m rH ON CN CJN 00 <3N O O ON CM r^ CO
C O m v O O O O O C N v O m r H v O l ^ r H O O r * . C N r H C O C O O O C O r H O O O r H O C M O
O r
O C N O N > d " ^ v O i n r H - ^ C M r H O v O i — ( s r O N O N v O ^ r H v O r H i n O N O N r H c o o N O N i n o N v r i ^ o o o N r ^ v O v o ^ o o c o o o v o o o o O O C O r H C M C O r H O C O < r C N > T C O C O C O C O C O > * C O < - < - C O C O
d o
d -H O 4J
•H CO 4J -H CO > OJ QJ 3 Ul
C J3 .O
r«« CM
vO CN
o r-i
CO CN
r-{ r-\
m O
<-{ CN
vO CM
00 O
r-^
o c o m r o r x - r ^ r ^ O c o v O C N ^ r H O O O O O r H O O O O
I I I I
rJ CO M CU a OS cai H H W
rH CM CO r, TH CN CO r-4 CN CO C J C J O C f a C i w f a Q C a Q M Z H J C O C J C J C J C J C J U U C J U
CM f^ O
s s s o CJ CJ CJ CJ
CBS O
z s CJ CJ

164
l n v o < r c N r > » c N r H r » o o ^ l n s r o ^ ^ » » co<"vOr- (vo<NCNON>3"ONOineN i n i n c o v o o N r H C N O O i n o N o o i n r ~ > . > 3 " r H i n o o o o i n o c o c o o o o N r - ' v o r H C M s r < - r H O C 0 C N r H C M C 0 r - ( O > a " » 3 - r H r H O C M C M O C 0 < - C 0 r H C M C 0 C M
r H O r H C N v o e N s r i n o o o o o p ^ i n c M s r v O r H O r ^ < - c M c o i n v O r ^ r > . i n o C O C N O O C M v O r - i C M C O C M O C M - v f O O C O C O - J - r H C M r ^ ' - l O r H C O r H r - ' C M
I I I I I I I I I I I I
i n i n c M O i n o i n i n o < ) " 0 ^ i n « j r \ o - < f ' < r c N i n i n \ o c M r H i n < r r > « - < r v o c o o c o o i n o o r ^ v o o N r ^ c o r H v o i n s o i n i n c o v o m c o o i n c o i n c T N i n c N m o o o o o O \ O c N c o r H c o ^ o o o c o o o o a o o o r s O N i n i n c o r « » c o o o
o o o N ^ t * ^ a \ r « . O N C N c N O N c o r * . c N ^ c N C N r H - < r c N O N c o r ^ O O v O r H r H o o r ^ r ^ c N r > . ^ Q O v r r > . f ^ 0 ^ v O
CN ^ 00 ^ r^ ^o m O CO CO CO C 03 o
CO
vO r>. rH m rH CM CM r-t ON CN vO O O CM CO O sr CM O O rH
m CO CO CO CO CO CO
r H i n m r ^ s s r m O f ^ r H C M c o v O r H O O c o i n o t j N s o o 0 > 3 " t 3 N ^ O O i n o o o t 3 N o o r ^ r * i n t n c o c N c o ^ r ^ r H C O C O O O O O O O O C O O r H O C M r H C O O C M C N C O
o ^ s r c o o » ^ ^ v o o o l n - ^ r H O c o o o o N l n v o o o o ^ o • c • r H o ^ o ^ l n < • \ o r H C M O r H i n i n C N e N O O C O i n i n c O - ^ v O i n O C N r H C O r H e N O > a " r H r H O
I I
Q i S H J H d 3 S O S > J H Q - O C 5 2 C t . O f e C s . C t i E - i C J O f e f t i a j C J Z C J H - ' C J C J C J C J C J C J C J C U ( i . C l * < : < 3 Q C 3
< : < j o CJ c u s < o i p o o c c a c j u u ^ z S a c O S H - t H H S O S c o C J C O C J t j
QJ 3
1 3
CO
CO
>s U CO
>
CO
s CO 4-1 d QJ
•H o
QJ O O
d o
to
o r H
u £ O
13 QJ 01 1-1
u^
14-1
O
CO QJ QJ U 00 QJ o He
CJN
II
£ o
13 QJ QJ ! - i
U-l
U-l
O
CO QJ QJ M OC V
r^
He He
QJ )-i U O
a c CO £ ! - i
to QJ O.
CO
u o
<4-l
0) a d to CJ
• H
<4-l •H d 00
•H CO
(4-1
o r J
QJ > QJ
r-^
QJ J= H He He He
• iO /•
T H
- 3 C ^ c S-I
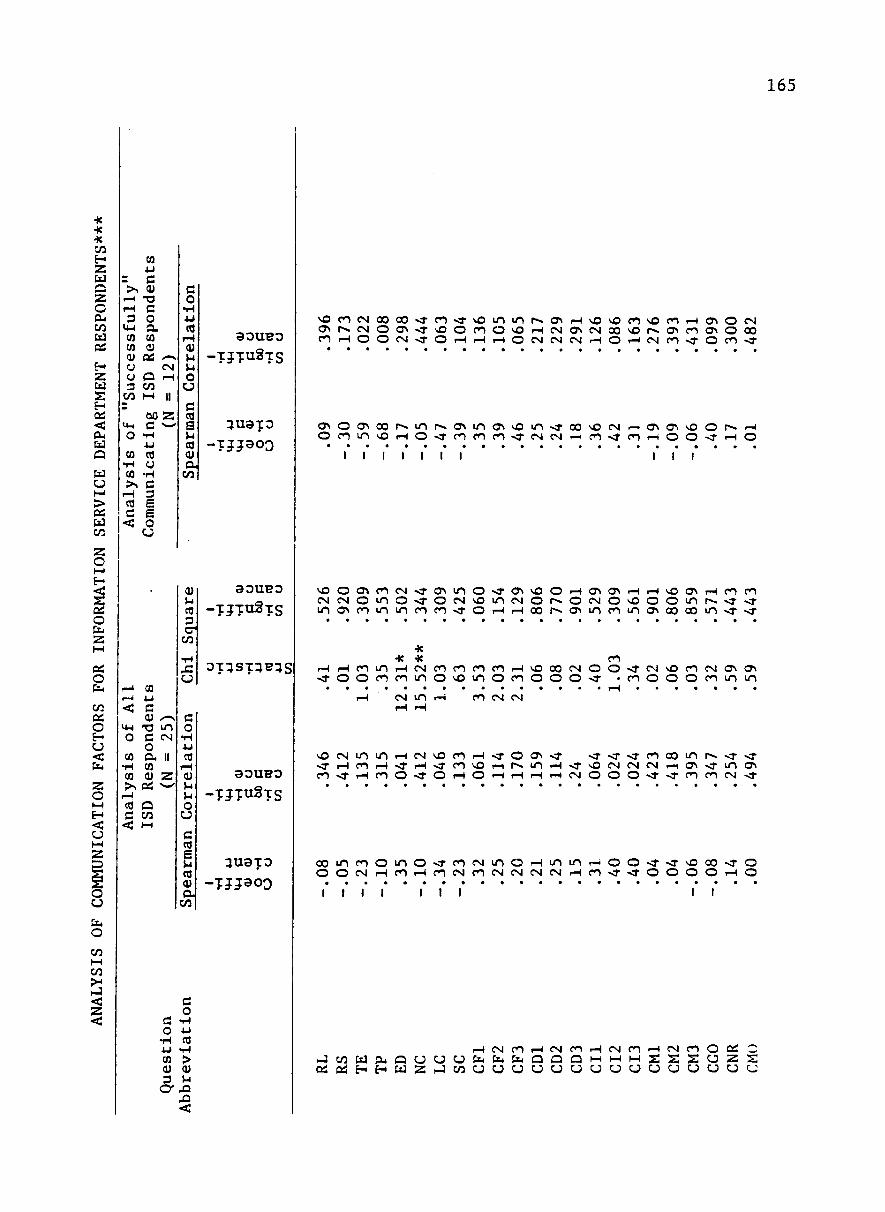
165
CO
90UB0
-TJTnSTS
3U3T0
-TJ5903
aouBo
O T : ; S T : ; B 3 S
v o c o c M o o o o s r c o < r v O i n i n r » « . O N r H v O v o c o v o c o r H O N O c N C 3 N r ^ C M O O N - . T v O O C O O v O r H C N O N e N O O v O r - > . O N C O O N O O O C O r H O O C M - J - O r H r H r H O C N e M C N r H O r H C M C O « ^ O C O < "
O N O t j N o o r ^ i n r ^ O N i n t j N v O i n < " o o v o c N r J O c O i n v O r H O v J - C O C O C O ~ 3 - C M C N r H C O > 3 " C O
ON ON vo o r^ rH o o sr ^ o
I I I I I I I I I I
CO
CO
3 0 U B 0
-TJTnSrs
3U3TO
-TJ^soO
V O O C 3 N C O C M ^ O N i n O > 3 " O N v O O r H O N O N r H r H v « O N r H C O C O c M C M O m o ^ o c M v o m c M O r ^ O C N O v o o o m r ^ ^ s r i n o N c o i n i n c o c o < r O r H r H Q O P ^ O N i n c o i n a > o o o o i n > 3 ' s r
He •K * CO
r H r H C O m r H C N C O C O C O C O r H v O O O C N O O s r C N ^ f O C M O N O N
< r o o c o c o i n o v o i n o c o o o o » 4 - - c o o o o c o i n i n CM i n rH CO CM CN
v ^ c M i n m r H C N s o c o r H s r O O N s r s r - 3 " < T c o o o i n r ^ < r « * « ^ r H C O r H « 3 " r H - J - C O v O r - i r - ^ i n r H ^ ^ C N C N C N r H O N s r i n C J N C O ^ r H C O O « * O r H O r H r H r H r H C M O O O « * ^ C O C O C N s r
o o m c o o m o s r c o c N i n O r H i n m O O C M r H C O r H C O C M C O C N C M C M C M r-i CO
o o > 3 - < r v o o o s r o > 3 - s r o o o O r H O
I I I I I I I
rH CN CO rH CM CO H J c o C d C L i a U C J U C £ < b r i 4 a C 3 Q C i S o i H H W Z h J c o C J O C J C J C J C J
CM CO
CJ CJ
rH CN CO O C5i C S S S CJ Z S
CJ CJ CJ CJ CJ CJ CJ

166
s o r ^ m m c N r H c o i n o o o i n s r m o o o o o N - a ' O c o r H O N C M C N C M Q O - a ' i n o v o o g e N P O o o O s r O N O N r s v o o i n o o o N r H i n c M O O c M r - i v O O i n r H r ^ r ^ C O O r H O s r O O « a - O C M r H O O O r H O r H s r i H O O O C N O O C M O < -
CM •«a-
NO CO ^a- rH rH CN O rH m o 00 m o - * <-{
O N r H C N 0 0 C N r - > O C N v O t 3 N C M v O > * O i n 0 0 c o r ^ ^ a - s r c M v o c o o c o o o m v o c N r - s r
m CN
CN o
I I I I I I I I I
\ O i n r ^ r * r * » s r s r r H r > . r » « r^ v O t ^ r < . ^ « * r - » r H C N i n r H O N v o o c o s r - ^ s r O O N C N - ^ O N i n i n ^ a - O N O O s r ^ d - c N C N c M c N O 0 0 0 0 v O v O C N O > 3 " r H C M s r O O v O O O O C M C J N r - » O r H r H 0 0
sr CM vO rH >3-ON O O 00 CO rH O OO 00 00
vO «d- rH rH sr CN O O CM CN CO CM
r- o sr vo CM sr «^ sr CO >j' vo vo CM
m C N C M s T r H C O C O r H P ^ C N C N C O O r H O ^ a -
O vc rs. ON vo CM sr CO rH sO CN O O O
1-i 00 CN CO CO CN 00 CO rH m CN CN r-i ON
r H v O C O C O C O r H r * . O N i n O N r H s r < " r H r H r H i n v O r H C M C O r ^ O < - s r C M I ^ C M O i n O O O r - l C O » 3 - r H C O r H O C M O < - r H O O r H O O O O
O vO rH ON CO ON r^ CM O O O rH CM O O O O CO
rH rH t3N m CM O O O -3- CO O O O CN r^
OOsf«^CJNOQOsT«3 ->3 '<3NrHrHrHOOrHsrs rcOCJNCNr^ O O C N O C M ^ O r H C O O r H ^ a - m C N i n s O v O s T r H C O v O - ^
CO in
m 00
o vo sr r^ sr rH
I I I I I I
0 ! S Z 3 H J H 3 S O 3 H C U C J p t i i - H O P u f e [ i 4 H C J O I i , p H C J c j c j c j c j c j c j c j c j c u f i i < : < :
Q 3 < :< :o CJ cus<:ce: z c j M s o o o Q u c j w a z S o o 3 Q O O d 3 M H H 5 O Z C 0 C J C 0 C J C J
CO «3-
0) 3 13
.d 00
CO
u CO >
CO £ CD
d QJ •H O •H <4-l U.I' QJ O
a d o
to r-i QJ Ul U O CJ
d to
to QJ c. CO
Ul
o <4-l QJ o d CO o
U II -H 14-1
E E -H O O d -o 13 ao QJ QJ -H QJ QJ CO Ul Ul U-l 14-1 U-l
o U-l (4-1
O O r-l QJ 00
CO CD > c: QJ QJ QJ -H QJ 0) rH 13 u u d 00 00 QJ 3 QJ QJ ^ O G Q E- Ul He He HC
He He He

APPENDIX F
Post Study Questionnaires
167
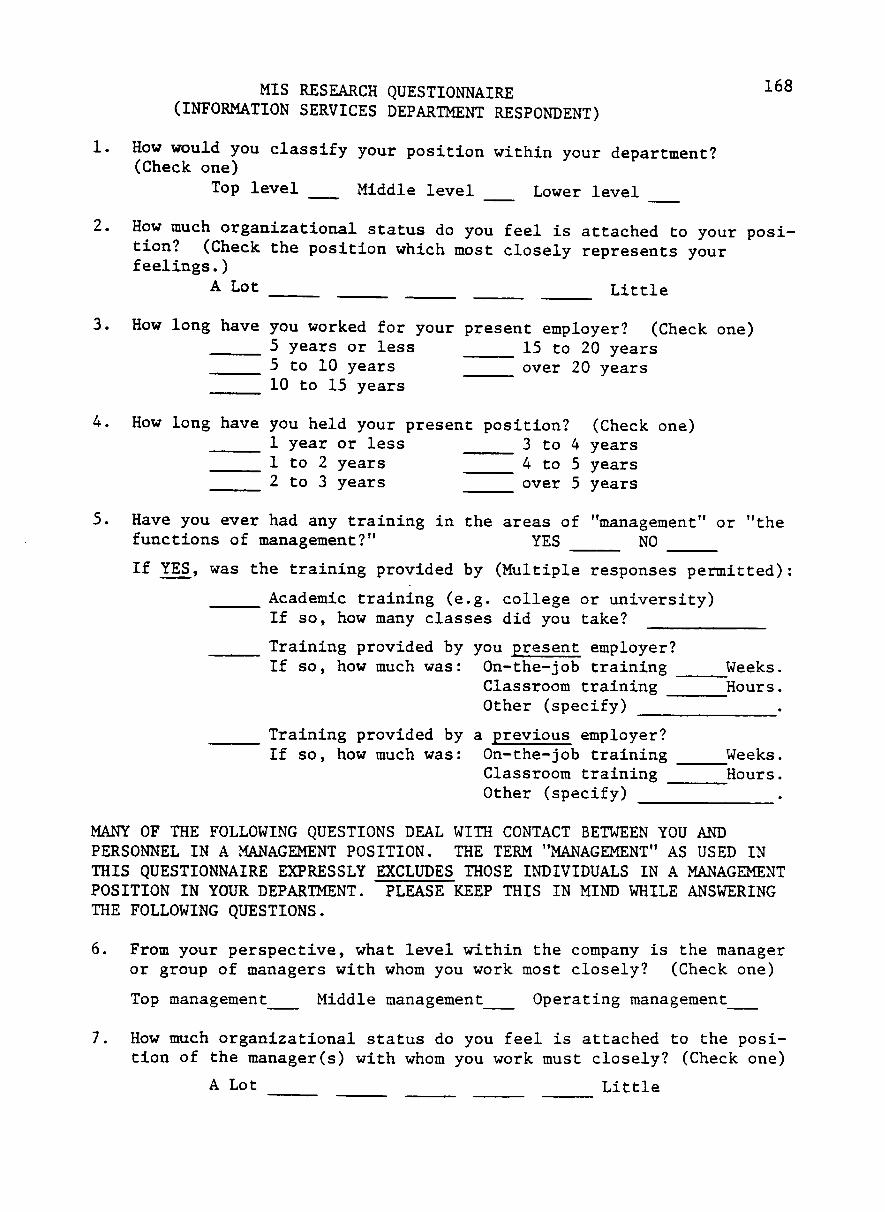
MIS RESEARCH QUESTIONNAIRE ^^^ (INFORMATION SERVICES DEPARTMENT RESPONDENT)
1. How would you classify your position within your department? (Check one)
Top level Middle level Lower level
2. How much organizational status do you feel is attached to your position? (Check the position which most closely represents your feelings.)
A Lot Little
3. How long have you worked for your present employer? (Check one) 5 years or less 15 to 20 years 5 to 10 years over 20 years 10 to 15 years
4. How long have you held your present position? (Check one) 1 year or less 3 to 4 years 1 to 2 years 4 to 5 years 2 to 3 years over 5 years
5. Have you ever had any training in the areas of "management" or "the functions of management?" YES NO
If YES, was the training provided by (Multiple responses permitted):
Academic training (e.g. college or university) If so, how many classes did you take?
Training provided by you present employer? If so, how much was: On-the-job training Weeks.
Classroom training Hours. Other (specify) .
Training provided by a previous employer? If so, how much was: On-the-job training t-Jeeks.
Classroom training Hours. Other (specify) .
MANY OF THE FOLLOWING QUESTIONS DEAL WITH CONTACT BETWEEN YOU AND PERSONNEL IN A MANAGEMENT POSITION. THE TERM "MANAGEMENT" AS USED IN THIS QUESTIONNAIRE EXPRESSLY EXCLUDES THOSE INDIVIDUALS IN A MANAGEMENT POSITION IN YOUR DEPARTMENT. PLEASE KEEP THIS IN MIND WHILE ANSWERING THE FOLLOWING QUESTIONS.
6. From your perspective, what level within the company is the manager or group of managers with whom you work most closely? (Check one)
Top management Middle management Operating management
How much organizational status do you feel is attached to the position of the manager(s) with whom you work must closely? (Check one)
A Lot Little
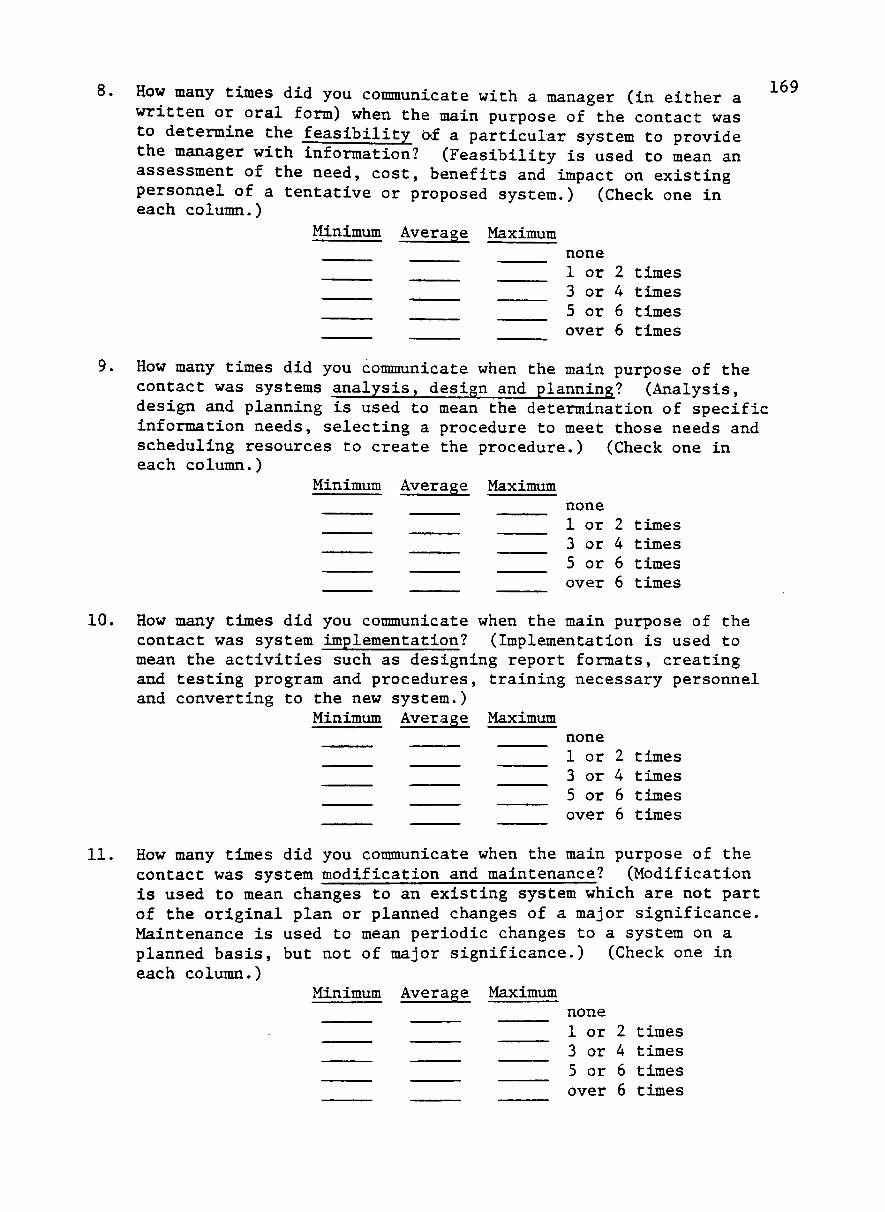
8.
10.
11,
How many times did you communicate with a manager (in either a written or oral form) when the main purpose of the contact was to determine the feasibility of a particular system to provide the manager with information? (Feasibility is used to mean an assessment of the need, cost, benefits and impact on existing personnel of a tentative or proposed system.) (Check one in each column.)
Minimum Average Maximum
169
nc 1 3 5 o\
me or or or 7er
2 4 6 6
times times times times
How many times did you communicate when the main purpose of the contact was systems analysis, design and planning? (Analysis, design and planning is used to mean the determination of specific information needs, selecting a procedure to meet those needs and scheduling resources to create the procedure.) (Check one in each column.)
Minimum Average Maximum nc 1 3 5 o
me or or or
rer
2 4 6 6
times times times times
How many times did you communicate when the main purpose of the contact was system implementation? (Implementation is used to mean the activities such as designing report formats, creating and testing program and procedures, and converting to the new system.)
Minimum Average
training necessary personnel
Maximum none 1 or 3 or 5 or over
2 4 6 6
times times times times
How many times did you communicate when the main purpose of the contact was system modification and maintenance? (Modification is used to mean changes to an existing system which are not part of the original plan or planned changes of a major significance. Maintenance is used to mean periodic changes to a system on a planned basis, but not of major significance.) (Check one in each column.)
Minimum Average Maximum nc 1 3 5 OS
me or or or ;-er
2 4 6 6
times times times times

170 12. I feel that contact with managers during the overall development
of a system is:
important unimportant
THE QUESTIONS BELOW DEAL WITH YOUR CONTACT WITH MANAGERS AND THE INFORMATION WHICH MANAGERS RECEIVE FROM YOUR FIRM'S COMPUTERIZED BUSINESS SYSTEM. PLEASE KEEP THIS IN MIND WHILE ANSWERING THE FOLLOWING QUESTIONS.
13. During the development of a system for the manager's use, contact with the manager was generally: (Check one in each category.)
on a one-to-one basis by committee, group on "as needed" basis
initiated by me oral
by standard forms or reports frustrating
time consuming costly relative to
benefits
on a regular basis initiated by the manager written by letters or notes
not frustrating not time consuming inexpensive relative to benefits
14. When communicating with managers, I generally prefer:
oral communication written communication
15. I generally find managers: approachable accessible
not approachable not accessible
16. With regard to the contents of a report (what it contains), managers generally:
feel it is important to approve it
can change it after receiving it
feel it is important that the contents
be current
do not feel it is impor-for them to approve it cannot change it after receiving it do not feel it is important that the contents be current
17. With regard to the frequency of a report (the timing of a report's receipt), managers generally:
approve it before they start
receiving it feel it is important
to be able to change it
do not approve it before they start receiving it
do not feel it is important to be able to change it
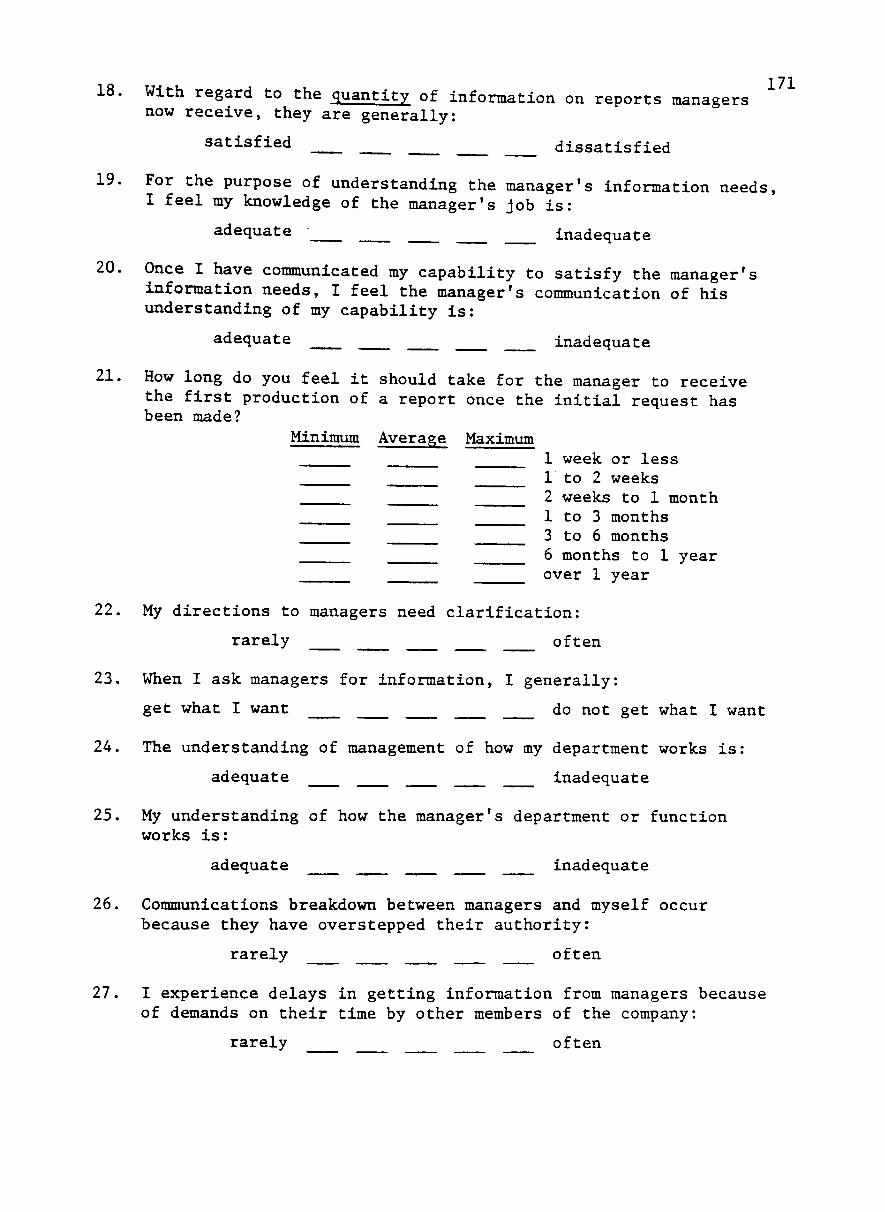
18. With regard to the quantity of information on reports managers now receive, they are generally:
satisfied dissatisfied
19. For the purpose of understanding the manager's information needs, I feel my knowledge of the manager's job is:
adequate inadequate
20. Once I have communicated my capability to satisfy the manager's information needs, I feel the manager's communication of his understanding of my capability is:
adequate inadequate
21. How long do you feel it should take for the manager to receive the first production of a report once the initial request has been made?
Minimum Average Maximum 1 week or less 1 to 2 weeks 2 weeks to 1 month 1 to 3 months 3 to 6 months 6 months to 1 year over 1 year
22. My directions to managers need clarification:
rarely often
23. When I ask managers for information, I generally:
get what I want do not get what I want
24. The understanding of management of how my department works is:
adequate inadequate
25. My understanding of how the manager's department or function works is:
adequate inadequate
26. Communications breakdown between managers and myself occur because they have overstepped their authority:
rarely often
27. I experience delays in getting information from managers because of demands on their time by other members of the company:
rarely often

172
28. Written messages to managers (which include instructions) need clarification:
rarely often
29. Spoken (oral) messages to managers (which include instructions) need clarification:
rarely often
30. When I ask managers for information and I do not get the information, it is because the specifications were unclear:
rarely often
31. When I ask managers for information and I do not get the information, it is because the manager could not provide the information;
rarely often
32. During the development of a system for the managers* use, how often do you have contact with a data administrator or data librarian (an individual or group in your company who is responsible for maintaining, controlling and granting access to data)?
Never rarely often
THANK YOU FOR YOUR HELP. PLEASE INSERT THE QUESTIONNAIRE IN THE ENCLOSED ENVELOPE AND PLACE IT IN THE MAIL AS SOON AS POSSIBLE.

173
MIS RESEARCH QUESTIONNAIRE (MANAGEMENT RESPONDENT)
1. How would you classify your position within your company? (Check one) Top Management Middle Management Operating Management
2. How much organizational status do you feel is attached to your position? (Check the position which most closely represents your feelings.)
A Lot Little
3. How long have you worked for your present employer? (Check one) 5 years or less 15 to 20 years 5 to 10 years over 20 years 10 to 15 years
4. How long have you held your present position? (Check one) 1 year or less 3 to 4 years 1 to 2 years 4 to 5 years 2 to 3 years over 5 years
5. Have you ever had any training in the areas of "computers" or "management information systems?" YES NO
If YES, was the training provided by (Mulitple responses permitted):
Academic training (e.g. college or university) If so, how many classes did you take?
_Training provided by your present employer? If so, how much was: On-the-job training Weeks.
Classroom training Hours. Other (specify)
_Training provided by a previous employer? If so, how much was: On-the-job training Weeks.
Classroom training Hours. Other (specify)
MANY OF THE FOLLOWING QUESTIONS DEAL WITH CONTACT BETWEEN YOU AND THE PERSONNEL IN THE INFORMATION SERVICES DEPARTMENT (ISD). THIS IS THE DEPARTMENT IN YOUR COMPANY CONTAINING THE "COMPUTER SYSTEMS ANALYST" FUNCTION. PLEASE KEEP THIS IN MIND WHILE ANSWERING THE QUESTIONS WHICH FOLLOW.
6. From your perspective, what level within the ISD is the person(s) with whom you work most closely? (Check one)
Top level Middle level Lower level

174
7. How much organizational status do you feel is attached to the position of the ISD personnel with whom you work most closely? (Check the position which most closely represents your feelings.)
A Lot Little
8. How many times did you communicate with ISD personnel (in either a written or oral form) when the main purpose of the contact was t(D determine the feasibility of a particular system to provide you with information? (Feasibility is used to mean an assessment of the need, cost, benefits and impact on existing personnel of a tentative or proposed system.) (Check one in each column.)
Minimum Average Maximum none 1 to 5 times 6 to 10 times 11 to 15 times over 15 times
9. How many times did you communicate when the main purpose of the contact was systems analysis, design and planning? (Analysis, design and planning are used to mean the determination of specific information needs, selecting a procedure to meet those needs and scheduling resources to create the procedure.) (Check one in each column.)
Minimum Average Maximum none 1 to 5 times 6 to 10 times 11 to 15 times over 15 times
10. How many times did you communicate when the main purpose of the contact was system implementation? (Implementation is used to mean the activities such as designing report formats, creating and testing programs and procedures, training necessary personnel and converting to the new system.) (Check one in each column.)
Minimum Average Maximum none
' 1 to 5 times 6 to 10 times 11 to 15 times over 15 times
11. How many times did you communicate when the main purpose of the contact was system modification and maintenance? (Modification is used to mean changes to an existing system which are not part of the original plan or planned changes of a major significance.

11.
13
Continued. Maintenance is used to mean periodic changes to a system on a planned basis, but not of a major significance.) (Check one in each column.)
Minimum Average Maximum
none I to 5 times 6 to 10 times II to 15 times over 15 times
12. I feel that contact with ISD personnel during the feasibility study and system analysis, planning and design is: (Check one position.)
important unimportant
175
I feel that contact with ISD personnel during system implementation and system modification and maintenance is: (Check one position.)
important unimportant
THE QUESTIONS BELOW DEAL WITH YOUR CONTACT WITH ISD PERSONNEL AND THE INFORMATION WHICH YOU RECEIVE FROM YOUR FIRM'S COMPUTERIZED BUSINESS SYSTEM. PLEASE KEEP THIS IN MIND WHILE ANSWERING THE QUESTIONS.
14. During the development of a system for my use, contact with ISD personnel was generally: (Check one position in each category.)
made by me initiated by me
oral by standard forms
or reports time consuming
frustrating costly relative
to benefits
made by others initiated by the ISD written by letters or notes
not time consuming not frustrating inexpensive realtive to benefits
15. When communicating with ISD personnel, I generally prefer:
oral communication standard forms
or reports
16. I generally find ISD personnel:
approachable accessible
use terms I do not understand
written communication letters or notes
unapproachable not accessible use terms I understand

176
17. With regard to the contents of a report (what it contains), I generally:
approve it before I do not approve it before start receiving it I start receiving it
18. With regard to the format of a report (how it looks), I generally:
can change it after cannot change it after I I start receiving it start receiving it
feel satisfied do not feel satisfied with it with it
19. With regard to the frequency of a report (the timing of a report's receipt), I generally:
feel it is important do not feel it is impor-for me to approve it tant for me to approve it feel it is important do not feel it is impor-
for reports to be tant for reports to be delivered on time delivered on time
20. For the purpose of explaining my information needs to the ISD, I feel my knowledge of "computers" and "management information systems" is:
adequate inadequate
21. I feel that the ISD's communication of what they can do to satisfy my information needs is:
adequate inadequate
22. How long do you feel it should take to receive the first production of a report, once the initial request has been made? (Check one in each column.)
Minimum Average Maximum 1 week or less 1 to 2 weeks 2 weeks to 1 month 1 to 3 months 3 to 6 months 6 months to 1 year over 1 year
23. Approximately how many different reports do you receive at least once a year? (Check one.)
5 or less 21 to 25 6 to 10 26 to 30 11 to 15 over 30 16 to 20
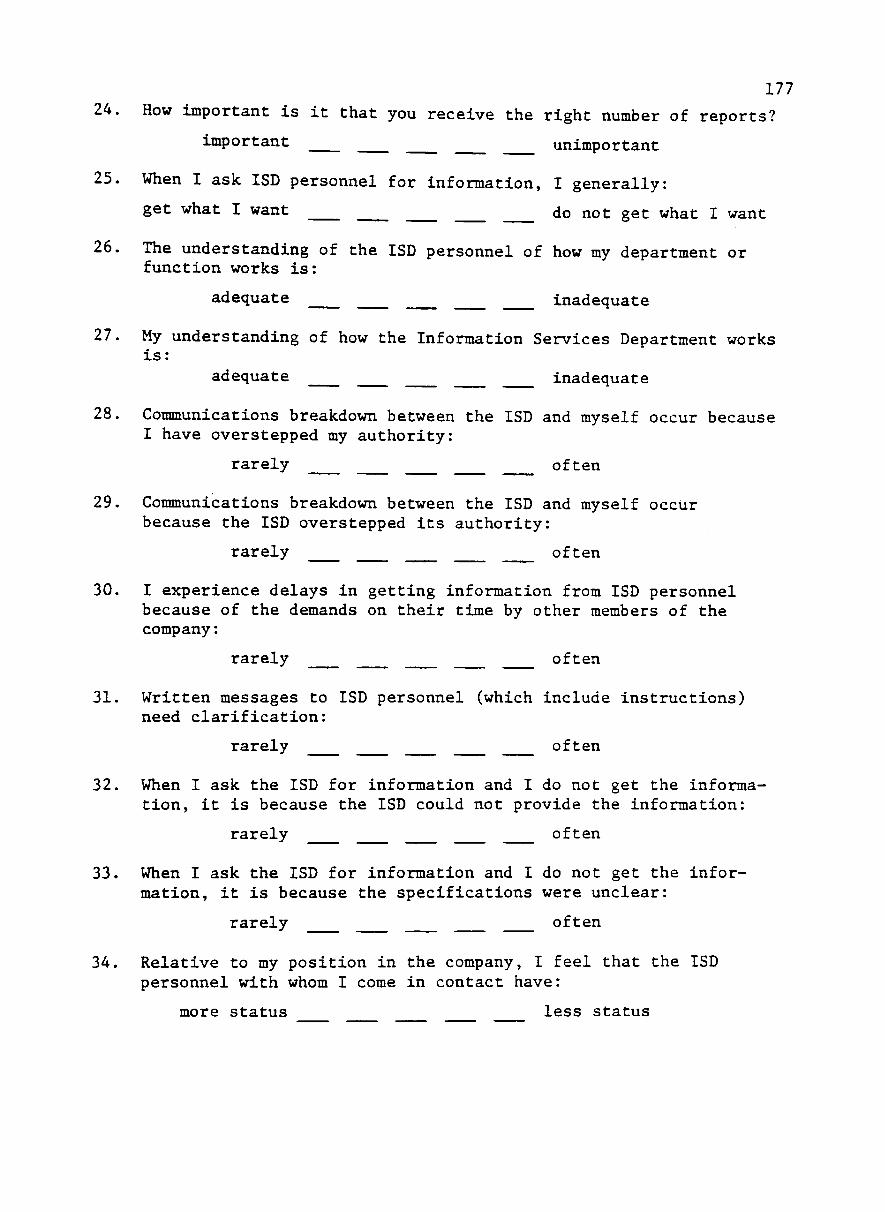
177
24. How important is it that you receive the right number of reports?
important unimportant
25. When I ask ISD personnel for information, I generally:
get what I want do not get what I want
26. The understanding of the ISD personnel of how my department or function works is:
adequate inadequate
27. My understanding of how the Information Services Department works is:
adequate inadequate
28. Communications breakdown between the ISD and myself occur because I have overstepped my authority:
rarely often
29. Communications breakdown between the ISD and myself occur because the ISD overstepped its authority:
rarely often
30. I experience delays in getting information from ISD personnel because of the demands on their time by other members of the company:
rarely often
31. Written messages to ISD personnel (which include instructions) need clarification:
rarely often
32. When I ask the ISD for information and I do not get the information, it is because the ISD could not provide the information:
rarely often
33. When I ask the ISD for information and I do not get the information, it is because the specifications were unclear:
rarely often
34. Relative to my position in the company, I feel that the ISD personnel with whom I come in contact have:
more status less status

178
35. During the development of a system for your use, how often do you have contact with a data administrator or data librarian (an individual or group in your company who is responsible for maintaining, controlling and granting access to data)?
never rarely often
THANK YOU FOR YOUR HELP. PLEASE INSERT THE QUESTIONNAIRE IN THE ENCLOSED ENVELOPE AND PLACE IT IN THE MAIL AS SOON AS POSSIBLE.

APPENDIX G
Computational Procedures for Question Indexes
179

180
Computational Procedures For Question Indexes*
1. Management Satisfaction Index (I ) — Management Data
I^ = •656Q^g^ + .757Q22 + .768Q23 + .570Q^g^ + .628Q2^
2. Management Involvement Index (I-) — Management Data
3. Management Influence Capability Index (I,,) — Management Data
4. Communication Success Index (I,) — Management Data
I^ = -^aSQ^Q + .698Q23
5. Management Satisfaction Index (I^) — ISD Data
6. Management Involvement Index (I2) — ISD Data
h ' -^""iTa - • "''lea
7. Management Influence Capability Index (I^) — ISD Data
I3 = .703Q^^^ + .722Q^g^
8. Communication Success Index (I^) — ISD Data
I^ = •763Q2Q + .815Q^g
* The character "Q" indicates the source to be a question and the subscript indicates the question number (as found in Appendix B). The combination of questions and the question weightings were determined by factor analysis, the results of which are shown in Appendix C, Part I.

APPENDIX H
Index Conversion into Categories
for
Chi Square Test
181

182
Index
Index Conversions Into Categories For Chi Square Tests*
Management Indexes
Meaning
1.
2.
3.
4.
Satisfied
High Pre-involvement
High Post-
Involvement
Successful Communication
Maximum Value
7.070
7.690
7.180
Mid-point Value
19.945 11.662
4.242
4.614
4.308
Minimum Value
3.379
1.414
1.518
1.436
Meaning
Dissatisfied
Low Pre-involvement
Low Post-
Involvement
Unsuccessful Communication
Index
1.
2.
3.
4.
Meaning
Satisfied
Involved
High Influence
Capability
Successful Communication
ISD Indexes
Maximum Value
11.753
7.970
7.125
7.890
Mid-point Value
6.917
4.782
4.275
4.734
Minimum Value
2.081
1.594
1.425
1.578
Meaning
Dissatisfied
Uninvolved
Low Influence
Capability
Unsuccessful Communication
* The maximum value is the maximum computable value based on index computation procedures and scales used. The same is also the case for minimum values.

APPENDIX I
Analysis of Hypotheses
183

184
d QJ
e u u CO 04 QJ
Q QJ O
•H > Ul QJ
cn d o
CO E Ul
o d
d od
•H C«
QJ Ul CO 3 cr CO
• H 4= CJ
d 0
• H 4J CO
r H QJ Ul Ul 0
CJ
d CO
e Ul CO QJ a co]
CO 0 0 r H CO NO 0
<-i 0 CJN m r^ CN
CN r^ r-i m 00 CO
r^ 0 S3- 0 3 ON CO
r^ ^a-vO c:o CX3 r-i
o^ in >3- CO NO < *
NO r*v
m r*» CN CO
• • 1
0 00 r sr 0 r-i
r in m 00 0 0
in r* 0 vO 0 0
0 0 CN 0
r>. <y\ r->
r* \0 0 CO c j 0
<
o
d 0)
S QJ 001 CO
d CO
QJ O d CO o
•H U-l •H C 04
•H CO
QJ Ul CO 3 W CO
• H 4 : CJ
d 0
•H U CO
r H QJ U U 0
0
d CO S u CO QJ Q .
CO
i n rH CO m rH 0
- a- m 0 0 i n r H CN
r - 1-t ON 0 0 r^ sa-
vO r-^
0 0 0 0
vO r<. 0 0 0 0
0 ON CO 0 0 0
CJN CO CN
CN
^ ^ d 0
• H 4.1 a CO
U-l CO
•H J-1 CO
CO
m 0 CV4
XJ d QJ e QJ >
r H 0 > d
M 1 QJ Ul (U
r-i NO P^
^
«« , ^ d 0
•H 4-1 a CO
(w CO
• H i J CO
CO
CO CO 0
4J d QJ a QJ >
r H 0 > d M 1
4_l CO 0 CU
vO vO 0
->«^ d 0
•H 4-1 0 CO
14-1
CO • H 4-1 CO cn
NO NO 0
cce
ss
3 tn
d 0
•H 4J CO 0
•r4 d 3 B e 0 u
0 0
^ i n
r,«
"•.^ 4J
d QJ
6 QJ >
r H 0 > d
M 1 QJ Ul
(Xi
0 ^ s l -
4J d QJ
e QJ >
r H 0 > d
M
1 4-1 CO 0
0 4
0 0 CN S f
r^
" • > « .
4-1 d QJ g Q)
> r H
0 > d
M 1 QJ Ul P
CN 0 CO
cc
es
s
3 en
d 0
• H ,UI CO CJ
• H
d 3 s s 0
CJ
ON 0 0 vO
sr
4J d QJ £ QJ >
r H 0 > d
1—1
1 u CO
0 p-l
CN ON CN
cce
ss
3 CO
c 0
• H 4-1 CO
a •H d 3 e E 0 CJ

185
d QJ
e u U l CO O-l QJ
Q QJ a
•H > Ul QJ
CO d o
• K QJ CJ d CO u
d od
• H C O
QJ Ul CO 3 O" CO
•H 4= CJ
d o •H 4iJ CO
rH QJ Ul Ul
o O
d CO 6 Ul CO QJ a
CO
CO o vO CO
m 00 0 0 VO NO ^
m 00 0 0 r-i vO CM
ON CO 0 0 NO vo sr
r-i CJN 1 ^ vO O r-i
<f I
rH NO in o r- sr
sr r 1-i m fi f-i
CO o s r CJN O CN
CO CN -3- NO O CN
O CO r-i CN
o o
NO O 0 0 CN CM CO
00 o o
r-i
CO o
pa
>^ z <: cu S o CJ
d QJ s QJ 00| CO
d
QJ O d CO o
d ^ 001
•H CO
QJ Ul CO 3 cr CO
•H ^ CJ
d o •H 4J CO
r-i QJ U4 Ul O
CJ
d CO S Ul CO QJ
a CO
CO ON NO CM r*. CO
r-i ON CN O
r*. sr
(JN o in vo r-i •<t
ON 0 0 NO r-i s r r-i
CM CO
sr o
CN I
>> d o
•H 4-1 O CO
UH CO
•H 4-1 CO
CO
4J d QJ
e QJ >
r-i Q > C
M 1 QJ Ul
CU
•" , d o •H 4J
a CO
14-1
CO •H 4-1 CO
CO
4J
d QJ
s QJ >
r-i
o > d
M 1
4J CO O
CU
"~ d o •H 4J O CO
<4H CO
•H 4J CO
CO
CO CO QJ CJ O 3
CO
3
o •H 4J CO o
•H
d 3 E S o u
* 4J d QJ E QJ >
rH
o > d
M 1 QJ U CU
4J
d QJ
E QJ
> rH
o > d
M 1
4-1 CO
o !U
CJN O NO NO >3- CN
O CO o sr O r-i
NO m r-i r*
o o
IS. CN m CO 00 o
m r-i O r>. m CO
vO o 00 <T NO m
i n
o m
NO
o r 4
4H d QJ E QJ >
r-i
o > a M 1 QJ Ul
CU
CO CO QJ o o 3
CO
d 0
•H 4-1 CO a
•H d 3 E E 0
CJ
4-1 d Q) E QJ >
r-i
o > d
M 1
4J CO
o cu
CO CO QJ CJ a 3
CO
d o •H U CO o
•H d 3 £ E o u
QJ 3
r-i CO >
CO 4 = a
rH 03
Ul
o
T3 QJ 4-1
3 4-1
CO 43 3 CO
4J CO QJ 4.4
U O CO X QJ
CO
U l QJ
4 = CO
•r.

186
d QJ
s 4-t Ul CO
o. QJ O QJ O
•H > U l QJ
CO
•K QJ a d CO
o
d 00
• H CO
d o
• H 4-1 CO
r - l QJ U l
CO E U l
o c
QJ U l CO 3 C l Ul CO I
• H 4 = CJ
o u d CO E U l CO QJ
a. CO
ON O NO CJN r>» CN
oo r CO NO CO O
r-i ON CO s r CN O
m \o 00 CN
m 00 s r CN m r-i
m NO sr m O rH
ON m CN O o -a-
O N CO o sr vO - ^
PS vO CN r ^ CN r-l
i n CO 00 r-i r^ CO
I I I
CN r^ CJN O O O
NO <a-CO r-l vO vO
CO I
CJ
QJ
O CJ
CO ?
CO 4 = a CO
Ul
o
T3 0)
CO 43 3 S
d
d S O QJ
• H > 4-1 rH CJ O CO >
<^-i c CO M
• H - I U QJ CO U l
CO P H
4-1 d QJ -^ e
d QJ c >
T 4 r-i 4J O O > CO d
<4-i I - * . CO I
• H 4-1 4-1 CO CO O
CO cu
CO CO QJ U O 3
CO
-s^ d d o O - H
• H 4-1 4-1 CO O CJ CO - H -
(4-1 d CO 3
CD C CO CJ
4-1 d d QJ QJ a E QJ QJ > > rH
r-' O O > >• d d »H
M I. P A-
QJ CO !H O
(U CU
CO CO QJ CJ CJ
^ ^ 3 U CO d QJ E QJ >
r-4
o
d o
(J •H d 3
I QJ E M O
CU CJ
CO CO QJ
u ~^^ CJ 4-1 3 d CO QJ
E d QJ O > -rt
r-l 4-1 0 CD > CJ d "TH
M C 1 3
4-1 E CO E O c
j3 U
CO QJ
4-1 C CO
QJ
CO
U l QJ
4 = CO

APPENDIX J
Analysis of Variables in the Management
Perceived Communication Success Model
187

i c N N O c j N i n c M O s r o m v o o N C O v O « a • C M C O O N N O , H r H C ^ • ^ C O s r C M ^ a - C M r H C O r H r H C M r H
188 OOONCMcooNincM>a-aocNON O O N O N C O m C N ^ a - O C J N O N O N O O C O r H CvJOO C O O O C M C O C O s r c O r ^ O r H O r^ r-i
d QJ £ QJ 00 CO d CO
3 (4-1
CO CO QJ u o 3
CO
^
N
r H c o c o c N r ^ m - ^ i n o o m r s . Q O C N J Q O i n c j N C O C J N C N r H > a - r ^ O O r H O r H C M O C O C O r H C N
I 1 1 I
v o v o N O N O v O N O i n v o > a - v O N O
N O r H N O v o o m c o m c N i n i ^ o I ^ C O O O r H C O O r ^ C O i n O N C N O s r s r C M r H r H O O C N C O C N i n
I I I I I I I I I I I
N O N O N O N O N O N O N O V O V O S O V O N O
CN vO r-i CO CO CM
• • I
m m
o S S S S S 2 2 2 2 o o o o o o o o o o o o o o OCMC3C3 o o o o o o c M c N r H i n o o o m m o o o o o ' ^ ' ^ ' - J ' - J ' " I ' t ' ^ ' " ^ ' " ' ' " ' O O O O r H r H r H O O r H r H r H r H r H
^ ^ 2 l 2 ' 5 ^ ! : : : ' ~ ' ' ~ ' " * " * O N O c o c o - a - o o ^ a - r s o c N O s r r ^ - ^ rHoocomcNOcMrs- rHvo o o s r m o o o c N i n v o s r m o r-irH
* ^ ' - l C N C N C M r H r H r i r H r H r H
m m m i n m m i n m m m psONOao>a-ONONcoocMvn r^voo^a-rnmoN^a-cMvoooNO oor>. i n c o c o i n » n i n i n i n > a - N O i n cMCMCNco>a-srcocococo,.3-in m m
Ul d QJ QJ
•T3 d d o QJ a
CO £ o
CJ
QJ 00 CO CO CO QJ S
4.4 d QJ d o Q. £ o
CJ
r^ d 0) 0) c d d o CO D.
4= £ U O
CJ
< (U
o CJ
d QJ E QJ 00 CO d CO S
^ r H C N r s r H m i - » . r H O - * r H r H O N O c N O v o c o N o m > a - o t H r H O C N O C N C M r H C N ^ O
O O O C O N O C O v O x a - r H r o O N r H C M O N O v O O O O O s r O O C M C M r H C O r H O C O C O > a - o c o o o o o o o o o o O C N
c N O c N m v o o o m m o o o m v O C J N O N O C O O N C M C O r H r H r H r H r H O m O O r H O O r ^
O r ^ N O O O C N N O - « 3 - ^ O c o o o O N ^ r - t r ^ C O r H O r H s r m v O C M O O s r v o r * . O r H O C N C O C O C M C N C N C M C N C O r H O
I I
m s r m s r m s r c o ^ s ' O N s r m NO NO NO VO NO NO NO NO m NO NO
I I I I I I I I I I I
C O C O C O C O C O C O C O C O C O C M C N C N N O N O N O N O N O V O N O N O N O V O N O N O
I
-3- rs vO m
CO CO QJ o o 3
C O
CO CO QJ
N
oorHsrsroo->a-r^NO>a-cocN r H O O C O r H V O s r i ^ O O O m O O O o o r H r ^ - c o o N c o m o N
>J- < • CM O O O r ^ c o m r H - , a - r ^ v j 3 o o o o O O O O O O N r H r ^ r ^ r H O O < - r H m m O O O r H C O O C N r H r H O O r H — l O
00 CO
CN
m
o a\ CO 00
CO CN
m
r^ CN
m
CJN m r-i
O CO
m ON
m
sr O
r»» 00
m
r-NO
NO O
m
m m CO
m
m m CO
m
o rH
CO
m
CJN CN
r-i
sr o r^
m
CO r*. r-i
m
o r-i
r-i
ON m r^
r-i NO
r-i
m r*> CM
CO ON
r-i
m
ON m r-i
<f -3-
r-i
r^ CJN
r-i
r ^ m > a - c j N m o N o o N O c N N O o o O r » » c o O N O O N r H O N m v o c o N O s r m o o N o r » r ^ r ^ N O P ^ o o
C O C O C O C N r H O O s T r H O O C M C N N O m C O O r ^ C N r H ^ > ^ U O V O V O N O N O N O N O
CN ON >a-
C3N vO m
NO r—* NO
CO r>« NO
r-i
m m
M I-] 03 < oe: < >
cu CO U cu Q O H H W
S C J C t < < ; M r H C N C O r H C N C O r H C N C O r H C N C O O ^
M O c o o s fapufoMMMSSS<:-<<: co CUCUM C J C J C J C J U C J C J C J C J C J C J C J

189
4J
d QJ E QJ OC CO d CO S
3 U - l CO CO QJ CJ CJ
3 CO Csl
CM O rs, r-i CO -a-
00 CM 00 NO O O
NO NO r-i rH
o o o o r-i r-i
NO r-i
r-i •<r r-i r-*
.057
-.
410
NO fH
.100
m m
GO
T*
.338
NO r-i
GO
T*
CO
«a-r-i
.150
.2
76
NO r-i
CJN r-i
.484
.0
11
NO r-i
GO
T-
o 00
r-i .0
71
.384
m r-i
GO
T-
o rH
.098
.3
42
vO r-i
GO
T-
m CO
r-i
.236
.1
94
VO r-i
GO
T*
rH 00
.433
-.
04
6
m r-i
GO
T*
CO
m
.284
.1
54
m r^
GO
T*
sr o
r-i
.117
-.
316
vO r-i
GO
T-
m sr
.331
-.1
19
NO r-i
GO
T*
o CN
.253
-.
179
1
NO r-i
GO
T-
CO
o
.400
-.
06
9
1
NO r-i
GO
T*
CO CM
r-i
.234
.1
95
vO r^
.100
NO
.448
m CO
o I
vO rH
,100
CN CO
m m m m m m NO CN m CM rH NO 00 s r s r m >a- NO CO m
N O v O C N m r ^ r H C O > 3 -» a - m m « a - m N O N O s r
CO ON
m m
Ul d QJ QJ 4-1 d r-i O •H O. EE4 £
O CJ
Ul -Ul QJ d > QJ •H d QJ O u a QJ £ ca o
CJ
^ 4J O d CO QJ 43 d
-o O QJ O. QJ £ (X4 O
CJ
TJ QJ 3
d
d o o
•y 4J
d QJ £ QJ 00 CO d CO X .
CO CO QJ
o a 3
C O CO CO QJ
r J
Cs]
\ o >a- vo ON ON m CN O Ps rH < - ON rH ON CO CO o CO >T o s r
O N c o « * s r r » . s r r H s r srco m o N O O O m o m rHNO C M r H O O O r H O r H OCO
s r -H NO ON o 00 CO NO « * NO >3- O NO O O O CM O O CN O
C M O N r H v O C O O N r > , 0 0 c o s r C O O C O C N O C M C N C M P » « a -O r H C O C O C O r H m r H C M O
I
CM CN CO CO m CO CM vO NO NO NO NO NO NO
00 O
O r O ON ON O ON 00 CM CO -^ a- o sr CN o sr P-* r o m
I I I I
m s r c o c o m s r m m V O N O N O N O N O V O N O V O
r * » c o o o o m c o o o s r r ^ m O N O v o m o c o r-i-^CnOSr-^r-iOir-i
CO m CO sr o sr CM ON ON CO 00 rH o a-vo m f r^ 00 r^
sr CO NO NO
CN CN m CO CO CO
no o r-i
CM o CN
m
ON r
m
CM CO
m
CM CO
NO ON
CO
CM O NO
m CO
r-i
m r>»
m
CO O r-i
NO O
ON CO
r-i
CO
sr rH
m
NO CN
r-i
o m r-i
CO CJN
CO ON
m r > . s r r H c o O o o m o cMsr C M m r H r H O N r » » O C 0 C O r H f^r»»p-»cONONOr^NO r^p^
d CO O. E O CJ
PQ < M oi < >
3 O (iu CJ < 2 CO 3 H ca 3
O CO
u u CJ cu CJ p <: cu en cu CJ z Q
O ^ <J 3 H
M CU 3 Z O CJ

v o m m m c N m N O I C M C O S T c o m o o c o i ^ m c o i P S ^ C N r H C N C O C O r H C M r H I r H C O r H
190 m c N s r m o o m o m m c N » r COCN c o o o r * . m o o m o m o o o o r > . srr«» C O C O C N C M m m C M m C N C O C O C M C O - . I
d QJ £ QJ OO CO d «3 :
CN m rH rH sr m CN rH ON 00 00 >a' ON rH NO CO rH rH m CO NO
I »a- o CN I ^a- m rH I m CN NO
rH NO CO m o o m 00 00 NO <JN O O ON rH rH CO CO O O CO
o m rH vo CO o sr O ON 00 00 vo m ^ O CO rH rH CO CM m
I I I I I
m m m m m m m m m m m
I I
m m m m m m m m m m m m
I I
m CO
CO CO OJ CJ CJ 3
CO
•i
N
o o o o u-l in
. ' ~ ! ' ^ ' ~ I ' ^ ' ~ ! ' ^ ' ^ ' ^ ' ~ ' ® r ^ r - i r ^ r ^ r - i r - i r ^ r - i r - i r - i r ^ r - i O r-i
' ^ ! ! ^ 2 ° S * ^ " ^ ° ° ' * ' ~ * ^ ' * ~ O O r H O O C O ^ O r s - O N O N N T r H N O m c O - , T r - I C O N O m O O C O O N r H r > . O N N O O > a ' C N O N O C O m O r H v O C O O C M
r-i r-i r-i r-i r-i ,-i ^ ,-i ^ ^ C N r H
m m m m m m m m m m P ^ C O O O m N O O O r H r s v O v O r * . C O r H O N O C M C M m > a - P * r H s r C N P>!vO
PQ
Ul d QJ QJ
T3 d d o QJ Ou
CO £ O
U
4J 01 d 00 QJ (0 d CO o CO Q. QJ £
S O CJ
u rH d
QJ QJ d d d o CO O .
. d E CJ o
CJ
o CJ
-^
c QJ E 0) OC CO d CO s ;
o \ o o N O P > . > a - m o o s r s r c o r H f ^ m m p ^ o o o N c o N o o o o o c o c o O o o o s r c o o o c M O
r « . s r c N o o c j \ m p > . o o c o o o o N m O v o c M r ^ c o s r c M O r H v o m r H c N c o s r O c o s r c M > a - c o s r c o r H r H s r c N C N o o
o c o N o c N m s r m v o m s r r H O r H C O O C N O C O N O C N v O O r H r H m r H s r O r H s r « * C N C J N
^ r H m c N c o o o c o s r c o r ^ r ^ r H s r c N s r c M o o - ^ > 3 - r s . m o c N v o c o c o CMCJN r H O r H O r H O r H C O C O O C N C N m N O
I I I I
C N C N C M C M C N C M C M C M C N C M C M r-ir-ir-ir-ir-ir-ir-ir-ir-ir-^r-i
I I I I
C N C M C N C N C M C M C M C N C M C M C N C N CN O
3 I4H CO 0] QJ O CJ 3
C O
CO CO QJ
-i
CNJ
O O O O CM O rH CM O r-i r-i r-i r-i <D Q
O O O m CN m
r - i r - i r - i , - ^ r H r - i r - i r - i r - i O O O
ON r-i
CN
00 -a-r-i
r^ CO
m
00 'O-
r-^ r-i
r-i
CN P^
CM
ON CO
CN
vO P».
r-i
m
m CO
r-i
m
vO CN
r-i
00 m r-i
m
p^ m fH
m
ON
m •
m
r-i CO
r-i
r-i 00
NO O r-i
m
CO 00 CO CO
r-i
CN
o
m
oo o
m
r-i ON
r-i
m
CM r-i
CM
m
r-i ON
r-i
m
r^ ON m NO
r-i
CN CJN
CN ON rH rH CN . * CN
CO m OO o PS CO ON rH
-a- r*. CN O
C O C M C M N O C O C O O N O N P ^ C O r ^ > ^ O O r H C N r H r H C O s r - ^ C J N O O C J N
ON s r CO 00
b3 r J 03
<
>
C U C O W C U O S S C J | i 4 < ; M r H C M C O r H C M C O r H C M C O r H C N C O 0 & : * o H H w g M o c o o s fa;x<feMMMSss<:<:<j co
C U C U M C J C J C J C J C J C J C J C J C J C J C J C J
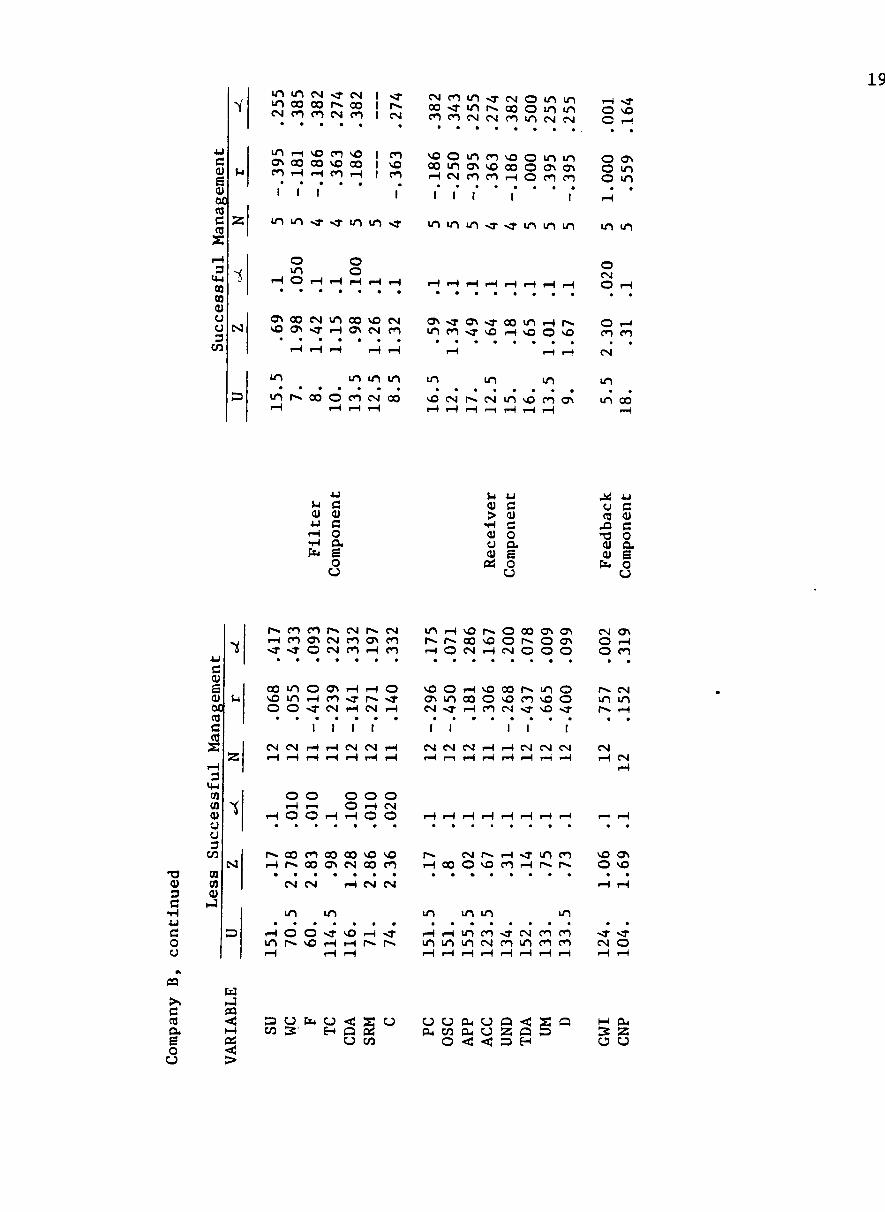
m m CN «a- CN i >3-V m 00 00 r^ CO I ps
CM CO CO CM CO I CN
19 cMcomsrcNOmm o o s r m i s . a o o m m C O C O C N C N C O m C M C N
O vO O r-i
d QJ £ QJ 00 CO d ; CO
m rH NO CO NO I CO ON 00 00 NO 00 I NO CO rH rH CO rH I CO
• . . . . . I l l I
m m sr sr m m >a-
N O O m c o v o o m m o o m o N v o o o o o N O N rHCMCOCOrHOcOCO
I I I
O ON o m o m
I i H
m m m > a " < - m m m m m
3 (4-1 09 CO QJ CJ CJ 3
CO
i
N
o m
r-i O
o o o
CM O r-i
ON 00 CM m 00 NO CN NO ON sr rH ON CM CO
O N % T O N » a - o o m r H p s m r O s T N O r H v O O v O
O rH CO CO
CM
m m m m m p* 00 o CO CN 00
m m m m vocNp^cNmvocooN moo
Ul d QJ QJ *J d r-i O •H Q. 1 £
O CJ
Ul 4-1 QJ d > QJ
•H d QJ O U O. OJ £ Pi o
CJ
^ u o d CO QJ
43 d TJ O QJ a QJ £
EK O CJ
d QJ £ QJ OO CO d CO S
P^ CO CO r^ CN Ps CM rH CO ON CM CO ON CO sr -"a- o CN CO rH CO
m r H N O p s O O O C J N O N CNON r ^ P - O O N O O P ^ O C J N O r H r H O C N r H C M O O O O C O
00 m O ON rH rH O NO m rH CO ps sr O O <- CM rH CN rH
N O O r H N O 0 0 P » » m O PsCN O N m c o o v O f O N O o m m C M ^ r H C O C M s r v O s r r » r H
I I I r CM CN rH rH CM CN rH
I I I I I
C N C N C M r H r H C M C N C N CN CN
TJ QJ 3
d •H U d o CJ
CO CO QJ O a 3
CO
00 CO QJ
M
O O O O O r-i r-i O rH CM
rH O O rH rH O O
P^ r-i
00 P-
CN
m
CO 00
CN
00 ON
m
00 CM
r-i
NO 00
CN
NO CO
CN
r^ r-i
m
CO CM O
m
i ^ NO
m
r-i CO
>a-r-i
m p-»
CO P-N
m
NO O r-i
CJN NO
rH
rH O O - ^ NO rH St-m r^ NO rH rH (^ r-»
r H r H m c O s r C N C O C O
mmmcNcomcoco sr sr CN o
03
d CO
£ o CJ
Ed i-J 03 <: M Pi < >
3 CJ I* CJ <tj 2 CO 3" EH Q 2
CJ CO
CJ CJ o cu CJ ca <j cu CO cu a 2 ca
o <; <: o H
M CU 3 2 CJ CJ

APPENDIX K
Analysis of Variables in the ISD
Perceived Communication Success Model
192
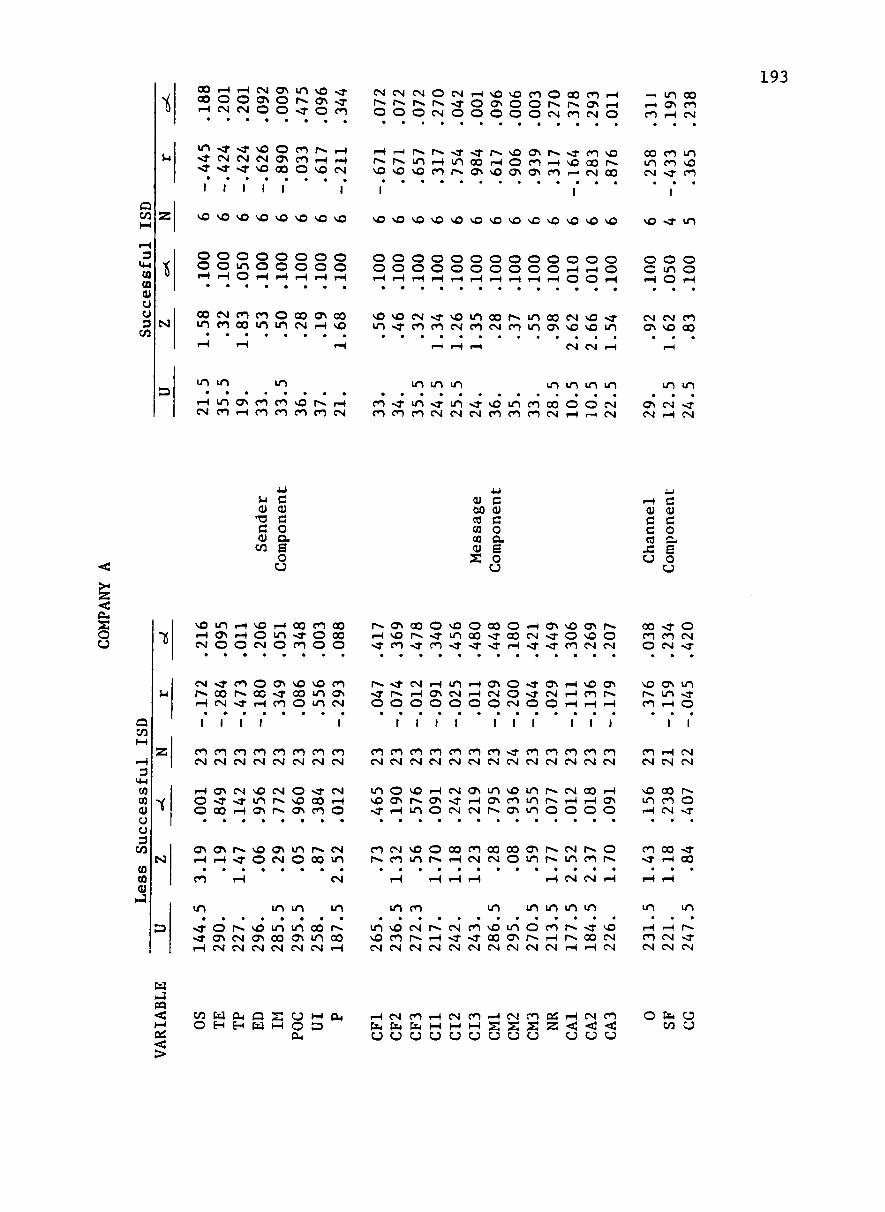
i 0 0 r H r H C N O N m N O > a -o o o o o N O p ^ < j N > a -r H C M C N O O s r O c O
C N C M C M O C M r H N O v O C O O O O C O r H ' ^ m C O p ^ r ^ r s . r > . « a - O O N O O r ^ p ^ < J N r H r H O N c o O O O C M O O O O O C M C O C N O COrHCM
193
a CO
m » ^ s r N O O c o p » . r H »a -CNCNCMCJNCOrHrH • " ^ • • ^ • ^ N O O O O N O C N
r H r H p ^ r ^ > 3 - ^ r * . v o o N p ^ » a - c o N O o o c o m i ^ r ^ m r H m o o r H O c o r H N O o o p - m c o v o N O N O N O C O f » » O N v O O N O N C O r - i C N O O CM%a-CO
I I I I I I
V O N O V O V O N O N O N O V O
I I I
N O N O N O V O V O V O V O V O V C N O N O N O N O N O ' . ^ m
CO CO OJ CJ CJ 3
CO tsi
O O O O O O O O o o m o o o o o r-ir-iOr-tr-ir-ir-ir-^
o o o o o o o o o o o o o o o o O O O O O O O O O O r H r H O O m O
r-i r-i ,-i r-i Q G r^ r H O
00
u\ CN CO
CO 00
CO
m O
m CO CM
ON r-i
00 NO
NO
m NO sr
CN CO
sr CO
NO CM
m CO
00 CN
rs CO
m m
00 ON
CN NO
NO vO
-T m
CN ON
CN NO
CO 00
CM CN rH
m m m m m m m m m m m m r H m O N C O C O v O P ^ r H C N C O r H C O C O C O C O C N
c o - . a - m s r m > j - N o m c o o o o o c N C O C O C O C N C N C N C O C O C O C M r H r - i C M
ON CN <• CM rH CM
U U G QJ QJ T3 d d O QJ a CO £
o CJ
QJ 00 CO CO CO QJ
s
d QJ d o a £ O
o
r^ d QJ QJ d d d o CO o-4= £ CJ o
CJ
o CJ
NO m rH rH CJN rH CN O O
vO rH CO CO 00 o m sr o 00 CM O CO O O
P - O N C O O N O O C O O r H C J N v O O N r * . o o s r O r H N o r ^ s r m o o > a - c o c M ^ O N O o C O C O C M > a - c o s r c o - , a - > a - s r r H > a - » 3 - c o c N c N o c N s r
ca CO
r-i 3
14H CO CO QJ
o CJ 3
CO CO CO
<u
N
C M « a - C O O O N N O N O C O fs .oop*oosroomoN r H C M - a - r H C O O m C M
P ^ S t C N r H m r H O N O s r O N r H N O O N N O O N m • « a - r ^ r H C j N C M r H C N O > a - C M r H C O P ^ P ^ m s T O O O O O O O C N O O r H r H r H C O r H O
I I I I I I I I I I I I I I
CO CO CO CO CO CO CO CO C N C N C N C M C M C N C N C M
rH ON CN NO CM O sr o sr m p>. NO 00 O CO rH ON P«. ON CO
CN
CO CO CO CO CO CO CO ^ CO CO CO CO CO C M C M C M C N C M C M C M C N C N C N C N C N C M
m O v O r H C M O N m N O m r ^ C N C O r H N O O N f ^ O N s T r H C J N C O m r ^ r H r H O N • ^ r H m O C M C M P ^ O N m O O O O
O N O N P > « N O O N m P ^ C N r H r H s r O C N O O O m
c o c M N O O c o c o o o o o o N r ^ c M p ^ o p « . c o m r ^ r H c N C N O m r * m c o p ^
CO
m m m
CM
m m CO m
rH CM CN rH
m m m m
> a - o p - « N o m m o o ( ^ s r o N C N C j N o o c j ^ m o o r H C M C M C N C M C M C M r H
I I
CO CN
NO
m r-i
CO
-a-
r-i CN
00 CO CN
00 r-i
CN CM
r o sr
sr 00
m m m N O C M P > . C N C O N O m O c O P > . - , 3 - N O r H r H P » N O C O t ^ r H ^ a - ^ O O O N r ^ r H P ^ O O C N COCM^a* C M C M C N C N C N C N C N C N C M C N r H r H C M C N C M C N
u rJ 03 < M pa >
C O W C U C a S C J M C U r H C N C O r H C M C O r H C N C O O ^ r H C M C O O f a O 0HEHpdHH03 faii.iJuMMMSss2<:<:<: cocj cu c j c j c j c j a o c j c j c j O C J C J

CO
CO CO QJ u u 3
CO CSl
194 C O C O O O ' ^ m O N N O r H r H O N O N o o o N m o N ^ a -CO CM rH rH rH CO O s r
> a - C O O N C N C O r H r > . 0 m o o c N m c o o N r - t o o <NCMsrsj->a-rHNOO
.124
559
.237
367
.009
885
.072
671
CJN a\ rs 00 r-i CO
r-l < -NO NO
>a- r^
.416
112
.007
900
I
N O N O V O N O N O V O V O N O
O O O O O O O O O O O O O O O O
I I I I
NO vO NO NO NO NO NO
O O O o o o o o o o o o o o
-*srsr«a-ONONsro\ r H r H P > . r * . r H O N O O
O rH CM sr sr CO CO CN ON r^ rH CO 00 CO
m m m m m r * r » r H r H r ^ o o o o o o C O C O C O C O C O C M C O C O
p^ ON sr r^ NO o m CO CM CM CO CO CO CO
vO vO
o o o o
r-i 00 CO «*
vo sr CO CO
Ul d QJ QJ 4J d r-i O •H ca. Pu £
o CJ
Ul -U QJ d > QJ
•H d QJ O U O. QJ E
|3j O CJ
^ 4J
a d CO QJ ja d T3 o QJ c Q» E
C=4 O CJ
"X
T3 QJ 3 d
•H 4J
d o o
M
<:
>% d CO CU E o CJ
o CO »-* r H 3
14-1
CO CO QJ O O 3
CO
CO CO QJ
rJ
Ul
2
1$
CN]
D
1 U HJ 03 <: M Od < >
C N r H O C j N C O P ^ C O s r COCM s r p » m o N m N o m r H o o r H s r O O O r H r H C N s r O C O
rH CJN CO rH r>. rH 00 O CO O iH CO CN rH O rH O CO O O rH
C M N O r H C O C O r H N O O O c o r H m r ^ r ^ r H ^ > a -O C O C O C M C N C M r H O
O N o o O N O > a - c j N O O N c o C J N O O O C O O N O O O C N m C M r H N O C M » a - r H C O - J - C N
I I
CO CN CO CO CO CO CO CO C M C N C N C M C M C N C N C N
O O O O O N O N r H r H r H O O m c O r H r ^ O O r « . r H C O v O C N C O ^ - ^ O N » a -
c o c o c o c o c o c o c o c o c o C M C N C M C N C M C N C M CMCN
ONONoooNr>.ooo sroo r H O C M O O O O N O O > a - r H O O O N C O r H N O C O ONCO
C M 0 0 C O 0 0 < " s r > a - r H
O N s r c N o o o o o o o c o >a- CM ON m CM sr CM CO NO o rH CO sr o
m m m
CN CM
m m m m m < - o p * o o c o r * o m N O > a - m m m o N v o C M C N C M C N C M C M C N C M
3 C J C J C J C t 4 0 < ! C J CO ca 3 o H ca
CJ
P^ CO O CN
m
m m m c N c N r » » O N m o o O N P > . O N O N s r r ^ s r ONOO r H r H C M C N C N C M C N CNCN
o c j c u c j < : s c a MCU C U C O C U C J O S 3 2
O <J <J H O CJ

N O O N \ o « a - o o c o - , T m m c M m m f > . c N r H o o C N C M s r r H O C M O O
C M C N r H C O C O N O P ^ O N v O v O O N m r H O O C N s r O N p o r - l C O O N O O O O O o o o o o c M O O r H s r o o o
195 o NO sr O O CM CM O O
ca CO
^ C O P ^ ^ a - r H v O r H O O P s O s T r H m r H v O C O c N r o o s T m c o p « . m
> T > r C O r H r H O N > y v O C N m ^ ' . T m r ^ r ^ c N « a - c N s r « a - m m r H O N c o o N c o c o r » , v o m c N r * N O c o o r ^ o o c o
vO rH O >3- CN r-l CO 0 0 r»»
I I I
o o Q O o o c o p ^ c o c o c o
I I I I I I I I I I I I I
0 0 0 0 0 0 0 0 0 0 0 0 0 0 0 0 0 0 0 0 0 0 0 0 0 0 00 m CO
3 U4 01 CO QJ U
a 3
CO
CN]
O O O O O O O O O O O O O O O O O O O O O O O O O O O O O o o o
o o m o o o o o o o o o o cNmo r-ir-i<Or-ir-ir-ir-ir-ir-ir^r-ir-ir-i O O r J
Ov
sr ON r-i
m m
Ps O
m CN
ON r-i
r^ r^
NO m
<• r-i
CO ^
CM 00
CO CJN
NO VO
CJN NO
-a-m
m ON
O r-i
m ON
o CN
CJN m
o CO
o CN
o ON
CJN r-i
CN r H r H
m m m m m m m m m m m < j N « a - r H C N p - . c o m s r > * > a - m - * c o s r > a -
P - » C O O O C J N O C J N m O N f ^ O N v O r H r H C O C O C N C O C O C N - s 3 - C O C O C O C O C O v 3 -
CO ^ v o CM r H CO
U4 d QJ 01
T3 d d o QJ O .
CO E o o
QJ 00 CO CO en QJ
s
d QJ d o O. E o CJ
r-i C QJ QJ d d d o CO cu
4= £ CJ o
CJ 03
O CJ
a CO
C O r H O v O s r N O C O r H O C N p s O N O N r H O O P -C N C O C M r H ^ a - r H O r H
m c j N i ^ c o o o N v O r H O N m r H r - i c M r » s r r ^ r » c o c N > 3 - o o p ^ v O r H N O N O s r s r O N C O C O M O O O C N r H r H s r s r - 4 - C O O O O C O r - i r - i
O N C O c o r ^ m c o s r r * * p x m o c o o o N p ^ r H C N r H C M C N O C O m C O
I
CO CO CO CO rH CO CO CO
^ C N « a - m r s p * O N p . . r ^ o o r > » r » » c o .^ ,-{ ^-i v O m O N C O O O C M P ^ C N r H s r - a - C O « 3 - O O N ^ m m c N c o c o o o O r H m m > a - r - i c o c o
I* r r I* r r r r r r i* \' i * * r CO CO CO CO CO CO CO CO CO CN CO CO C^ CN ON CO
CO CO QJ o u 3
CO
CO CO QJ rJ
Cv]
O O O O O O O O O O O O O O O O
O O O O O O O O O O O O O
o o o o o o o o o o o o o O O O CM O O <Z> r-i r-i
ON CO CO CO CN CO «a" f ^
vo CO m 00 o m
m c o v o < j N c o r H m o m r - i o - * p > . ^ ^ C N O O O C N O O N N O C N O r H v O
P^ -* CN 00 CN rH
m m m m m m m m m m m m p^ vo m »^ o CN NO CN CM m >a- sr sr vo
CO sr
s r r H r ^ v O N O C N m o o o o o c j N s r o o m v O N O N O \ o v o c o s r « ^ ' H v o v o s r
ov vo m ON 00 v£3
Cd
PQ
< M
CO w (u ca s CJ M
O H H W M O 3 cu
rHCNCOrHCNCOrHCMCOOi rHCNCO Q i - O fa[i,faMMMSSS2<<:< COCJ C J C J C J C J C J C J C J C J U C J O C J

a CO
3 <4-l CO CO QJ CJ
a 3
CO
i
>1
v O r H C O r H C O r H m O O < * r H C M 0 0 0 0 C O m r ^ C O O « a - C M r H > a - « a ' r H
196
a O O N C M C O « ^ - « T O O O O v o r * , . o o » a - N O p > » > a - r > » r H P « . O e N C O O O C O
.196
352
.240
294
.200
346
.017
744
1 1 1
1 1 1
.381
129
.014
759
NO
sr
041
.500
000
I I I
oooooooopsoooor»«
O O O O O O O O O O O O O O O O
ooooooi^oooooo coco
o o o o o o o oo o o o o o o o oo
00 ON
CN CO
^ sr
CM CN o CO
sr CO
a\ r-^
CN sr
r-i
o CM m
r r-i
CM >a-
co sr o o
^ CO
-a-CN
ps CM
m m m m m m ONmcoNOcMrs.ONO c o c o c o c o « ^ > y ^ - ^
CJN m o O o CO »a- m sr -a- CM
m ps «3-
CJN 00
sr sr
u u d QJ QJ •u d r-i O •H Ou b £
O CJ
Ul 4J QJ d > OJ •H d QJ 0 U Cu QJ £ oi o
CJ
rii -U o d CO QJ 43 d T3 O QJ a. QJ £ CZ4 O
CJ
« "T3 QJ 3 d
ntl
o CJ
PQ"
>» d CO a £ o CJ
ca CO )-l
r-i 3 vw CO CO
Succe
CO en QJ rJ
H
u
2
If
>a
3
Cd I-] PQ < M Oi < >
CO ^ CO
00 CO r-i
I
CO r-i
o o rH
CO
o
00 NO r-i
3 CO
o NO
o
r«. ON >a-
CN r-i
O O r-i
r-^ r
m CO r-i
o a
ON r-i
o
p«. CN NO
CO r^
o o r-i
<T m rH
m CJN r-i r-i
CJ 3
NO ON CO
rH ON
o I
CO r-i
o o r-i
CN o
m 00 NO r-i
CJ o
NO m >a-
oo CO
o I
r-i r-i
o o r-i
m <a-r-i
r-i
o rH
b
NO NO >3-
o CO
o
CN r-i
o o r-i
r-i sr
m CO >3-rH
CJ H
m m o
00
o m 1
CO r-i
o o r-i
a\ CN
r-i
00 CM r-i
< Q CJ
NO CO CN
CN c r-i
1
rH r-i
o o r-i
CM NO
m CN rH
CJ
o CO
o
sr 00 m
CO rH
o o r-i
00 sr
m -J-m r-i
CJ cu
NO
o CM
NO p-CN
1
CO r-i
o o rH
m r-i
r-i
CN CO r-i
O CO o
sr CM -^
vO NO
o 1
CO r-i
o o r-i
m NO
m en >a-rH
CU cu <
CO p«. CM
o o CM 1
r-i r-i
o o r-i
o r-i
r-i
m r-i r-i r^
CJ O <
CM PN. CM
m o CM
CO r-i
o o rH
r-i P^
m rH m r^
< o H
CM m CO
O CO r-i
CO r-i
o o r-i
00 CM
r-i
m r* CN r-i
Jg 5
CN r-i CN
CJN NO CM
CO rH
o o r-i
NO CJN
m IS. CO r^
ca
CO sr >a-
ON sr o
CO r-i
o o r^
Pv -*
^ m r-i
M 3 CJ
vO O CO
CO r* r-i
CO r^
o o r-i
o sr
vO m r-i
(U 2 CJ

I rH rH NO rH O I O I rH rH r«>. rH O I O I CN CM CN CN m I m
197 r H O O N O O C M O O O C N N O O O r - J r - I C N o o o > r o o o o o o o o > a - o o f ^ r ^ o o O m m r H m c o m m m c o r H m m CNCMCO
I p». r»» p- p^ o I js. p^ sr r»» o I m m >^ m o
I O I O I O
O O O r O NO O O O O O CO O O O r O CM
O 0 0 v o r > » 0 0 p^psvo O O O c o O O O p-»r^co O O O c N r ^ O O m m c N
I I I I I I I
Q CO M
>3->3->a-sr>a->r->a->a- > r » 4 - s r s r > 3 - ^ - 4 - > a - s r s r c o c o c o <a- sr -a-
co 09 Qi CJ CJ
CO
NJ NOvo^a-vocoNor^co p ^ O O c o c N O r ^ p ^
^ O O ^ O C N r s O N v O r H N O C O C O C M
c o o o N o c o o o m o o c o o o N c o r ^ > , a -CM
CM O CO ^ vO rH
u
m m m m m m m m m m m m m m
Ul QJ
T3 d QJ
CO
d QJ d o O. £ o
CJ
QJ 00 CO CO CO QJ S
d QJ d o c. £ o
CJ
m m o m c o o o v o m o o O N o o o c o o N C M c o c o p s o o c o s r N O cNrH«a-CNCN r H r H C N C M C M r H r H C N C N r H r H r H C N r H r - i r l r H r H C M C N C M
r^ d QJ QJ d d d o CO a
4 = E CJ O
CJ
O CJ
ca CO
r H C N r H r ^ « a - C J N C M O r H C J N - ^ O s r v O O P s O r H O r H C O r H O C M
c j N O N O N t ^ p ^ m s r m s r o o m o o o o o c o c o r H r H m O N C O O O m C M O O r H C O O O C O O r ^ - s r > a - C M C N C N C O r H c n « a - C O C M s r C O C O C O C N C O
C N C O ^ O C O N O P ^ C N o o s r v o s r r H N O o o r ^ m C N ^ C O r H C N N O r H
o o N O c N O r H O N O > a - c o o o o o a o r ^ o N > r m r H c o m o o m o m o o r - i r H o o r H s r v o r — O C N r H r H O C M r H O O C M O O r H r-i r-i —i
I I I
m m m m m m m m
I I I I I I 1 1 I I I
m m m m m m m m m m s r ^ s r m s r m
CO CO QJ o o 3
CO
CO 09 QJ
r^
CN]
O m CM O O
* C3\ "1 s r
r-i
P«. a\
m
o p^
r-i
m
m NO
CN
NO o
r-i CO
r-i
m
p-> o r-i
vO P*
m
>a' ON
m
p-CO
m
vO m
sr NO
ON
o o r-
m
p,*
o
m
NO
r^ m r-i
r-i
r-i CN
r-i
<T CO
m
00 CO
m
CO r>. r-i
m m
m
CN r-i
r-i
m c M O N C M C N C O C M O
r>»s rmcoOONcoNO 00 rH >a- m CM vo NO vo r^ p^
C M O C M C 0 > a - i — l O C J N O N r ^ O N v o m s r p - « N O
CO CO m CO vo m
Cd
OS
< M Pi < >
CO w CU ca s O H H Cd M
CL3H4PLI r H C M C O r H C M C O r H C N C O a i r H C N C O O t - C J
0 3 tact,bMMi-isss2<:<<3 y^cj cu U C J C J C J O C J C J C J O CJOCJ
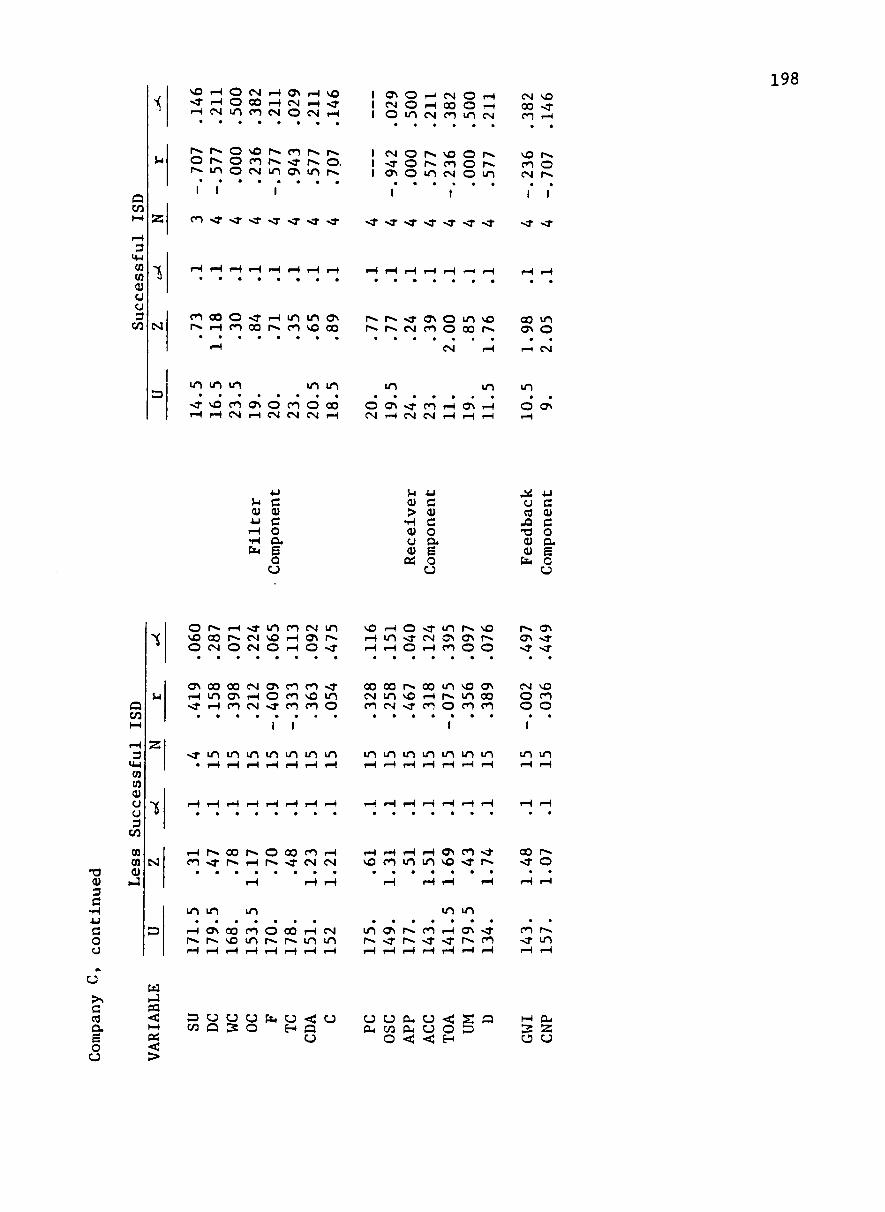
Q CO
.146
-.707
CO .211
-.577
>* .500
.000
>a-
.382
.236
>a"
.211
-.577
^
.029
.943
^
.211
.577
sr
.146
.707
sr
.029
-.942
-a- >r
.500
.000
-T
.211
.577
sr
.382
-.236
>r
.500
.000
>a-
.211
.577
sr
.382
-.236
^
.146
-.707
-a-
198
CO CO QJ U
a 3
CO C<I
c o o o o ^ a - r H m m o v rs.rHcooor««coNOoo p- p^ >,a- ON o m vo
p-» r^ CN CO O 00 r*. 00 m CJN o
CN r i CM
m m m m m m m m O ON S T N O C O O N O C O O O O
r H r H C M r H C M C N C N r H O CN ^ CO CM rH CN CM
r-i a\ r-i
u d OJ QJ 4J d r-i O -ri O . Cu £
o CJ
Ul QJ >
-ri QJ O QJ Pi
4J
d QJ d o o. £ o CJ
4»S +J a d CO QJ
43 d T3 O OJ Ou « £ tu O
T3 QJ 3 d
d o a
Q C O
CO CO QJ
o a 3
CO CO CO QJ
i-J
N
O r > . r H s r m c o c N m v O O O P ^ C M N O r H O N r ^ O C N O C N O r H O - ^
O N C O O O C M O N C O C O . ^ r H m O N r H O C O N O m s r r H C O C N - ^ C O C O O
.116
328 .151
852
.040
467
.124
318 .395
075 .097
356 .076
389
.497
002
.449
036
I I
% a - m m m m m m m m m m m m m m m m
CO P>. CO r«» O 00 CO rH , ^ P«. rH P-* s r CN CN
r-i r-i r-i r-i a\ m -^ vo CO m m NO »a- p*
CO IS.
'a- o
m m m m m r H O N O O C O O C O r H C N p«.r^vomr^r^mm
m ON 1^ CO rH ON -.* r«» s r r^ >?• >a- r^ c^
CO P^
^ m
d CO a £ o o
Cd HJ 03 < M Pi < >
3 c j y c j t a o < c j CO Q 3 o H ca
CJ
CJ CJ (U CJ <J PH CO P.1 CJ o
O <J < H
M CU 3 2 CJ CJ

APPENDIX L
Comparative Analysis of Management
Versus ISD Responses
199

200
13 d CO
o o
o o
NO .a-o o
ON r-i m
m 00 p«.
r^ O CM
O CN m
03
CO QJ CO d o a 09 QJ
Oi
ca CO
O CJ
CO CM O
CJN CN m
00 r-i o
NO CO o
CN X
o CN CO
NO CJN CO
NO
sr CO
O CN
>a-m
d QJ £ QJ 0 0 CO
d CO
S Ul
o
CM
m o
r-i • o
o
r-i CN
sr o o •
sr p^ r-i
CO m 00
CO CM O
00 NO m
en 4-1 09 QJ H CO
• H CO OJ
o CJ i •<T
NO r-i
•<t NO CJN
CN
o o
CJN
o o
o o. CM
X sr CO (JN
CM
o o
r-i CO CM
P -O ON
ON NO
d o
4J -H d 4-1 QJ CJ £ CO QJ >4.| 0 0 CO CO - H d 4-1 CO CO
S CO
4-1 d QJ E QJ >
r-i o > d
HH 1 QJ Ul CU
d QJ E QJ >
r-i 0 > d
M 1
U CO o cu
d o
•H •Ul CO a
•H d 3 p £ O
CJ
CO CO QJ CJ o 3
CO

09 r-i QJ
T3 O
s d o
CD
a •H
d 3 E £ o
CJ
2 < :
o CJ
CO
4J d QJ
TJ d
QJ CC
CN]
X m m r H s r p " . m m c o m v o s O Q o o o r - i o r s O C M r - i C O C N r H C O > a -
O O C N V O C M O O O P S C N
C N C O O v O r H N O O r H C O r H C M O r H C M r H O
I t I
m m m m m m m m C M C N C N C M C N C N C M C N
r,. Ps 00 m O . * r^ O vO NO m CO
m m m m
O m P-* m CM m - r m o
m
C N C J N r H O r > . . a - r H P ^ O r ^ 0 0 O O N C O r ^ O N v O C O O N N O C O N O P > . 0
c N c o c N c N < - s r c o s r c o s r - ^ m
m r ^ Q O v o o o m o o o o s r p ^ c N O r H C O C N r H r H C O m r - | v O r H r - 0 r H O r H r H O O O O O O O O
I I I I
m m m m m m m m m m m m C N C N C M C M C M C N C M C M C N C N C M C M
c N P ^ p » . O N v o o m N O . , 3 - m p v N O C N C N N O C O P ^ C O O O r H C O m O m > T N O m O r H C M O C O O O O
o
m m m m m m r H vO P^ CN
m vo NO rs O N O N P > .
m so 1^ o o o p ^ c o N o m c o v o c N v o r ^ c o vOp^vOvop»p^ r ^p . . p» . r> .p^p^
m 0 .a-
CN
m 0
CJv CM CM
ON CN r-{
m m CN CN
NO P -vO 00 00 O
00 -vr m sr
201
TJ QJ >
•H QJ O Ul QJ
CU
QJ
U. d QJ QJ
T3 d d c QJ O.
CO E o
CJ
QJ 00 CO CO CO QJ
X
d QJ d 0 a £ 0
CJ
r-i d QJ QJ d d d o CO CU
4 : E CJ o
CJ
CO
QJ
r H 4 3 CO
• H
Ul CO
>
QJ 4 = i J
O
CO • H 09 >
r-i CO
QJ
>
CO U l CO a £ O
CJ
CO
4.1
d QJ
- 3 d o CO
QJ
Pi
2 <
O CJ
o o N r J C M p v . p « . . . r o o o o o c o o N r H m ^ -> r o o > 3 - > a - c o c N r H
N O s r o m c M c o c N p s o m c o o o m r ^ r H O C M m O O O O r H
I I I
C>]
r ^ r s r>Np* r s r> .p . . r » . c o o o c o a o c o o o c o c o
O ^ m O r H O O P s O C O v O r H ^ v O O N O O P - O O O O O N O O C M
ps m rH vo O m CO O CO NO r O CO ON CO CO rH m CN .a- 00
C O C O m r H C N C O C O r H m C M P ^ C O v O r H - a - r H O p - . o c o i ^ p * o o o o CNm C O C O r H O r H O C O C O r H O O O r H r - l
m C M O O r H C J N O C N N O I ^ O N p ^ m m O N » a - m c O v O C O O C O C O C O r ^ v O C J N C N r H O O r H r H r ^ C N O O r H C O C N C M r - i r H
r ^ r » p ^ p ^ p > » r . p . . r ^ r » p « . p * r ^ c o o o c o o o o o o o c o o o c o o o o o o o
m o o c o o o v o r ^ c M O N c o m r - i c N r H 0 N r H O O N 0 > r m N 0 C 0 P » O C O C M . ^ O O O ' - i O C J N ^ - r ^ O
i - H O r H N O C J N O N O O O r - t v O v O c O c jN«a- rHcococMr^oo.a- rsvocM ON»a-ooNor* .oo>rcoop«-cocN
m CN sr r-i
m m m m m
CN
m
CN CN r H r H r H CO
m m m m P ^ C J N C M O O N O r H O O C O c o o o v o r s c M a o < - O N
m p a- p^ vo CN m
Cd rJ 03 < M Pi < >
CU CO Cd CU O H H
a S CJ M Cd H-i O 3
CU
r ^ C O O N C O N O C O C O C O O C N O N C O c o o N > r m m s r r * . > a - c N m o o o N > r m v o > a - . a - m m m p ^ N o m c o
r H C M C O r H C N C O r H C N C O r i C N C O
i i 4 [ u & u M M M S s s < : < : < : C J C J C J U C J U C J C J C J C J C J C J
P-. CO
NO CN CN
NO 0 CM
P^ 00
m CJN Px.
r-i vO CN
s r NO O CN vO p.-
CO

202
03
< lU
i CJ
CO 4-1
d QJ
T> d o OI CO QJ
Pi
t<
.12
0 -.
24
4
m CN
r-i .1
95
.16
3 .2
20
m CN
r-i
.13
3 .4
07
-.0
28
m CN
r-i
.09
7 .0
22
-.4
07
m CM
m o
.99
3 .4
07
-.0
53
m CM
r-i
.00
0
.22
2 .1
60
m CN
r-i
.78
4 .1
02
-.2
63
m CN
r-i
.28
9 .1
20
-.2
44
m CM
r-i
.19
7 .3
69
-.0
76
m CM
r H
.10
3 .0
43
-.3
51
m CM
r-i
.71
7 ,4
42
-.0
40
m CN
r-i
.16
9 .0
38
-.3
61
m CN
m o
.77
0
.44
5 .0
29
m CM
r-i
.14
4 .2
17
.16
4
m CM
r-i
.99
3
m m m 1^ ^ ^ CM o m >a- NO sr vo
m m m m
sr m CO ON CM ^ vo NO m m m m p >r
m m
m CM r^ sr
1 3 QJ 3 d
• H 4-1
d o CJ
0 3
T J d CO
< CO QJ
• H
d CO
o. £ o CJ
<
^ <
CO
MP
nts
QJ TS d
o a CO QJ
Pi
r-i r-i
<
^
Ul
2
-i
CN]
3
Cd I - ] 03 <
AR
I
>
d Ul QJ QJ d •Ul o r-i a -ri S Pu O
U
ON o o O CM \ 0
sr o o
m CM o CM CM |s.« O CM r H
I
r > . pN. r»« CO 0 0 0 0
O O CO O O CM O O O
p s CO < -CN ON 0 0 CO CO CN
s r - a - CN
m r H 0 0 m CO «a- o CO CM m
O Ct< CJ
3 H
'a-r-i
o
p s CO CN
P^ CO
m r-i
o
CJN CN
«a-« N
CN
o m
< Q CJ
CO
o o
CO NO CN
p>. 0 0
NO P-* ON
m CM
o
CN CM p ^
CJ
CM
o o
r-i
o CO
r* 0 0
0 0 CO
o
sr p -
o CN
r»» CM
CJ cu
o sr o
o CJN r-i
\
T". 0 0
CO NO r-i
ON
r CO
r-i
ON
o CO
CJ CO
o
Ul QJ
> . H OJ
a QJ
Pi
NO CO
o
NO ON r-i
1
Pv 0 0
CO CN
o
sr CO CM
CM
m o m
cu (U <
u d QJ d O
a £ o
CO
m CM
CO p s
o 1
p * CO
v o P * CJN
m CN
o
CM CN
r>»
CJ CJ <
r-i CN O
CJN r-i CN
1
p s 0 0
1 ^ vO O
r-i CO CO
r H
m vO CN
m
<: o H
m m r-i
O r-i r-i
1
r* 0 0
v o r-i O
r^
o sr CM
r ON
.,a-
§
r H
o o
p*. CN CO
1
p^ 0 0
CN O O
r-i
o r^
CO
sr r^ <t
ca
^ 4J
a d CD QJ
4 3 d T 3 O QJ C3. QJ £
Cti O CJ
CN - a -NO r^
o o
IS . 1 ^ NO CO r-i CM
1
1 ^ ! > . OO 0 0
0 0 o
o o o o
CO ON m CM NO r-i
CN NO
m m ON
r>. m • ^ r-i
M CU 3 2 O CJ
k

Appendix M
Rationale for the Selection of the Berlo Communication Model
203

204
Rationale for the Selection of the Berlo Communication Model
In Chapter II, repeated references are made to the "Basic Model
of Communication" and to the "Berlo Model." Over the past several
decades, several models of communication have been presented as a
representation of the communication process. This section examines
several of these models in an effort to provide a more coherent
development of the communication model used in this study.
The communication model used in this study is composed of
six components: 1) sender, 2) message, 3) channel, 4) filter,
5) receiver, and 6) feedback. One of the earliest models (the
Shannon-Weaver model, presented in Figure M-1) characterized the
communication process in terms of the message. The components of
the model (information source, transmitter, noise source, receiver,
and destination) were used to explain the mechanical process of
message transmission. While the model does recognize the presence
of a "sender" and a "receiver," the model de-emphasizes many
elements of the human-element of communication. Furthermore, a
feedback cycle is not included in the model. However, the presence
of the "noise source" provides for the possibility of channel and
filter elements, although they are not developed in the model.
The Gerbner model, presented in Figure M-2, was the first to
recognize the importance of sender perceptions. The model is
intended to provide a representation of the process by which a
sender witnesses an event and translates his conceptualization of

205
QJ OO CO CO CO QJ
X
T3 QJ >
• H QJ O QJ
CO
d 00
•H CO
QJ 00 CO CO CO QJ X
d o •H 4^ CO o
•H d 3
g o
CJ
y-i
o >.
rH U4 QJ O
T3 QJ O 4= S H d rH O CO
•H O 4-1 -H CO 4 J CJ CO
•H E d QJ 3 42 E w E « O X u QJ U4 43 QJ H
/—\ .
00 CJN
• CU
• ON < •
CJN r - l
. CO CO QJ Ul
CU
CO •H O d
•H r-i rH
> M CO QJ • U-l 3 Ul o 1 QJ d > >% O CO 4J d OJ -H d 3 CO CO Ul
43 d QJ CO QJ >
Ul -H QJ Ul d
42 CO 3 H 3
- 3 • • • d CO
r-l CO -H 1 o
S d d O -ri
QJ d rH U4 d rH 3 CO M 00 43
•H CO •> Ci4 CO
• d Cd CO
43 QJ Ul
T3 3 3 CO
rH CJ
e o Ul
Pu
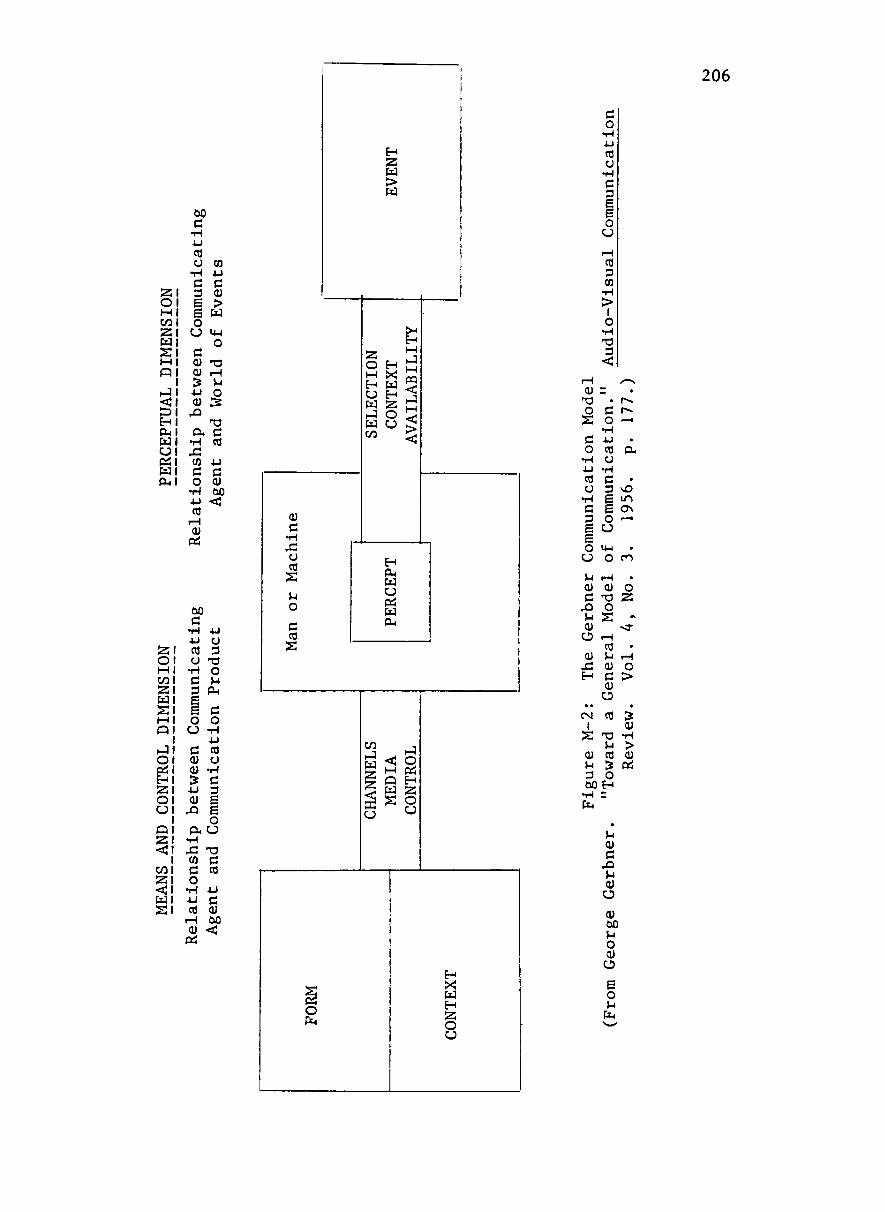
2 1 O I M l COI 2 1 Cdl S I M l cai
I rJ I <:i := i H I cui Cdl CJI
oi\ Cdl CUI
00 d
CO U CO
d 3 E £ o u d QJ QJ > U d)
43
Cl. •H 42 CO d o
•H 4-1 CO
r-i QJ
CXi
d QJ >
Cd
uu O
T3 r-i U O 3 T3 d CO
d QJ 00
2 1 O I M l COI 2 1 Cdl S I M l cai
1 i-Ji O I cssi H I 2 1 O I C D l
1
cai §1
1 COI 2 1
n\ S I
d •H 4J CO a
•H d 3
g O
CJ
d QJ Q)
:s Ul QJ
43
4-1
a 3
T3 O Ul
CU
d o •H 4J CO a
•H d 3 E E o
CU U •H X CO d o •H 4J CO
r-i QJ
T3 d CO
4-1
d QJ 00 <:
Pi
ine
an or Mach
s
EVENT
SELECTION
CONTEXT
AVAILABILITY
PERCEPT
CHANNELS
MEDIA
CONTROL
FORM
CONTEXT
206
r-i QJ
T3 O
s d o •H 4J CO O
•H d 3 E E o
CJ
Ul QJ d
43 Ul QJ
CJ
QJ 43 H
• * CN 1
S QJ Ul 3
d o
•H 4-1 CO O
•H d 3
o CJ
M CO 3 CO
•H
> 1 1
o -ri T3 3
< ^^
^ • • P-«
d r-o -^
•H 4J • CO a o
•H d • 3 NO E m £ o O ' - I
CD
M-l • O CO
M • QJ O
T3 2 O
s •> ^
M CO • Ul M QJ O d > QJ
o •
CO 5 OJ
T3 "H Ul > CO QJ 5 OS
o 00 H •H Pu
^
• Ul QJ d
43 U4 QJ
O
QJ OO Ul O QJ
O
E o Ul
cu

207
the event into a message. Specifically noted in this model is
the sender's understanding of a channel and his control over
media selection. However, the model does not recognize the presence
of a receiver; and as a consequence, the model does not include
feedback as one of its components.
The next conceptualization of the communication process is
provided by a series of models developed by Schramm. (See Figure
M-3.) The first of Schramm's models. Figure M-3a, provides the same
basic representation of the communication process as the Shannon-
Weaver model; i.e., the communication process is made up of sender-
receiver pairs. The second model. Figure M-3b, provides an additional
dimension—the field of experience. By including this element,
Schramm illustrates that the context in which the message is sent
and received is based on the experiences of the sender and receiver.
The third of Schramm's models, Figure M-3c, illustrates that an
individual communicator is simultaneously a sender and receiver.
The fourth model. Figure M-3d, illustrates the concept of feedback;
however, this model does not recognize either the channel or filter
components used in this study.
The final model. Figure M-4, was developed by Berlo. It is
often referred to as the "SMCR" model—Sender-Message-Channel-Receiver.
This conceptualization not only provides four of the basic components
of the model used in this study, it also provides a more complete
development of the substructure in each component. For example.
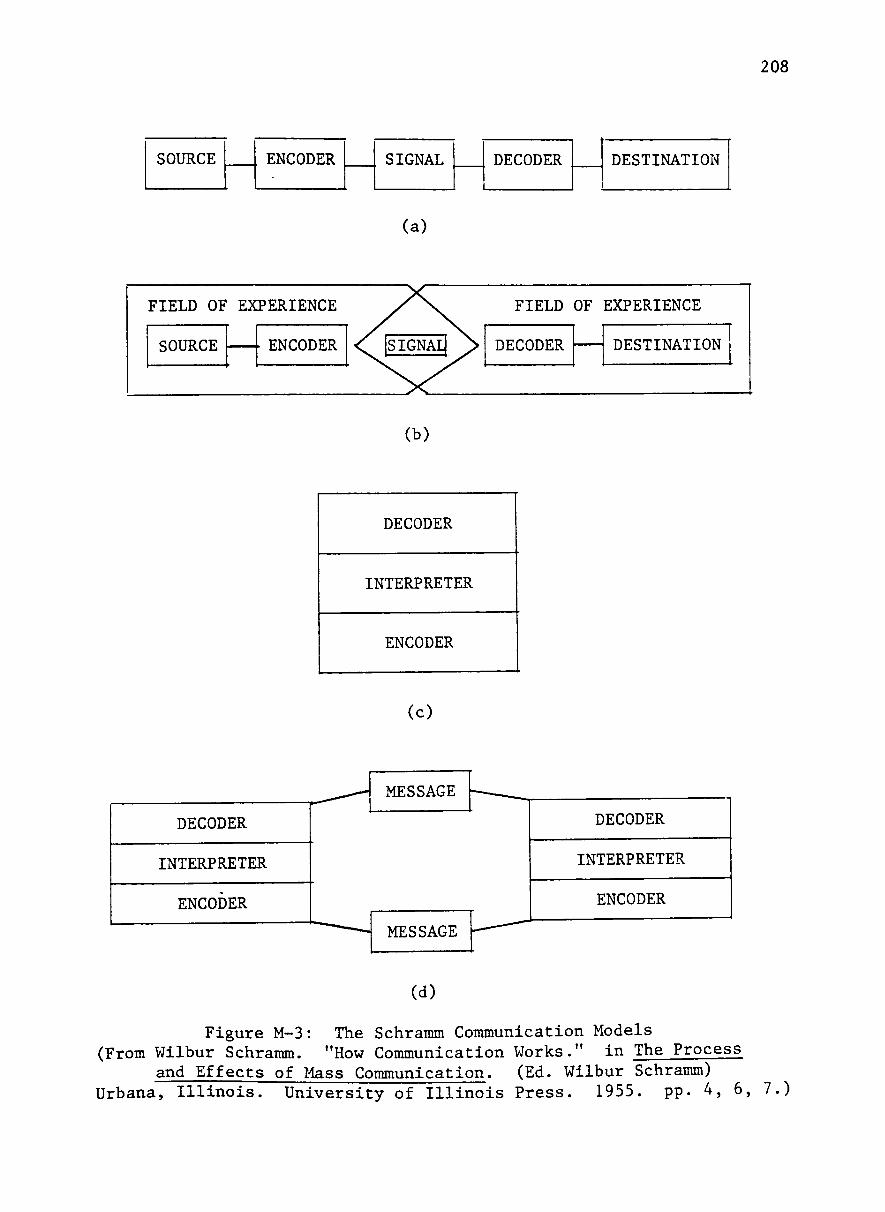
208
SOURCE ENCODER SIGNAL DECODER DESTINATION
(a)
FIELD OF EXPERIENCE
SOURCE ENCODER
FIELD OF EXPERIENCE
DECODER DESTINATION
(b)
DECODER
INTERPRETER
ENCODER
(c)
DECODER
INTERPRETER
ENCODER
MESSAGE
MESSAGE
DECODER
INTERPRETER
ENCODER
(d)
Figure M-3: The Schramm Communication Models (From Wilbur Schramm. "How Communication Works." in The Process
and Effects of I-lass Communication. (Ed. Wilbur Schramm) Urbana, Illinois. University of Illinois Press. 1955. pp. 4, 6, 7.)

209
a::
( - )
oo
Pi Cd > M Cd CJ Cd Oi
d o
•H Ul CO o
•H CO d M 3 M E -H E 4«i O CO u
CO OJ
T3 3 u -ri 4-1 4J
<:
QJ OC
TJ 0)
M 5 O d ^
E OJ 4-1 CO
>, CO
r-i CO
•H a 0
CO
£ • QJ 4-1 CO >%
CO
r-i CO Ul 3 4-1 M 3
CJ
hJ Cd
(^
1 O
00 d
•H QJ QJ
CO
00 d
•H Ul CO QJ
00 d
•H 43 O 3 O
H
00 d
•H M M QJ E
CO
00 d
•H 4-1 CO CO
H
Cd O < CO CO Cd S
Ui d OJ 4J
d o
CJ
a jn : iona : iS
u d QJ
E 4-1 CO QJ Ul H
s:juamax3
QJ TJ o
CJ
r-i QJ
T3 O
s d o
•H 4-1 CO O
•H d 3 g g o
CJ
o r-i u OJ PQ
QJ 4= H
. . sr
1 S QJ Ul 3 00
•H Ci<
QJ O
•H U CJ CO Ul
CU
T3 d CO
> Ul o QJ
43 H
O 4-1
d o
•H , U O 3
T3 O Ul 4-1 d
M
d <
• • d o
•H 4-1 CO O
•H d 3 E E o
CJ
y-i o Cfl CO 01 o o Ul
0^
a 43 H
C r-U a cc
A-\
CM r s
. a
• o NO CN r - l
. d o 4-1 CO
c •H 3 T3 d CO
^ 4-1 Ul CO
43 QJ
d •H Oi
. 4-1 M O
33
• 4.5 Ul O
5 QJ 2
1
i^
ca E o Ul
C:u

210
the elements of the sender component include communication skills,
attitudes, knowledge, and the impact of both the social and cultural
systems. The pictorial representation of Berlo's model does
not include either the filter or feedback components. However, in
Berlo's verbal description of the model he indicated the presence
and importance of the feedback component. Thus, only the filter
component is missing from all other models presented in this section.
The Berlo model was selected for use in this study because of
several factors. First, the Berlo model contains five of the six
components of the model used in the study (more than any other
single model presented in this section). Second, the Berlo model
provides a more complete framework for each of the components of
the model. Third, the Berlo model has a human-communication orien
tation while others stress the mechanics of message transmission.
Finally, the Berlo model addresses the bilateral communication
process. Since the focus of this study is on two interacting groups
of human participants (managers and Information Service Department
personnel); and since the outcome of communication is of greater
importance to this study than the mechanics of message transmission,
it is this writer's opinion that the Berlo model offers the best
fit to the needs of the study.

Appendix N
Preliminary Testing of Questionnaire
211
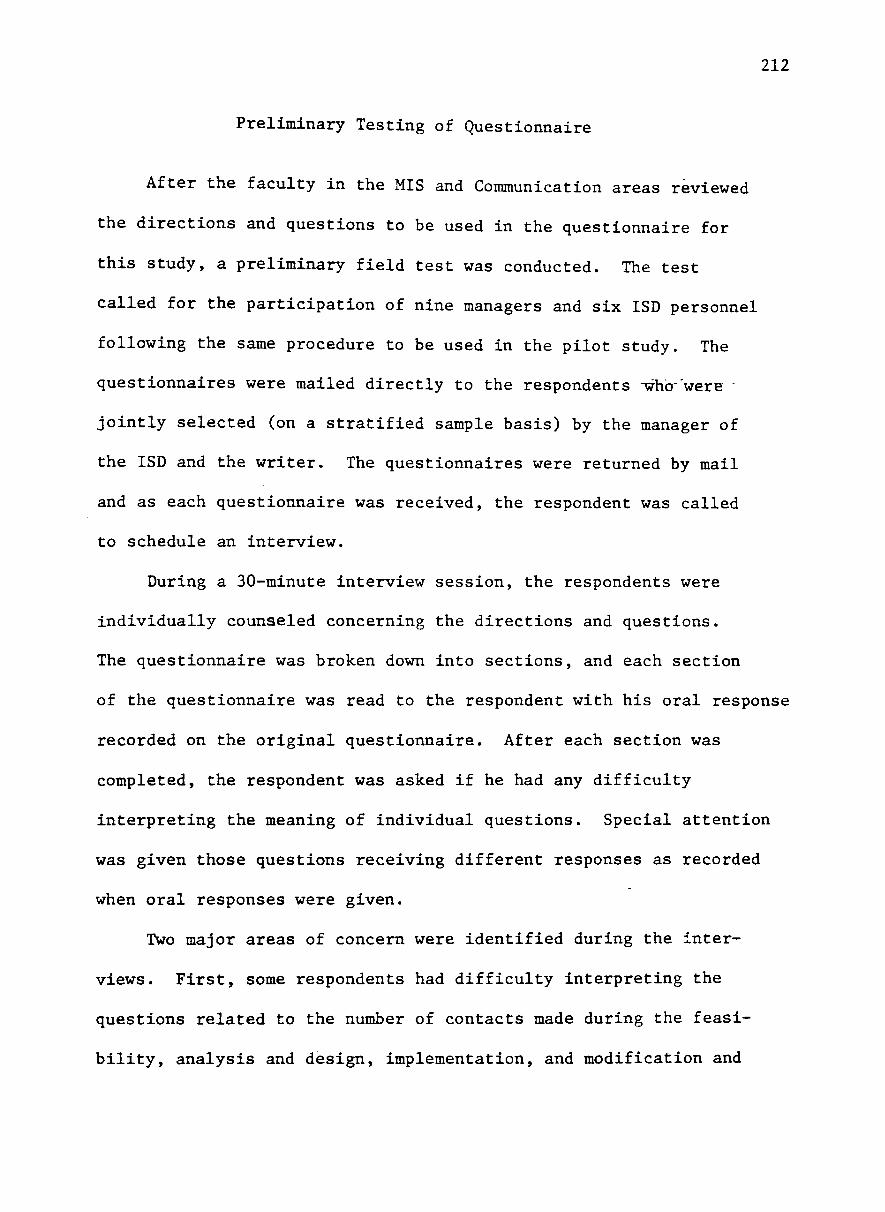
212
Preliminary Testing of Questionnaire
After the faculty in the MIS and Communication areas reviewed
the directions and questions to be used in the questionnaire for
this study, a preliminary field test was conducted. The test
called for the participation of nine managers and six ISD personnel
following the same procedure to be used in the pilot study. The
questionnaires were mailed directly to the respondents -whcr'were
jointly selected (on a stratified sample basis) by the manager of
the ISD and the writer. The questionnaires were returned by mail
and as each questionnaire was received, the respondent was called
to schedule an interview.
During a 30-minute interview session, the respondents were
individually counseled concerning the directions and questions.
The questionnaire was broken down into sections, and each section
of the questionnaire was read to the respondent with his oral response
recorded on the original questionnaire. After each section was
completed, the respondent was asked if he had any difficulty
interpreting the meaning of individual questions. Special attention
was given those questions receiving different responses as recorded
when oral responses were given.
Two major areas of concern were identified during the inter
views. First, some respondents had difficulty interpreting the
questions related to the number of contacts made during the feasi
bility, analysis and design, implementation, and modification and

213
maintenance phases of systems development. These questions were
a particular problem to managers. To resolve this problem,
operational definitions were included as part of the question for
each of these areas. Furthermore, operational definitions were
added and directions were improved in the portion of the question
naire dealing with communication.
The second problem area was related to the use of percentage-
type scaling devices. Some respondents had difficulty deciding
upon an appropriate response, and as a consequence, made no
response. Each of the questions using percentage-type scales
was redesigned to employ a Likert-type scaling device.
After these changes were made, the questionnaire was submitted
to the faculty committee for final review before being used in
the pilot study phase of the investigation.