Embed Size (px)
Citation preview

applied sciences
Article
A Comparison of Deep Learning Methods for ICDCoding of Clinical Records
Elias Moons 1,*, Aditya Khanna 1,2, Abbas Akkasi 1 and Marie-Francine Moens 1
1 Department of Computer Science, KU Leuven, 3000 Leuven, Belgium; [email protected] (A.K.);[email protected] (A.A.); [email protected] (M.-F.M.)
2 Department of Electrical Engineering, IIT Bombay, Maharashtra 400076, India* Correspondence: [email protected]
Received: 29 June 2020; Accepted: 28 July 2020; Published: 30 July 2020�����������������
Abstract: In this survey, we discuss the task of automatically classifying medical documents into thetaxonomy of the International Classification of Diseases (ICD), by the use of deep neural networks.The literature in this domain covers different techniques. We will assess and compare the performanceof those techniques in various settings and investigate which combination leverages the best results.Furthermore, we introduce an hierarchical component that exploits the knowledge of the ICDtaxonomy. All methods and their combinations are evaluated on two publicly available datasetsthat represent ICD-9 and ICD-10 coding, respectively. The evaluation leads to a discussion of theadvantages and disadvantages of the models.
Keywords: ICD coding; hierarchical classification; electronic healthcare
1. Introduction
The International Classification of Diseases (ICD), which is endorsed by the World HealthOrganization, is the diagnostic classification standard for clinical and research purposes in the medicalfield. ICD defines the universe of diseases, disorders, injuries, and other related health conditions,listed in a comprehensive, hierarchical fashion. ICD coding allows for easy storage, retrieval, andanalysis of health information for evidenced-based decision-making; sharing and comparing healthinformation between hospitals, regions, settings, and countries; and data comparisons in the samelocation across different time periods (https://www.who.int/classifications/icd/en/) . ICD hasbeen revised periodically to incorporate changes in the medical field. Today, there have been 11revisions of the ICD taxonomy, where ICD-9 and ICD-10 are the most studied when it comes totheir automated assignment to medical documents. In this paper, we compare state-of-the-art neuralnetwork approaches to classification of medical reports written in natural language (in this caseEnglish) according to ICD categories.
ICD coding of medical reports has been a research topic for many years [1]. Hospitals need tolabel their patient visits with ICD codes to be in accordance with the law and to gain subsidies fromthe government or refunds from insurance companies. When the documents are in free text format,this process is still done manually. Automating (a part of) this process would greatly reduce theadministrative work.
In this paper, we compare the performance of several deep learning based approaches for ICD-9and ICD-10 coding. The codes of ICD-9 consist of, at most, five numbers. The first three numbersrepresent a high level disease category, a fourth number narrows this down to specific diseases, and afifth number differentiates between specific disease variants. This leads to a hierarchical taxonomy withfour layers underneath a root node. The first layer (L1) consists of groups of 3-numbered categories,the next three layers (L2 through L4) correspond to the first 3, 4, or 5 numbers of the ICD code as is
Appl. Sci. 2020, 10, 5262; doi:10.3390/app10155262 www.mdpi.com/journal/applsci

Appl. Sci. 2020, 10, 5262 2 of 20
displayed in the upper part of Figure 1. In the lower part of this figure, a concrete example of thecoding is shown.
Figure 1. ICD-9 code structure with second through fourth layer representations and diabetes asan example.
In this paper, we survey state-of-the-art deep learning approaches for ICD-9 coding. We especiallyfocus on the representation learning that the methods accomplish.
Experiments with ICD-9 are carried out on the MIMIC-III dataset [2]. This dataset consists of over50,000 discharge summaries of patient visits in US hospitals. These summaries are in free textual formatand labeled with corresponding ICD-9 codes, an example snippet is visible in Figure 2. Most dischargesummaries are labeled with multiple categories, leading to a multiclass and multilabel setting forcategory prediction.
Figure 2. Example snippet of discharge summary from the MIMIC-III dataset with correspondingtarget International Classification of Diseases (ICD) codes.
Appl. Sci. 2020, 10, 5262 3 of 20
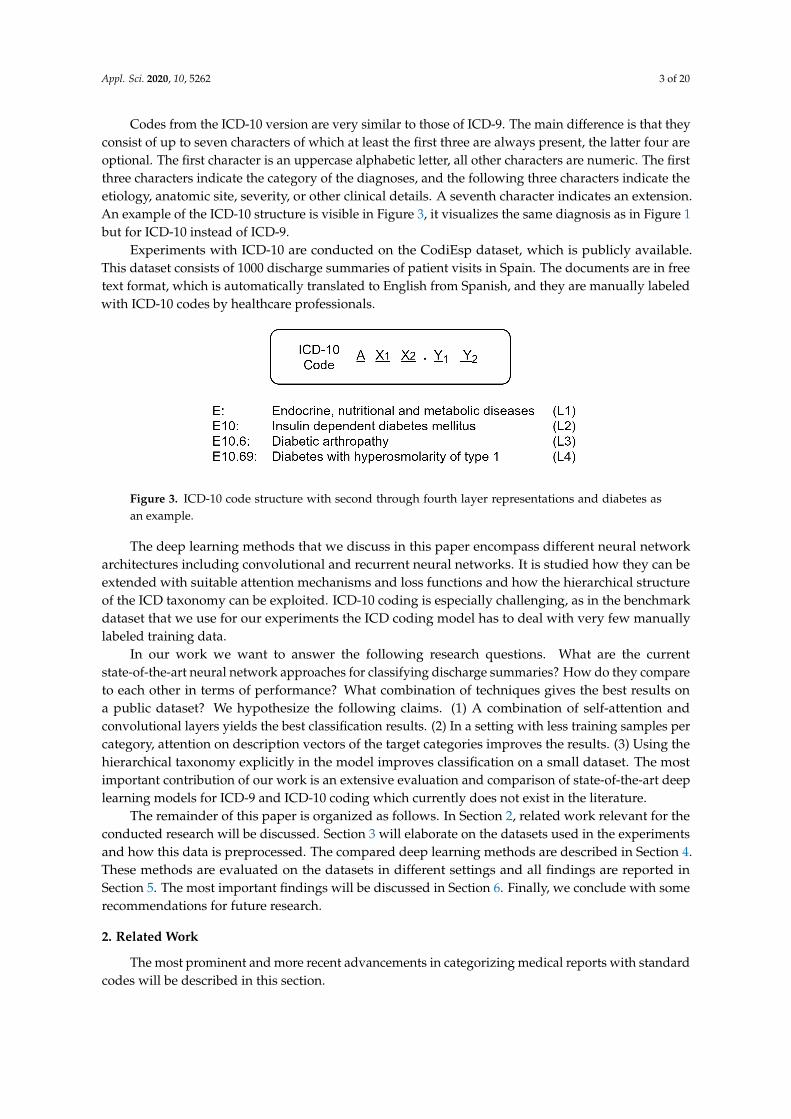
Codes from the ICD-10 version are very similar to those of ICD-9. The main difference is that theyconsist of up to seven characters of which at least the first three are always present, the latter four areoptional. The first character is an uppercase alphabetic letter, all other characters are numeric. The firstthree characters indicate the category of the diagnoses, and the following three characters indicate theetiology, anatomic site, severity, or other clinical details. A seventh character indicates an extension.An example of the ICD-10 structure is visible in Figure 3, it visualizes the same diagnosis as in Figure 1but for ICD-10 instead of ICD-9.
Experiments with ICD-10 are conducted on the CodiEsp dataset, which is publicly available.This dataset consists of 1000 discharge summaries of patient visits in Spain. The documents are in freetext format, which is automatically translated to English from Spanish, and they are manually labeledwith ICD-10 codes by healthcare professionals.
Figure 3. ICD-10 code structure with second through fourth layer representations and diabetes asan example.
The deep learning methods that we discuss in this paper encompass different neural networkarchitectures including convolutional and recurrent neural networks. It is studied how they can beextended with suitable attention mechanisms and loss functions and how the hierarchical structureof the ICD taxonomy can be exploited. ICD-10 coding is especially challenging, as in the benchmarkdataset that we use for our experiments the ICD coding model has to deal with very few manuallylabeled training data.
In our work we want to answer the following research questions. What are the currentstate-of-the-art neural network approaches for classifying discharge summaries? How do they compareto each other in terms of performance? What combination of techniques gives the best results ona public dataset? We hypothesize the following claims. (1) A combination of self-attention andconvolutional layers yields the best classification results. (2) In a setting with less training samples percategory, attention on description vectors of the target categories improves the results. (3) Using thehierarchical taxonomy explicitly in the model improves classification on a small dataset. The mostimportant contribution of our work is an extensive evaluation and comparison of state-of-the-art deeplearning models for ICD-9 and ICD-10 coding which currently does not exist in the literature.
The remainder of this paper is organized as follows. In Section 2, related work relevant for theconducted research will be discussed. Section 3 will elaborate on the datasets used in the experimentsand how this data is preprocessed. The compared deep learning methods are described in Section 4.These methods are evaluated on the datasets in different settings and all findings are reported inSection 5. The most important findings will be discussed in Section 6. Finally, we conclude with somerecommendations for future research.
2. Related Work
The most prominent and more recent advancements in categorizing medical reports with standardcodes will be described in this section.

Appl. Sci. 2020, 10, 5262 4 of 20
2.1. Traditional Models for ICD Coding
Larkey and Croft [3] are the first to apply machine learning techniques to ICD coding.Different techniques including a k-nearest neighbor classifier, relevance feedback, and a Bayesianclassifier are applied to the texts of inpatient discharge summaries. The authors found that an ensembleof models yields the best results. At that time, and still later, one has experimented with rule-basedpattern matching techniques, which are often expressed as regular expressions (see, e.g., in [4]).Farkas et al. [5] have proposed a hybrid system that partially relied on handcrafted rules and partiallyon machine learning. For the latter, the authors compare a decision tree learner with a multinomiallogistic regression algorithm. The system is evaluated on the data from the CMC Challenge onClassifying Clinical Free Text Using Natural Language Processing, support vector machines (SVMs)were also a popular approach for assigning codes to clinical free text (see, e.g., in [6] who evaluate aSVM using n-gram word features on the MIMIC-II dataset). A systematic overview of earlier systemsfor automated clinical coding is found in [7]. The authors of [8] show that datasets of different sizesand different numbers of distinct codes demand different training mechanisms. For small datasets,it is important to select relevant features. The authors have evaluated ICD coding performanceon a dataset consisting of more than 70,000 textual Electronic Medical Records (EMRs) from theUniversity of Kentucky (UKY) Medical Center tagged with ICD-9 codes. Integrating feature selectionon both structured and unstructured data is researched by the authors of [9] and has proven to aidthe classification process. Two approaches are evaluated in this setting: early and late integration ofstructured and unstructured data, the latter yielding the better results. Documents are tagged withICD-9 and ICD-10 medical codes.
2.2. Deep Learning Models for ICD Coding
More recently, and following a general trend in text classification, deep learning techniques havebecome popular for ICD coding. These methods learn relevant features from the raw data and thus skipthe feature engineering step of traditional machine learning methods. Deep learning proved its valuein computer vision tasks [10], and rapidly has conquered the field of text and language processing.Deep learning techniques also have been successfully applied to Electronic Health Records (EHR) [11].In the 2019 CLEF eHealth evaluation lab, deep learning techniques had become mainstream modelsfor ICD coding [12].
A deep learning model that encompasses an attention mechanism is tested by the authors of [13]on the MIMIC-III dataset. In this work, a Long Short-Term Memory network (LSTM) is used for bothcharacter and word level representations. A soft attention layer here helps in making predictions forthe top 50 most frequent ICD codes in the dataset. Duarte et al. [14] propose bidirectional GRUs forICD-10 coding of the free text of death certificates and associated autopsy reports. Xie et al. [15] havedeveloped a tree-of-sequences LSTM architecture with an attention mechanism to simultaneouslycapture the hierarchical relationships among codes. The model is tested on the MIMIC-III dataset.Huang et al. [16] have shown that deep learning-based methods outperform other conventionalmachine learning methods such as a SVM for predicting the top 10 ICD-9 codes on the MIMIC-IIIdataset, a finding confirmed by Li et al. [17], who have confirmed that ICD-9 coding on the MIMIC-IIand MIMIC-III datasets outperforms a classical hierarchy-based SVM and a flat SVM. This latterwork also shows that convolutional neural networks (CNNs) are successful in text classification giventheir capability to learn global features that abstract larger stretches of content in the documents.Xu et al. [18] have implemented modality-specific machine learning models including unstructuredtext, semistructured text, and structured tabular data, and then have used an ensemble method tointegrate all modality-specific models to generate the ICD codes. Unstructured and semistructuredtext is handled by a deep neural network, while tabular data are converted to binary features whichare input as features in a decision tree learning algorithm [19]. The text classification problem canalso be modeled as a joint label-word embedding problem [20]. An attention framework is proposedthat measures the compatibility of embeddings between text sequences and labels. This technique is
Appl. Sci. 2020, 10, 5262 5 of 20
evaluated on both the MIMIC-II and MIMIC-III datasets but achieves inferior results to the neuralmodels presented further in this paper. Zeng et al. [21] transfer MeSH domain knowledge to improveautomatic ICD-9 coding but improvements compared to baselines are limited. Baumel et al. [22]have introduced the Hierarchical Attention bidirectional Gated Recurrent Unit model (HA-GRU).By identifying relevant sentences for each label, documents are tagged with corresponding ICD codes.Results are reported both on the MIMIC-II and MIMIC-III datasets. Mullenbach et al. [23] present theConvolutional Attention for Multilabel classification (CAML) model that combines the strengths ofconvolutional networks and attention mechanisms. They propose adding regularization on the longdescriptions of the target ICD codes, especially to improve classification results on less representedcategories in the dataset. This approach is further extended with the idea of multiple convolutionalchannels in [24] with max pooling across all channels. The authors also shift the attention from thelast prediction layer, as in [23], to the attention layer. Mullenbach et al. [23,24] achieve state-of-the artresults for ICD-9 coding on the MIMIC-III dataset. As an addition to these models, in this paper ahierarchical variant of each of them is constructed and evaluated.
Recently, language models have become popular in natural language processing. The use ofBidirectional Encoder Representations from Transformers (BERT) models, which uses a transformerarchitecture with multi-head attention, and especially BioBERT has improved the overall recall values atthe expense of precision compared to CNN and LSTM models when applied in the ICD-10 coding taskat CLEF eHealth in 2019 [25], a finding which we have confirmed in our experiments. Therefore, we donot report on experiments with this architecture in this survey.
Finally, Campbell et al. [26] survey the literature on the benefits, limitations, implementation,and impact of computer-assisted clinical coding on clinical coding professionals. They conclude thathuman coders could be greatly helped by current technologies and are likely to become clinical codingeditors in an effort to raise the quality of the overall clinical coding process. Shickel et al. [11] reviewdeep learning models for EHR systems by examining architectures, technical aspects, and clinicalapplications. Their paper discusses shortcomings of the current techniques and future researchdirections among which the authors cite ICD coding of free clinical text as one of the future challenges.
2.3. Hierarchical Models for Classification
In this paper, we foresee several mechanisms to exploit the hierarchical taxonomy of ICD codesin a deep learning setting, in other words we exploit the known dependencies between classes.Although this is a rather novel topic, hierarchical relationships between classes have been studiedin traditional machine learning models. Deschacht et al. [27] have modeled first-order hierarchicaldependencies between classes as features in a conditional random field and applied this model to textclassification. Babbar et al. [28] study error generalization bounds of multiclass, hierarchical classifiersusing the DMOZ hierarchy and the International Patent Classification by simplifying the taxonomyand selectively pruning some of its nodes with the help of a meta-classifier. The features retained inthis meta-classifier are derived from the error generalization bounds. Furthermore, hierarchical lossfunctions have been used in non-deep learning approaches. Gopal et al. [29] exploit the hierarchical orgraphical dependencies among class labels in large-margin classifiers, such as a SVM, and in logisticregression classifiers by adding a suitable regularization term to their hinge-loss and logistic lossfunction, respectively. This regularization enforces the parameters of a child classifier to be similarto the parameters of its parent using a Euclidean distance function, in other words, encouragingparameters which are nearby in the hierarchy to be similar to each other. This helps classes to leverageinformation from nearby classes while estimating model parameters. Cai and Hofmann [30] integrateknowledge of the class hierarchy into a structured SVM. Their method also considers the parent–childrelationship as a feature. All parameters are learned jointly by optimizing a common objective functioncorresponding to a regularized upper bound on the empirical loss. During training it is enforced thatthe score of a training example with a correct labeling should be larger than or equal to the scoreof a training example of an incorrect labeling plus some loss or cost. It is assumed that assignment
Appl. Sci. 2020, 10, 5262 6 of 20
of confusing classes that are “nearby” in the taxonomy is less costly or severe than predicting aclass that is “far away” from the correct class. This is realized by scaling the penalties for marginviolation. A similar idea is modeled in a deep learning model for audio event detection [31]. Theseauthors propose the hierarchy-aware loss function modeled as a triplet or quadruplet loss function thatfavors confusing classes that are close in the taxonomy, over ones that are far away from the correctclass. In [32], an hierarchical SVM is shown to outperform that of a flat SVM. Results are reportedon the MIMIC-II dataset. In a deep neural network setting, recent publications on hierarchical textclassification outside the medical field make use of label distribution learning [18], an hierarchicalsoftmax activation function [33], and hierarchical multilabel classification networks [34].
Recent research shows the value of hierarchical dependencies using hierarchical attentionmechanisms [22] and hierarchical penalties [34], which are also integrated in the training of themodels surveyed in this paper.
If the target output space of categories follows a hierarchy of labels—as is also the casein ICD coding—the trained models efficiently use this hierarchy for category assignment orprediction [32,35,36]. During categorization the models apply a top-down or a bottom-up approach atthe classification stage. In a top-down approach parent, categories are assigned first and only childrenof assigned parents are considered as category candidates. In a bottom-up approach, only leaf nodesin the hierarchy are assigned which entail that parent nodes are assigned.
In the context of category occurrences in hierarchical target spaces, a power-law distribution isdescribed in [37]. Later, the authors of [38] have addressed this phenomenon quantitatively derivinga relationship in terms of space complexity for those kind of distributions. They have proved thathierarchical classifiers have lower space complexity than their flat variants if the hierarchical targetspace satisfies certain conditions based on, e.g., maximum branching factor and the depth of thehierarchy. The hierarchical variants discussed in this survey are of different shape than those discussedin these works, layer-based instead of node-based, and do not suffice the necessary conditions forthese relationships to apply.
2.4. Models Relevant for This Survey
The experiments reported in Section 5 are carried out starting with and expanding the modelsdescribed in [23,24]. These models are evaluated against common baselines, partly inspired by othermodels e.g., the GRU form [22]. For all models, the state-of-the-art, and the baselines, a hierarchicalversion is constructed using the principles explained in [34]. This hierarchical version duplicatesthe original model for each layer in the corresponding ICD taxonomy (ICD-9 or ICD-10). These arethen trained in parallel. Furthermore, the weights in these networks are influenced by the weightsof neighboring layers via the addition of a hierarchical loss function. This loss function penalizeshierarchical inconsistencies that arise when training the model. This leads to a clear comparisonbetween all tested models among themselves as well as with their hierarchical variants.
3. Materials
3.1. ICD-9 Datasets
The publicly available MIMIC-III dataset [2] is used for ICD-9 code predictions. MIMIC-III is anopenly accessible clinical care database. For this research, following the trends of previous related work,the patient stay records from the database are used. Every hospital admission has a correspondingunique HADM-ID. In the MIMIC-III database, some patients have also an added Addendum to theirstay. Based on earlier studies, records of only those patients who have discharge summaries linked areselected. The addendum is concatenated to the patient’s discharge summary. Analogous to the workin [24], out of the the original database, three sub-datasets are extracted. These datasets are used forthe experiments and allow for evaluation in different settings. The sub-datasets are the following.

Appl. Sci. 2020, 10, 5262 7 of 20
• Dis-50 consists of a selection of the discharge summaries from the MIMIC-III dataset (11,369 outof 52,726) for the classification of Top-50 ICD-9 codes. We use the publicly available split [23] fortraining (8066), testing (1729), and development (1574) of the models.
• Dis describes the full label setting where all Diagnostic (6918) and Procedural (2011) ICD-9 codesare used. This leads to a total of 8929 Unique codes on the 52,726 discharge summaries. We againuse the publicly available split for training (47,723), testing (3372), and development (1631) ofthe models.
• Full extends the Dis dataset with other notes regarding the patient (radiology notes, nursing notes,etc.) in addition to the discharge summaries. This dataset, contains almost thrice the number oftokens for training. We use the same test, train, development split as used in the Dis dataset.
3.2. ICD-10 Dataset
The CodiEsp corpus [39] consists of 1000 clinical cases, tagged with various ICD-10 codes byhealth specialists. This dataset is released in the context of the CodiEsp track for CLEF ehealth 2020.The dataset corresponding to the subtask of classifying diagnostic ICD codes is used. The originaltext fragments are in Spanish but an automatically translated version in English is also provided bythe organizers, this version is used in this research. The publicly available dataset contains a split of500 training samples, 250 development samples, and 250 test samples. In total, the 1000 documentscomprises of 16,504 sentences and 396,988 words, with an average of 396.2 words per clinical case.The biggest hurdle while training with this dataset is the size and consequently the small number oftraining examples for each category present. Figure 4 gives a sorted view of all categories present inthe training dataset and the amount of examples tagged with that specific category.
500 1,000 1,500
20
40
60
80
100
Category
Freq
uenc
yin
trai
ning
set
Figure 4. Category frequencies of CodiEsp training dataset.
There are in total 1767 different categories spread out over only 500 training documents.Every document is labeled with on average 11.3 different categories and each category is on averagerepresented by 3.2 training examples. Even the top 50 most frequently occurring categories have onlybetween 15 and 112 corresponding positive training documents. Therefore, tests for this dataset areconducted on these 50 categories. Table 1 gives an overview of statistics for all discussed trainingdatasets. The specifics for the corresponding development and test sets are similar. Displayed statisticsfor the Dis and the Full dataset are the same since the only difference lies in larger text fragments,resulting in 72,891 unique tokens for the Full dataset compared to 51,917 for Dis. There are nodifferences concerning the labels.
Appl. Sci. 2020, 10, 5262 8 of 20
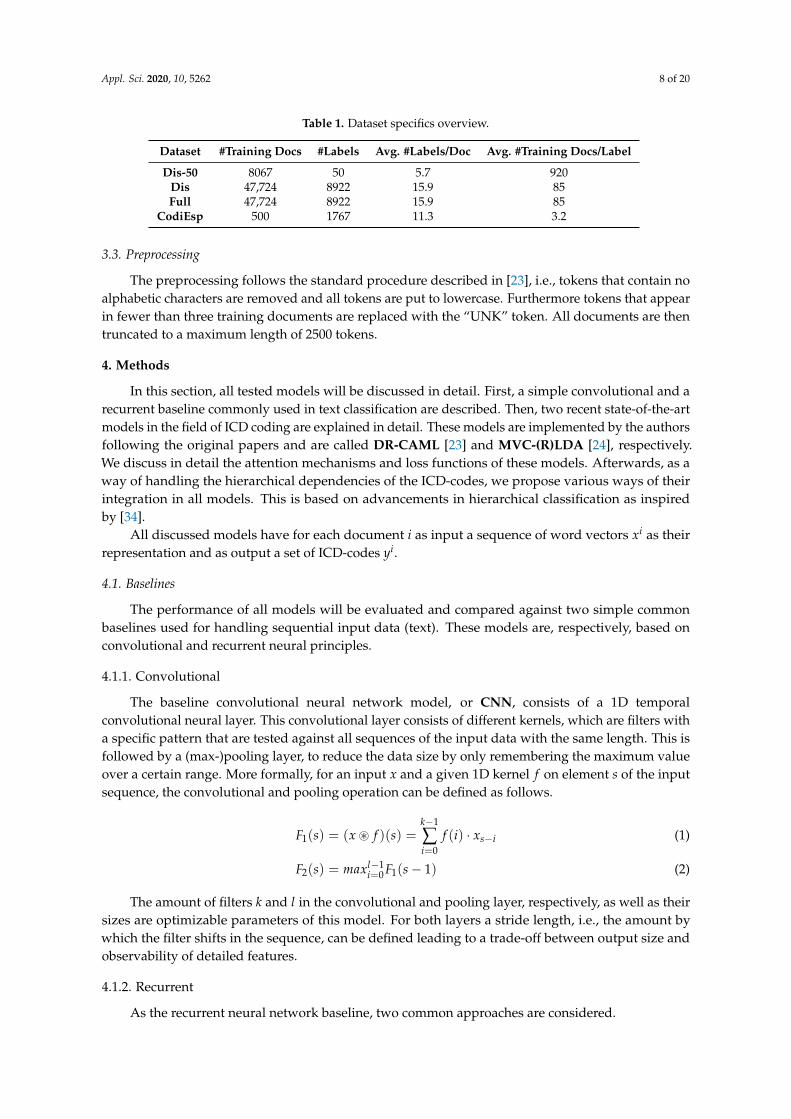
Table 1. Dataset specifics overview.
Dataset #Training Docs #Labels Avg. #Labels/Doc Avg. #Training Docs/Label
Dis-50 8067 50 5.7 920Dis 47,724 8922 15.9 85Full 47,724 8922 15.9 85
CodiEsp 500 1767 11.3 3.2
3.3. Preprocessing
The preprocessing follows the standard procedure described in [23], i.e., tokens that contain noalphabetic characters are removed and all tokens are put to lowercase. Furthermore tokens that appearin fewer than three training documents are replaced with the “UNK” token. All documents are thentruncated to a maximum length of 2500 tokens.
4. Methods
In this section, all tested models will be discussed in detail. First, a simple convolutional and arecurrent baseline commonly used in text classification are described. Then, two recent state-of-the-artmodels in the field of ICD coding are explained in detail. These models are implemented by the authorsfollowing the original papers and are called DR-CAML [23] and MVC-(R)LDA [24], respectively.We discuss in detail the attention mechanisms and loss functions of these models. Afterwards, as away of handling the hierarchical dependencies of the ICD-codes, we propose various ways of theirintegration in all models. This is based on advancements in hierarchical classification as inspiredby [34].
All discussed models have for each document i as input a sequence of word vectors xi as theirrepresentation and as output a set of ICD-codes yi.
4.1. Baselines
The performance of all models will be evaluated and compared against two simple commonbaselines used for handling sequential input data (text). These models are, respectively, based onconvolutional and recurrent neural principles.
4.1.1. Convolutional
The baseline convolutional neural network model, or CNN, consists of a 1D temporalconvolutional neural layer. This convolutional layer consists of different kernels, which are filters witha specific pattern that are tested against all sequences of the input data with the same length. This isfollowed by a (max-)pooling layer, to reduce the data size by only remembering the maximum valueover a certain range. More formally, for an input x and a given 1D kernel f on element s of the inputsequence, the convolutional and pooling operation can be defined as follows.
F1(s) = (x ~ f )(s) =k−1
∑i=0
f (i) · xs−i (1)
F2(s) = maxl−1i=0 F1(s− 1) (2)
The amount of filters k and l in the convolutional and pooling layer, respectively, as well as theirsizes are optimizable parameters of this model. For both layers a stride length, i.e., the amount bywhich the filter shifts in the sequence, can be defined leading to a trade-off between output size andobservability of detailed features.
4.1.2. Recurrent
As the recurrent neural network baseline, two common approaches are considered.

Appl. Sci. 2020, 10, 5262 9 of 20
BiGRU
The GRU, or Gated Recurrent Unit, is a gating mechanism in recurrent neural networks. It isthe mechanism of recurrent neural networks allowing the model to “learn to forget” less importantfragments of the data and “learn to remember” the more important fragments with respect to thelearning task. More formally, consider an input vector xt, update gate vector zt, reset gate vector rt,and output vector ht at time t. The respective values can be calculated as follows.
zt = σ(Wz · [ht−1, xt] + bz) (3)
rt = σ(Wr · [ht−1, xt] + br) (4)
h∗t = tanh(Wh · [tt × ht−1, xt] + bh) (5)
ht = (1− zt)× ht−1 + zt × h∗t (6)
This leads to weight matrices Wz, Wr, and Wh to train as well as biases bz, br, and bh, σ stands forthe sigmoid activation function. BiGRU is the bidirectional variant of such a model that processes theinput data front-to-back and back-to-front in parallel.
BiLSTM
An LSTM, or Long Short-Term Memory neural network model, is very similar to a GRU butreplaces the update gate with a forget gate and an additional output gate. This way it usually has morecomputational power than a regular GRU, but at the expense of more trainable parameters and morechance of overfitting when the amount of training data is limited [40–42]. Formally, consider again aninput vector xt and a hidden state vector ht at time t. Activation vectors for the update gate, forget gate,and output gate are, respectively, represented by zt, ft, and ot. These states relate to each other likefollows.
zt = σ(Wz · [ht−1, xt] + bz) (7)
ft = σ(W f · [ht−1, xt] + b f ) (8)
ot = σ(Wo · [ht−1, xt] + bo) (9)
c∗t = tanh(Wc · [ht−1, xt] + bc) (10)
ct = ( ft)× ct−1 + zt × c∗t (11)
ht = ot × tanh(ct) (12)
This again leads to weight matrices Wz, W f , Wo, and Wc to train as well as biases bz, b f , bo, and bc
with σ being the sigmoid activation function. BiLSTM is the bidirectional variant of a regular LSTM,analogous to BiGRU, which is the bidirectional variant of GRU.
4.2. Advanced Models
This subsection describes the details of recent state-of-the-art models presented in [23,24] in theway they are used for the experiments in Section 5.
4.2.1. DR-CAML
DR-CAML is a CNN-based model adopted for ICD coding [23]. When an ICD code is defined bythe WHO, it is accompanied by a label definition expressed in natural language to guide the modeltowards learning the appropriate parameter values of the model. For this purpose, the model employsa per-label attention mechanism enabling it to learn distinct document representations for each label.It has been shown that for labels for which there are very few training instances available, this approachis advantageous. The idea is that the description of a target code is itself a very good training example

Appl. Sci. 2020, 10, 5262 10 of 20
for the corresponding code. Similarity between the representation of a given test sample and therepresentation of the description of a target code gives extra confidence in assigning this label.
In general, after the convolutional layer, DR-CAML employs a per-label attention mechanismto attend to the relevant parts of text for each predicted label. An additional advantage is that theper-label attention mechanism provides the model with the ability of explaining why it decided toassign each code by showing the spans of text relevant for the ICD code.
DR-CAML consists of two modules: one for the representation of the input text, and the otherfor the embedding of the label’s description as is visualized in Figure 5. The CAML module has aCNN at the base layer which takes a sequence of the embeddings of the text tokens as input andconsequently represents the document as the matrix H. Then, the per-label attention mechanismapplies. Attention in this context means learning which parts of some context (the label descriptionvectors) are relevant for a given input vector.
After calculating the attention vector α using a softmax activation function, it is applied as aproduct with H. With hl , the vector parameter for label l, the vector representation for each label iscomputed as
vl =N
∑n=1
αl,nhn (13)
Given the vector representation of a document and the probability for label l, yl can be obtainedas shown in Figure 5.
Figure 5. DR-CAML (after [23]).
The CNN modules on the left hand side try to minimize the binary cross entropy loss. The secondmodule is a max-pooling CNN model which produces a max-pooled vector, zl , by getting thedescription of code l. Assuming ny is the number of true labels in train data, the final loss is computedby adding a regularization term to the base loss function. The loss function is explained in more detailin Section 4.2.3.
4.2.2. MVC-(R)LDA
MVC-LDA and MVC-RLDA can be seen as extensions of DR-CAML. Similar to that model,they are based on a CNN architecture with a label attention mechanism that considers ICD coding as amulti-task binary classification problem. The added functionality lies in the use of parallel CNNs withdifferent kernel sizes to capture information of different granularity. MVC-LDA, the top module inFigure 6, is a multi-view CNN model stacked on an embedding layer. MVC-RLDA reintroduces theper-label attention mechanism introduced in the previous subsection.
In general, the multi-view CNNs are constructed with four CNNs that have the same number offilters but with different kernel sizes. This convolutional layer is followed by a max-pooling function
Appl. Sci. 2020, 10, 5262 11 of 20
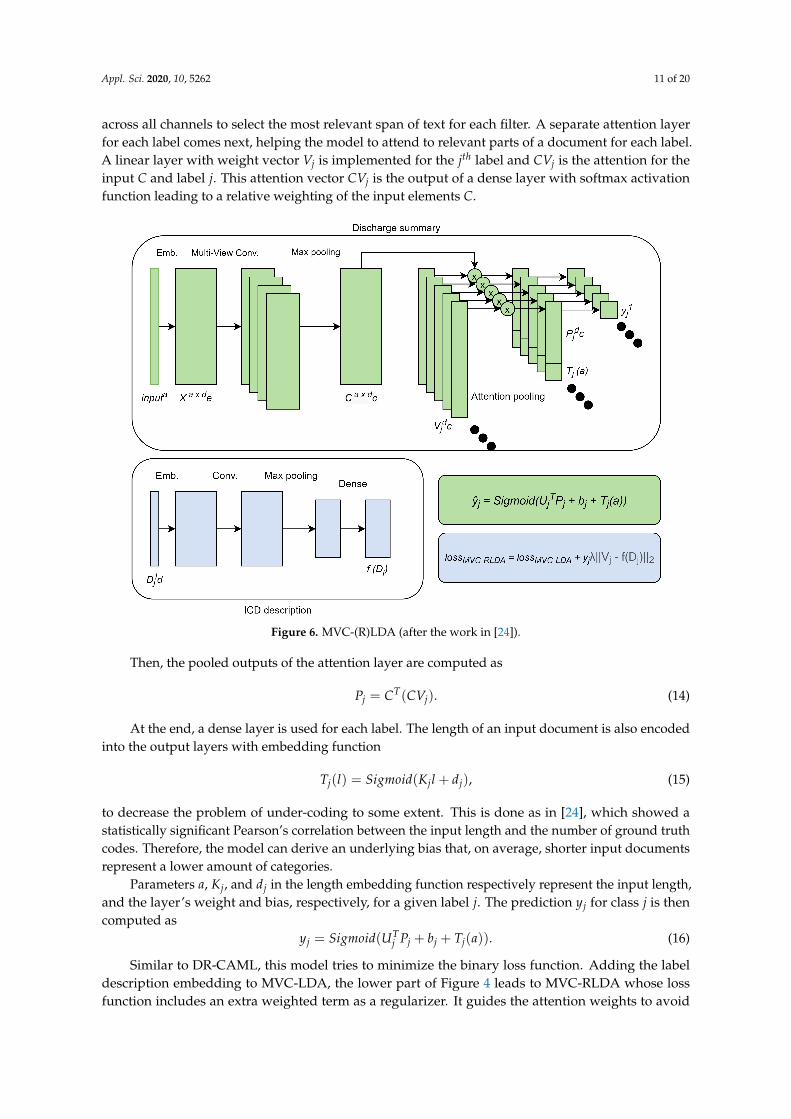
across all channels to select the most relevant span of text for each filter. A separate attention layerfor each label comes next, helping the model to attend to relevant parts of a document for each label.A linear layer with weight vector Vj is implemented for the jth label and CVj is the attention for theinput C and label j. This attention vector CVj is the output of a dense layer with softmax activationfunction leading to a relative weighting of the input elements C.
Figure 6. MVC-(R)LDA (after the work in [24]).
Then, the pooled outputs of the attention layer are computed as
Pj = CT(CVj). (14)
At the end, a dense layer is used for each label. The length of an input document is also encodedinto the output layers with embedding function
Tj(l) = Sigmoid(Kjl + dj), (15)
to decrease the problem of under-coding to some extent. This is done as in [24], which showed astatistically significant Pearson’s correlation between the input length and the number of ground truthcodes. Therefore, the model can derive an underlying bias that, on average, shorter input documentsrepresent a lower amount of categories.
Parameters a, Kj, and dj in the length embedding function respectively represent the input length,and the layer’s weight and bias, respectively, for a given label j. The prediction yj for class j is thencomputed as
yj = Sigmoid(UTj Pj + bj + Tj(a)). (16)
Similar to DR-CAML, this model tries to minimize the binary loss function. Adding the labeldescription embedding to MVC-LDA, the lower part of Figure 4 leads to MVC-RLDA whose lossfunction includes an extra weighted term as a regularizer. It guides the attention weights to avoid

Appl. Sci. 2020, 10, 5262 12 of 20
overfitting. In addition, this regularization forces the attention for classes with similar descriptions tobe closer to each other. The loss function is again explained in more detail in Section 4.2.3.
4.2.3. Loss Function
The loss functions used to train DR-CAML and the multiview models MVD-(R)LDA are calculatedin the same way. The general loss function is the binary cross entropy loss lossBCE. This loss is extendedby regularization on the long description vectors of the target categories, visualized in Figure 6 on thelower right corner.
Given N different training examples xi. The values of yl and max-pooled vector zl can becalculated as represented in Figure 5 by getting the description of code l out of all L target codes. In thisfigure, and the following formulas, βl is a vector of prediction weights and vl the vector representationfor code l. Assuming ny is the number of true labels in the training data, the final loss is computed byadding regularization to the base loss function as
yl = σ(βtlvl + bl) (17)
lossBCE(X) = −N
∑i=1
L
∑l=1
yl log (yl) + (1− yl) log (1− yl) (18)
lossModel(X) = lossBCE + λ1
ny
N
∑i=1
L
∑l=1‖zl − βl‖2 (19)
4.3. Modeling Hierarchical Dependencies
In this section, we investigate the modeling of hierarchical dependencies as extensions of themodels described above. A first part integrates the hierarchical dependencies directly into the structureof the model. This leads to Hierarchical models, which are layered variants of the already discussedapproaches. The second way hierarchical dependencies are explicitly introduced into the model isvia the use of a hierarchical loss function to penalize hierarchical inconsistencies across the model’sprediction layer.
4.3.1. Hierarchical Models
Hierarchical relationships can be shaped directly into the architecture of any of the describedmodels above. The ICD-9 taxonomy can be modeled as a tree with a general ICD root and 4 levelsof depth, as already described in Section 1. This leads to a hierarchical variant of any of the models.In this variant, not 1 but 4 identical models will be trained, one for each of the different layers in theICD hierarchy (corresponding to the length of the codes).
Such an approach is presented in [34] and is adapted to the target domain of ICD categories.An overview of the approach is given in Figure 7.
The input for each layer is partially dependent on an intermediary representation from theprevious layer as well as the original input through concatenation of both. Layers are stacked frommost to least specific or from leaf to root node in the taxonomy. Models corresponding to differentlayers will then rely on different features, or characteristics, to classify the input vectors. This waythe deepest, most advanced representations, can be used for classifying the most abstract and broadcategories. On the other hand, for the most specific categories, word level features can directly be usedto make detailed decisions between classes that are very similar.

Appl. Sci. 2020, 10, 5262 13 of 20
Figure 7. Overview of hierarchical variant of a model, inspired by [34].
4.3.2. Hierarchical Loss Function
To capture the hierarchical relationships in a given model, the loss function of the abovemodels can be extended with an additional term. This leads to the definition of a Hierarchicalloss function (lossH). This loss function penalizes classifications that contradict the inherent ICDhierarchy. More specifically, when a parent category is not predicted to be true, none of its childcategories should be predicted to be true. The hierarchical loss between a child and its parent in thetree is then defined as the difference between their computed probability scores, with 0 as a lowerbound. More formally, for the entire loss function lossH_Model for a category of layer X, combining theregular training loss lossModel described above and the hierarchical loss lossH , is calculated as follows,
P(X) = Probability(X == True) (20)
Par(X) = Probability(Parent(X) == True) (21)
L(X) = True label o f X(0 or 1) (22)
lossH(X) = Clip(P(X)− Par(X), 0, 1) (23)
lossH_Model(X) = (1− λ)lossModel(X) + λlossH(X) (24)
which leaves a parameter λ to optimize the loss function (parameter λ is optimized over thetraining set).
5. Results
5.1. MIMIC-III
Results are displayed for five different models. First, results for the two baseline models, CNNand BiGRU, are shown. Because in most of the experiments, the BiGRU models performed at least onpar with their BiLSTM variants, we only report the results of BiGRU as a recurrent neural networkbaseline. The reason for this good performance of GRU models compared to LSTM models mostlikely resides in the amount of available training data for various target categories. Then, we reporton three more advanced models as discussed in the Method section: DR-CAML, MVC-LDA, andMVD-RLDA. Different hyperparameter values are considered and tested on the development set ofMIMIC-III the setting giving the highest average performance on the development set is reported inTable 2.
Appl. Sci. 2020, 10, 5262 14 of 20
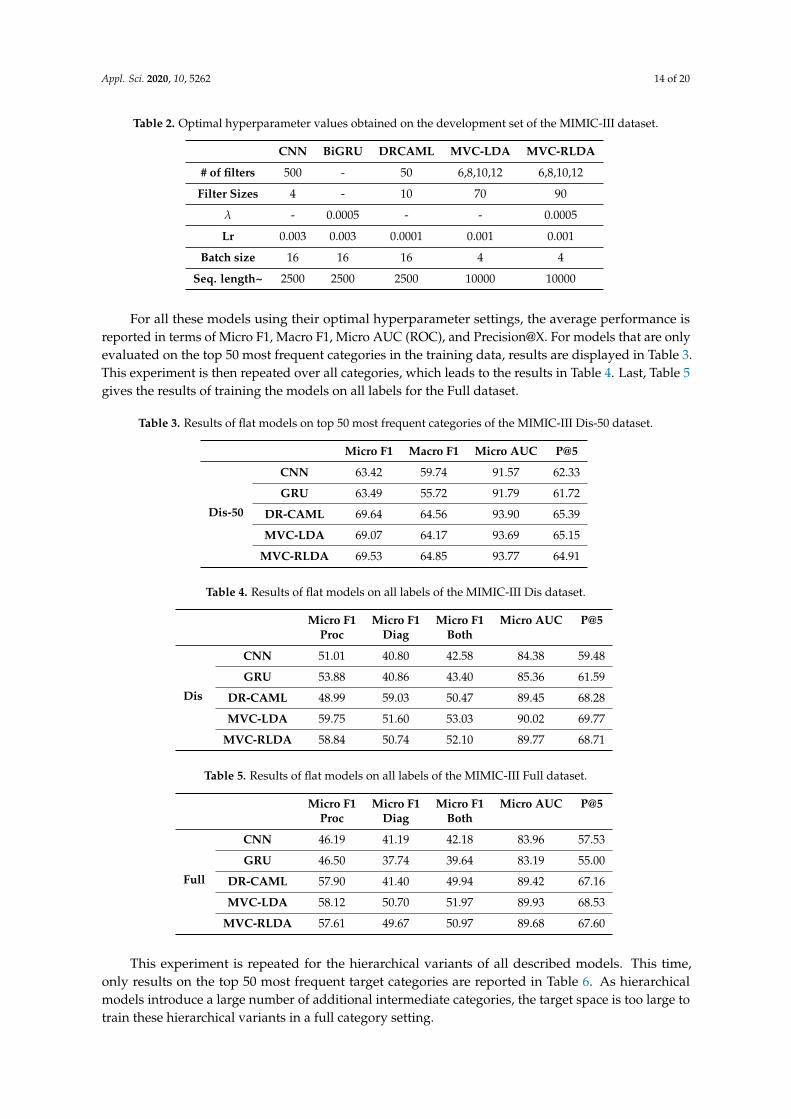
Table 2. Optimal hyperparameter values obtained on the development set of the MIMIC-III dataset.
CNN BiGRU DRCAML MVC-LDA MVC-RLDA
# of filters 500 - 50 6,8,10,12 6,8,10,12
Filter Sizes 4 - 10 70 90
λ - 0.0005 - - 0.0005
Lr 0.003 0.003 0.0001 0.001 0.001
Batch size 16 16 16 4 4
Seq. length~ 2500 2500 2500 10000 10000
For all these models using their optimal hyperparameter settings, the average performance isreported in terms of Micro F1, Macro F1, Micro AUC (ROC), and Precision@X. For models that are onlyevaluated on the top 50 most frequent categories in the training data, results are displayed in Table 3.This experiment is then repeated over all categories, which leads to the results in Table 4. Last, Table 5gives the results of training the models on all labels for the Full dataset.
Table 3. Results of flat models on top 50 most frequent categories of the MIMIC-III Dis-50 dataset.
Micro F1 Macro F1 Micro AUC P@5
Dis-50
CNN 63.42 59.74 91.57 62.33
GRU 63.49 55.72 91.79 61.72
DR-CAML 69.64 64.56 93.90 65.39
MVC-LDA 69.07 64.17 93.69 65.15
MVC-RLDA 69.53 64.85 93.77 64.91
Table 4. Results of flat models on all labels of the MIMIC-III Dis dataset.
Micro F1 Micro F1 Micro F1 Micro AUC P@5Proc Diag Both
Dis
CNN 51.01 40.80 42.58 84.38 59.48
GRU 53.88 40.86 43.40 85.36 61.59
DR-CAML 48.99 59.03 50.47 89.45 68.28
MVC-LDA 59.75 51.60 53.03 90.02 69.77
MVC-RLDA 58.84 50.74 52.10 89.77 68.71
Table 5. Results of flat models on all labels of the MIMIC-III Full dataset.
Micro F1 Micro F1 Micro F1 Micro AUC P@5Proc Diag Both
Full
CNN 46.19 41.19 42.18 83.96 57.53
GRU 46.50 37.74 39.64 83.19 55.00
DR-CAML 57.90 41.40 49.94 89.42 67.16
MVC-LDA 58.12 50.70 51.97 89.93 68.53
MVC-RLDA 57.61 49.67 50.97 89.68 67.60
This experiment is repeated for the hierarchical variants of all described models. This time,only results on the top 50 most frequent target categories are reported in Table 6. As hierarchicalmodels introduce a large number of additional intermediate categories, the target space is too large totrain these hierarchical variants in a full category setting.
Appl. Sci. 2020, 10, 5262 15 of 20
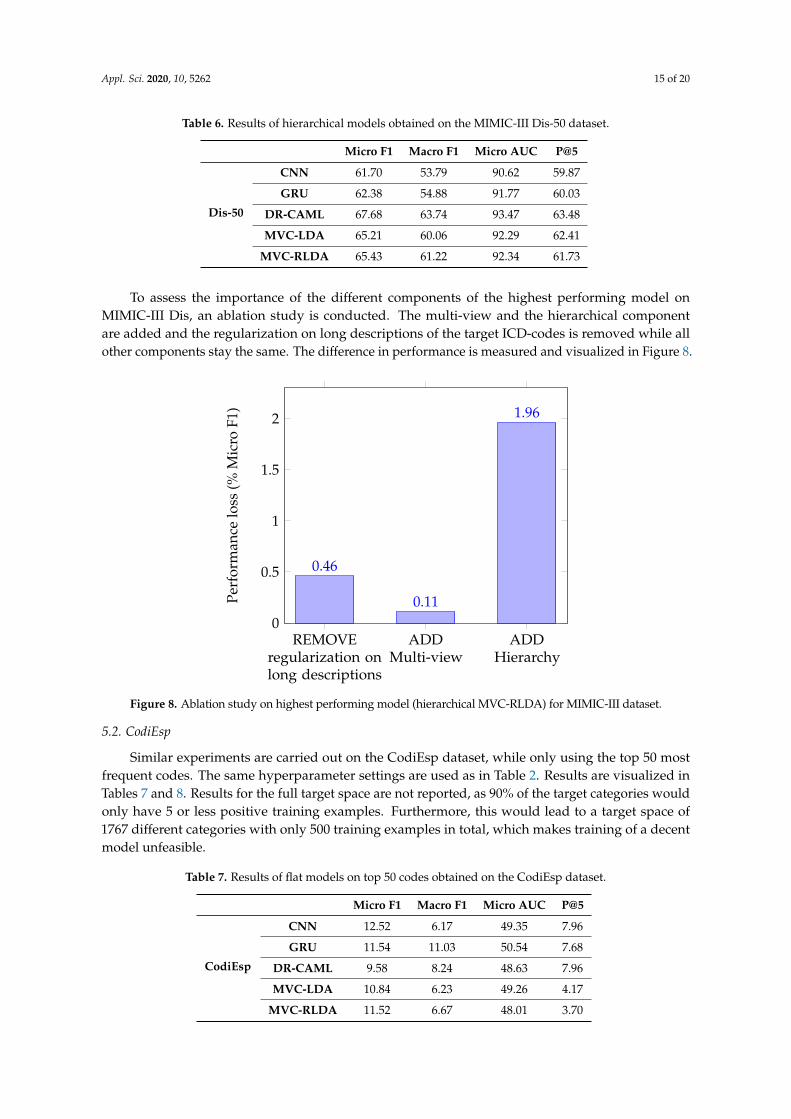
Table 6. Results of hierarchical models obtained on the MIMIC-III Dis-50 dataset.
Micro F1 Macro F1 Micro AUC P@5
Dis-50
CNN 61.70 53.79 90.62 59.87
GRU 62.38 54.88 91.77 60.03
DR-CAML 67.68 63.74 93.47 63.48
MVC-LDA 65.21 60.06 92.29 62.41
MVC-RLDA 65.43 61.22 92.34 61.73
To assess the importance of the different components of the highest performing model onMIMIC-III Dis, an ablation study is conducted. The multi-view and the hierarchical componentare added and the regularization on long descriptions of the target ICD-codes is removed while allother components stay the same. The difference in performance is measured and visualized in Figure 8.Version July 24, 2020 submitted to Journal Not Specified 15 of 19
REMOVEregularization onlong descriptions
ADDMulti-view
ADDHierarchy
0
0.5
1
1.5
2
0.46
0.11
1.96
Perf
orm
ance
loss
(%M
icro
F1)
Figure 8. Ablation study on highest performing model (hierarchical MVC-RLDA) for MIMIC-IIIdataset.
Table 7. Results of flat models on top 50 codes obtained on the CodiEsp dataset.
Micro F1 Macro F1 Micro AUC P@5
CodiEsp
CNN 12.52 6.17 49.35 7.96GRU 11.54 11.03 50.54 7.68
DR-CAML 9.58 8.24 48.63 7.96MVC-LDA 10.84 6.23 49.26 4.17
MVC-RLDA 11.52 6.67 48.01 3.70
target space increases and more categories have fewer training examples, the added granularity of407
having multiple kernel sizes in the MVC-(R)LDA model pays off. Table 5 shows results for models408
trained on the Full dataset. The best performing model (MVC-LDA, 58.12%) gets outperformed by the409
best performing model for all labels on Dis (MVD-LDA, 59, 75%). The addition of the information in410
other medical documents than just discharge summaries thus seems to complicate instead of facilitate411
the classification process.412
Furthermore, comparing tables 3 and 6 where the influence of the hierarchical parameter can be413
assessed in a top-50 category setting, reveals a shift in the opposite direction. While in general, the414
modelling of the hierarchical relationships hurts the classification process for all categories, it hinders415
the multiview models the most. This time, DR-CAML is clearly the best performing model. Adding416
multiview and simultaneously modelling the hierarchical relationships between the target categories417
tend to make the model overfit on the training data.418
Looking at tables 7 and 8, it is clear that the lack of a sufficient amount of training data in CodiEsp419
(about 100 times less than for the Dis dataset) for most categories led to lower performance of all420
models on this dataset. For the flat variants of the models, a regular CNN even outperforms the more421
complex models. As the amount of training data is low, the added complexity of the latter models422
Table 8. Results of hierarchical models for top 50 codes obtained on the CodiEsp dataset.
Micro F1 Macro F1 Micro AUC P@5
CodiEsp
CNN 12.44 6.18 53.08 2.84GRU 11.87 11.50 50.14 7.68
DR-CAML 10.35 3.97 53.61 5.59MVC-LDA 13.00 2.79 60.76 11.94
MVC-RLDA 13.92 4.21 56.38 8.72
Figure 8. Ablation study on highest performing model (hierarchical MVC-RLDA) for MIMIC-III dataset.
5.2. CodiEsp
Similar experiments are carried out on the CodiEsp dataset, while only using the top 50 mostfrequent codes. The same hyperparameter settings are used as in Table 2. Results are visualized inTables 7 and 8. Results for the full target space are not reported, as 90% of the target categories wouldonly have 5 or less positive training examples. Furthermore, this would lead to a target space of1767 different categories with only 500 training examples in total, which makes training of a decentmodel unfeasible.
Table 7. Results of flat models on top 50 codes obtained on the CodiEsp dataset.
Micro F1 Macro F1 Micro AUC P@5
CodiEsp
CNN 12.52 6.17 49.35 7.96
GRU 11.54 11.03 50.54 7.68
DR-CAML 9.58 8.24 48.63 7.96
MVC-LDA 10.84 6.23 49.26 4.17
MVC-RLDA 11.52 6.67 48.01 3.70
Appl. Sci. 2020, 10, 5262 16 of 20
Table 8. Results of hierarchical models for top 50 codes obtained on the CodiEsp dataset.
Micro F1 Macro F1 Micro AUC P@5
CodiEsp
CNN 12.44 6.18 53.08 2.84
GRU 11.87 11.50 50.14 7.68
DR-CAML 10.35 3.97 53.61 5.59
MVC-LDA 13.00 2.79 60.76 11.94
MVC-RLDA 13.92 4.21 56.38 8.72
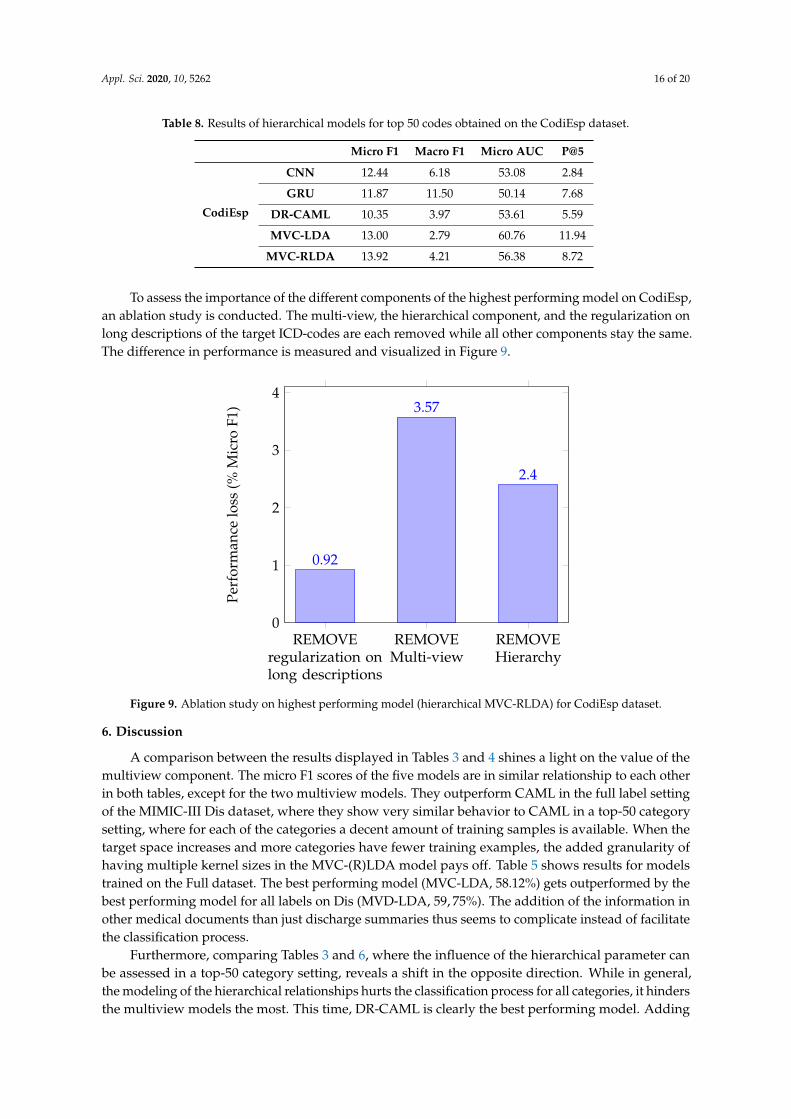
To assess the importance of the different components of the highest performing model on CodiEsp,an ablation study is conducted. The multi-view, the hierarchical component, and the regularization onlong descriptions of the target ICD-codes are each removed while all other components stay the same.The difference in performance is measured and visualized in Figure 9.Version July 24, 2020 submitted to Journal Not Specified 16 of 19
REMOVEregularization onlong descriptions
REMOVEMulti-view
REMOVEHierarchy
0
1
2
3
4
0.92
3.57
2.4
Perf
orm
ance
loss
(%M
icro
F1)
Figure 9. Ablation study on highest performing model (hierarchical MVC-RLDA) for CodiEsp dataset.
hinders them generalizing well for unseen data. Comparing the results in both tables also leads to the423
conclusion that in contrast to the results on MIMIC-III, on average the hierarchical component increases424
the classification performance based on Micro F1 on CodiEsp. Where the information embedded in425
the ICD taxonomy is redundant and even counteracting the performance for the larger MIMIC-III426
dataset, it is leveraged when there is a lack of information in the training data itself, which is the case427
for CodiEsp.428
Lastly, figures 8 and 9 display the relative importance of the long description regularization, the429
multi-view and the hierarchy for the top performing model on both the Dis and CodiEsp datasets. For430
the Dis dataset, not using the hierarchy is by far the most important component. The regularization431
on long descriptions still adds 0.46% and the multi-view almost does not influence the results. For432
CodiEsp, it shows that the multi-view component has the biggest influence, followed by the hierarchy,433
whose importance on this smaller dataset is already shown previously.434
7. Conclusions435
In this paper we have surveyed the current methods used for classification of clinical reports436
based on ICD codes using neural networks. We have combined the techniques already present in the437
literature and assessed the relative importance of all present components. Combining a convolutional438
framework with self-attention as well as regularizing the loss function with attention on the long439
descriptions of target ICD codes proved to be valuable. Furthermore, a hierarchical objective was440
integrated in all presented models. Its added value lies especially in a setting with low amounts of441
available training data. Lastly, extending the dataset with the information present in other medical442
documents introduced too much noise into the data, hindering the performance of the tested models.443
Concerning future research directions, it would be valuable to test the techniques on a ICD-10 or444
ICD-11 dataset of larger size. This would give better insights in which performance these models could445
achieve in current hospital settings. On a similar note, tackling the problem of lack of data by finding446
a way to combine the available training data from different datasets (e.g., MIMIC-III, CodiEsp) and447
different ontologies (e.g., ICD-9, ICD-10, MeSH) could further improve the classification performance448
of all models. Lastly, it would be interesting to investigate the use of hierarchical descriptions as an449
addition to the loss function, giving another use for the information inherently present in the ICD450
taxonomy.451
Figure 9. Ablation study on highest performing model (hierarchical MVC-RLDA) for CodiEsp dataset.
6. Discussion
A comparison between the results displayed in Tables 3 and 4 shines a light on the value of themultiview component. The micro F1 scores of the five models are in similar relationship to each otherin both tables, except for the two multiview models. They outperform CAML in the full label settingof the MIMIC-III Dis dataset, where they show very similar behavior to CAML in a top-50 categorysetting, where for each of the categories a decent amount of training samples is available. When thetarget space increases and more categories have fewer training examples, the added granularity ofhaving multiple kernel sizes in the MVC-(R)LDA model pays off. Table 5 shows results for modelstrained on the Full dataset. The best performing model (MVC-LDA, 58.12%) gets outperformed by thebest performing model for all labels on Dis (MVD-LDA, 59, 75%). The addition of the information inother medical documents than just discharge summaries thus seems to complicate instead of facilitatethe classification process.
Furthermore, comparing Tables 3 and 6, where the influence of the hierarchical parameter canbe assessed in a top-50 category setting, reveals a shift in the opposite direction. While in general,the modeling of the hierarchical relationships hurts the classification process for all categories, it hindersthe multiview models the most. This time, DR-CAML is clearly the best performing model. Adding

Appl. Sci. 2020, 10, 5262 17 of 20
multiview and simultaneously modeling the hierarchical relationships between the target categoriestend to make the model overfit on the training data.
Looking at Tables 7 and 8, it is clear that the lack of a sufficient amount of training data in CodiEsp(about 100 times less than for the Dis dataset) for most categories led to lower performance of allmodels on this dataset. For the flat variants of the models, a regular CNN even outperforms the morecomplex models. As the amount of training data is low, the added complexity of the latter modelshinders them generalizing well for unseen data. Comparing the results in both tables also leads to theconclusion that in contrast to the results on MIMIC-III, on average the hierarchical component increasesthe classification performance based on Micro F1 on CodiEsp. Where the information embedded inthe ICD taxonomy is redundant and even counteracting the performance for the larger MIMIC-IIIdataset, it is leveraged when there is a lack of information in the training data itself, which is the casefor CodiEsp.
Last, Figures 8 and 9 display the relative importance of the long description regularization,the multi-view. and the hierarchy for the top performing model on both the Dis and CodiEspdatasets. For the Dis dataset, not using the hierarchy is by far the most important component.The regularization on long descriptions still adds 0.46% and the multi-view almost does not influencethe results. For CodiEsp, it shows that the multi-view component has the biggest influence, followedby the hierarchy, whose importance on this smaller dataset is already shown previously.
7. Conclusions
In this paper, we have surveyed the current methods used for classification of clinical reportsbased on ICD codes using neural networks. We have combined the techniques already present in theliterature and assessed the relative importance of all present components. Combining a convolutionalframework with self-attention as well as regularizing, the loss function with attention on the longdescriptions of target ICD codes proved to be valuable. Furthermore, a hierarchical objective wasintegrated in all presented models. Its added value lies especially in a setting with low amounts ofavailable training data. Last, extending the dataset with the information present in other medicaldocuments introduced too much noise into the data, hindering the performance of the tested models.
Concerning future research directions, it would be valuable to test the techniques on a ICD-10 orICD-11 dataset of larger size. This would give better insights into which performance these modelscould achieve in current hospital settings. On a similar note, tackling the problem of lack of databy finding a way to combine the available training data from different datasets (e.g., MIMIC-IIIand CodiEsp) and different ontologies (e.g., ICD-9, ICD-10, and MeSH) could further improvethe classification performance of all models. Last, it would be interesting to investigate the useof hierarchical descriptions as an addition to the loss function, giving another use for the informationinherently present in the ICD taxonomy.
Author Contributions: Conceptualization, E.M. and M.-F.M.; Methodology, E.M. and M.-F.M.; Software, E.M.,A.A. and A.K.; Validation, E.M., A.A. and A.K.; Formal Analysis, E.M. and M.-F.M.; Investigation, E.M.; Resources,A.K.; Data Curation, A.K.; Writing-Original Draft Preparation, E.M. and M.-F.M.;Writing-Review Editing, E.M.,A.A., A.K. and M.-F.M..; Visualization, E.M.; Supervision, M.-F.M.; Project Administration, A.A. and M.-F.M.;Funding Acquisition, M.-F.M. All authors have read and agreed to the published version of the manuscript.
Funding: This research was funded by the VLAIO SBO project, grant number 150056. M.-F.M. is co-funded by theERC Advanced Grant CALCULUS H2020-ERC-2017-ADG 788506.
Conflicts of Interest: Authors declare no conflicts of interest.
References
1. Larkey, L.; Croft, W.B. Automatic Assignment of ICD9 Codes To Discharge Summaries; Technical Report;University of Massachusetts: Amherst, MA, USA, 1995.
2. Johnson, A.E.W.; Pollard, T.J.; Shen, L.; Lehman, L.w.H.; Feng, M.; Ghassemi, M.; Moody, B.; Szolovits, P.;Anthony Celi, L.; Mark, R.G. MIMIC-III, a freely accessible critical care database. Sci. Data 2016, 3, 1–9.
Appl. Sci. 2020, 10, 5262 18 of 20
3. Larkey, L.S.; Croft, W.B. Combining classifiers in text categorization. In Proceedings of the 19th AnnualInternational ACM SIGIR Conference on Research and Development in Information Retrieval, Zurich,Switzerland, 18–22 August 1996; (Special Issue of the SIGIRForum); pp. 289–297.
4. Goldstein, I.; Arzumtsyan, A.; Özlem, U. Three approaches to automatic assignment of ICD-9-CM codes toradiology reports. In Proceedings of the AMIA Annual Symposium; American Medical Informatics Association:Washington, DC, USA, 2007; pp. 279–283.
5. Farkas, R.; Szarvas, G. Automatic construction of rule-based ICD-9-CM coding systems. BMC Bioinform.2008, 9 (Suppl. 3), S10.
6. Marafino, B.J.; Davies, J.M.; Bardach, N.S.; Dean, M.L.; Dudley, R.A. N-gram support vector machines forscalable procedure and diagnosis classification, with applications to clinical free text data from the intensivecare unit. J. Am. Med. Inform. Assoc. 2014, 21, 871–875.
7. Stanfill, M.; Williams, M.; Fenton, S.; Jenders, R.; Hersh, W. A systematic literature review of automatedclinical coding and classification systems. J. Am. Med. Inform. Assoc. JAMIA 2010, 17, 646–651.
8. Kavuluru, R.; Rios, A.; Lu, Y. An empirical evaluation of supervised learning approaches in assigningdiagnosis codes to electronic medical records. Artif. Intell. Med. 2015, 65, 155–166.
9. Scheurwegs, E.; Cule, B.; Luyckx, K.; Luyten, L.; Daelemans, W. Selecting relevant features from theelectronic health record for clinical code prediction. J. Biomed. Inform. 2017, 74, 92–103.
10. Leo, M.; Furnari, A.; Medioni, G.G.; Trivedi, M.M.; Farinella, G.M. Deep Learning for Assistive ComputerVision. In Proceedings of the Computer Vision—ECCV 2018 Workshops—Part VI, Munich, Germany, 8–14September 2018; pp. 3–14.
11. Shickel, B.; Tighe, P.; Bihorac, A.; Rashidi, P. Deep EHR: A survey of recent advances in deep learningtechniques for electronic health record (EHR) analysis. IEEE J. Biomed. Health Inform. 2018, 22, 1589–1604.
12. Kelly, L.; Suominen, H.; Goeuriot, L.; Neves, M.; Kanoulas, E.; Li, D.; Azzopardi, L.; Spijker, R.; Zuccon, G.;Scells, H.; et al. Overview of the CLEF eHealth Evaluation Lab 2019. In International Conference of theCross-Language Evaluation Forum for European Languages; Springer: Cham, Switzerland, 2019; pp. 322–339.
13. Shi, H.; Xie, P.; Hu, Z.; Zhang, M.; Xing, E.P. Towards automated ICD coding using deep learning. arXiv2017, arXiv:1711.04075.
14. Duarte, F.; Martins, B.; Pinto, C.S.; Silva, M.J. Deep neural models for ICD-10 coding of death certificates andautopsy reports in free-text. J. Biomed. Inform. 2018, 80, 64–77.
15. Xie, P.; Xing, E. A neural architecture for automated ICD coding. In Proceedings of the 56th Annual Meeting ofthe Association for Computational Linguistics (Volume 1: Long Papers); ACL: Melbourne, Australia, 2018.
16. Huang, J.; Osorio, C.; Sy, L.W. An empirical evaluation of deep learning for ICD-9 code assignment usingMIMIC-III clinical notes. Comput. Methods Prog. Biomed. 2019, 177, 141–153.
17. Li, M.; Fei, Z.; Zeng, M.; Wu, F.; Li, Y.; Pan, Y.; Wang, J. Automated ICD-9 coding via a deep learningapproach. IEEE/ACM Trans. Comput. Biol. Bioinform. 2019, 16, 1193–1202.
18. Xu, K.; Lam, M.; Pang, J.; Gao, X.; Band, C.; Mathur, P.; Papay, F.; Khanna, A.K.; Cywinski, J.B.;Maheshwari, K.; et al. Multimodal machine learning for automated ICD coding. In Proceedings of the4th Machine Learning for Healthcare Conference; Doshi-Velez, F., Fackler, J., Jung, K., Kale, D., Ranganath, R.,Wallace, B., Wiens, J., Eds.; PMLR: Ann Arbor, MI, USA, 2019; Volume 106, pp. 197–215.
19. Quinlan, J.R. Induction of decision trees. Mach. Learn. 1986, 1, 81–106.20. Wang, G.; Li, C.; Wang, W.; Zhang, Y.; Shen, D.; Zhang, X.; Henao, R.; Carin, L. Joint embedding of words
and labels for text classification. In Proceedings of the 56th Annual Meeting of the Association for ComputationalLinguistics (Volume 1: Long Papers); ACL: Melbourne, Australia, 2018.
21. Zeng, M.; Li, M.; Fei, Z.; Yu, Y.; Pan, Y.; Wang, J. Automatic ICD-9 coding via deep transfer learning.Neurocomputing 2018, 324, 43–50.
22. Baumel, T.; Nassour-Kassis, J.; Elhadad, M.; Elhadad, N. Multi-Label Classification of Patient Notes: A CaseStudy on ICD Code Assignment. In Proceedings of the Workshops at the Thirty-Second AAAI Conferenceon Artificial Intelligence, Hilton, NO, USA, 2–7 February 2018.

Appl. Sci. 2020, 10, 5262 19 of 20
23. Mullenbach, J.; Wiegreffe, S.; Duke, J.; Sun, J.; Eisenstein, J. Explainable prediction of medical codesfrom clinical text. In Proceedings of the 2018 Conference of the North American Chapter of the Association forComputational Linguistics: Human Language Technologies, Volume 1 (Long Papers); ACL: New Orleans, LA,USA, 2018.
24. Sadoughi, N.; Finley, G.P.; Fone, J.; Murali, V.; Korenevski, M.; Baryshnikov, S.; Axtmann, N.; Miller, M.;Suendermann-Oeft, D. Medical code prediction with multi-view convolution and description-regularizedlabel-dependent attention. arXiv 2018, arXiv:1811.01468.
25. Amin, S.; Neumann, G.; Dunfield, K.; Vechkaeva, A.; Chapman, K.A.; Wixted, M.K. MLT-DFKI at CLEFeHealth 2019: Multi-label classification of ICD-10 codes with BERT. In Proceedings of the Working Notes ofCLEF 2019—Conference and Labs of the Evaluation, Forum, Lugano, Switzerland, 9–12 September 2019.
26. Campbell, S.; Giadresco, K. Computer-assisted clinical coding: A narrative review of the literature on itsbenefits, limitations, implementation and impact on clinical coding professionals. Health Inf. Manag. J. 2019,49, 183335831985130.
27. Deschacht, K.; Moens, M. Efficient hierarchical entity classifier using conditional random fields.In Proceedings of the 2nd Workshop on Ontology Learning and Population: Bridging the Gap between Textand Knowledge@COLING/ACL 2006, Sydney, Australia, 22 July 2006; pp. 33–40.
28. Babbar, R.; Partalas, I.; Gaussier, É.; Amini, M. On flat versus hierarchical classification in large-scaletaxonomies. In Proceedings of the Advances in Neural Information Processing Systems 26: Proccedings ofthe 27th Annual Conference on Neural Information Processing Systems 2013, Lake Tahoe, NV, USA, 5–8December 2013; pp. 1824–1832.
29. Gopal, S.; Yang, Y. Recursive Regularization for Large-Scale Classification with Hierarchical and GraphicalDependencies; Association for Computing Machinery: New York, NY, USA, 2013.
30. Cai, L.; Hofmann, T. Hierarchical document categorization with support vector machines. In Proceedings ofthe Thirteenth ACM International Conference on Information and Knowledge Management, Washington,DC, USA, 8–13 November 2004.
31. Jati, A.; Kumar, N.; Chen, R.; Georgiou, P. Hierarchy-aware loss function on a tree structured label space foraudio event detection. In Proceedings of the ICASSP 2019–2019 IEEE International Conference on Acoustics,Speech and Signal Processing (ICASSP), Brighton, UK, 12–17 May 2019; pp. 6–10.
32. Perotte, A.; Pivovarov, R.; Natarajan, K.; Weiskopf, N.; Wood, F.; Elhadad, N. Diagnosis code assignment:Models and evaluation metrics. J. Am. Med. Inform. Assoc. 2014, 21, 231–237.
33. Mohammed, A.A.; Umaashankar, V. Effectiveness of hierarchical softmax in large scale classification tasks.In Proceedings of the 2018 International Conference on Advances in Computing, Communications andInformatics (ICACCI), Bangalore, India, 19–22 September 2018; pp. 1090–1094.
34. Wehrmann, J.; Cerri, R.; Barros, R. Hierarchical multi-label classification networks. In Proceedingsof the Thirty-Fifth International Conference on Machine Learning, Stockholm, Sweden, 10–15 July 2018;pp. 5075–5084.
35. Silla, C.N.; Freitas, A.A. A survey of hierarchical classification across different application domains. Data Min.Knowl. Discov. 2011, 22, 31–72.
36. Kowsari, K.; Brown, D.E.; Heidarysafa, M.; Meimandi, K.J.; Gerber, M.S.; Barnes, L.E. HDLTex: HierarchicalDeep Learning for Text Classification. In Proceedings of the 2017 16th IEEE International Conference onMachine Learning and Applications, Cancun, Mexico, 18–21 December 2017.
37. Yang, Y.; Zhang, J.; Kisiel, B. A scalability analysis of classifiers in text categorization. In Proceedings of the26th Annual International ACM SIGIR Conference on Research and Development in Informaion Retrieval,Toronto, ON, Canada, 28 July–1 August 2003; pp. 96–103.
38. Babbar, R.; Metzig, C.; Partalas, I.; Gaussier, E.; Amini, M.R. On power law distributions in large-scaletaxonomies. ACM Sigkdd Explor. Newsl. 2014, 16, 47–56.
39. Miranda-Escalada, A.; Gonzalez-Agirre, A.; Krallinger, M. CodiEsp Corpus: Spanish Clinical Cases Coded inICD10 (CIE10)—eHealth CLEF2020. Available online: https://zenodo.org/record/3758054#.XxXGgy17E6h(accessed on 29 July 2020).
40. Chung, J.; Gulcehre, C.; Cho, K.; Bengio, Y. Empirical evaluation of gated recurrent neural networks onsequence modeling. arXiv 2014, arXiv:1412.3555.
Appl. Sci. 2020, 10, 5262 20 of 20
41. Yin, W.; Kann, K.; Yu, M.; Schütze, H. Comparative study of CNN and RNN for natural language processing.arXiv 2017, arXiv:1702.01923.
42. Kaiser, Ł.; Sutskever, I. Neural GPUs learn algorithms. arXiv 2015, arXiv:1511.08228.
c© 2020 by the authors. Licensee MDPI, Basel, Switzerland. This article is an open accessarticle distributed under the terms and conditions of the Creative Commons Attribution(CC BY) license (http://creativecommons.org/licenses/by/4.0/).