Embed Size (px)
Citation preview
American Institute of Aeronautics and Astronautics
1
A Framework for Incorporating “ilities” in Tradespace
Studies
Hugh L. McManus,* Matthew G. Richards,† Adam M. Ross,‡ and Daniel E. Hastings§ Massachusetts Institute of Technology, Cambridge, MA 02139
Non-traditional design criteria such as flexibility, robustness, survivability and others
(collectively referred to as the “ilities”) are increasingly recognized as critical system
properties for the success of aerospace programs. While most decision makers would agree
that the ilities are important system properties, they are neither well-defined nor easily
evaluated in isolation. While some evaluation methodologies do exist (e.g., real options for
flexibility), there is a need for a holistic framework for describing systems with these
properties. This paper will explore the use of these “ilities” properties as selection criteria in
tradespace studies. A framework is described that can be used to incorporate ilities into
conceptual design and tradespace studies in a systematic way. The framework is based on
describing ilities in terms of changes in three dimensions: changes in the context, changes in
the needs, and changes in the systems itself. The ilities are then interpreted as methods of
navigating changes in this space. Quantitative analysis can be accomplished through
Epoch/Era Analysis linking multiple discrete tradespace studies into a coherent timeline. An
extended example is presented to demonstrate an analysis and visualization of the
survivability of a space tug system to LEO orbital debris over a ten year lifetime. The results
indicate that passive shielding for satellites in LEO provides only marginal benefit, at best,
given the debris distribution. The smaller satellite designs in the tradespace display an
unfavorable tradeoff of cost versus survivability. The example case study is a simple
application of the framework, and points out the potential challenges of displaying
multidimensional, non-aggregate data in “ilities” dynamic tradespace studies. The
framework and case study suggest that using Epoch/Era Analysis, “ilities” will emerge as
properties describing how systems change across epochs, and can be prescribed as visual
and quantitative strategies that can be traded in terms of benefit and cost over time.
Nomenclature
m = projectile mass in g Pi = probability of continuing to function after epoch i S = spacing between bumper shields in cm Ti = duration of epoch i tb = thickness of the backup sheet required for there to be no deflection, rupture, or spalling Ulifetime = lifetime utility Ui = utility generated per unit time during epoch i v = projectile velocity in km/s
I. Introduction
on-traditional design criteria, such as flexibility, robustness, survivability and others (collectively referred to as the “ilities”), are increasingly recognized as critical system properties for the success of aerospace programs.1
While most decision makers would agree that the ilities are important system properties, they are neither well-defined nor easily evaluated in isolation. While some evaluation methodologies do exist (e.g., real options for
* Senior Special Projects Engineer, Metis Design, 10 Canal Pk., Cambridge, MA 021401, [email protected]. Associate Fellow AIAA. † Research Assistant, Engineering Systems Division, 41-205, 77 Massachusetts Ave., [email protected]. Member AIAA. ‡ Research Scientist, Engineering Systems Division, NE20-388, 77 Massachusetts Ave, [email protected]. Member AIAA. § Professor of Aeronautics and Astronautics and Engineering Systems, Dean for Undergraduate Education, 4-110, 77 Massachusetts Ave., [email protected]. Fellow AIAA.
N
American Institute of Aeronautics and Astronautics
2
flexibility2,3), there is a need for a holistic framework for describing systems with these properties. We will consider those ilities that can be described as system properties that specify the degree to which systems are able to maintain or even improve function in the presence of change.* Previous work has defined and quantified some ilities, providing models for describing non-traditional properties.4 This work has inspired additional considerations of how the ilities manifest themselves in the design process.
The issue we will explore in this paper is the use of these non-traditional properties as decision-aid criteria in trade studies. A framework is described that can be used to incorporate ilities into preliminary design and tradespace studies in a systematic way. We will center the discussion on multi-attribute tradespace exploration for conceptual design,5,6 but the results should be applicable to most trade study techniques. The framework is based on describing ilities in terms of changes in three dimensions: changes in the environment or Context, changes in the user expectations or Needs, and changes in the form of the Systems themselves. Change implies a fourth dimension, that of Time. The ilities are then interpreted as methods of navigating changes in this space. The framework is introduced through a series of examples demonstrating how various ilities manifest themselves as motion in the “ilities space.”
The examples are followed by a discussion of how this understanding of ilities could be used to incorporate them into a multi-attribute utility tradespace. It is found that the ilities do not fit the definition of an independent system attribute (for the reason that they are not independent attributes but descriptions of the variation of the attributes with time and conditions); thus, they cannot be combined with other attributes into a multi-attribute utility or other single selection criteria. In simple terms, the system attributes express the performance of the system while the ilities reflect the ability of the system to deliver continued or enhanced attributes across a number of possible future scenarios.
An extended example is then presented to illustrate the incorporation of an ility in the exploration of a tradespace. In particular, the survivability of a space system is evaluated using a simple tradespace and a conceptualization of survivability based on a recent paper.7 The system evaluated is a space tug, for which an existing, well understood tradespace model is available.8 The survivability is defined in terms of sustained tug performance in an orbit with a hypothetical impact threat. While passive (hardening) and active (situational awareness and maneuvering) design solutions exist, modeling activities focus on the employment of bumper shielding to improve spacecraft survivability. Parametrically-varied designs are then evaluated for the effect of the shielding on value delivery and cost incurred in a baseline utility analysis. Survivability is then evaluated in terms of the probability of continued delivery of value following the threat environment. Methods of evaluating the utility of survivability to a variety of stakeholders and the difficulty of making decisions and tradeoffs incorporating both nominal-case utility and survivability are discussed.
Finally, the lessons of the examples are generalized, and implications for the theory of space system design and practical implications for practitioners are explored. In the current, rapidly changing environment for space systems, the ilities are intuitively valuable. The framework proposed here represents a step in the direction of reducing this intuition to a set of rational choices for decision makers, based on the impact of the ilities on future value delivery and their costs.
II. Defining and Visualizing the Ilities
As defined here, the ilities have in common the concept of “change.” It is the “what is changing” aspect that can be used to differentiate among the ilities. System success is defined in relation to three primary factors: the expectations on the system (Needs), the development and operational environment of the system (Context), and the system form (System). The dynamics among these three factors determine the perceived success of the system. The “ilities” of a system address the ability of the system to cope with changes in these factors. Assuming a system-centric perspective, the ilities provide a strategy for system change in response to changes in needs and context. Changes in context are usually external constraints on the system: it must operate successfully in the new context. Changes in needs may include increased expectations on the system (a demand for higher levels of the same service) or changes in the metrics of success (some new function is demanded of the system). To be successful, the system must deliver more, less, or different, value as needs change. It is important to recognize that a system designer typically only has influence over a system’s form; the form as mediated by the operational environment determines the system’s performance, and if the performance meets the expectations, the system is perceived to be successful and hence deliver value to its stakeholders.
* This implicitly excludes some ilities, such as manufacturability, that affect the design of the system but not its operation.
American Institute of Aeronautics and Astronautics
3
A. Defining Ilities The variety of “ilities” system properties in the literature need to be clarified in an analytic frame in order to be
useful to a system analyst. The following sets of “ilities” system properties all relate to system dynamics. “Change” is the common thread that links them together. 1. Robustness is the ability of a system to maintain its level and set of specification parameters in the context of
changing system external and internal forces. Robustness is determined by the sensitivity of chosen system specification parameters to context changes. A particular type of robustness, value robustness, is the ability of the system to maintain value delivery in the context of changing system external and internal forces, including stakeholder expectations. A value-robust system will be perceived to be successful to the stakeholders who continue to receive value from the system. It is important to note that value robustness can be achieved through system change or lack of system change. For example, if stakeholder expectations increase, such as having a longer useful system life, a value-robust system would be able to meet those new expectations, possibly achieved through over-design—lack of change—or through active life extension—requiring a system change.
2. Versatility is the ability of a system to satisfy diverse expectations on the system without the need for changing form. It is a measure of a system’s inherent, or latent, value to a possibly diverse set of expectations over time.
3. Changeability is the ability of a system to alter its form—and consequently possibly its function—at an acceptable level of resource expenditure.9 Examples of resource expenditures include time, money, materials, and level of effort. Flexibility and adaptability are descriptors of changeability in classifying the location of the change agent instigating the change in form. Scalability and modifiability are descriptors of changeability in classifying the effect of the form change on the system. As such, these “ilities” are only counted when the ability to perform the change can occur at acceptable levels of resource expenditure (i.e., the change does not take too long or cost too much).
4. Flexibility is the ability of a system to be changed by a system-external change agent. Adaptability is the ability of a system to be changed by a system-internal change agent. The system boundary definition serves to distinguish between a flexible-type change and an adaptable-type change.
5. Scalability is the ability of a system to change the current level of a system specification parameter. Modifiability is the ability of a system to change the current set of system specification parameters. Typically, questions of scalability or modifiability are asked regarding the form or function of a system. For example, does the satellite constellation scale in number of satellites (form) or spatial resolution (function)? Likewise, modifiability can be asked on form or function. For example, can the satellite take on a new payload (form) or new observation type (function)?
6. Survivability is traditionally defined in military systems as the capability to avoid or withstand a hostile environment. For example, Ref. 10 analyzes design techniques, armaments, and tactics for combat aircraft survivability. Survivability is enhanced by both reductions in the susceptibility of systems to disturbances (e.g., stealth, maneuverability) and reductions in the vulnerability of systems to disturbances (e.g., redundant flight controls and surfaces, independent fuel feed tanks). More generally, survivability may be defined as the ability of a system to minimize the impact of a finite disturbance on value delivery.11 Consistent with Ref. 10’s formulation, survivability may be achieved through either (1) the reduction of the likelihood or magnitude of a disturbance (Type I survivability) or (2) the satisfaction of a minimally acceptable level of value delivery during and after a finite disturbance (Type II survivability).
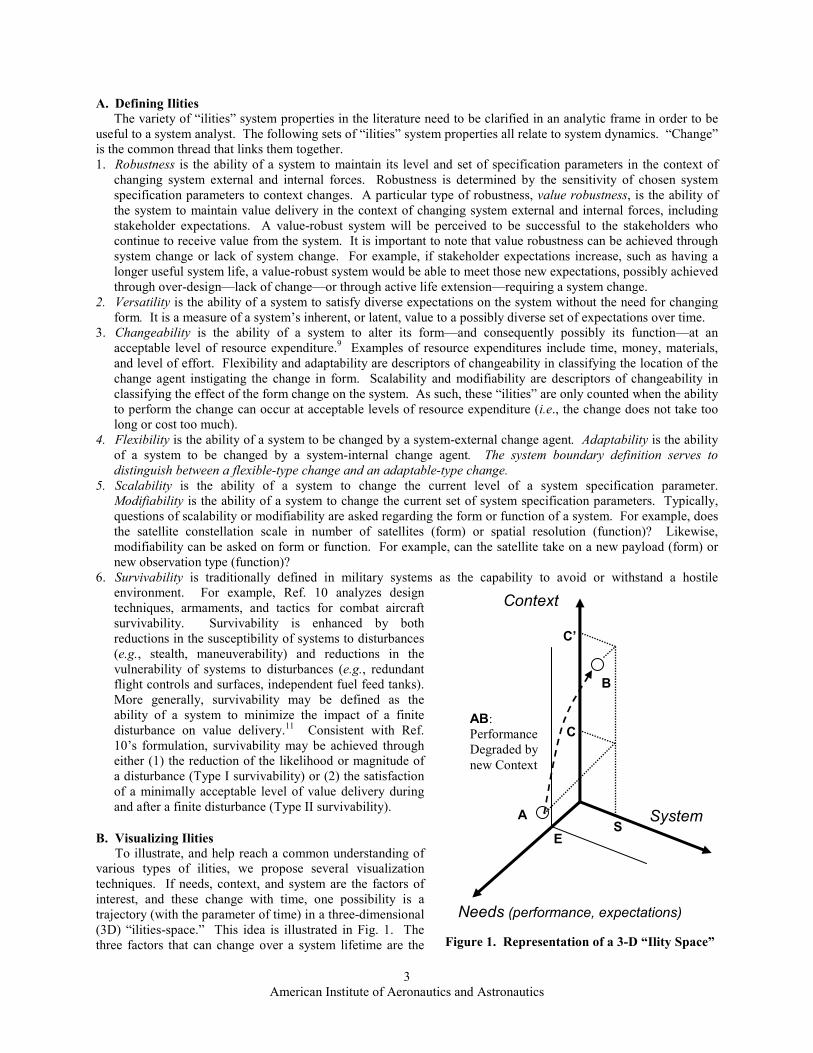
B. Visualizing Ilities To illustrate, and help reach a common understanding of
various types of ilities, we propose several visualization techniques. If needs, context, and system are the factors of interest, and these change with time, one possibility is a trajectory (with the parameter of time) in a three-dimensional (3D) “ilities-space.” This idea is illustrated in Fig. 1. The three factors that can change over a system lifetime are the
Context
A
C
S
B
AB: Performance Degraded by
new Context
C’
E
Needs (performance, expectations)
System
Figure 1. Representation of a 3-D “Ility Space”
American Institute of Aeronautics and Astronautics
4
system itself (an object or group of objects in physical space, representing hardware designs but also more abstract parts of the system such as software or operating procedures); the needs of stakeholders (a perceived abstraction in the minds of the stakeholders, often represented by utilities), and the context (most abstractly, the development and operational space outside of the system boundary, represented as constraints, both explicit and embedded in the modeling of the physical reality in which the system operates). Note that these are not single-dimensional axes per se; only in an extremely simple case (one monotonic variable on each axis) could one actually plot anything quantitatively in this space. For a given context and system state, the performance is determined in the same units or language as the needs. If the performance exceeds the expectation level of the relevant stakeholders (enough needs are met) then the system is considered successful.
In Fig. 1, a system with configuration S operates in a context C. Its performance is determined and plotted along the Needs axis such that the system’s position in the space is A. This point is in front of the iso-needs plane determined by the expectations of the users, E, so the system is successful. However, if the context changes to C’, the performance of the unmodified system is now determined to be B, which does not meet expectations. The system’s performance has been unacceptably degraded by the change in context. We can imagine that, over the lifetime of a system, it will trace a trajectory through this space. A successful system will perform at or above the (possibly changing) user expectations throughout its lifetime. This representation is useful for abstract thinking about the interactions between shifting needs, contexts, and system configurations over time. For further discussion on the 3-D “Ility Space” visualization approach, a working paper of the SEAri group at MIT provides more examples.12
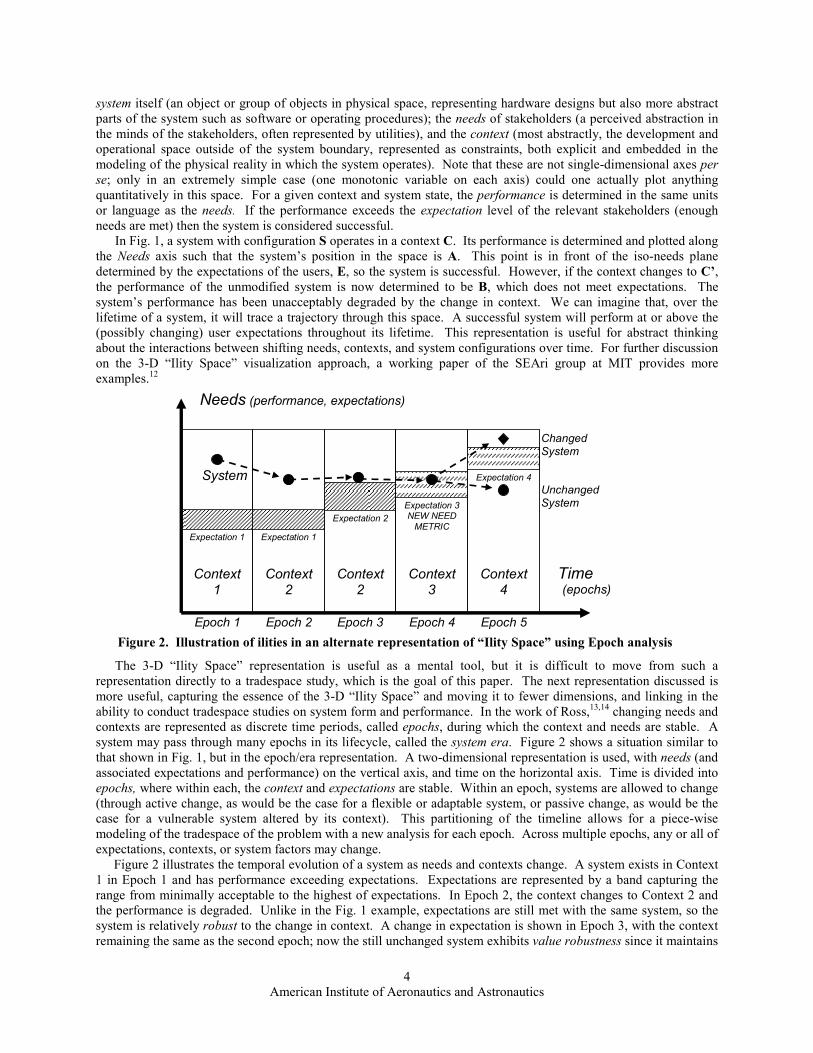
The 3-D “Ility Space” representation is useful as a mental tool, but it is difficult to move from such a representation directly to a tradespace study, which is the goal of this paper. The next representation discussed is more useful, capturing the essence of the 3-D “Ility Space” and moving it to fewer dimensions, and linking in the ability to conduct tradespace studies on system form and performance. In the work of Ross,13,14 changing needs and contexts are represented as discrete time periods, called epochs, during which the context and needs are stable. A system may pass through many epochs in its lifecycle, called the system era. Figure 2 shows a situation similar to that shown in Fig. 1, but in the epoch/era representation. A two-dimensional representation is used, with needs (and associated expectations and performance) on the vertical axis, and time on the horizontal axis. Time is divided into epochs, where within each, the context and expectations are stable. Within an epoch, systems are allowed to change (through active change, as would be the case for a flexible or adaptable system, or passive change, as would be the case for a vulnerable system altered by its context). This partitioning of the timeline allows for a piece-wise modeling of the tradespace of the problem with a new analysis for each epoch. Across multiple epochs, any or all of expectations, contexts, or system factors may change.
Figure 2 illustrates the temporal evolution of a system as needs and contexts change. A system exists in Context 1 in Epoch 1 and has performance exceeding expectations. Expectations are represented by a band capturing the range from minimally acceptable to the highest of expectations. In Epoch 2, the context changes to Context 2 and the performance is degraded. Unlike in the Fig. 1 example, expectations are still met with the same system, so the system is relatively robust to the change in context. A change in expectation is shown in Epoch 3, with the context remaining the same as the second epoch; now the still unchanged system exhibits value robustness since it maintains
Needs (performance, expectations)
Time (epochs)
Context 1
Context 2
Context 2
Context 3
Context 4
Expectation 1 Expectation 1 Expectation 2
Expectation 3 NEW NEED METRIC
Expectation 4 System
Changed System
Unchanged System
Epoch 1 Epoch 2 Epoch 3 Epoch 4 Epoch 5
Figure 2. Illustration of ilities in an alternate representation of “Ility Space” using Epoch analysis
American Institute of Aeronautics and Astronautics
5
value delivery in spite of changes in expectations. In Epoch 4, the system shows versatility by continuing to satisfy expectations despite the introduction of a new metric of need. Notice that even though the system no longer exceeds all expectations, it still does exceed the minimally acceptable level and thus is still successful. Finally, in Epoch 5, a change in context and a boost in expectations are too much for the system as-is; in this case the system must change in order to remain successful. If the system is capable of changing at acceptable cost, it is deemed flexible or adaptable, depending on the type of change desired.
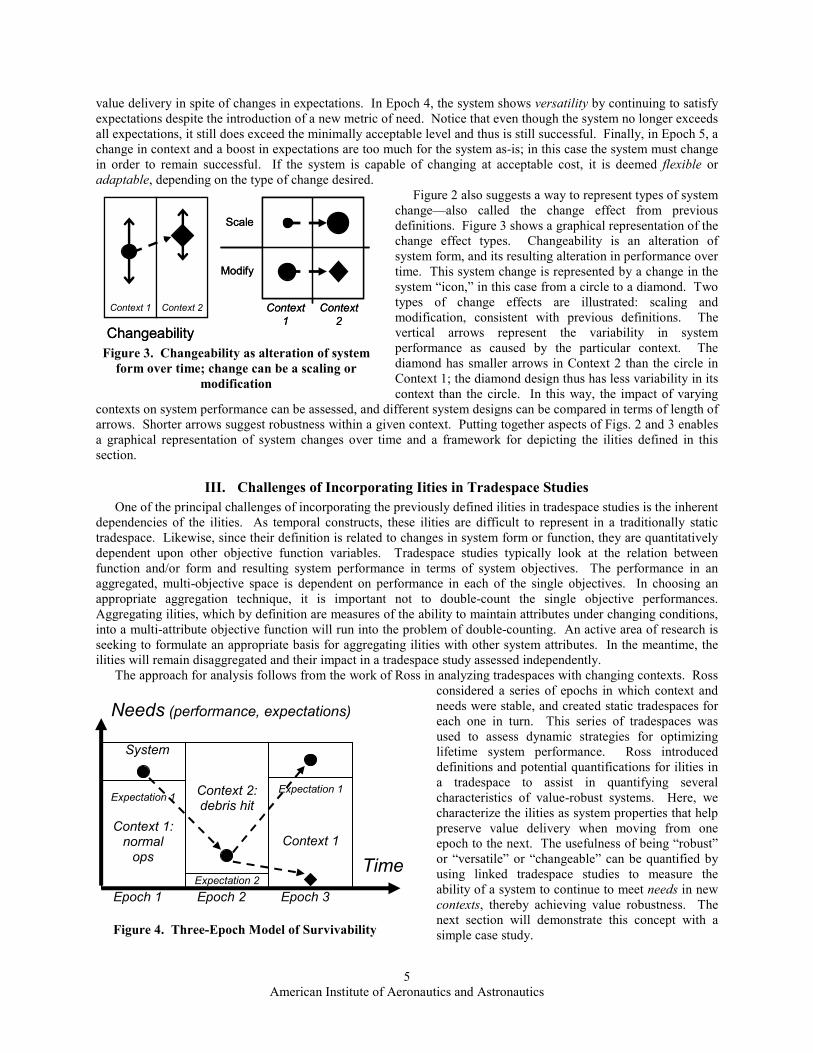
Figure 2 also suggests a way to represent types of system change—also called the change effect from previous definitions. Figure 3 shows a graphical representation of the change effect types. Changeability is an alteration of system form, and its resulting alteration in performance over time. This system change is represented by a change in the system “icon,” in this case from a circle to a diamond. Two types of change effects are illustrated: scaling and modification, consistent with previous definitions. The vertical arrows represent the variability in system performance as caused by the particular context. The diamond has smaller arrows in Context 2 than the circle in Context 1; the diamond design thus has less variability in its context than the circle. In this way, the impact of varying
contexts on system performance can be assessed, and different system designs can be compared in terms of length of arrows. Shorter arrows suggest robustness within a given context. Putting together aspects of Figs. 2 and 3 enables a graphical representation of system changes over time and a framework for depicting the ilities defined in this section.
III. Challenges of Incorporating Iities in Tradespace Studies
One of the principal challenges of incorporating the previously defined ilities in tradespace studies is the inherent dependencies of the ilities. As temporal constructs, these ilities are difficult to represent in a traditionally static tradespace. Likewise, since their definition is related to changes in system form or function, they are quantitatively dependent upon other objective function variables. Tradespace studies typically look at the relation between function and/or form and resulting system performance in terms of system objectives. The performance in an aggregated, multi-objective space is dependent on performance in each of the single objectives. In choosing an appropriate aggregation technique, it is important not to double-count the single objective performances. Aggregating ilities, which by definition are measures of the ability to maintain attributes under changing conditions, into a multi-attribute objective function will run into the problem of double-counting. An active area of research is seeking to formulate an appropriate basis for aggregating ilities with other system attributes. In the meantime, the ilities will remain disaggregated and their impact in a tradespace study assessed independently.
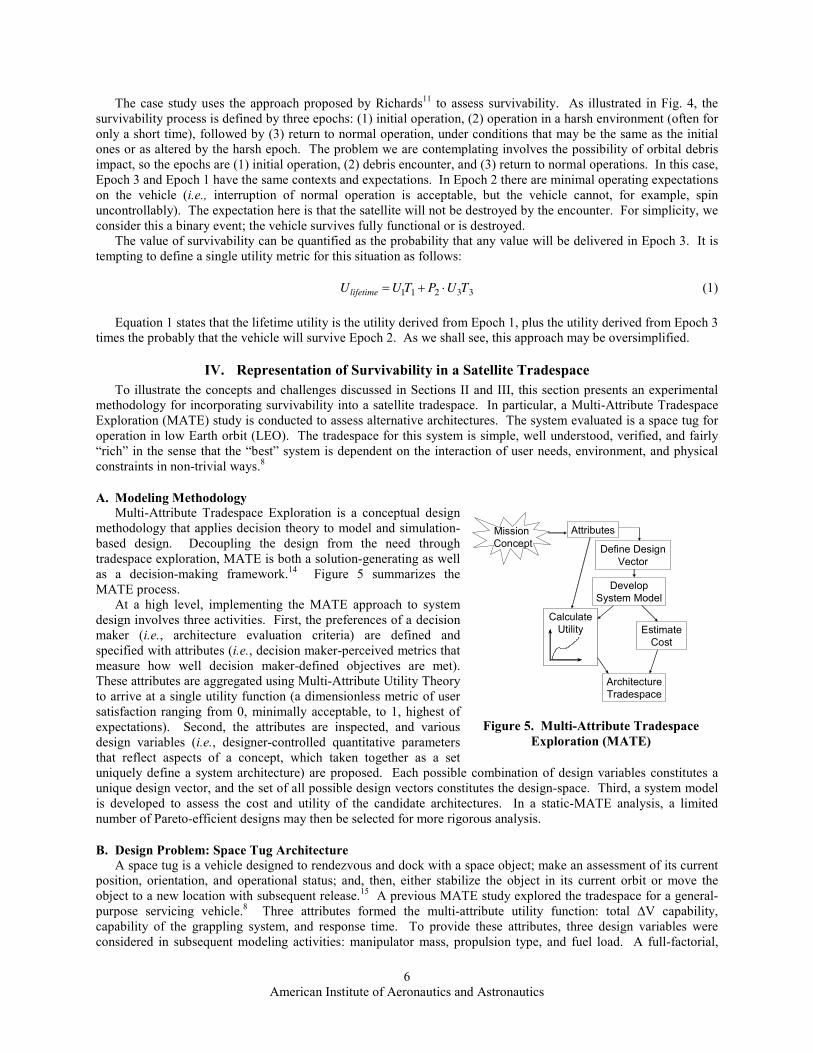
The approach for analysis follows from the work of Ross in analyzing tradespaces with changing contexts. Ross considered a series of epochs in which context and needs were stable, and created static tradespaces for each one in turn. This series of tradespaces was used to assess dynamic strategies for optimizing lifetime system performance. Ross introduced definitions and potential quantifications for ilities in a tradespace to assist in quantifying several characteristics of value-robust systems. Here, we characterize the ilities as system properties that help preserve value delivery when moving from one epoch to the next. The usefulness of being “robust” or “versatile” or “changeable” can be quantified by using linked tradespace studies to measure the ability of a system to continue to meet needs in new contexts, thereby achieving value robustness. The next section will demonstrate this concept with a simple case study.
Context 1 Context 2
Changeability
Context 1 Context 2
Changeability
Scale
Modify
Context
1
Context
2
Scale
Modify
Context
1
Context
2
Figure 3. Changeability as alteration of system
form over time; change can be a scaling or
modification
Time
Needs (performance, expectations)
Context 1: normal ops
Context 2: debris hit
Context 1
Expectation 1
Expectation 2
Expectation 1
System
Figure 4. Three-Epoch Model of Survivability
Epoch 1 Epoch 2 Epoch 3
American Institute of Aeronautics and Astronautics
6
The case study uses the approach proposed by Richards11 to assess survivability. As illustrated in Fig. 4, the survivability process is defined by three epochs: (1) initial operation, (2) operation in a harsh environment (often for only a short time), followed by (3) return to normal operation, under conditions that may be the same as the initial ones or as altered by the harsh epoch. The problem we are contemplating involves the possibility of orbital debris impact, so the epochs are (1) initial operation, (2) debris encounter, and (3) return to normal operations. In this case, Epoch 3 and Epoch 1 have the same contexts and expectations. In Epoch 2 there are minimal operating expectations on the vehicle (i.e., interruption of normal operation is acceptable, but the vehicle cannot, for example, spin uncontrollably). The expectation here is that the satellite will not be destroyed by the encounter. For simplicity, we consider this a binary event; the vehicle survives fully functional or is destroyed.
The value of survivability can be quantified as the probability that any value will be delivered in Epoch 3. It is tempting to define a single utility metric for this situation as follows:
Ulifetime =U1T
1+ P
2⋅U
3T
3 (1)
Equation 1 states that the lifetime utility is the utility derived from Epoch 1, plus the utility derived from Epoch 3 times the probably that the vehicle will survive Epoch 2. As we shall see, this approach may be oversimplified.
IV. Representation of Survivability in a Satellite Tradespace
To illustrate the concepts and challenges discussed in Sections II and III, this section presents an experimental methodology for incorporating survivability into a satellite tradespace. In particular, a Multi-Attribute Tradespace Exploration (MATE) study is conducted to assess alternative architectures. The system evaluated is a space tug for operation in low Earth orbit (LEO). The tradespace for this system is simple, well understood, verified, and fairly “rich” in the sense that the “best” system is dependent on the interaction of user needs, environment, and physical constraints in non-trivial ways.8
A. Modeling Methodology
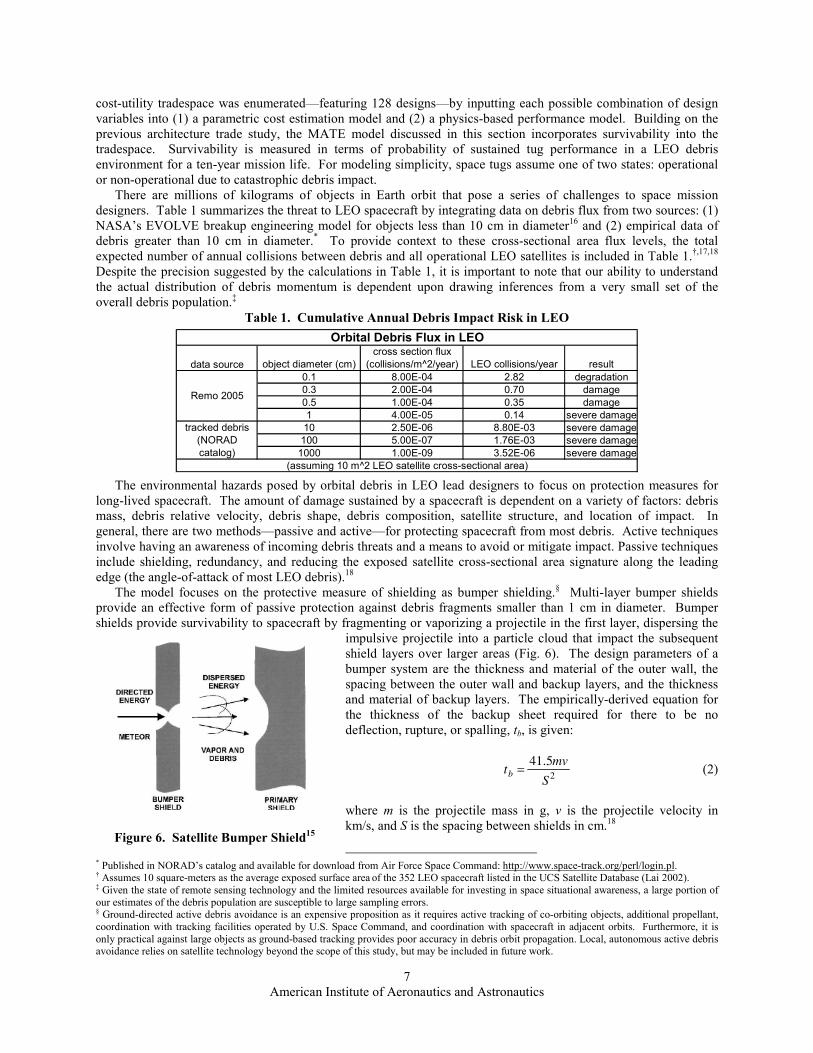
Multi-Attribute Tradespace Exploration is a conceptual design methodology that applies decision theory to model and simulation-based design. Decoupling the design from the need through tradespace exploration, MATE is both a solution-generating as well as a decision-making framework.14 Figure 5 summarizes the MATE process.
At a high level, implementing the MATE approach to system design involves three activities. First, the preferences of a decision maker (i.e., architecture evaluation criteria) are defined and specified with attributes (i.e., decision maker-perceived metrics that measure how well decision maker-defined objectives are met). These attributes are aggregated using Multi-Attribute Utility Theory to arrive at a single utility function (a dimensionless metric of user satisfaction ranging from 0, minimally acceptable, to 1, highest of expectations). Second, the attributes are inspected, and various design variables (i.e., designer-controlled quantitative parameters that reflect aspects of a concept, which taken together as a set uniquely define a system architecture) are proposed. Each possible combination of design variables constitutes a unique design vector, and the set of all possible design vectors constitutes the design-space. Third, a system model is developed to assess the cost and utility of the candidate architectures. In a static-MATE analysis, a limited number of Pareto-efficient designs may then be selected for more rigorous analysis.
B. Design Problem: Space Tug Architecture
A space tug is a vehicle designed to rendezvous and dock with a space object; make an assessment of its current position, orientation, and operational status; and, then, either stabilize the object in its current orbit or move the object to a new location with subsequent release.15 A previous MATE study explored the tradespace for a general-purpose servicing vehicle.8 Three attributes formed the multi-attribute utility function: total ∆V capability, capability of the grappling system, and response time. To provide these attributes, three design variables were considered in subsequent modeling activities: manipulator mass, propulsion type, and fuel load. A full-factorial,
MissionConcept
Attributes
Calculate Utility
Calculate Utility
Develop System Model
Estimate Cost
Architecture Tradespace
Define Design Vector
Figure 5. Multi-Attribute Tradespace
Exploration (MATE)
American Institute of Aeronautics and Astronautics
7
cost-utility tradespace was enumerated—featuring 128 designs—by inputting each possible combination of design variables into (1) a parametric cost estimation model and (2) a physics-based performance model. Building on the previous architecture trade study, the MATE model discussed in this section incorporates survivability into the tradespace. Survivability is measured in terms of probability of sustained tug performance in a LEO debris environment for a ten-year mission life. For modeling simplicity, space tugs assume one of two states: operational or non-operational due to catastrophic debris impact.
There are millions of kilograms of objects in Earth orbit that pose a series of challenges to space mission designers. Table 1 summarizes the threat to LEO spacecraft by integrating data on debris flux from two sources: (1) NASA’s EVOLVE breakup engineering model for objects less than 10 cm in diameter16 and (2) empirical data of debris greater than 10 cm in diameter.* To provide context to these cross-sectional area flux levels, the total expected number of annual collisions between debris and all operational LEO satellites is included in Table 1.†,17,18 Despite the precision suggested by the calculations in Table 1, it is important to note that our ability to understand the actual distribution of debris momentum is dependent upon drawing inferences from a very small set of the overall debris population.‡
The environmental hazards posed by orbital debris in LEO lead designers to focus on protection measures for
long-lived spacecraft. The amount of damage sustained by a spacecraft is dependent on a variety of factors: debris mass, debris relative velocity, debris shape, debris composition, satellite structure, and location of impact. In general, there are two methods—passive and active—for protecting spacecraft from most debris. Active techniques involve having an awareness of incoming debris threats and a means to avoid or mitigate impact. Passive techniques include shielding, redundancy, and reducing the exposed satellite cross-sectional area signature along the leading edge (the angle-of-attack of most LEO debris).18
The model focuses on the protective measure of shielding as bumper shielding.§ Multi-layer bumper shields provide an effective form of passive protection against debris fragments smaller than 1 cm in diameter. Bumper shields provide survivability to spacecraft by fragmenting or vaporizing a projectile in the first layer, dispersing the
impulsive projectile into a particle cloud that impact the subsequent shield layers over larger areas (Fig. 6). The design parameters of a bumper system are the thickness and material of the outer wall, the spacing between the outer wall and backup layers, and the thickness and material of backup layers. The empirically-derived equation for the thickness of the backup sheet required for there to be no deflection, rupture, or spalling, tb, is given:
tb =41.5mv
S2
(2)
where m is the projectile mass in g, v is the projectile velocity in km/s, and S is the spacing between shields in cm.18
* Published in NORAD’s catalog and available for download from Air Force Space Command: http://www.space-track.org/perl/login.pl. † Assumes 10 square-meters as the average exposed surface area of the 352 LEO spacecraft listed in the UCS Satellite Database (Lai 2002). ‡ Given the state of remote sensing technology and the limited resources available for investing in space situational awareness, a large portion of our estimates of the debris population are susceptible to large sampling errors. § Ground-directed active debris avoidance is an expensive proposition as it requires active tracking of co-orbiting objects, additional propellant, coordination with tracking facilities operated by U.S. Space Command, and coordination with spacecraft in adjacent orbits. Furthermore, it is only practical against large objects as ground-based tracking provides poor accuracy in debris orbit propagation. Local, autonomous active debris avoidance relies on satellite technology beyond the scope of this study, but may be included in future work.
Table 1. Cumulative Annual Debris Impact Risk in LEO
data source object diameter (cm)cross section flux
(collisions/m^2/year) LEO collisions/year result
0.1 8.00E-04 2.82 degradation0.3 2.00E-04 0.70 damage
0.5 1.00E-04 0.35 damage1 4.00E-05 0.14 severe damage10 2.50E-06 8.80E-03 severe damage100 5.00E-07 1.76E-03 severe damage
1000 1.00E-09 3.52E-06 severe damage(assuming 10 m^2 LEO satellite cross-sectional area)
tracked debris (NORAD catalog)
Remo 2005
Orbital Debris Flux in LEO
Figure 6. Satellite Bumper Shield15
American Institute of Aeronautics and Astronautics
8
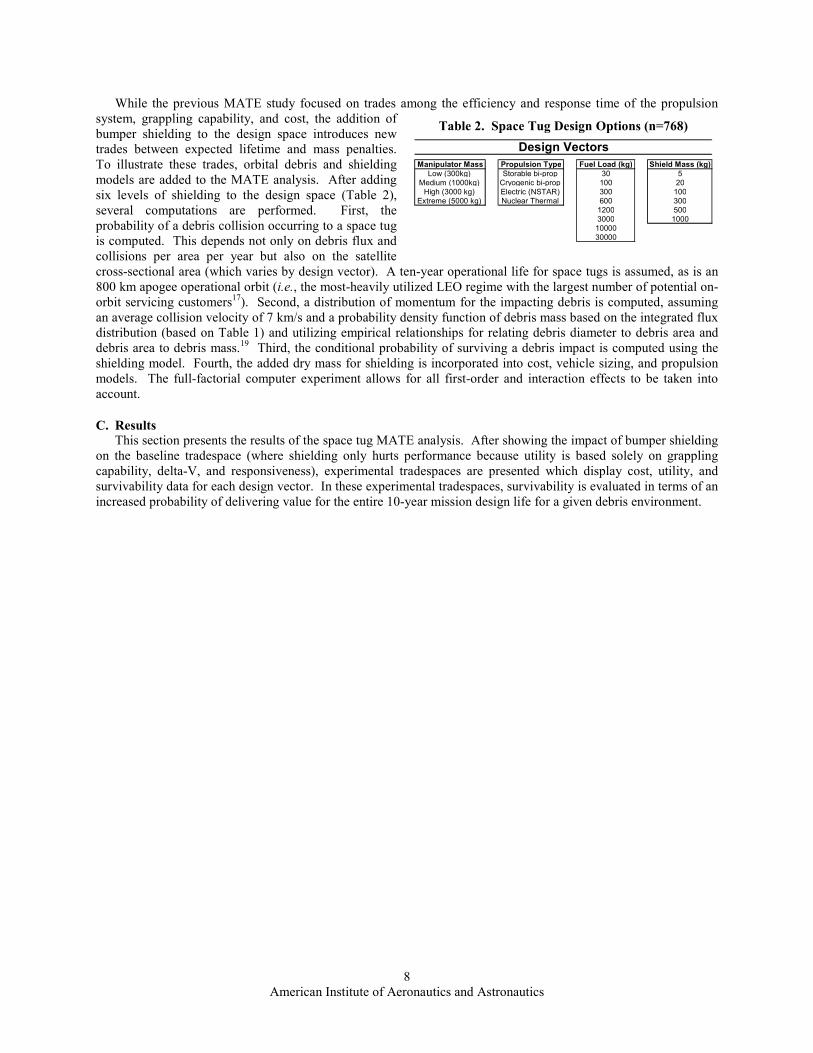
While the previous MATE study focused on trades among the efficiency and response time of the propulsion system, grappling capability, and cost, the addition of bumper shielding to the design space introduces new trades between expected lifetime and mass penalties. To illustrate these trades, orbital debris and shielding models are added to the MATE analysis. After adding six levels of shielding to the design space (Table 2), several computations are performed. First, the probability of a debris collision occurring to a space tug is computed. This depends not only on debris flux and collisions per area per year but also on the satellite cross-sectional area (which varies by design vector). A ten-year operational life for space tugs is assumed, as is an 800 km apogee operational orbit (i.e., the most-heavily utilized LEO regime with the largest number of potential on-orbit servicing customers17). Second, a distribution of momentum for the impacting debris is computed, assuming an average collision velocity of 7 km/s and a probability density function of debris mass based on the integrated flux distribution (based on Table 1) and utilizing empirical relationships for relating debris diameter to debris area and debris area to debris mass.19 Third, the conditional probability of surviving a debris impact is computed using the shielding model. Fourth, the added dry mass for shielding is incorporated into cost, vehicle sizing, and propulsion models. The full-factorial computer experiment allows for all first-order and interaction effects to be taken into account.
C. Results This section presents the results of the space tug MATE analysis. After showing the impact of bumper shielding
on the baseline tradespace (where shielding only hurts performance because utility is based solely on grappling capability, delta-V, and responsiveness), experimental tradespaces are presented which display cost, utility, and survivability data for each design vector. In these experimental tradespaces, survivability is evaluated in terms of an increased probability of delivering value for the entire 10-year mission design life for a given debris environment.
Table 2. Space Tug Design Options (n=768)
Manipulator Mass Propulsion Type Fuel Load (kg) Shield Mass (kg)
Low (300kg) Storable bi-prop 30 5Medium (1000kg) Cryogenic bi-prop 100 20High (3000 kg) Electric (NSTAR) 300 100
Extreme (5000 kg) Nuclear Thermal 600 3001200 5003000 10001000030000
Design Vectors
American Institute of Aeronautics and Astronautics
9
The original space tug analysis showed an interesting trade-off between, capability, cost, and speed. Several different classes of vehicles occupied different regions of the Pareto front, including small chemically fueled vehicles for low delta-V maneuver, servicing, and inspection; small electric vehicles that could apply considerable delta-V, although slowly; and large, expensive vehicles that could apply large delta-V’s quickly but only at high launch costs (for chemical fuel) or high development cost and risk (for nuclear-thermal vehicles).
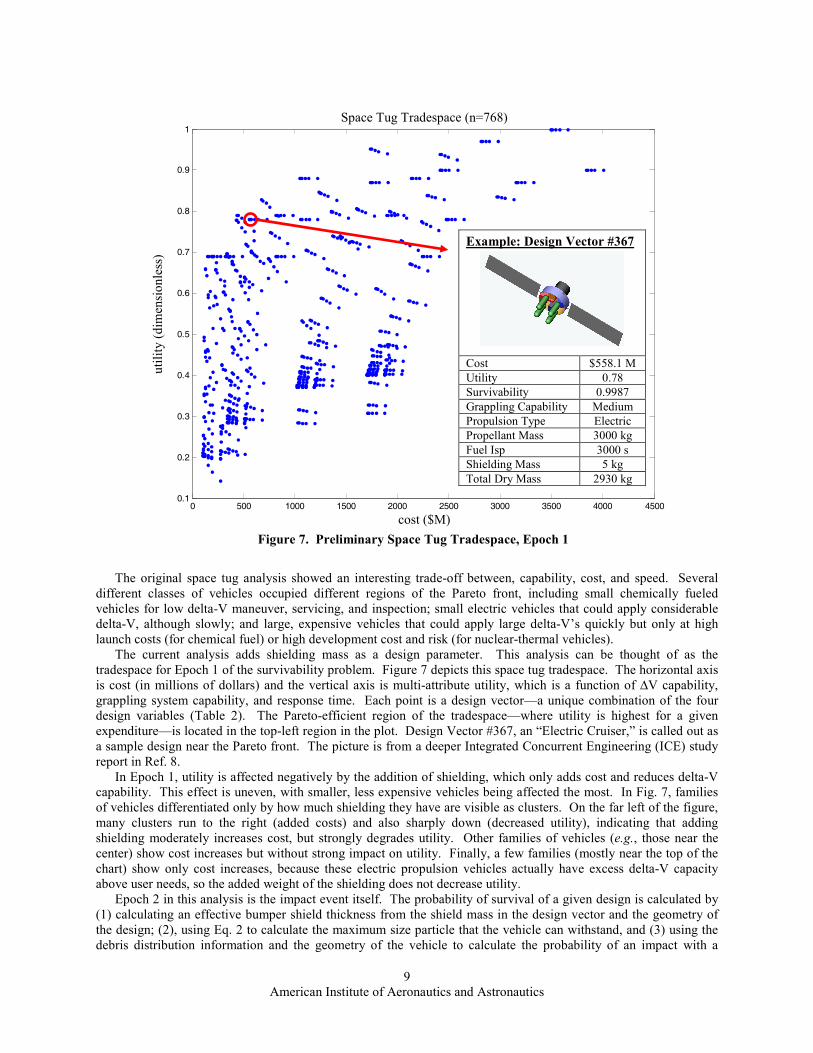
The current analysis adds shielding mass as a design parameter. This analysis can be thought of as the tradespace for Epoch 1 of the survivability problem. Figure 7 depicts this space tug tradespace. The horizontal axis is cost (in millions of dollars) and the vertical axis is multi-attribute utility, which is a function of ∆V capability, grappling system capability, and response time. Each point is a design vector—a unique combination of the four design variables (Table 2). The Pareto-efficient region of the tradespace—where utility is highest for a given expenditure—is located in the top-left region in the plot. Design Vector #367, an “Electric Cruiser,” is called out as a sample design near the Pareto front. The picture is from a deeper Integrated Concurrent Engineering (ICE) study report in Ref. 8.
In Epoch 1, utility is affected negatively by the addition of shielding, which only adds cost and reduces delta-V capability. This effect is uneven, with smaller, less expensive vehicles being affected the most. In Fig. 7, families of vehicles differentiated only by how much shielding they have are visible as clusters. On the far left of the figure, many clusters run to the right (added costs) and also sharply down (decreased utility), indicating that adding shielding moderately increases cost, but strongly degrades utility. Other families of vehicles (e.g., those near the center) show cost increases but without strong impact on utility. Finally, a few families (mostly near the top of the chart) show only cost increases, because these electric propulsion vehicles actually have excess delta-V capacity above user needs, so the added weight of the shielding does not decrease utility.
Epoch 2 in this analysis is the impact event itself. The probability of survival of a given design is calculated by (1) calculating an effective bumper shield thickness from the shield mass in the design vector and the geometry of the design; (2), using Eq. 2 to calculate the maximum size particle that the vehicle can withstand, and (3) using the debris distribution information and the geometry of the vehicle to calculate the probability of an impact with a
0 500 1000 1500 2000 2500 3000 3500 4000 45000.1
0.2
0.3
0.4
0.5
0.6
0.7
0.8
0.9
1
cost ($M)
utilit
y (
dim
ensio
nle
ss)
Space Tug Tradespace (n=768)
Figure 7. Preliminary Space Tug Tradespace, Epoch 1
Example: Design Vector #367
Cost $558.1 M
Utility 0.78
Survivability 0.9987
Grappling Capability Medium
Propulsion Type Electric
Propellant Mass 3000 kg
Fuel Isp 3000 s
Shielding Mass 5 kg
Total Dry Mass 2930 kg
Space Tug Tradespace (n=768)
cost ($M)
uti
lity
(dim
ensi
onle
ss)
American Institute of Aeronautics and Astronautics
10
particle of greater size, which is assumed to destroy the vehicle. The results showed (not surprisingly) that small vehicles had very low risk even with minimal shielding, while larger vehicles had some risk that was improved somewhat by adding shielding mass. One interesting feature of the problem was that shielding was less effective than initially supposed. Due to the nature of the debris mass distribution, cutting the impact risk significantly (by a factor of 10) required large additions in shielding mass
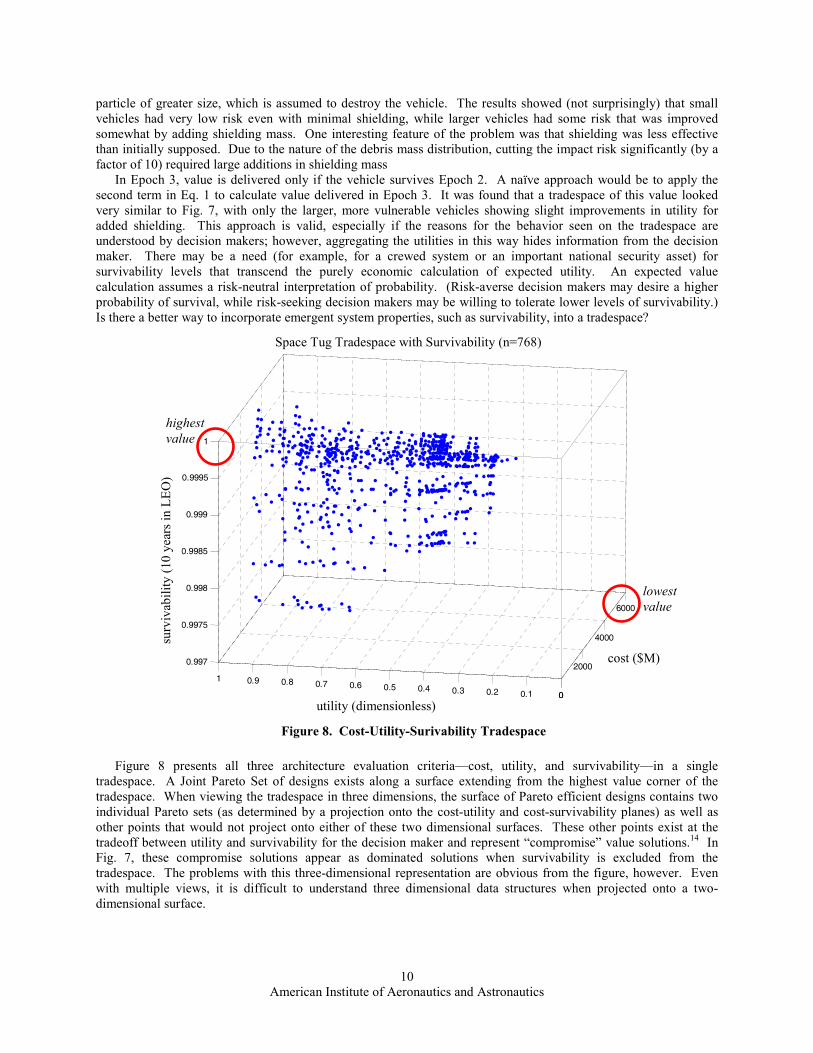
In Epoch 3, value is delivered only if the vehicle survives Epoch 2. A naïve approach would be to apply the second term in Eq. 1 to calculate value delivered in Epoch 3. It was found that a tradespace of this value looked very similar to Fig. 7, with only the larger, more vulnerable vehicles showing slight improvements in utility for added shielding. This approach is valid, especially if the reasons for the behavior seen on the tradespace are understood by decision makers; however, aggregating the utilities in this way hides information from the decision maker. There may be a need (for example, for a crewed system or an important national security asset) for survivability levels that transcend the purely economic calculation of expected utility. An expected value calculation assumes a risk-neutral interpretation of probability. (Risk-averse decision makers may desire a higher probability of survival, while risk-seeking decision makers may be willing to tolerate lower levels of survivability.) Is there a better way to incorporate emergent system properties, such as survivability, into a tradespace?
Figure 8 presents all three architecture evaluation criteria—cost, utility, and survivability—in a single
tradespace. A Joint Pareto Set of designs exists along a surface extending from the highest value corner of the tradespace. When viewing the tradespace in three dimensions, the surface of Pareto efficient designs contains two individual Pareto sets (as determined by a projection onto the cost-utility and cost-survivability planes) as well as other points that would not project onto either of these two dimensional surfaces. These other points exist at the tradeoff between utility and survivability for the decision maker and represent “compromise” value solutions.14 In Fig. 7, these compromise solutions appear as dominated solutions when survivability is excluded from the tradespace. The problems with this three-dimensional representation are obvious from the figure, however. Even with multiple views, it is difficult to understand three dimensional data structures when projected onto a two-dimensional surface.
0
2000
4000
6000
00.10.20.30.40.50.60.70.80.91
0.997
0.9975
0.998
0.9985
0.999
0.9995
1
cost ($M)
Space Tug Tradespace with Survivability (n=768)
utility (dimensionless)
surv
ivabili
ty (
10 y
ears
in L
EO
)
Figure 8. Cost-Utility-Surivability Tradespace
lowest
value
highest
value
Space Tug Tradespace with Survivability (n=768)
cost ($M)
surv
ivab
ilit
y (
10 y
ears
in L
EO
)
utility (dimensionless)
American Institute of Aeronautics and Astronautics
11
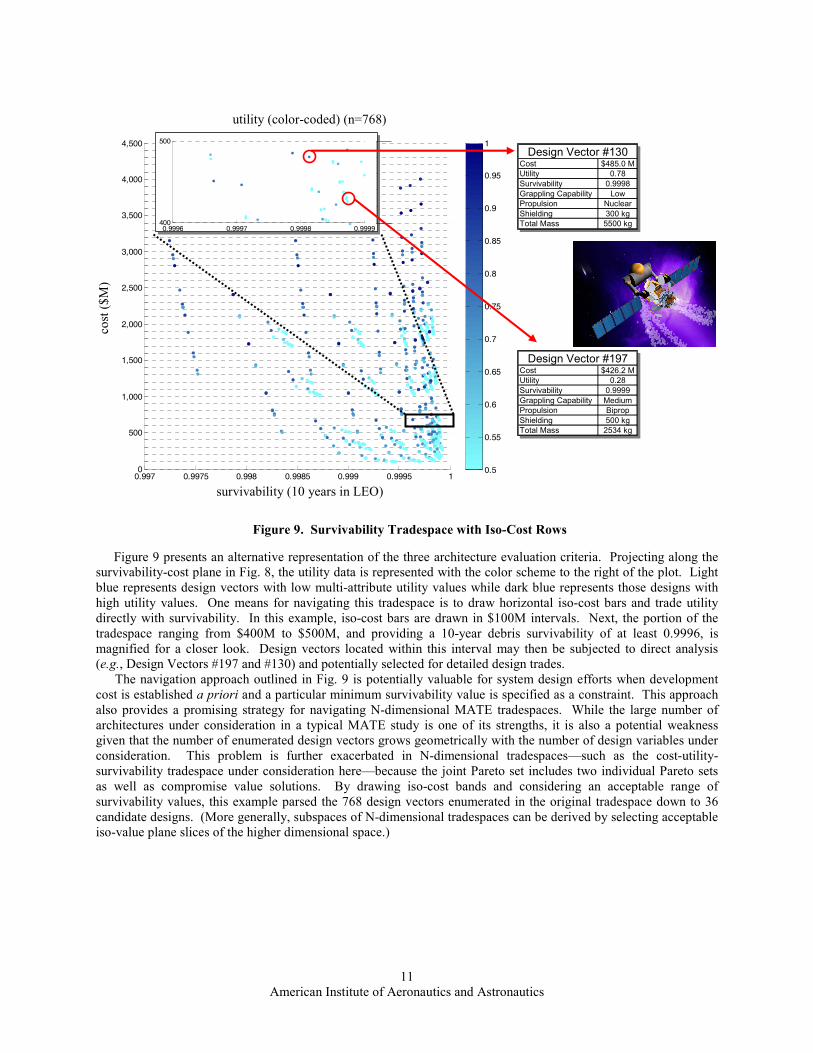
Figure 9 presents an alternative representation of the three architecture evaluation criteria. Projecting along the
survivability-cost plane in Fig. 8, the utility data is represented with the color scheme to the right of the plot. Light blue represents design vectors with low multi-attribute utility values while dark blue represents those designs with high utility values. One means for navigating this tradespace is to draw horizontal iso-cost bars and trade utility directly with survivability. In this example, iso-cost bars are drawn in $100M intervals. Next, the portion of the tradespace ranging from $400M to $500M, and providing a 10-year debris survivability of at least 0.9996, is magnified for a closer look. Design vectors located within this interval may then be subjected to direct analysis (e.g., Design Vectors #197 and #130) and potentially selected for detailed design trades.
The navigation approach outlined in Fig. 9 is potentially valuable for system design efforts when development cost is established a priori and a particular minimum survivability value is specified as a constraint. This approach also provides a promising strategy for navigating N-dimensional MATE tradespaces. While the large number of architectures under consideration in a typical MATE study is one of its strengths, it is also a potential weakness given that the number of enumerated design vectors grows geometrically with the number of design variables under consideration. This problem is further exacerbated in N-dimensional tradespaces—such as the cost-utility-survivability tradespace under consideration here—because the joint Pareto set includes two individual Pareto sets as well as compromise value solutions. By drawing iso-cost bands and considering an acceptable range of survivability values, this example parsed the 768 design vectors enumerated in the original tradespace down to 36 candidate designs. (More generally, subspaces of N-dimensional tradespaces can be derived by selecting acceptable iso-value plane slices of the higher dimensional space.)
0.997 0.9975 0.998 0.9985 0.999 0.9995 10
500
1,000
1,500
2,000
2,500
3,000
3,500
4,000
4,500
survivability (10 years in LEO)
cost
($M
)
Utility (dimensionless) (n=768)
0.5
0.55
0.6
0.65
0.7
0.75
0.8
0.85
0.9
0.95
1
Figure 9. Survivability Tradespace with Iso-Cost Rows
0.9996 0.9997 0.9998 0.9999400
500
Cost $426.2 MUtility 0.28
Survivability 0.9999
Grappling Capability MediumPropulsion Biprop
Shielding 500 kgTotal Mass 2534 kg
Design Vector #197
Cost $485.0 MUtility 0.78
Survivability 0.9998
Grappling Capability LowPropulsion Nuclear
Shielding 300 kgTotal Mass 5500 kg
Design Vector #130
cost
($M
)
utility (color-coded) (n=768)
survivability (10 years in LEO)
American Institute of Aeronautics and Astronautics
12
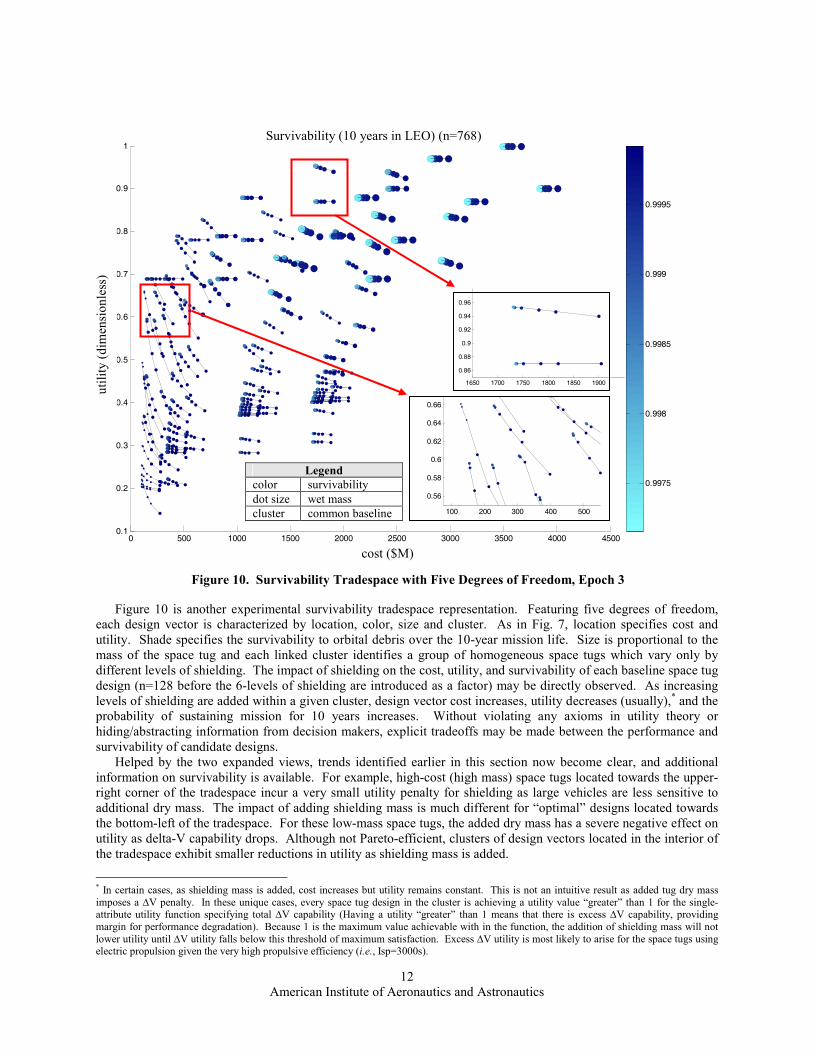
Figure 10 is another experimental survivability tradespace representation. Featuring five degrees of freedom, each design vector is characterized by location, color, size and cluster. As in Fig. 7, location specifies cost and utility. Shade specifies the survivability to orbital debris over the 10-year mission life. Size is proportional to the mass of the space tug and each linked cluster identifies a group of homogeneous space tugs which vary only by different levels of shielding. The impact of shielding on the cost, utility, and survivability of each baseline space tug design (n=128 before the 6-levels of shielding are introduced as a factor) may be directly observed. As increasing levels of shielding are added within a given cluster, design vector cost increases, utility decreases (usually),* and the probability of sustaining mission for 10 years increases. Without violating any axioms in utility theory or hiding/abstracting information from decision makers, explicit tradeoffs may be made between the performance and survivability of candidate designs.
Helped by the two expanded views, trends identified earlier in this section now become clear, and additional information on survivability is available. For example, high-cost (high mass) space tugs located towards the upper-right corner of the tradespace incur a very small utility penalty for shielding as large vehicles are less sensitive to additional dry mass. The impact of adding shielding mass is much different for “optimal” designs located towards the bottom-left of the tradespace. For these low-mass space tugs, the added dry mass has a severe negative effect on utility as delta-V capability drops. Although not Pareto-efficient, clusters of design vectors located in the interior of the tradespace exhibit smaller reductions in utility as shielding mass is added.
* In certain cases, as shielding mass is added, cost increases but utility remains constant. This is not an intuitive result as added tug dry mass imposes a ∆V penalty. In these unique cases, every space tug design in the cluster is achieving a utility value “greater” than 1 for the single-attribute utility function specifying total ∆V capability (Having a utility “greater” than 1 means that there is excess ∆V capability, providing margin for performance degradation). Because 1 is the maximum value achievable with in the function, the addition of shielding mass will not lower utility until ∆V utility falls below this threshold of maximum satisfaction. Excess ∆V utility is most likely to arise for the space tugs using electric propulsion given the very high propulsive efficiency (i.e., Isp=3000s).
0 500 1000 1500 2000 2500 3000 3500 4000 45000.1
0.2
0.3
0.4
0.5
0.6
0.7
0.8
0.9
1
cost ($M)
utilit
y (
dim
ensio
nle
ss)
10 Year Survivability of LEO Space Tug (n=768)
0.9975
0.998
0.9985
0.999
0.9995
Figure 10. Survivability Tradespace with Five Degrees of Freedom, Epoch 3
Survivability (10 years in LEO) (n=768)
uti
lity
(dim
ensi
onle
ss)
cost ($M)
Legend
color survivability
dot size wet mass
cluster common baseline
1650 1700 1750 1800 1850 1900
0.86
0.88
0.9
0.92
0.94
0.96
100 200 300 400 500
0.56
0.58
0.6
0.62
0.64
0.66
American Institute of Aeronautics and Astronautics
13
Another interesting trend in Fig. 10 is the differential impact of shielding in different regions of the tradespace. High-cost, high-mass designs clearly become more survivable as shielding is added (given the shift from very light blue to dark blue in clusters located in the upper-right region of the tradespace). Improvements in survivability are less pronounced for lower-cost, lower-mass designs (color shifts only from mid blue to dark blue in the lower-left region). The implication here is that there is a reduced benefit for smaller space tug vehicles to shield. This makes intuitive sense as small, low-cost space tugs will have a smaller exposed cross-sectional area (reducing probability of collision) and will also incur proportionately larger delta-V penalties for shielding mass. For these lower-cost assets, survivability might be better addressed with a portfolio approach to risk management. Given ongoing debates on the value of an operationally responsive space paradigm, these tradespaces may serve as a baseline for evaluating expensive, high-capability spacecraft and lower-cost, low-capability, distributed space systems.
By making tradeoffs between cost, performance, and survivability explicit, the multi-dimensional tradespaces introduced in this section provide a powerful framework for exploring a large set of alternative space tug architectures. While judgments of value are inherently subjective and left to decision makers, application of MATE will enhance the discovery of these “best” designs.
V. Conclusions
A. Discussion The framework proposed here helps illustrate ility definitions and clarify some distinctions between the many
proposed ility types. The epoch framework of Ross allows the systematic creation of tradespace model(s) to quantify these ilities. A simple example illustrates the strengths, and some of the weaknesses, of the method. The costs (in both money and loss of basic utility) and changes over the system lifetime in delivered utility were systematically calculated. The survivability of the system was used to calculate an expected lifetime utility though caution should be taken as it assumes a risk-neutral decision maker. More sophisticated financial-based calculations, such as real options, can potentially be used to add more nuance and to extend to this kind of analysis.
More important is the knowledge of the tradespace generated by the method and presented to a decision maker. In the example case, the knowledge of where to apply passive hardening (e.g., not to small vehicles) and the modest pay-off of passive methods even for large vehicles was illustrated rapidly and with relatively little effort. The complex trade-offs involved are still difficult to visualize, but by using various graphical methods and looking for root causes for observed trends, the knowledge necessary for reasonable upfront decisions can be gained. This clarification of, and extraction of knowledge from, the analyzed tradespace is the essence of tradespace exploration, so in this sense the case study was a successful illustration of the principle.
The current case study uses a very simple example, a fairly basic analysis, and reaches ultimately unsurprising conclusions, but it still exercised the methods and showed how a simple, inexpensive study can provide decision makers with the knowledge necessary to make good upfront decisions.
B. Future Work
Moving ahead, there are many opportunities to advance this research. First, the MATE study should incorporate an active collision avoidance model to present a more complete set of potential architectures to a decision maker. Although this strategy is not feasible for the vast majority of spacecraft,* it might prove cost-effective for some of the billion-dollar class space tug designs considered in the previous section. Second, applications of dynamic MATE14 should be conducted to understand how survivability might be assessed given changing debris environments—replacing the binary survivability criteria with more sophisticated algorithms for integrating ordinal utility data (e.g., Pareto Trace Number, Epoch analysis). Additionally, survivability analysis should be generalized to allow for partially degraded satellite states. More generally, other ilities need to be explored using this method to generate confidence in its general usefulness.
Acknowledgments
The authors thank Dr. Daniel Frey, Nirav Shah, and Dr. Ricardo Valerdi for their valuable insights. Funding for this work was provided by the Systems Engineering Advancement Research Initiative (SEAri), a consortium of systems engineering leaders from industry, government, and academia; and the Program on Emerging Technologies, an interdisciplinary research effort of the National Science Foundation at MIT.
* Currently, active collision avoidance is used by the International Space Station, the Space Shuttle, and constellations of LEO spacecraft.
American Institute of Aeronautics and Astronautics
14
References
1 McManus, H., and Hastings, D., “A Framework for Understanding Uncertainty and its Mitigation and Exploitation in
Complex Systems,” IEEE Engineering Management Review, Vol. 34, No. 3, 2006, pp. 81-94. 2 Saleh, J., Lamassoure, E., and Hastings, D., "Space Systems Flexibility Provided by On-Orbit Servicing I," Journal of
Spacecraft and Rockets, Vol. 39, No. 4, July-Aug. 2002, pp. 551-560. 3 Wang, T., and de Neufville, R., “Using a Coupled-Design Structure Matrix Framework to Screen for Real Options "In" an
Engineering System,” 16th INCOSE Symposium, Orlando, FL, July 2006. 4 Ross, A., and Hastings, D., “Assessing Changeability in Aerospace Systems Architecting and Design Using Dynamic
Multi-Attribute Tradespace Exploration,” AIAA-2006-7255, Sept. 2006. 5 McManus, H., Hastings, D., and Warmkessel, J., “New Methods for Rapid Architecture Selection and Conceptual Design,”
Journal of Spacecraft and Rockets, Vol. 41, No.1, Jan.-Feb. 2004, pp. 10-19. 6 Ross, A., Hastings, D., Warmkessel, J., and Diller, N., “Multi-Attribute Tradespace Exploration as Front End for Effective
Space System Design,” Journal of Spacecraft and Rockets, Vol. 41, No.1, Jan.-Feb. 2004, pp. 20-28. 7 Richards, M., Hastings, D., Rhodes, D., and Weigel, A., “Defining Survivability for Engineering Systems,” Conference on
Systems Engineering Research, Hoboken, NJ, March 2007. 8 McManus, H., and Schuman, T., “Understanding the Orbital Transfer Vehicle Tradespace,” AIAA-2003-6370, Sept. 2003.
9 Ross, A., Rhodes, D., and Hastings, D., “Defining Changeability: Reconciling Flexibility, Adaptability, Scalability, and
Robustness for Maintaining Lifecycle Value,” INCOSE International Symposium 2007, San Diego, CA, June 2007. 10
Ball, R., The Fundamentals of Aircraft Combat Survivability Analysis and Design, 2nd ed., AIAA Education Series, Reston,
2003. 11
Richards, M., Ross, A., Hastings, D., and Rhodes, D., “Design Principles for Survivable System Architecture,” 1st IEEE
Systems Conference, Honolulu, HI, April 2007, pp. 16-24. 12
McManus, H., “Ility Space,” SEAri working paper, http://seari.mit.edu. 13
Ross, A. and Rhodes, D., “Using Natural Value-Centric Time Scales for Conceptualizing System Timelines through
Epoch/Era Analysis,” SEAri working paper, http://seari.mit.edu. 14
Ross, A., “Managing Unarticulated Value: Changeability in Multi-Attribute Tradespace Exploration,” Ph.D. Dissertation,
Engineering Systems Division, Massachusetts Institute of Technology, Cambridge, MA, 2006. 15
Richards, M., Springmann, P., McVey, M., “Assessing the Challenges to a Geosynchronous Space Tug Vehicle,”
Proceedings of SPIE Defense and Security Symposium, edited by P. Motaghedi, The International Society for Optical Engineering, Bellingham, WA, 2005, Vol. 5799.
16 Remo, J., “Orbital Debris Effects from Space-Based Ballistic Missile Interception,” Journal of Spacecraft and Rockets,
Vol. 42, No.3, May-June 2005, pp. 487-492. 17
Union of Concerned Scientists, UCS Satellite Database [online database], URL:
http://www.ucsusa.org/global_security/space_weapons/satellite_database.html [cited 7 January 2007]. 18
Lai, S., Murad, E., and McNeil, W., “Hazards of Hypervelocity Impacts on Spacecraft,” Journal of Spacecraft and
Rockets, 39(1), January-February 2002. 19
Badhwar, G., and Anz-Meador, P., “Determination of the Area and Mass Distribution of Orbital Debris Fragments,” Earth,
Moon, and Planets, Vol. 45, pp. 29-51, 1989.