Embed Size (px)
Citation preview

.., ~·&A L NZ.OO .G-4 tt Sl l?::;,v p 7 L no.·21 I( ~
c
L
Pesticide Monitoring Network 1995-1996
Greg Webb
GEORGIA DEPARTMENT OF NATURAL RESOURCES ENVIRONMENTAL PROTECTION DIVISION
GEORGIA GEOLOGIC SURVEY
Atlanta 1996
PROJECT REPORT 27

Pesticide Monitoring Network 1995-1996
Greg Webb
GEORGIA DEPARTMENT OF NATURAL RESOURCES Lonice C. Barrett, Commissioner
ENVIRONMENTAL PROTECTION DIVISION Harold F. Reheis, Director
GEORGIA GEOLOGIC SURVEY William H. McLemore, State Geologist
Atlanta 1996
PROJECT REPORT 27

(
"-·
TABLE OF CONTENTS
Introduction ..................................................................................................................................... 1 Well location and construction ........................................................................................................ 1 Sampling equipment and procedures .............................................................................................. 3 Decontamination and quality assurance/quality control. ............................................................... .3 Laboratory analysis ......................................................................................................................... 4 Results ............................................................................................................................................. 4 Interpretive conclusions .................................................................................................................. 4 References ....................................................................................................................................... 5
Figures
Figure 1. 1995-1996 Pesticide Monitoring Network Study Area ................................................. 2
Appendices
A. Monitoring well construction data ........................................................................................... 7 B. Laboratory reporting sheets/listing of analytical parameters ................................................. 11 C. Tabulation of field parameters .............................................................................................. 19

INTRODUCTION
To satisfy the requirements of their Pesticide Management Plan, the Georgia Department of Agriculture (DOA) requested that the Geologic Survey Branch (GGS) of the Environmental Protection Division (EPD) assist in designing a ground-water monitoring network for the agricultural region of southwest Georgia. The original plan called for the installation of a network of shallow monitoring wells in those counties having the highest concentration of agricultural activity (primarily row-crop farming). However, the United States Geological Survey (USGS) was already in the process of installing monitoring wells in the ApalachicolaChattahoochee-Flint River Basin (ACF) as part of the National Water Quality Assessment Program (NA WQA). Rather than duplicate efforts, the DOA, EPD, and the USGS entered into a cooperative agreement in 1993. The agreement called for EPD to sample the USGS wells, turn the samples over to DOA for analysis using EPA-approved Gas Chromatography/Mass Spectrometry (GC/MS) methods, and for all parties to share the results. EPD planned to sample the USGS wells for one year, then produce a report for the well owners and a project report suitable for publication. The first published report (GGS Project Report 22) included data from 24 selected ACF wells generated during the period between September 1993 and July 1994.
During the latter part of 1994, the USGS installed 23 new wells in the Upper Suwannee River Basin (USRB). The USGS contacted EPD about the new wells and plans were made to include them in the next round of sampling by the Pesticide Monitoring Network (PMN). As with the ACF wells, the owners had to give EPD permission to enter their property and sample the wells in the USRB. In August 1995 sampling continued in the ACF basin on a quarterly basis, while the USRB wells were sampled as frequently as time allowed. The DOA added a new method to the laboratory procedures for the second round of sampling, bringing the total number of analytical screens to five, with more than 200 compounds detectable by the combination of the methods.
WELL LOCATION AND CONSTRUCTION
The USGS installed 36 wells in the ACF and 23 wells in the USRB. EPD attempted to obtain the consent of the landowners to access and sample the wells in both basins. Permission was obtained to sample 24 wells in the ACF and 17 in the USRB. Figure 1 provides the well locations. As sampling progressed, five wells (LC2A, CP15A, CP24A, AC36B, and 9-1) were deleted from the Network due to inaccessibility or very slow recovery. A seventh well (AC39A) was deleted (due to the fact that it was demolished) at the landowner's request to make room for a center-pivot irrigation system. Some wells were sampled less frequently than others due to problems in gaining access to the well such as: muddy fields, damage potential to crops, and locked gates.
Well construction criteria were similar for the USGS monitoring wells in the USRB and the ACF. Where possible, wells were drilled in or near recharge areas, in close proximity to fields that had been continuously cultivated for the preceding 1 0 or more years. All of the wells were constructed with PVC casings an~ screens and drilled to a short distance below the water table with 6-inch hollow-stem augers. The annular space around the ten-foot screened interval in each well was backfilled with a filter pack of clean sand and capped with a bentonite plug. The
1
i -1 I ·--~--- ... ~-- LC-3~,
I LC-2A_;7 ...-r1-5B r ~lJMTER rLC 1c !.. I ~--------~ 1 CP-26B.-4" ~LC-7A 1 ,... LC-8A \ I
~ I r- -"- -- -'-__,-- _ __ ...., _) cRISP 1 I I -£.---------- ( I 1&-1
) j ;x,cP-23B )_--.. _L- ?-3....._ f 7._ ~
r_l RANDOLPH :._, TERRELL ,l LEE ~~~ ~---- 1\ \1~-1 , ' ,1 : cP-27A. 15-1 r-T,-2 '1 CP-15:("" \ ___. J CI}-28A < I 11JRNER ' I 24.-3 ',1 I CP-22A I j! ,\ I -- jJ 1 __ -; ,------:1 L r' L..IJ -o.L ,J-, I 8 1 'V\1 ~-.- I ---1---- ' ----.-- __ _!_ ______ I .!, ~--.. --.cuv- IRW l3-1 J 0
, I 1 WOR1H ''l ~---l IN 1
~ : DOUGHER'IY L. 'I 9-1 -- _ ) ., CALHOUN ' I I r I 4-~ I -13-2\ 22-h ) '"'~ \ -cP-29D ~ ,I ·~-----' ·----,-_., .... ,..r-.,L _____ ...... -r---~- I, TIFT I
j CJ--21A /~ ! 2-3- ! l1 l ..1'r r ,..,.v-~ ~------~-~-1-/r-.r
AC-12A ~C-34A IL BAKER / I '~ 10-f '-~-&i::..A.c.:.rm --, r' 1 J
I • ..---AC-31A ! ~J ~P-30A COLQUTIT }
AC-36~ MIU.ER I .J s MITCHFLL ( I ;~~-AC-39A r I 1• I /" I'
,A£t38~--J~---___u------------~ . { ) f P-18A ------,r-----• I 7CP.-19C I
"') I \~EMINOLE J
~ ' . ) \ . ' .I ..... ( • Monitoring well locations
Figure 1. 1995- 1996 Pesticide Monitoring Network Study Area
2

annulus above the bentonite plug was backfilled with either bags of sand or native materials and capped with three feet of cement grout. The casings extend one-half foot to three feet above the ground surface and are covered by locking steel boxes set in 18-inch wide concrete aprons. Soon after drilling, the wells were developed with an air bladder pump until they produced clear water. A list of monitoring well construction data is in Appendix A.
SAMPLING EQUIPMENT AND PROCEDURES
Purging and sampling procedures used for the Pesticide Monitoring Network (PMN) were developed from Recommended Procedures for Collection of Selected Ground Water Data from Wells (Lapham, Wilde, and Korterba, 1992) and the Manual for Groundwater Monitoring (EPD Task Force on Ground Water Monitoring, 1988). Because the original equipment (disposable, PVC, single-use bailers) was destroyed in the Albany floods during the summer of 1994, a Norwell Teflon bailer® and a reel-mounted Grundfos® Redi-flo 2-inch environmental submersible pump are now being used to sample. A YSI Model® 3500 Water Quality Monitoring System is used to simultaneously measure these field parameters: temperature, dissolved oxygen, specific conductance, and pH. (Note: Manufacturers, trade names, or brand names of equipment or supplies mentioned in this report does not constitute endorsement by the Geologic Survey.)
Typically, the monitoring wells are purged until at least three times the volume of standing water in the well has been removed and the temperature, specific conductance and pH of the ground water have stabilized. Samples are collected in one liter amber glass bottles and pre-preserved (1.8ml ofmonochloroacetic acid) 125-ml opaque, Teflon® bottles. Typically, four one-liter samples for DOA's analytical screens No. 1 through No.4, (organophosphate, organochlorine pesticides, and phenoxy herbicides) and one 125-ml sample for analytical screen No. 5 (carbamate pesticides) are collected at each well. The sample bottles are individually labeled, bagged, and placed in coolers packed with ice for preservation during transportation to the DOA Pesticide Residue Laboratory in Atlanta. Samples are hand delivered to the lab within three to four days by EPD employees using an EPA-approved chain of custody form.
DECONTAMINATION AND QUALITY ASSURANCE I QUALITY CONTROL
To prevent potential cross-contamination, the sampling equipment was cleaned prior to and between each sampling episode. The sampling bailer and pump were decontaminated in the field using a three-step process: clean in a Liquinox® and tap water solution, thoroughly rinse in tap water, rinse again in deionized water. All sampling equipment is handled with latex gloves to prevent potential cross-contamination. In between uses, the equipment is wrapped in aluminum foil and stored in the EPD warehouse in Albany. Equipment blanks (deionized water) are taken periodically to determine if the decontamination process is effective. Additional quality control (QC) methods include spiked samples and replicate samples. The DOA laboratory runs internal QC standards before, during, and after each sample run. The results of the QC tests indicate that the methods in use at the Pesticide Residue Laboratory are consistently capable of detecting pesticides at or near their listed detection limit and the decontamination
3
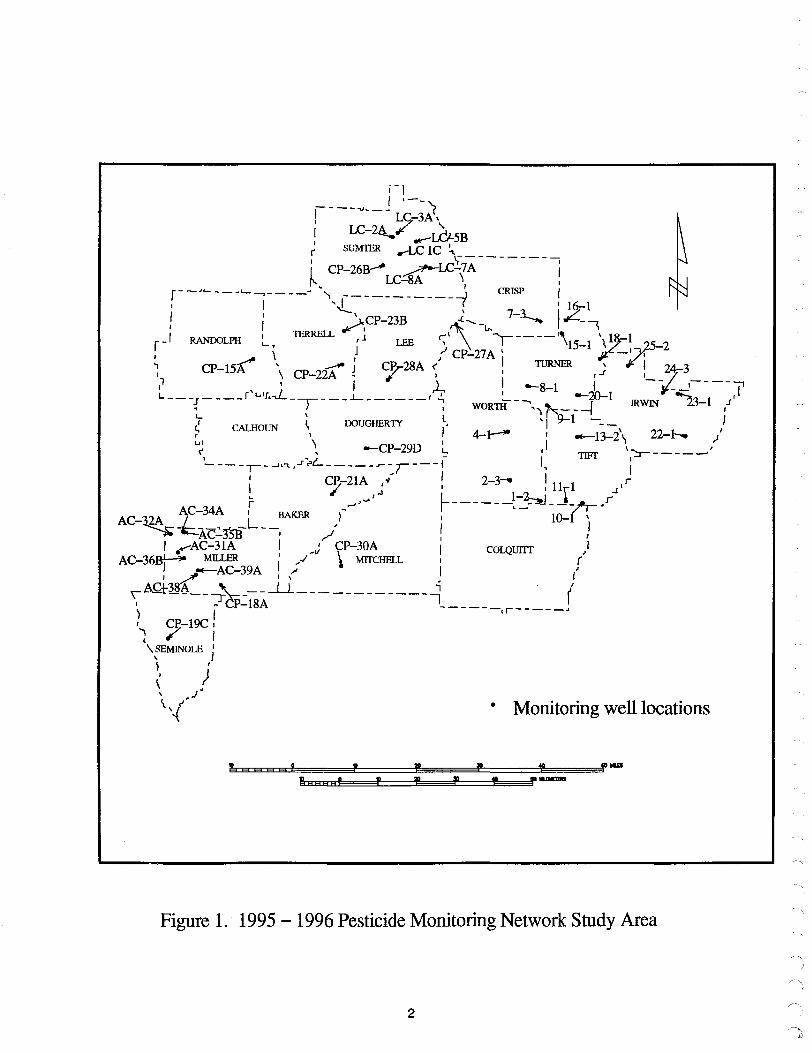
methods used in the field are effective.
LABORATORY ANALYSIS
The Department of Agriculture Pesticide Residue Laboratory uses EPA methods 507 (nitrogen and phosphorus containing compounds), 508 (chlorinated pesticides), 515.1 (chlorinated acids), and 531.1 (N-methylcarbamoyloximes and N-methylcarbamates) for pesticide analysis. These methods have detection limits for pesticide compounds that are below the maximum contaminant levels (MCLs) established by EPA for safe drinking water. Method 531.1 uses high-pressure liquid chromatography (HPLC) to determine the concentrations of constituents; the other methods rely on gas chromatography/mass spectrometry for compound identification. For more information concerning the specific analytes detectable by each method and their respective detection limits, refer to the laboratory report sheets included in Appendix B.
RESULTS
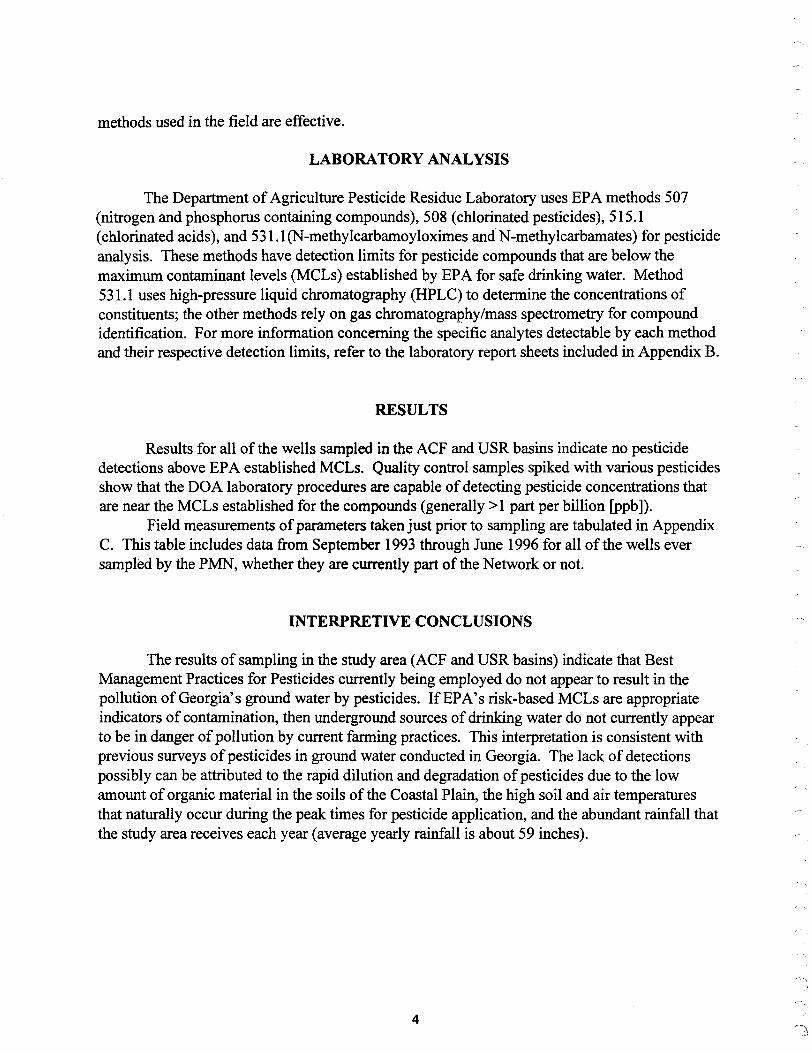
Results for all of the wells sampled in the ACF and USR basins indicate no pesticide detections above EPA established MCLs. Quality control samples spiked with various pesticides show that the DOA laboratory procedures are capable of detecting pesticide concentrations that are near the MCLs established for the compounds (generally > 1 part per billion [ppb ]).
Field measurements of parameters taken just prior to sampling are tabulated in Appendix C. This table includes data from September I 993 through June 1996 for all of the wells ever sampled by the PMN, whether they are currently part of the Network or not.
INTERPRETIVE CONCLUSIONS
The results of sampling in the study area (ACF and USR basins) indicate that Best Management Practices for Pesticides currently being employed do not appear to result in the pollution of Georgia's ground water by pesticides. If EPA's risk-based MCLs are appropriate indicators of contamination, then underground sources of drinking water do not currently appear to be in danger of pollution by current farming practices. This interpretation is consistent with previous surveys of pesticides in ground water conducted in Georgia. The lack of detections possibly can be attributed to the rapid dilution and degradation of pesticides due to the low amount of organic material in the soils of the Coastal Plain, the high soil and air temperatures that naturally occur during the peak times for pesticide application, and the abundant rainfall that the study area receives each year (average yearly rainfall is about 59 inches).
4

'It··
REFERENCES
EPD task force on Ground Water Monitoring, 1988. Manual for Ground Water Monitoring, Georgia Department of Natural Resources, Environmental Protection Division (unpublished). 37 p.
Lapham, W., Wilde, F., and Korterba, M., 1992. Protocols and Recommended Procedures for Collection of Selected Ground-water Data from Wells. USGS Open-file report 92-xxxx (provisional document, unfinished) pp 99-324.
Webb, G., 1995. Pesticide Monitoring Network 1993-1994. Project Report 22. Georgia Department of Natural Resources, Environmental Protection Division, Georgia Geologic Survey Branch, 56 p.
5
THIS PAGE LEFT BLANK

\.
Appendix A
Monitoring Well Construction Data
7

THIS PAGE LErr BLAHK

Wells in Apalachicola-Chattahoochee-Flint River Basin used between 9/93 and 6/96.
Well ID County Pad Backfill Bentonite Filter Pack Screened Total Well Plug Interval Interval Depth
LC-1C Sumter 0-2.5 2.5- 31.3 31.3 - 33.5 33.5-"' 41 35-45 45.0
LC-2A Sumter 0-3.0 3.0-62 62-64 64- 74.7 64.7 -74.7 74.7
LC-3A Sumter 0-3.0 3.0- 61 61-63 63- 73.4 63.4- 73.4 73.4
LC-5B Sumter 0-3.0 3.0-20.2 20.2-22.7 22.7-27.0 22.4- 32.4 32.4
LC-7A Sumter 0-2.2 2.2-33.5 33.5- 36.9 36.9-48.7 38.7-48.7 48.7
LC-8A Sumter 0- 1.3 1.3 - 38 38-40 40-51.7 41.7-51.7 51.7
CP-15A Randolph 0-2.2 2.2-15.1 15.1- 17.0 17.0-28.6 27.6-28.6 28.6
CP-18A Miller 0- 1.3 1.3-49 49- 51 51-68.8 58.8-68.8 68.8
CP-19C Seminole 0- 1.3 1.3-31.7 31.7-33 33- 54.3 44.3-54.3 54.3
CP-21A Baker 0-2.5 2.5- 37 37-39 39-48.8 38.8-48.8 48.8
CP-22A Terrell 0-2.3 2.3-22 22-24 24-33.8 23.8- 33.8 33.8
CP-23B Terrell 0-2.0 2.0-26.7 26.7- 32.8 32.8-44.2 32.2-44.2 44.2
CP-26B Sumter 0-2.0 2.0 - 11.8 11.8-15 15-28.5 18.5 - 28.5 28.5
CP-27A Worth 0-2.0 2.0- 10.9 10.9- 15 15-31.2 21.2-31.2 31.2
CP-28A Lee 0- 1.6 1.6-21.2 21.2- 31.6 31.6-43.7 33.7-43.7 43.7
CP-290 Dougherty 0-2.0 2.0-21 21-22 22-35.6 25.6-35.6 35.6
CP-30A Mitchell 0-2.0 2.0-25.5 25.5- 31.0 31.0-47.5 37.5- 47.5 47.5
AC-31A Miller 0-2.7 2.7-24.0 24.0-28.9 28.9-39.2 29.2-39.2 39.2
AC-32A Miller 0-3.3 3.3-24.5 24.5-29.7 29.7- 38.3 28.3 - 38.3 38.3
AC-34A Miller 0-3.3 3.3- 27 27-29 29- 37.5 27.5-37.5 37.5
AC-35B Miller 0-2.5 2.5- 56 56-58 58-69.3 59.3- 69.3 69.3
AC-36B Miller 0-2.5 2.5- 50 50-52 52-65 55-65 65
AC-38A Miller 0- 1.7 1.7-47 47-49 49-61 51-61 61
AC-39A Miller 0-3.0 3.0- 31 31- 33 33- 57.4 47.4- 57.4 57.4
All measurements are m feet.
9

Wells in the Upper Suwannee River Basin used between 8/95 and 6/96.
Well ID County Pad Backfill Bentonite Filter Pack Screened Total Depth Plug Interval Interval
1-2 Worth 0-3 ---- 3-5 5- 17 7- 17 17
2-3 Worth 0-2.5 2.5- II 11 - 14 14-24 14-24 24
4-1 Worth 0-2.5 2.5- 11 II - 13 13-23 13-23 23
7-3 Crisp 0-2 2-4 4-6 6-20 5- 15 20
8-1 Turner 0-2 2-6 6-8 8-20 10-20 20
9-1 Turner 0-2.5 2.5- 24 24-27.7 27.7-60 35-65 65
10-1 Tift 0-2 2-9 9- 10 10-22 12-22 22
11-1 Tift 0-2 2- 15 15- 17 17-31 21- 31 31
13-2 Tift 0-2 2-5 5-7 7- 19 9- 19 19
15-1 Turner 0-2 2-16 16- 18 18-51 26-46 51
16-1 Turner 0-2 2- II II - 13 13-30 20-30 30.4
18-1 Turner 0-2 2-5 5-7 7-20 5- 15 20
20-1 Turner 0-2 2-24 24-25 25-45 30-40 45
22-1 Irwin 0-2.5 2.5- 18 18-20 20-40 25-35 35
23-1 Irwin 0- I I- 10 10- 12 12-27 17-27 27
24-1 Irwin 0-2.5 2.5- 15 15- 17 17-37 27-37 37
25-2 Irwin 0-2.5 2.5- 12 12- 14 14-25 15-25 25
All measurements are m feet
10

Appendix B
Laboratory Reporting Sheets I Listing of Analytical Parameters
11

THIS PAGE LErr BLANK

Department of Agriculture AGRICULTURE BUILDING CAPITOL SQUARE ATLANTA. GEORGIA 30334 - 2001 USA TELEX: 80- 4349 GOA TRADE ATLANTA FAX: (404) 65&-9380
Pesticide Residue Laboratory Report for pesticide analysis EPA Method 507 (Screen 1)
Thomas T. Irvin Cnmmtss:or>e~
VVellNrunemD ---------------------------------------------------------------------
Srunpling Date-------- Time-------
Collected by ---------- GDA Lab Number --------------
Date Received-------- Was sample filtered before analysis? Yes or No
Date Analyzed------- Volume analyzed (in rnl) ________ _
Analyte Storet Umits Level Analyte Storet # # (ppb) (ppb)
Alachlor (Lasso) 77825 (m) 2.0 Merpnos· 38496
Ametryn (Evik) 38401 0.3 Methyl paraoxon 30009
Atraton 38414 0.2 MetOiochlor (Dual) 38923
Atrazine (Aatrex) 39033 (m) 3.0 Metneuzln (Sencor) 81408
Bromacil (Hyvar) 82198 0.6 (Me'JirchOS) 39610
Butachlor (Machete) 77860 0.5 Molinote (Ordram) 49562
Butylate (Sutan) 81410 0.7 Nopropomide (Oevrinol) 79195
Carboxin (Vrtavax) 70978 1.0 Norllurazon (Zonal) 78064
Chlorpropham 82322 0.5 Pebulote (Tillam) 79192 (ChloroiPC)
Cycloate (RoNeet) 04031 1.0 Prometon (Pramltol) 39056
Diazinon• 39570 1.0 PrometTyn (Caparol) 04036 (Spectracide)
Dichlorvos (DDVP) 38775 1.0 Pronomlde" (Kerb) 39080
Diphenamid (Dymid) 30255 1.0 Propaz~ne (Milogard) 38535
Disulfoton• (Di-Syston) 39010 1.0 Slmazlne (Princep) 39055
Disulfoton sulfone• 81031 1.0 Slmetryn 39054
Disulfoton Sulfoxide" 81888 1.0 Sttrofos 38877
EPTC (Eptam) 81894 0.5 T ebuthluron (Spike) 45607
Ethoprop (Prophos) 81758 0.5 Tefbacil (Sinbar) 38883
Fenamiphos 38929 1.0 (Terbufos)" 82088 (Nemacur)
Fenanmol 04101 1.0 Terbutryn (!gram) 38888
Flurldone (Sonar) 4100 1.0 Triademefon 38893
Hexazinone (Velpar) 30264 1.0 Tncyclazole 38903
MGK264 4098 1.0 Vemolate (Vemam) 82200
Limits: (m) is a Primary Maximum Contaminant Level for drinking water, * is qualitative results only. Srunples are collected in one liter amber glass bottles with no preservation added in the field.
Sudhir G. Kapadia Analyst An Equal Opportunity Employer
13
Umits (ppb)
1.0
1.0
1.0
1.13
1.0
1.0
0.1
0.1
0.5
1.0
1.0
0.5
1.0
1.0
1.0
1.0
0.1
0.2
1.0
1.0
0.2
0.6
1.0
Level (ppb)

I i
I I
I I I I i 'I
I I
Department of Agriculture AGRICULTURE BUILDING CAPITOL SQUARE ATLANTA, GEORGIA 30334-2001 USA TELEX: 80-4349 GDA TRADE ATLANTA FAX: (404) 65&-9380
Pesticide Residue Laboratory Report for pesticide analysis EPA Method 508 (Screen 2)
Thomas T. Irvin Cnmm!SSJO .... •o:-'
WeiJNrun~ ------------------------------------------------------------------
Srunpling Date-------- Time-------
Collected by ------------- GDA Lab Number --------
Date Received-------- Was sample filtered before analysis? Yes or No
Date Analyzed------- Volume analyzed (in ml) ____ _
Analyte Storet # I Umits level I Analyte I Storet# I Umits (ppb) Level
(ppb) (ppb) (ppb)
4.4-DDD I I
I I
I 78427 1 Heptachlor i 39410 I (m)0,4 (Rothane) ! i !
I I
4,4-DDE i 78426 I 1 : Heptachlor epoxide I
39420 I
(m)0.2 ! I I I
4.4-DDT 78425 1 I Hexachlorobenzene 39700 I 1.0 I
I i
i ! Methoxychlor
I ! Aldrin i 39330 1 I (Marlate)
I 39480 (m)40 ! I
I
I Chlorobenzilate• i 39460 1 I Propachlor (Ramrod) i 38533 i 1
I I i
I
I
'
i
i
Chloroneb I
38423 1 I Triflurolin 81284 !
1 i : i
Chlorothanlonil j i I
I (Bravo) . 49306
! 1 I
alpha-HCH 39336 0.2 ! ;
DCPA (DacthaO I 39770 : .01 i !
beta-HCH t 81288 I 0.2
Dieldrin ' 39380 1 i delta-HCH 34198 i 0.2 I
Endosulfan I I I gamma-HCH I
! 34361 i
1 I I 39782 I (m) 0.2 (Thiodan) i
I
i (Undone) i I
Endosulfan II 34356 1 I alpha-chlordane (Belt) ! 39348 I (m) 2.0 I 1. i I
i Endosuttan i 82623 I 1 I gamma-chlordane ! 39810 (m) 2.0 sulfate I
I I '
I I cis-Permethrin i
I
Endrin 39390 (m) 2.0 I 82687 0.3
(Rid-a-Bird) i i (Ambush) I '
Endrin aldehyde : I I ! I 82622 I 1 trans-Perrnethrin 82420 0.3
I
Etridiazole I
I 38793
I
(T errazole) 1 \ - - -I !
Limits: (m) is a Primary Maximum Contaminant Level for drinking water,* is qualitative results only. Samples are collected in one liter amber glass bottles with no preservation added in the field.
Sudhir G. Kapadia Analyst
An Equal Opportunity Employer 14

Department of Agriculture AGRICULTURE BUILDiNG CAPITOL SQUARE ATLANTA, GEORGIA 30334-2001 USA TELEX: 80-4349 GDA TRADE ATLANTA FAX: (404) 656-9380
Pesticide Residue Laboratory Report for pesticide analysis EPA Method 515.1 (Screen 3)
Thomas T. Irvin Comm;ssioner
VVellName~D ---------------------------------------------------------------------
Sampling Date--------------- Time------------
Collected by ----------- GDA Lab Number -------
Date Received-------------- VVas sample filtered before analysis? Yes or No
Date Analyzed-------------- Volume analyzed (in ml) ________ _
Analyte Storet Limits Levels Analyte Storet # Limits (ppb)
# (ppb) (ppb)
2, 4 -0 (Demise) 39730 (m) 70 DCPA acid metabolites 39770 1.0
2, 4-DB (Butoxone) 38746 1.9 Oalapon 38432 (m) 200
2, 4, 5-TP (Silvex) 39760 (m)SO Oicamba (Banvel) 38442 0.2
2. 4, 5-T 39740 0.11 Oicamba, 5-hydroxy- 04094 1
3.5 Oichlorobenzoic 1093 1.0 Oichlorprop 38451 1.0
Acid
4-Nitrophenol* 34646 1.23 Oinoseb (ONBP) 38779 0.1
Acif!uoren* (Blazer) 79193 1.0 Petachlorophenol
39032 (m) 1.0 (PCP)
Bentazon 38711 1.9 Picloram 39720 (m) 500
(Basagran)
Chloramben 82051 0.2 (Amiben)
Limits: (m) is a Primary Maximum Contaminant Level for drinking water,* is qualitative results only. Samples are collected in one liter amber glass bottles with no preservation added in the field.
Sudhir G. Kapadia Analyst
An Equal Opportunity Employer 15
Levels (ppb)
Department of Agriculture AGRICULTURE BUILDING CAPITOL SQUARE ATLANTA. GEORGIA 30334-2001 USA TELEX: 80- 4349 GOA TRADE ATLANTA FAX: (404) 656-9380
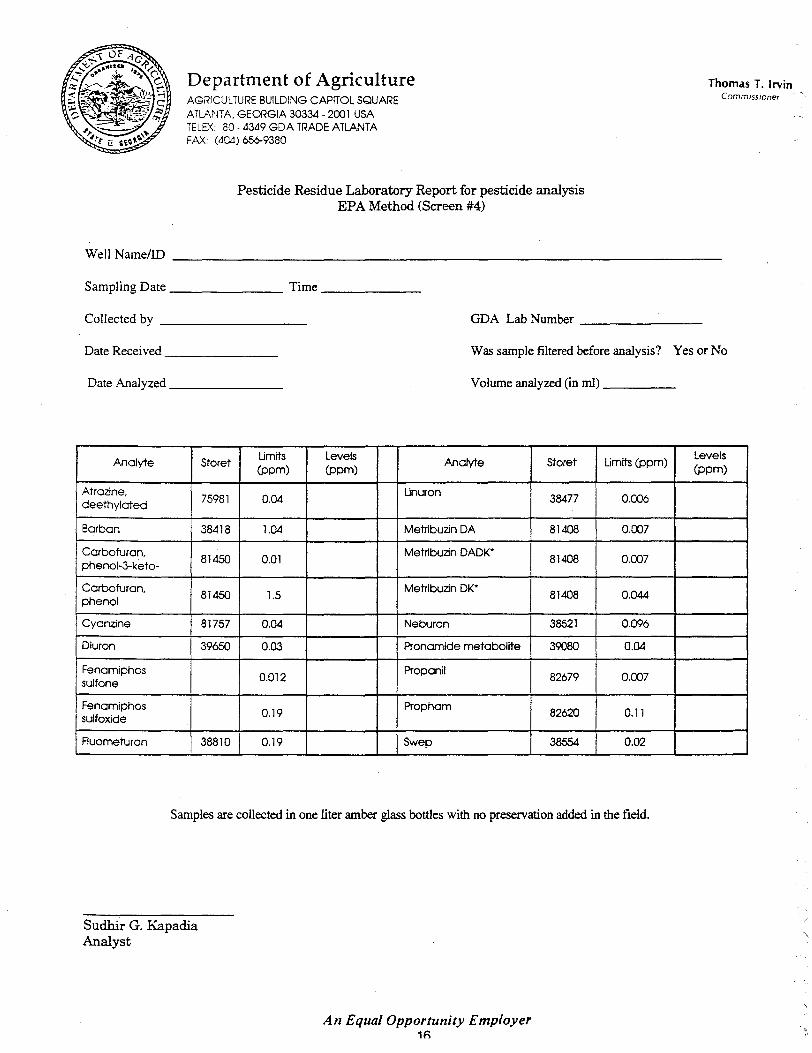
Pesticide Residue Laboratory Report for pesticide analysis EPA Method (Screen #4)
Thomas T. Irvin Commissioner
VVellNameroD ---------------------------------------------------------------------
Sampling Date --------------- Time -------------
Collected by ---------------- GDA Lab Number --------
Date Received------------- VVas sample filtered before analysis? Yes or No
Date Analyzed-------- Volume analyzed (in ml) _______ _
Analyte Storet Umits Levels Analyte Storet Umits (ppm)
Levels (ppm) (ppm) (ppm)
Atrazine. 75981 0.04
Unuron 38477 0.006 deethylated
Barban 38418 1.04 Metribuzin DA 81408 o.cm Carbofuran.
81450 0.01 Metribuzin DADK•
81408 0.007 phenol-3-keto-
Carbofuran. 81450 1.5
Metribuzin DK* 81408 0.044
phenol
Cyanzine 81757 0.04 Neburon 38521 0.096
Diu ron 39650 0.03 Pronamide metabolite 39080 0.04
Fenamiphos 0.012
Propanil 82679 0.007 sulfone
Fenamiphos 0.19
Prop ham 82620 0.11 sulfoxide
Fluometuron 38810 0.19 Swep 38554 0.02
Samples are collected in one liter amber glass bottles with no preservation added in the field.
Sudhir G. Kapadia Analyst
An Equal Opportunity Employer 1f>

Department of Agriculture AGRICULTURE BUILDING CAPITOL SQUARE ATLANTA. GEORGIA 30334-2001 USA TELEX: 80-4349 GDA TRADE ATLANTA FAX: (404) 656-9380
Pesticide Residue Laboratory Report for pesticide analysis EPA Method 531.1 (Screen #5)
Thomas T. Irvin CommiSSIOner
WellNrum~ ------------------------------------------------------------------
Sampling Date--------- Time-------
Collected by -------------- GDA Lab Number --------
Date Received-------- Was srumple filtered before analysis? Yes or No
Date Analyzed--------- Volume analyzed (in ml) ____ _
Analyte I Stcret # I Umits Level (ppb) (ppb)
Aldicarb (Temik) I 39053 ' 1.0 '
Aldicarb sulfone I 04257 ' 2.0 !
Aldicarb sulfoxide i 04260 ' 2.0 '
Aprocarb (Baygon) i 38587 ' 1.0 I
i Carbaryl (Sevin) I 77700 2.0 i
I Carbo fur an I 81450 ' 2.0
(Furadan) I
I i !
I 3-
I 82584 2.0 I
Hydroxycarbofuran I ' I
I Methiocarb I 38500 ' 4.0 I I :
I (Mesurol) I i !
I I !
Methomyl 39051 i 1.0 ! (Lannate) I
! I
I Oxyamyl (Vydate) I 38866 ! 2.0
I I
BDL=Below Detection Limit Srumples collected in 60 ml FEP with 1.8ml of a buffer solution added as a preservative.
Sudhir G. Kapadia Analyst
An Equal Opportunity Employer 17

THIS PAGE LEFT BLANK

f.
'·
Appendix C
Tabulation of Field Parameters
(wells arranged by county)
19

THIS PAGE LEFT BLAHK

Baker County: CP21A
Date pH (std. Dissolved Temp. oc Specific Depth to Sampled units) Oxygen Conductance ground water
(ppm) {/.LS)
10119/93 5.96 25.0 25.7
115/94 8.59 4.80 20.5 .200 24.9
4/4/94 7.06 5.50 21.6 262 16.1
5/3/94 9.49 4.40 21.7 11.8
6/2/94 7.44 6.0 22.0 18.4
9/12/95 7.65 4.3 23.9 0.210 29.15
5/2/96 7.55 4.9 24.7 0.234 18.9
Crisp County: 7-3
Date pH (std. Dissolved Temp. oc Specific Depth to Sampled units) Oxygen Conductance ground water
(ppm) {/.LS)
4/4/96 4.79 8.7 16.4 0.159 3.9
6/18/96 3.95 7.9 20.3 0.171 8.7
Dougherty County: CP29D
Date pH (std. Dissolved Temp. oc Specific Depth to Sampled units) Oxygen Conductance ground water
(ppm) {/.LS)
10/13/93 11.6 17.3 18.8
11116/93 7.77 20.0 17.4
2/1194 7.9 18.8 12.5
4/4/94 7.9 8.4 19.1 0.202 11.3
5/3/94 6.86 8.2 19.3 9.8
6/20/94 6.27 8.6 I 9.4 14.1
8/10/95 7.30 5.8 20.9 0.213 12.2
1125/96 6.96 5.4 17.1 0.213 20.1
2/29/96 7.08 6.1 19.6 0.201 15.2
5/8/96 7.61 6.8 18.5 0.209 13.9
21

Irwin County: 22-1
Date pH (std. Dissolved Temp. oc Specific Depth to Sampled units) Oxygen Conductance ground water
(ppm) (J.LS)
11128/95 5.66 23.0 0.032 9.0
4/23/96 5.52 4.3 23.8 0.030 4.5
5/25/96 4.49 5.7 19.4 0.023 5.6
Irwin County: 23-1
Date pH (std. Dissolved Temp. oc Specific Depth to Sampled units) Oxygen Conductance ground water
(ppm) (J.LS)
11/27/95 4.72 21.3 0.047 18.2
4/2/96 4.73 8.4 19.6 0.047 9.6
6/25/96 3.95 8.0 20.1 0.060 12.2
Irwin County: 24-1
Date pH (std. Dissolved Temp. oc Specific Depth to Sampled units) Oxygen Conductance ground water
(ppm) (J.LS)
1111195 4.84 9.9 20.9 0.071 21.6
4/2/96 5.51 6.8 22.2 0.111 8.4
Irwin County: 25-2
Date pH (std. Dissolved Temp. oc Specific Depth to Sampled units) Oxygen Conductance ground water
(ppm) (J.LS)
4/24/96 5.14 5.6 19.2 0.057 8.6
1116/96 5.20 3.4 20.4 0.048 12.0
22
\
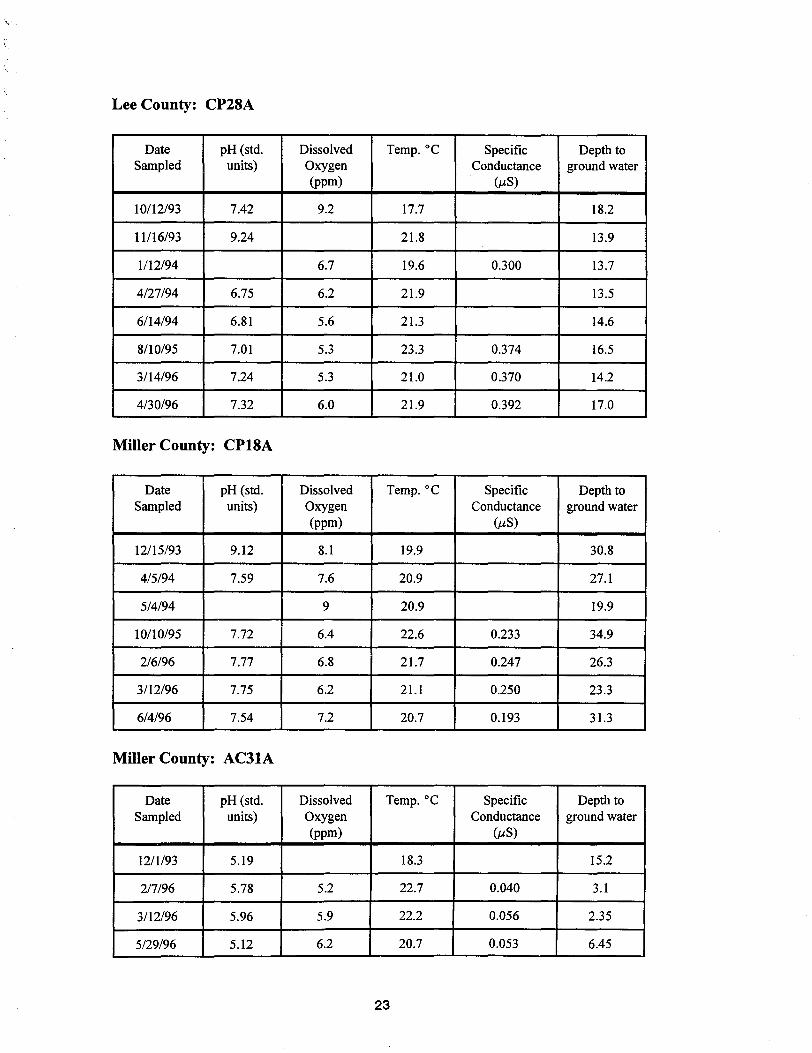
Lee County: CP28A
Date pH (std. Dissolved Temp. oc Specific Depth to Sampled units) Oxygen Conductance ground water
(ppm) (uS)
10/12/93 7.42 9.2 17.7 18.2
11116/93 9.24 21.8 13.9
1/12/94 6.7 19.6 0.300 13.7
4/27/94 6.75 6.2 21.9 13.5
6/14/94 6.81 5.6 21.3 14.6
8/10/95 7.01 5.3 23.3 0.374 16.5
3/14/96 7.24 5.3 21.0 0.370 14.2
4/30/96 7.32 6.0 21.9 0.392 17.0
Miller County: CP18A
Date pH (std. Dissolved Temp. oc Specific Depth to Sampled units) Oxygen Conductance ground water
(ppm) (uS)
12/15/93 9.12 8.1 19.9 30.8
4/5/94 7.59 7.6 20.9 27.1
5/4/94 9 20.9 19.9
10/10/95 7.72 6.4 22.6 0.233 34.9
2/6/96 7.77 6.8 21.7 0.247 26.3
3/12/96 7.75 6.2 21.1 0.250 23.3
6/4/96 7.54 7.2 20.7 0.193 31.3
Miller County: AC31A
Date pH (std. Dissolved Temp. oc Specific Depth to Sampled units) Oxygen Conductance ground water
(ppm) (uS)
12/1193 5.19 18.3 15.2
2/7/96 5.78 5.2 22.7 0.040 3.1
3/12/96 5.96 5.9 22.2 0.056 2.35
5/29/96 5.12 6.2 20.7 0.053 6.45
23

Miller County: AC32A
Date pH (std. Dissolved Temp. oc Specific Depth to Sampled units) Oxygen Conductance ground water
(ppm) (#S)
12/13/95 6.31 4.5 20.3 0.053 33.7
2/20/96 6.21 5.8 19.8 0.059 4.85
5/29/96 5.55 6.1 20.2 0.068 6.2
Miller County: AC34A
Date pH (std. Dissolved Temp. oc Specific Depth to Sampled units) Oxygen Conductance ground water
(ppm) (#S)
12/I/93 7.48 18.3 22.2
I/5/94 7.52 8.5 19.3 14.1
3/2/94 7.81 10.1 19.2 8.1
4/19/94 7.3 21.2 0.4
9/27/95 7.61 22.1 0.178 26.3
2/6/96 7.75 6.0 20.7 0.202 8.0
3/5/96 7.58 6.1 21.3 0.170 4.9
4/13/96 7.58 8.0 21.3 0.158 5.7
Miller County: AC35B
Date pH (std. Dissolved Temp. oc Specific Depth to Sampled units) Oxygen Conductance ground water
(ppm) (#S)
10/28/93 7.75 8.4 19.1 42.3
12/7/94 8.88 18.4 37.8
2/24/94 7.47 6.5 19.5 21.4
4/19/94 6.88 6.2 21.1 12.0
9/13/95 7.44 5.0 22.3 0.278 38.8
2/7/96 7.41 5.7 20.6 0.238 24.4
3/5/96 7.52 5.2 21.2 0.214 18.8
5/13/96 7.46 6.2 21.3 0.208 18.5 --->
24

,(
'
Miller County: AC36B
Date pH (std. Dissolved Temp. oc Specific Depth to Sampled units) Oxygen Conductance ground water
(ppm) (uS)
12115/93 6.4 19.6 0.200 34.9
Miller County: AC38A
Date pH (std. Dissolved Temp. oc Specific Depth to Sampled units) Oxygen Conductance ground water
(ppm) (uS)
10/20/93 7.57 8.6 21.7 37.7
12/8/93 7.65 7.3 19.8 36.4
Miller County: AC39A
Date pH (std. Dissolved Temp. oc Specific Depth to Sampled units) Oxygen Conductance ground water
(ppm) (uS)
10/19/93 6.15 22.6 33.6
12/8/93 7.75 4.8 20.2 32.2
2/23/94 6.93 4.8 20.4 19.9
4/20/94 5.9 21.6 16.5
10/30/95 7.42 7.2 21.6 0.238 38.3
25
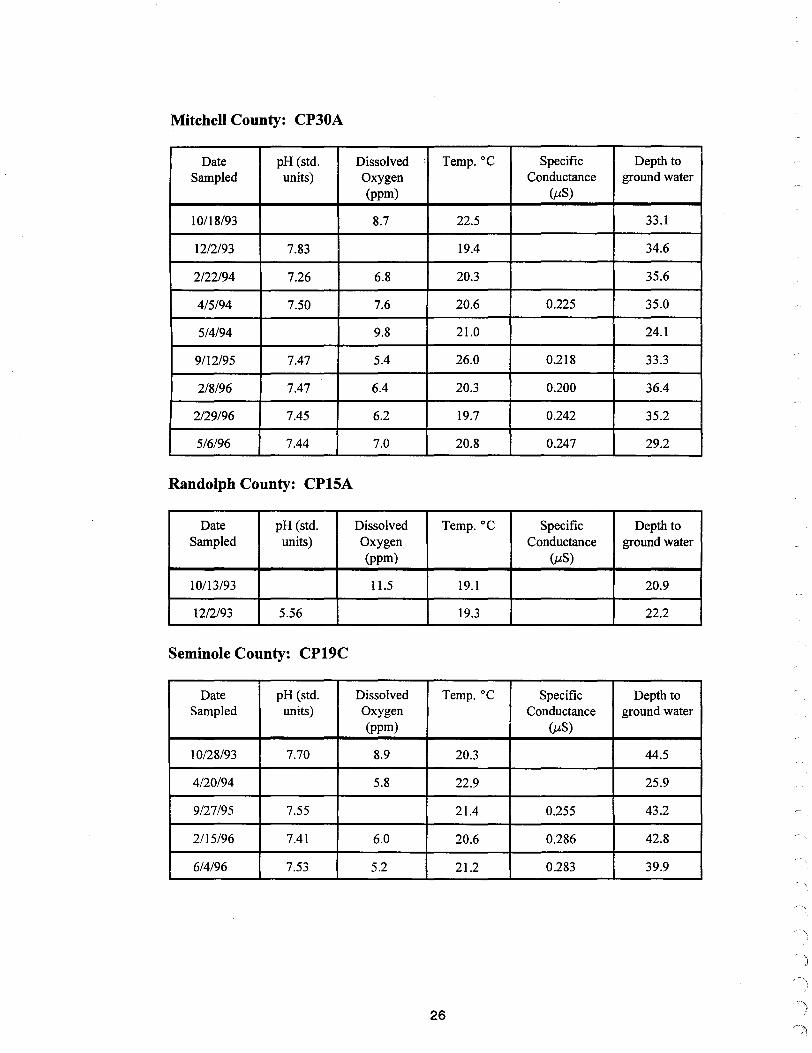
Mitchell County: CP30A
Date pH (std. Dissolved Temp. oc Specific Depth to Sampled units) Oxygen Conductance ground water
(ppm) {tlS)
10/18/93 8.7 22.5 33.1
12/2/93 7.83 19.4 34.6
2/22/94 7.26 6.8 20.3 35.6
4/5/94 7.50 7.6 20.6 0.225 35.0
5/4/94 9.8 21.0 24.1
9/12/95 7.47 5.4 26.0 0.218 33.3
2/8/96 7.47 6.4 20.3 0.200 36.4
2/29/96 7.45 6.2 19.7 0.242 35.2
5/6/96 7.44 7.0 20.8 0.247 29.2
Randolph County: CP15A
Date pH (std. Dissolved Temp. oc Specific Depth to Sampled units) Oxygen Conductance ground water
(ppm) {tlS)
10/13/93 11.5 19.1 20.9
12/2/93 5.56 19.3 22.2
Seminole County: CP19C
Date pH (std. Dissolved Temp. oc Specific Depth to Sampled units) Oxygen Conductance ground water
(ppm) {tlS)
10/28/93 7.70 8.9 20.3 44.5
4/20/94 5.8 22.9 25.9
9/27/95 7.55 21.4 0.255 43.2
2115/96 7.41 6.0 20.6 0.286 42.8
6/4/96 7.53 5.2 21.2 0.283 39.9
26

\'
Sumter County: LClC
Date pH (std. Dissolved Temp. oc Specific Depth to Sampled units) Oxygen Conductance ground water
(ppm) (j.LS)
1112/93 8.5 17.1 14.7
12/8/93 8.19 7.0 18.2 7.1
2/2/94 7.5 18.0 1.3
8/16/95 7.41 4.4 21.8 0.192 12.4
8/29/95 6.93 4.5 21.5 0.225 18.5
Sumter County: LC2A
Date pH (std. Dissolved Temp. ·c Specific Depth to Sampled units) Oxygen Conductance ground water
(ppm) ~S)
9/29/93 7.11 59.6
Sumter County: LC3A
Date pH (std. Dissolved Temp. oc Specific Depth to Sampled units) Oxygen Conductance ground water
(ppm) (J.LS)
10/6/93 6.35 8.3 22.6 66.6
1111193 6.25 10.6 17.1 64.9
116/94 6.65 7.4 19.1 65.1
3/14/94 6.11 7.7 19.1 64.2
9/14/95 6.30 6.8 20.2 0.143 67.6
3/4/96 6.57 7.3 19.1 0.107 64.2
27
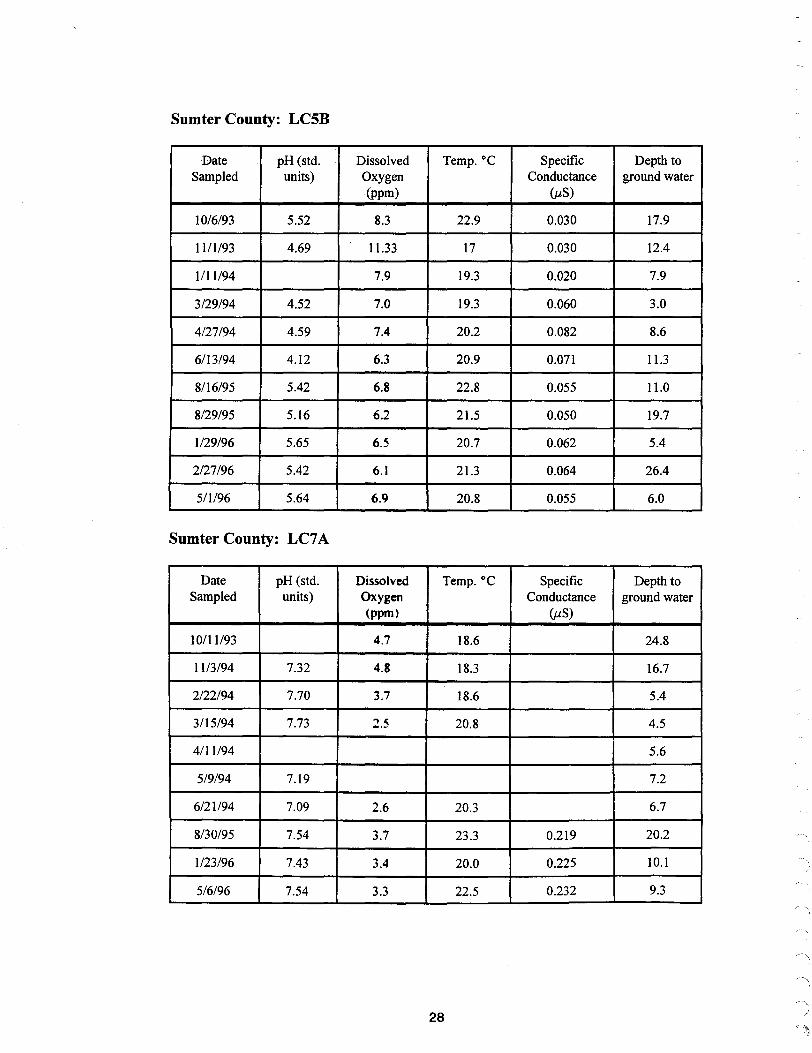
Sumter County: LCSB
Date pH (std. Dissolved Temp. oc Specific Depth to Sampled units) Oxygen Conductance ground water
.(ppm) (J_tS)
10/6/93 5.52 8.3 22.9 0.030 17.9
11/1/93 4.69 11.33 17 0.030 12.4
1/11/94 7.9 19.3 0.020 7.9
3/29/94 4.52 7.0 19.3 0.060 3.0
4/27/94 4.59 7.4 20.2 0.082 8.6
6/13/94 4.12 6.3 20.9 0.071 11.3
8/16/95 5.42 6.8 22.8 0.055 11.0
8/29/95 5.16 6.2 21.5 0.050 19.7
1/29/96 5.65 6.5 20.7 0.062 5.4
2/27/96 5.42 6.1 21.3 0.064 26.4
511196 5.64 6.9 20.8 0.055 6.0
Sumter County: LC7 A
Date pH (std. Dissolved Temp. oc Specific Depth to Sampled units) Oxygen Conductance ground water
(ppm) (J_tS)
10111/93 4.7 18.6 24.8
11/3/94 7.32 4.8 18.3 16.7
2/22/94 7.70 3.7 18.6 5.4
3/15/94 7.73 :!.5 20.8 4.5
4/11194 5.6
5/9/94 7.19 7.2
6/21/94 7.09 2.6 20.3 6.7
8/30/95 7.54 3.7 23.3 0.219 20.2
1123/96 7.43 3.4 20.0 0.225 10.1
5/6/96 7.54 3.3 22.5 0.232 9.3
,--\
28

Sumter County: LC8A
Date pH (std. Dissolved Temp. oc Specific Depth to Sampled units) Oxygen Conductance ground water
(ppm) {t.LS)
9/30/93 7.43 38.2
1112/93 7.81 9.6 17.2 29.6
116/94 7.69 6.8 18.3 15.2
3/15/94 7.42 6.2 20.4 11.9
4111194 7.99 7.1 19.8 0.203 15.4
5/9/94 7.38 15.1
10/30/95 7.51 5.7 20.4 0.217 28.0
1123/96 7.79 6.0 20.4 0.216 17.4
5/16/96 7.75 7.0 21.6 0.210 17.5
Sumter County: CP26B
Date pH (std. Dissolved Temp. oc Specific Depth to Sampled units) Oxygen Conductance ground water
(ppm) {t.LS)
11130/93 4.4 9.2 19.3 4.2
1112/94 6.2 19.8 3.3
4/27/94 4.33 5.1 22.2 7.6
6/13/94 3.26 4.5 22.2 3.25
9/25/95 4.67 20.2 0.068 13.85
1130/96 4.62 6.1 20.0 0.065 4.65
3/4/96 4.81 5.4 19.3 0.078 8.15
5115/96 5.55 7.3 22.8 0.094 6.0
29

Terrell County: CP22A
Date pH (std. Dissolved Temp. oc Specific Depth to Sampled units) Oxygen Conductance ground water
(ppm) {J.tS)
10/27/93 5.38 10.5 21.7 16
10112/95 5.75 6.5 19.5 0.026 17.5
2114/96 5.77 7.2 19.5 0.034 5.5
5/22/96 5.92 7.0 25.7 0.044 4.0
Terrell County: CP23B
Date pH (std. Dissolved Temp. oc Specific Depth to Sampled units) Oxygen Conductance ground water
(ppm) {J.tS)
10/13/93 9.34 20.0 32.2
12/13/95 5.23 5.7 19.1 0.020 28.2
2114/96 5.64 7.2 19.4 0.023 23.1
3/13/96 5.68 5.4 19.4 0.026 21.8
5/23/96 5.45 7.1 20.2 0.024 25.6
Tift County: 10-1
Date pH (std. Dissolved Temp. oc Specific Depth to Sampled units) Oxygen Conductance ground water
(ppm) {J.tS)
119196 4.56 18.6 0.230 5.9
4117/96 4.91 8.2 16.9 0.181 3.5
6113/96 4.17 7.9 18.5 0.183 5.2
Tift County: 11-1
Date pH (std. Dissolved Temp. oc Specific Depth to Sampled units) Oxygen Conductance ground water
(ppm) {J.tS)
l/9/96 4.84 19.4 0.108 2.6
4/9/96 5.36 5.4 21.8 0.121 1.8
6/11/96 4.15 6.8 19.0 0.119 3.2
30
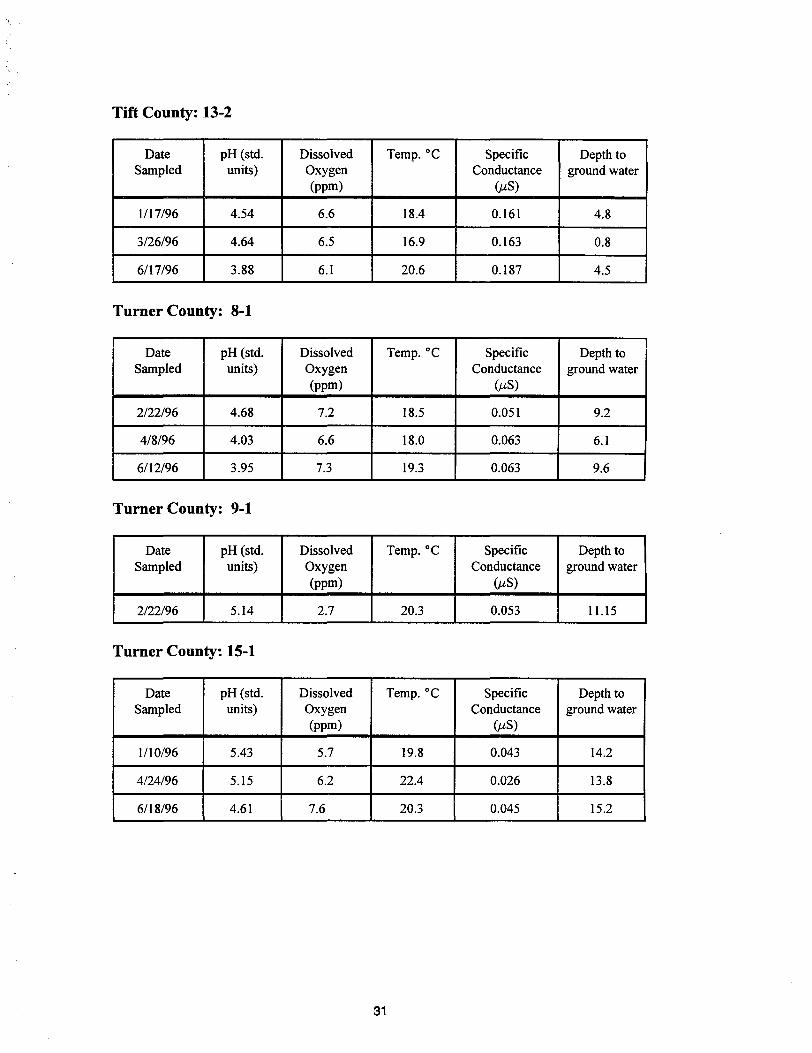
Tift County: 13-2
Date pH (std. Dissolved Temp. oc Specific Depth to Sampled units) Oxygen Conductance ground water
(ppm) (/.lS)
l/17/96 4.54 6.6 18.4 0.161 4.8
3/26/96 4.64 6.5 16.9 0.163 0.8
6/17/96 3.88 6.1 20.6 0.187 4.5
Turner County: 8-1
Date pH (std. Dissolved Temp. oc Specific Depth to Sampled units) Oxygen Conductance ground water
(ppm) (/.lS)
2/22/96 4.68 7.2 18.5 0.051 9.2
4/8/96 4.03 6.6 18.0 0.063 6.1
6/12/96 3.95 7.3 I 9.3 0.063 9.6
Turner County: 9-1
Date pH (std. Dissolved Temp. oc Specific Depth to Sampled units) Oxygen Conductance ground water
(ppm) (/.lS)
2/22/96 5.14 2.7 20.3 0.053 11.15
Turner County: 15-1
Date pH (std. Dissolved Temp. oc Specific Depth to Sampled units) Oxygen Conductance ground water
(ppm) (/.lS)
l/10/96 5.43 5.7 19.8 0.043 14.2
4/24/96 5.15 6.2 22.4 0.026 13.8
6/18/96 4.61 7.6 20.3 0.045 15.2
31

Turner County: 16-1
Date pH (std. Dissolved Temp. oc Specific Depth to Sampled units) Oxygen Conductance ground water
(ppm) (uS)
4/3/96 4.64 8.9 19.4 0.154 9.1
6112/96 3.86 8.2 19.6 0.154 14.3
Turner County: 18-1
Date pH (std. Dissolved Temp. oc Specific Depth to Sampled units) Oxygen Conductance ground water
(ppm) (uS)
2/21196 3.80 8.5 14.1 0.142 2.5
4/8/96 5.13 4.9 19.2 0.186 0.9
6/26/96 3.86 6.2 22.2 0.197 4.3
Turner County: 20-1
Date pH (std. Dissolved Temp. oc Specific Depth to Sampled units) Oxygen Conductance ground water
(ppm) (uS)
10118/95 4.74 6.4 20.4 0.082 23.3
Worth County: CP27 A
Date pH (std. Dissolved Temp. oc Specific Depth to Sampled units) Oxygen Conductance ground water
(ppm) (uS)
I 0/1 I/93 9.5 20.3 10.9
1113/93 7.53 9.3 20.4 7.4
2/22/94 7.00 8.8 19.7 5.5
4/28/94 6.29 7.8 20.3 4.5
6/14/94 6.67 6.8 20.4 7.3
8/30/95 7.18 6.8 24.3 0.210 12.0
1130196 7.11 6.7 21.4 0.202 7.6
2/27/96 6.99 6.8 22.2 0.207 7.3
5/6/96 6.57 6.8 23.3 0.201 7.5
32
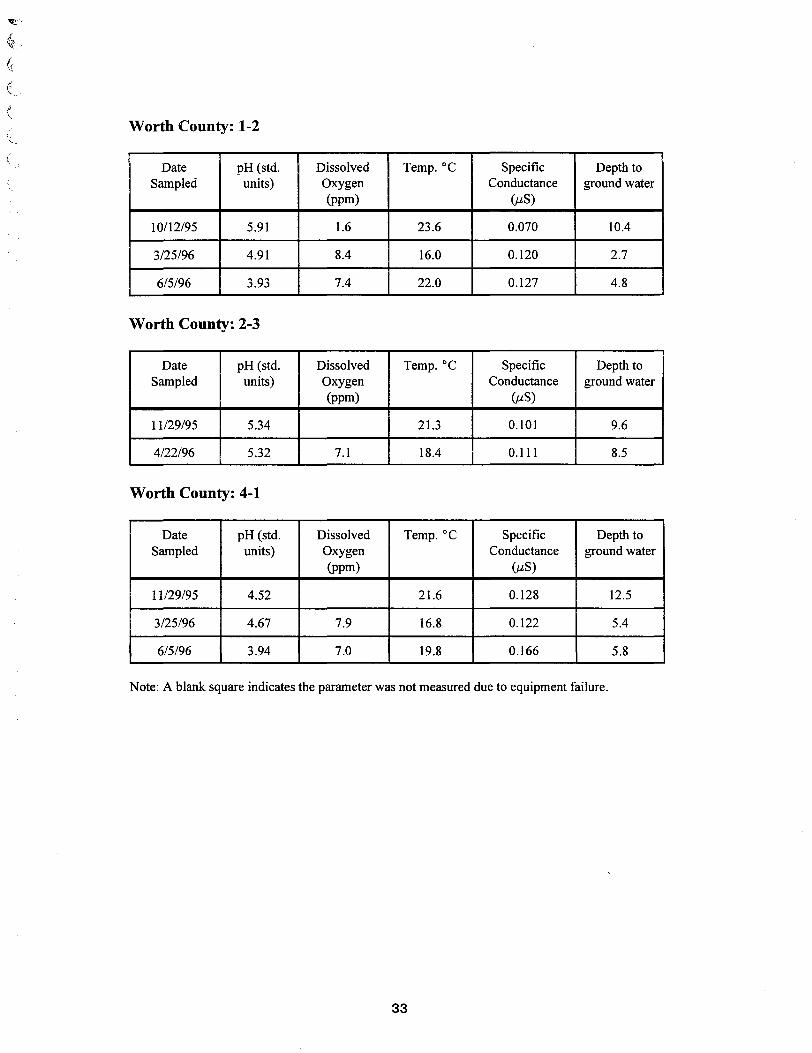
Worth County: 1-2
Date pH (std. Dissolved Temp. oc Specific Depth to Sampled units) Oxygen Conductance ground water
(ppm) {J.tS)
10/12/95 5.91 1.6 23.6 0.070 10.4
3/25/96 4.91 8.4 16.0 0.120 2.7
6/5/96 3.93 7.4 22.0 0.127 4.8
Worth County: 2-3
Date pH (std. Dissolved Temp. oc Specific Depth to Sampled units) Oxygen Conductance ground water
(ppm) {J.tS)
11/29/95 5.34 21.3 0.101 9.6
4/22/96 5.32 7.1 18.4 0.111 8.5
Worth County: 4-1
Date pH (std. Dissolved Temp. oc Specific Depth to Sampled units) Oxygen Conductance ground water
(ppm) {J.tS)
11/29/95 4.52 21.6 0.128 12.5
3/25/96 4.67 7.9 16.8 0.122 5.4
6/5/96 3.94 7.0 19.8 0.166 5.8
Note: A blank square indicates the parameter was not measured due to equipment failure.
33

Quantity: 100 Cost: $588.00
The Department of Natural Resources is an equal opportunity employers and offers all persons the opportunity to compete and participate in each area of DNR employment regardless of race, color, religion, national origin, age, handicap, or other non-merit factors.