Embed Size (px)
Citation preview
THEORETICAL I’OPULATION BIOLOGY 14, 215-230 (1978)
A General Formula for the Sensitivity of Population Growth Rate to Changes in
Life History Parameters
IfAL CASWELL
Biological Sciences Group U-42, University of Connecticut, Stows, Connecticut 06268
Received July 15, 1977
This paper considers the sensitivity of population growth to small changes in birth, growth, survival, and migration probabilities for an arbitrary population classification (i.e., age, instar, size, developmental stage, age, and spatial location, etc.). The stage-specific life history parameters are expressed in a discrete-time system of linear difference equations, the dominant eigenvalue of which defmes the population growth rate. The sensitivity of this eigenvalue to production of class i by class j individuals is shown to be proportional to the product of the reproductive value of stage i and the abundance of stage j in the stable stage distribution. This formula is readily computable, and several examples are presented. For the special case of age-structured populations, this formula reduces to those derived by Hamilton, Emlen, and Goodman.
INTRODUCTION
The problem of the sensitivity of population growth rate to small changes in life history parameters was first investigated numerically by Lewontin (1965) using simple artificial life tables. Hamilton (1966), Demetrius (1969), Emlen (1970), Goodman (1971), Keyfitz (1971), and Mertz (1971) have since tackled the problem in a more analytical fashion. The purpose of this paper is to present a new formulation for growth rate sensitivity, which has several advantages over those derived previously. It is applicable to any linear population growth model, whether based on age distributions, on more general developmental stage distributions (e.g., size, instars, etc.), or even on multiple classification distribu- tions (e.g., age and size or age and spatial location). This allows existing theory to be extended to those organisms, such as many plants, for which age is an inadequate state variable. The formulas are easily computable for real popula- tions, and they allow several results already derived in the literature to be modified or extended. A brief description of this formula and an application to a plant population have been presented in Caswell and Werner (1978).
215 0044%5809/78/0142-0215$02.00/O
Copyright 0 1978 by Academic Press, Inc. AU rights of reproduction in any form resermd.
216 HAL CASWJZLL
DERIVATIONS
Linear Population Models
The derivation is based on a linear, discrete, time-invariant model of popula- tion growth:
qt + 1) = AC(t). (1)
Here, Z(t) is an n-dimensional vector, the elements of which (xi) give the number of individuals in the ith stage at time t. A is an tl x n matrix, the elements of which (aij) are determined by the birth, growth, death, survival, and migration processes of the population. Such a model is, in essence, the dynamic expression of an instantaneous life table, and can be regarded either as describing population growth at the instant for which the life table is valid or as predicting the hypothe- tical pattern of growth that would result if the life table were to remain in effect indefinitely. The assumptions of linearity and time-invariance exclude considerations of density effects and temporal fluctuations in the environment.
This formulation was originally developed, using an age structure classifica- tion, by Bernardelli (1941), Lewis (1942), and Leslie (1945). If the units of time and age are the same, the matrix A has the special form commonly known as a Leslie matrix:
A =
where Fi is the effective fecundity of an i-year-old and Pi is the probability of survival from age i to age i + 1.
Most of the analytical work on (I), and all of the work on growth rate sensi- tivity, has been based on such age-structured models. It is not generally appre- ciated just how many populations cannot be adequately described using age distribution as a state variable (Caswell et al., 1972). Classifications by instar (Lefkovitch, 1965), size class (Usher, 1966, Hartshorn, 1975), developmental stage (Werner and Caswell, 1977) or even multiple classifications (Rogers, 1966; Slobodkin, 1953; Sinko and Streifer, 1969) are more appropriate for a wide variety of organisms. Any of these classifications can be accommodated within the framework of Eq. (l), but theory which depends on the special form of (2) is inappropriate.
The general solution to Eq. (1) is
f(t) = f c,git, (3) i=l
GROWTH RATE SENSITIVITY 217
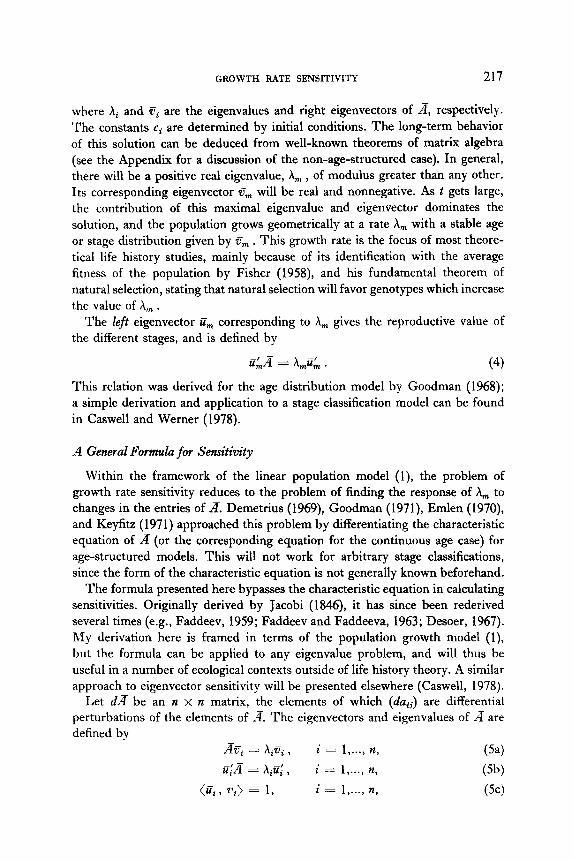
where hi and ci are the eigenvalues and right eigenvectors of & respectively. The constants ci are determined by initial conditions. The long-term behavior of this solution can be deduced from well-known theorems of matrix algebra (see the Appendix for a discussion of the non-age-structured case). In general, there will be a positive real eigenvalue, &,, , of modulus greater than any other. Its corresponding eigenvector tiTn will be real and nonnegative. As t gets large, the contribution of this maximal eigenvalue and eigenvector dominates the solution, and the population grows geometrically at a rate X, with a stable age or stage distribution given by v;, . This growth rate is the focus of most theore- tical life history studies, mainly because of its identification with the average fitness of the population by Fisher (1958), and his fundamental theorem of natural selection, stating that natural selection will favor genotypes which increase the value of & .
The left eigenvector ii,,, corresponding to X, gives the reproductive value of the different stages, and is defined by
i&A = A,ii~ . (4)
This relation was derived for the age distribution model by Goodman (1968); a simple derivation and application to a stage classification model can be found in Caswell and Werner (1978).
A General Formula for Sensitivity
Within the framework of the linear population model (1) the problem of growth rate sensitivity reduces to the problem of finding the response of h, to changes in the entries of d Demetrius (1969), Goodman (1971), Emlen (1970), and Keyfitz (1971) approached this problem by differentiating the characteristic equation of A (or the corresponding equation for the continuous age case) for age-structured models. This will not work for arbitrary stage classifications, since the form of the characteristic equation is not generally known beforehand.
The formula presented here bypasses the characteristic equation in calculating sensitivities. Originally derived by Jacobi (1846), it has since been rederived several times (e.g., Faddeev, 1959; Faddeev and Faddeeva, 1963; Desoer, 1967). My derivation here is framed in terms of the population growth model (1). but the formula can be applied to any eigenvalue problem, and will thus be useful in a number of ecological contexts outside of life history theory. A similar approach to eigenvector sensitivity will be presented elsewhere (Caswell, 1978).
Let dx be an n x n matrix, the elements of which (da,J are differential perturbations of the elements of 2ii. The eigenvectors and eigenvalues of A are defined by
& = xiui ( i = I,..., n, (54 $A = hiil,’ , i = l,..., II, (5b)
(zii, F<) = 1, i = l,..., 12, (5c)
218 HAL CASWELL
where (%,jQ = 3’7 is the scalar product of x and 7. Equation (5~) is a normalization that may be assumed without loss of generality.
We wish to find the change dh, in the maximum eigenvalue caused by the change d& in the life history. We start with the equation defining A, :
A-q,, = h,q,, . (6)
Taking the differential of both sides yields
Next, form the scalar product of both sides of (7) with iim : (7)
Expanding the scalar products and simplifying leaves1
dh, = ((di& , i&J. (9)
An appealing aspect of this result is that it can deal with simultaneous changes in several life history stages at once. For most applications, however, and for comparison with existing theory, the formula can be simplified by assuming that only one parameter is changing at a time. In this case dif contains only a single nonzero element, da, , and (9) simplifies to
where u,(i) and w&) are the reproductive value of the ith class and the repre- sentation of the jth class in the stable stage distribution, respectively. Since aii measures the production of class i individuals by a class j individual in a single time unit, (10) has the reasonable interpretation that A,,, is most sensitive to changes in life history parameters describing the production of high reproductive value individuals by members of abundant age classes.
For the age-structured case, only the first row and subdiagonal terms can be modified, and (10) can be rewritten as
____ = %n(i + 1) %n,(i), dp, = daj,,.j
d&n d&n - = - = urn(l) urn(j). dFj da,, (12)
1 If the normalization (SC) is not assumed, Eq. (9) should be replaced by dA,,, = <@A>%, Em>/<%, G> and Eq. (13) by I dL I < II dAIl * I 4 I * I rS, Ill<%, %>I.
GROWTH RATE SENSITIVITY 219
Thus, the sensitivity of & to changes in fecundity is directly proportional to the stable age distribution, while the sensitivity to survival changes involves reproductive values as well.
A potentially useful sensitivity index can be derived from (9). Taking norms of both sides yields
where the matrix norm i/ dAI/ = (x:i,j du~j)l~L. The sensitivity index S = 1 V, 1 . j ii,,, / relates the absolute change in h,,
to the overall magnitude of the change in the life history parameters. Because of the normalization (5c), S > 1; values considerably larger than 1 indicate that the life history involved may be (because the relationship is only an in- equality) unstable in the sense that X, is highly sensitive to life history alterations. Note that S is not limited to changes in only one parameter at a time.
Some Examples
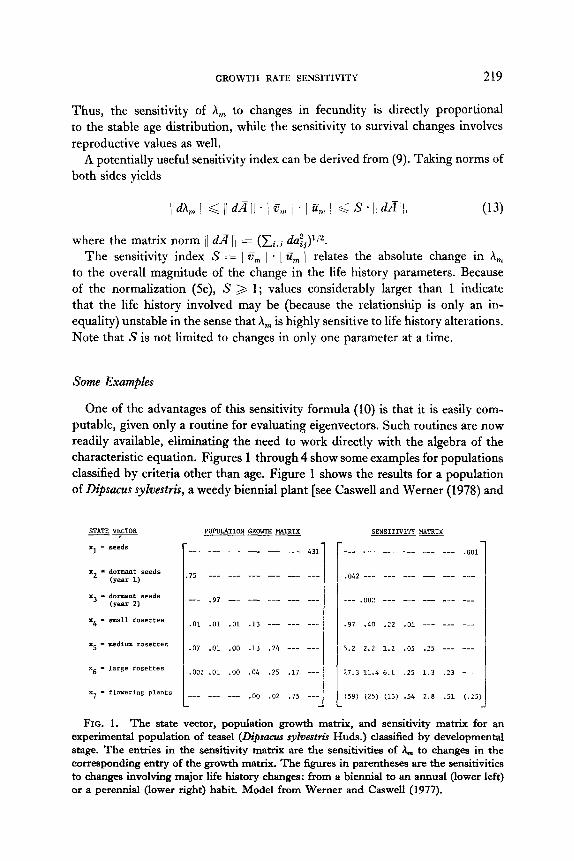
One of the advantages of this sensitivity formula (10) is that it is easily com- putable, given only a routine for evaluating eigenvectors. Such routines are now readily available, eliminating the need to work directly with the algebra of the characteristic equation. Figures 1 through 4 show some examples for populations classified by criteria other than age. Figure 1 shows the results for a population of Dipsucus syhestris, a weedy biennial plant [see Caswell and Werner (1978) and
_-_ ___ _-_ -- -- _-- 431
75 ___ --_ __- ___ ___ -__
__- .g, __- --- _-- ___ ___
.Ol .Ol .Ol .13 --- ___ _-_
.07 .Ol .oo .13 .24 --- ---
.OO? .Ol .OO .04 .25 .17 ---
--_ ___ ___ .oo .o* .75 --_
!4xTIX SENSITIVITY
-_- --- ___ --_ ___ ___ .OOl
.042 ___ ___ ___ _-_ _-- ___
--- .ooz ___ --_ __- --- -_-
.97 .40 .f? .Ol _-- ___ --_
5.2 2.2 1.2 .05 .25 --- ---
17.3 11.4 6.1 .25 1.3 .23 ---
(59) (25) (13) .54 2.8 .51 (.25
FIG. 1. The state vector, population growth matrix, and sensitivity matrix for an experimental population of teasel (Dipsacur sylvestris Huds.) classified by developmental stage. The entries in the sensitivity matrix are the sensitivities of A,,, to changes in the corresponding entry of the growth matrix. The figures in parentheses are the sensitivities to changes involving major life history changes: from a biennial to an annual (lower left) or a perennial (lower right) habit. Model from Werner and Caswell (1977).
220 HAL CASWELL
Werner and Caswell (1977) for details]. Detailed studies of this species showed that age classification models were inferior to a developmental stage classification in describing demographic transitions (Werner, 1975) or overall population growth (Werner and Caswell, 1977). The population and sensitivity matrices for one of eight experimental populations are shown in Fig. 1. The sensitivities show a general tendency to increase down rows and to decrease across columns. The highest sensitivities are to changes in the lower left corner, to parameters representing the most rapid production of large reproductive individuals by small individuals.
+-
PENTACLETHRA MACROLOBA
U REPRODUCTION t SURVIVAL (IN SAME SIZE CLASS) + GROWTH (TO NEXT SIZE CLASS)
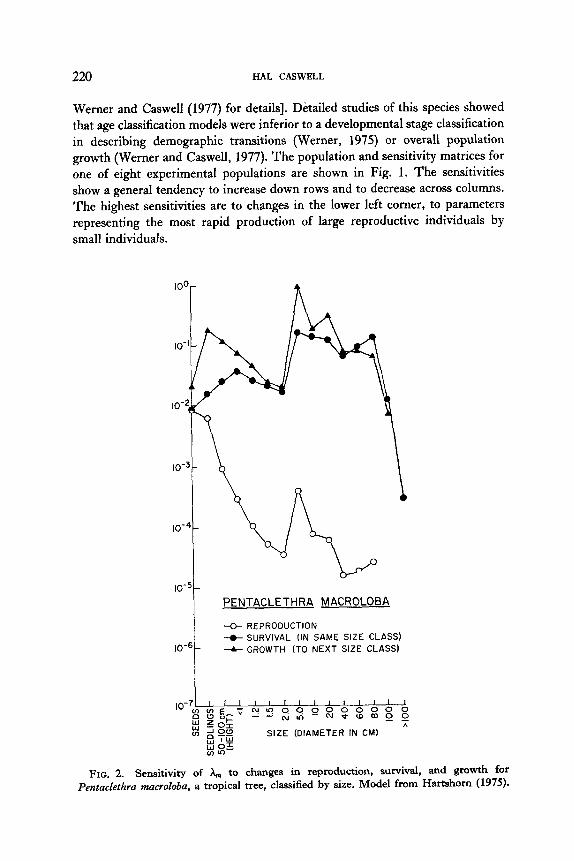
FIG. 2. Sensitivity of A,,, to changes in reproduction, survival, and growth for Pentaclethra macroloba, a tropical tree, classified by size. Model from Hartshom (1975).
GROWTH 221
FIG. 3.
,1&Q ____ _-__ -._. ----
__._ .ljO, _-__ --_. --.-
____ ____ .2X)6 _.__ -..-
--- .1x5 ---- _... ___- __.. .$jjq; -__.
-1
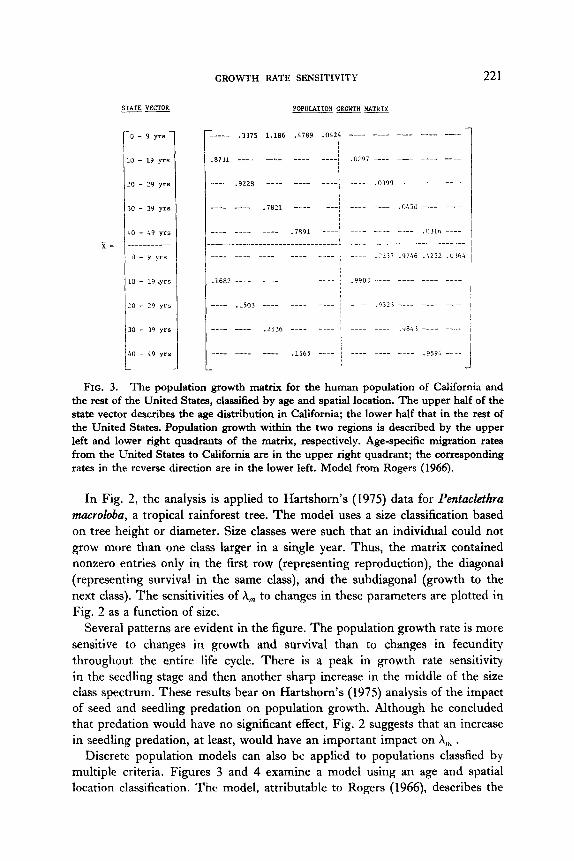
The population growth matrix for the human population of California and
the rest of the United States, classified by age and spatial location. The upper half of the state vector describes the age distribution in California; the lower half that in the rest of
the United States. Population growth within the two regions is described by the upper
left and lower right quadrants of the matrix, respectively. Age-specific migration rates
from the United States to California are in the upper right quadrant; the corresponding
rates in the reverse direction are in the lower left. Model from Rogers (1966).
In Fig. 2, the analysis is applied to Hartshorn’s (1975) data for Pentuckthra mucroloba, a tropical rainforest tree. The model uses a size classification based on tree height or diameter. Size classes were such that an individual could not
grow more than one class larger in a single year. Thus, the matrix contained nonzero entries only in the first row (representing reproduction), the diagonal
(representing survival in the same class), and the subdiagonal (growth to the next class). The sensitivities of X, to changes in these parameters are plotted in
Fig. 2 as a function of size.
Several patterns are evident in the figure. The population growth rate is more
sensitive to changes in growth and survival than to changes in fecundity throughout the entire life cycle. There is a peak in growth rate sensitivity
in the seedling stage and then another sharp increase in the middle of the size class spectrum. These results bear on Hartshorn’s (1975) analysis of the impact of seed and seedling predation on population growth. Although he concluded that predation would have no significant effect, Fig. 2 suggests that an increase in seedling predation, at least, would have an important impact on h,,, .
Discrete population models can also be applied to populations classfied by multiple criteria. Figures 3 and 4 examine a model using an age and spatial location classification. The model, attributable to Rogers (1966) describes the
222 HAL CASWJZLL
growth of the human populations of California and the rest of the United States, and age-specific migration between the two regions. Figure 3 shows the popula- tion matrix; the analysis could be extended to populations in several regions, the result being larger partitioned growth matrices.
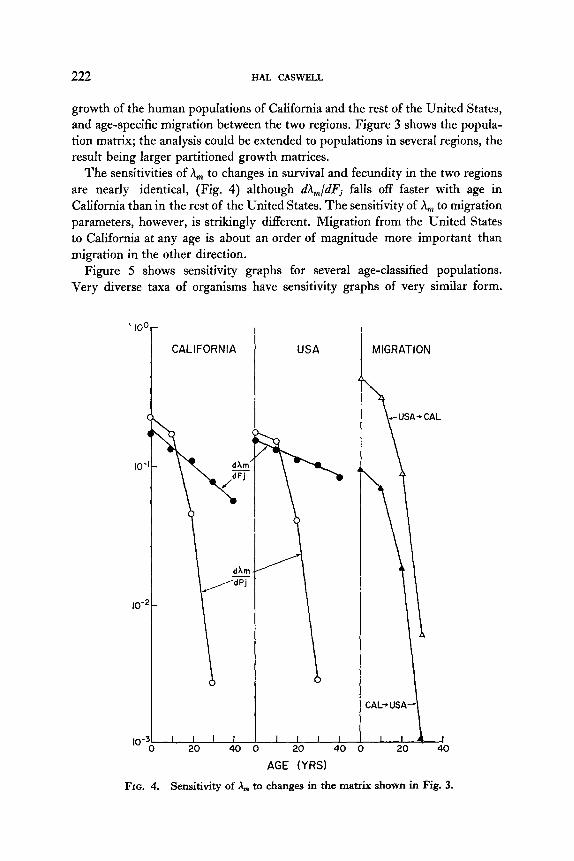
The sensitivities of A, to changes in survival and fecundity in the two regions are nearly identical, (Fig. 4) although dh,/dFj falls off faster with age in California than in the rest of the United States. The sensitivity of A,, to migration parameters, however, is strikingly different. Migration from the United States to California at any age is about an order of magnitude more important than migration in the other direction,
Figure 5 shows sensitivity graphs for several age-classified populations. Very diverse taxa of organisms have sensitivity graphs of very similar form.
’ lO(
IO’
IO-
)-
CALIFORNIA
2-
lo-36 ’ ’ ’ ’ 20 40
USA
-&-%k AGE (YRS)
MIGRATION
FIG. 4. Sensitivity of A,,, to changes in the matrix shown in Fig. 3.
GROWTH RATE SENSITIVITY 223
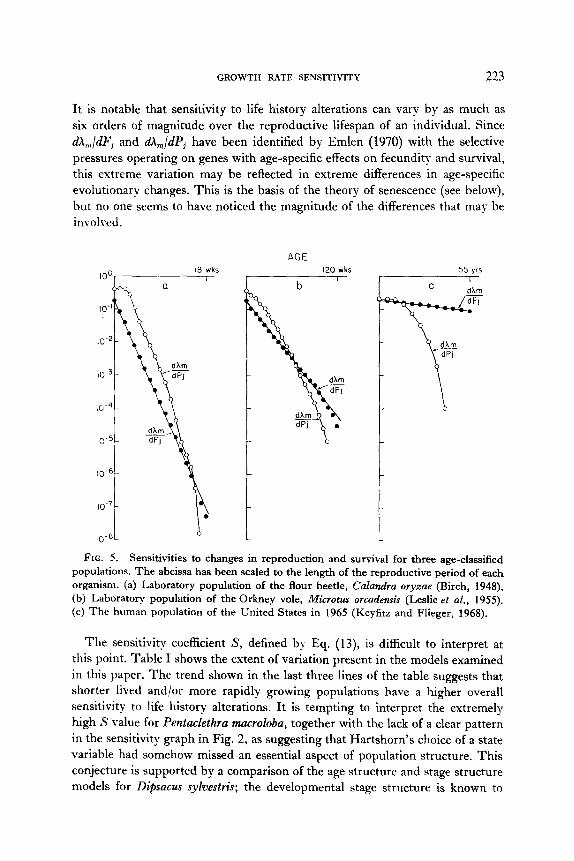
It is notable that sensitivity to life history alterations can vary by as much as six orders of magnitude over the reproductive lifespan of an individual. Since dA,,/dFj and dA,/dPj have been identified by Emlen (1970) with the selective pressures operating on genes with age-specific effects on fecundity and survival, this extreme variation may be reflected in extreme differences in age-specific evolutionary changes. This is the basis of the theory of senescence (see below), but no one seems to have noticed the magnitude of the differences that may be involved.
AGE 120 wks
b I
55 vrs
c ’ dXm -
FIG. 5. Sensitivities to changes in reproduction and survival for three age-classified populations. The abcissa has been scaled to the length of the reproductive period of each organism. (a) Laboratory population of the flour beetle, Culandra oryzae (Birch, 1948). (b) Laboratory population of the Orkney vole, Microtus orcademis (Leslie et al., 1955). (c) The human population of the United States in 1965 (Keyfitz and Flieger, 1968).
The sensitivity coefficient S, defined by Eq. (13), is difficult to interpret at this point. Table I shows the extent of variation present in the models examined in this paper. The trend shown in the last three lines of the table suggests that shorter lived and/or more rapidly growing populations have a higher overall sensitivity to life history alterations. It is tempting to interpret the extremely high S value for Pentaclethra macroloba, together with the lack of a clear pattern in the sensitivity graph in Fig. 2, as suggesting that Hartshorn’s choice of a state variable had somehow missed an essential aspect of population structure. This conjecture is supported by a comparison of the age structure and stage structure models for Dipsacus sykwtris; the developmental stage structure is known to
224 HAL CASWELL
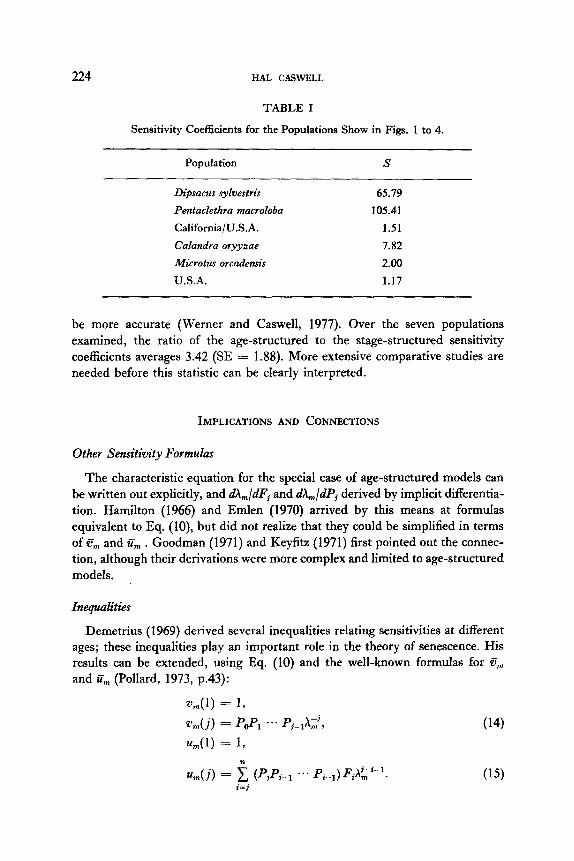
TABLE I
Sensitivity Coefficients for the Populations Show in Figs. 1 to 4.
Population s
Llipsacus sylvestris 65.79
Pentaclethra macroloba 105.41 California/U.S.A. 1.51
Calandra ory3zae 7.82
Microtus orcadensis 2.00
U.S.A. 1.17
be more accurate (Werner and Caswell, 1977). Over the seven populations examined, the ratio of the age-structured to the stage-structured sensitivity coefficients averages 3.42 (SE = 1.88). M ore extensive comparative studies are needed before this statistic can be clearly interpreted.
IMPLICATIONS AND CONNECTIONS
Other Sensitivity Formulas
The characteristic equation for the special case of age-structured models can be written out explicitly, and dh,ldF, and dh,ldPj derived by implicit differentia- tion. Hamilton (1966) and Emlen (1970) arrived by this means at formulas equivalent to Eq. (lo), but did not realize that they could be simplified in terms of cm and iim . Goodman (1971) and Keyfitz (1971) first pointed out the connec- tion, although their derivations were more complex and limited to age-structured models.
Inequalities
Demetrius (1969) derived several inequalities relating sensitivities at different ages; these inequalities play an important role in the theory of senescence. His results can be extended, using Eq. (10) and the well-known formulas for e’,,, and ts, (Pollard, 1973, p.43):
Z&(l) = 1,
v,(j) = PoPI ... Pj-IA;;;‘,
%2(l) = 1,
%n(i) = i (PPi+1 . . . pfel) FJki-‘. i=j
(14)
(15)
GROWTH RATE SENSITIVITY 225
These versions of Us,, and tim are not scaled following Eq. (5c), but the necessary corrections cancel out in all of the following analyses.
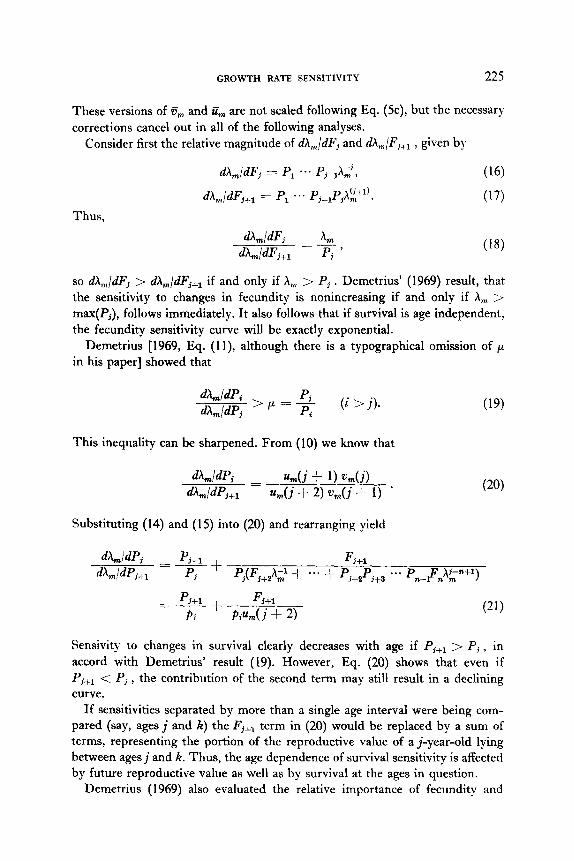
Consider first the relative magnitude of dh,/dFj and dA,,/Fi+l , given by
Thus,
dA,/dFj = PI .*. Pj_lAi’, (16)
dh,jdFi+l = PI ... Pj-lPjXf:‘)m (17)
dh,/dFj A, dA,ldFi+l = pj ’ (18)
so dA,,/dFj > dh,/dFj+l if and only if A,,, > Pj . Demetrius’ (1969) result, that the sensitivity to changes in fecundity is nonincreasing if and only if A, > max(Pi), follows immediately. It also follows that if survival is age independent, the fecundity sensitivity curve will be exactly exponential.
Demetrius [1969, Eq. (ll), although there is a typographical omission of p in his paper] showed that
dUdPi pi dh,ldPj >P== (i > j).
This inequality can be sharpened. From (10) we know that
Substituting (14) and (15) into (20) and rearranging yield
(19)
4#pj pj,l Fj+1 dA,ldPj+, Pj = - + Pj(Fj+&; -1 ... + pj+zPi+3 e-e P,,-lF,Xp+l)
p3%l =- f Fj+1 Pi Pi%(i + 2)
Sensivity to changes in survival clearly decreases with age if Pj+l > Pi, in accord with Demetrius’ result (19). H owever, Eq. (20) shows that even if Pj+l < Pj , the contribution of the second term may still result in a declining curve.
If sensitivities separated by more than a single age interval were being com- pared (say, ages j and K) the Fj+l term in (20) would be replaced by a sum of terms, representing the portion of the reproductive value of a j-year-old lying between ages j and K. Thus, the age dependence of survival sensitivity is affected by future reproductive value as well as by survival at the ages in question.
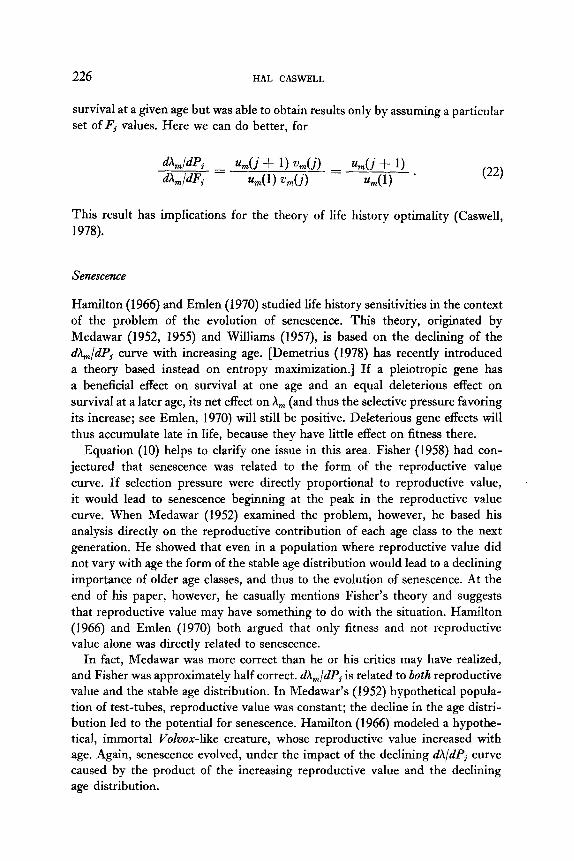
Demetrius (1969) also evaluated the relative importance of fecundity and
226 HAL CASWELL
survival at a given age but was able to obtain results only by assuming a particular set of Fj values. Here we can do better, for
dh,,JdP, dh,,JdFj
= %7di+ l)%(j) = %n(i+ 1) %n( 1) @m(i) %nU) * c-w
This result has implications for the theory of life history optimality (Caswell, 1978).
Senescence
Hamilton (1966) and Emlen (1970) studied life history sensitivities in the context of the problem of the evolution of senescence. This theory, originated by Medawar (1952, 1955) and Williams (1957), is based on the declining of the dA,,,/dPj curve with increasing age. [Demetrius (1978) has recently introduced a theory based instead on entropy maximization.] If a pleiotropic gene has a beneficial effect on survival at one age and an equal deleterious effect on survival at a later age, its net effect on h, (and thus the selective pressure favoring its increase; see Emlen, 1970) will still be positive. Deleterious gene effects will thus accumulate late in life, because they have little effect on fitness there.
Equation (10) helps to clarify one issue in this area. Fisher (1958) had con- jectured that senescence was related to the form of the reproductive value curve. If selection pressure were directly proportional to reproductive value, it would lead to senescence beginning at the peak in the reproductive value curve. When Medawar (1952) examined the problem, however, he based his analysis directly on the reproductive contribution of each age class to the next generation. He showed that even in a population where reproductive value did not vary with age the form of the stable age distribution would lead to a declining importance of older age classes, and thus to the evolution of senescence. At the end of his paper, however, he casually mentions Fisher’s theory and suggests that reproductive value may have something to do with the situation. Hamilton (1966) and Emlen (1970) both argued that only fitness and not reproductive value alone was directly related to senescence.
In fact, Medawar was more correct than he or his critics may have realized, and Fisher was approximately half correct. dh,/dPj is related to both reproductive value and the stable age distribution. In Medawar’s (1952) hypothetical popula- tion of test-tubes, reproductive value was constant; the decline in the age distri- bution led to the potential for senescence. Hamilton (1966) modeled a hypothe- tical, immortal VoZvox-like creature, whose reproductive value increased with age. Again, senescence evolved, under the impact of the declining dhldPj curve caused by the product of the increasing reproductive value and the declining age distribution.
GROWTH RATE SENSITIVITY 221
Other .Qplications
The general formula (10) f or eigenvalue sensitivity is valid for any matrix, and thus has potential applications to a number of other areas of ecology. Competition matrices and linear compartment models (cf. Hett and O’Neill, 1974) spring to mind immediately. In both cases the stability of the system is determined by the largest eigenvalue, and the rate of return to equilibrium, if stable, by the modulus of the smallest eigenvalue. The sensitivity structure of these matrices would be well worth investigating. For population models, the rate of approach to the stable stage distribution is largely determined by the second largest eigenvalue of A, and the sensitivity of this eigenvalue to life history changes would bear investigating as well.
APPENDIX
The assertion that an arbitrary stage classification model ultimately grows at a rate h, with a stable stage distribution tim is not strictly true, and its assump- tion in applying Eq. (10) re q uires some justification. For the assertion to be true, h,, must be real, nonnegative, greater in modulus than any other eigenvalue, and have a real, nonnegative eigenvector.
The eigenvalue spectrum of age structured Leslie matrices has been studied by Sykes (1969), Demetrius (1971), and Cull and Vogt (1973, 1974). The Leslie matrix is clearly nonnegative, and can be shown to be irreducible. On these grounds, the Perron-Frobenius theorem (Gantmacher, 1959, p. 53) guarantees the existence of a positive real eigenvalue X, with an associated real, nonnegative eigenvector. The modulus of h, is greater than or equal to that of any of the other eigenvalues. If the greatest common divisor of the ages at which fecundity in nonzero is one, then A is also primitive (Demetrius, 1971) and 1 h, ( is strictly greater than the modulus of any other eigenvalue.
A stage classification model can reasonably be assumed to be nonnegative. To assume otherwise is to admit the possibility of negative population sizes. Irreducibility need not be assumed, for there is a weaker form of the Perron- Frobenius theorem, applicable to reducible nonnegative matrices (Gantmacher, 1959, p. 66). It differs from the stronger version only in allowing the possibility of a maximum eigenvalue of zero. Such an eigenvalue would imply the singularity of L?i, and hence a redundancy in the classification of the population into stages. Definition of a new state variable could eliminate this and lead to a population matrix of full rank.
The existence of two or more eigenvalues of the same modulus cannot be completely ruled out without a detailed study of the particular matrix involved. However, I conjecture (and it would be nice to prove) that primitivity is a generic condition for matrices; i.e., that the existence of roots of the same modulus is
228 HAL CASWELL
structurally unstable. Hirsch and Smale (1974) p rove that rqeuted eigenvalues are structurally unstable; it seems that a proof based on the continuity of eigen- values would do the same for imprimitivity. If my conjecture is true, then only for very special life histories, not subject to measurement error (e.g., a Leslie matrix with precisely periodic fecundities) would imprimitivity be a problem.
Cull and Vogt (1973, 1974, 1976) h ave recently analyzed the properties of imprimitive Leslie matrices. The contribution of the second (complex) eigen- value, of modulus equal to that of A, , leads to an oscillatory pattern of popula- tion growth. The average trend of this growth, however, is given by A,,, , and so the theory in this paper could be applied to imprimitive matrices by merely considering the average growth rate over a single cycle.
ACKNOWLEDGMENTS
This research was supported by NSF Grants GB 43378 and DEB76-19278, which are gratefully acknowledged. I thank Lloyd Demetrius and J. Merrit Emlen for helpful comments.
REFERENCES
BERNARDELLI, H. 1941. Population waves, J. Burma Res. Sot. 31, 3-18. BIRCH, L. C. 1948. The intrinsic rate of natural increase of an insect population, J. Anim.
Ecol. 17, 15-26. C&WELL, H. 1978. On the equivalence of maximizing reproductive value and maximising
fitness, (submitted for publication). C&WELL, H., KOENIG, H., tiH, J., AND Ross, Q. 1972. An introduction to systems
science for ecologists, in “Systems Analysis and Simulation in Ecology” (B. C. Patten, Ed.), Vol. 2, pp. 4-78, Academic Press, New York.
CASWBLL, H., AND WERNER, P. A. 1978. Transient behavior and life history analysis of teasel (Dipsucns &west& Huds.), Ecology, 59, 53-66.
CULL, P., AND VOGT, A. 1973. Mathematical analysis of the asymptotic behavior of the Leslie population matrix model, Bull. Math. Biol. 35, 645-661.
CULL, P., AND VOCT, A. 1974. The periodic limit for the Leslie model, Math. Biosci. 21, 39-54.
CULL, P., AND VOGT, A. 1976. The period of total population, Bull. Math. Biol. 38. 317-319.
DEMBTRIUS, L. 1969. The sensitivity of population growth rate to perturbations in the life cycle components, Moth. Biosci. 4, 129-136.
DJZMETRIUS, L. 1971. Primitivity conditions for growth matrices, Math. Biosci. 12, 53-58. DEMETFWJS, L. 1978. Relations between demographic parameters, Demogruphy, in press. D~OER, C. A. 1967. Perturbations of eigenvalues and eigenvectors of a network, in
“Proceedings of the Fifth Allerton Conferebcc on Circuit and System Theory,“Uni- versity of Illinois, Urbana, Ill.
EMLEN, J. M. 1970. Age specificity and ecological theory, Ecology 51, 588-601. FADDEBV, D. K. 1959. The conditionality of matrices, Tr. Mutem. Inst. A&d. iVuuk SSSR
53, 387-391 (in Russian, available as No. 63-00895, Nat. Translation Center, John Crerar Library, Chicago, Ill. 60616).
GROWTH RATE SENSITIVITY 229
FADDW. D. K., AND FADDEEVA, V. N. 1963. ‘Computational Methods of Linear Algebra,” Freeman, San Francisco.
FISHER, R. A. 1958. “The Genetical Theory of Natural Selection,” 2nd rev. ed. Dover, New York.
GANTMACHER, G. F. 1959. “Matrix Theory,” Vol. 2. Chelsea, New York. GOODMAN, L. A. 1968. An elementary approach to the population projection matrix, to
the population reproductive value, and to related topics in the mathematical theory of population growth, Demography 5, 382-409.
GOODMAN, L. A. 1971. On the sensitivity of the intrinsic growth rate to changes in the age-specific birth and death rates, Theor. Pop. Biol. 2, 339-354.
HAMILTON, W. D. 1966. The moulding of senescence by natural selection, J. Theor. Biol. 12, 12-45.
HARTSHORN, G. S. 1975. A matrix model of tree population dynamics, in “Topical Ecological Systems: Trends in Terrestrial and Aquatic Research” (F. B. Galley and E. Medina, Eds.), pp. 41-51, Springer-Verlag, New York.
HETT, J. M., AND O’NEILL, R. V. 1974. Systems analysis of the Aleut ecosystem, Artic Anthropol. I 1, 3 l-40.
HIRSCH, M. W., AND SALE, S. 1974. “Differential Equations, Dynamical Systems and Linear Algebra,” Academic Press, New York.
JACOBI, C. J. G. 1846. Uber ein leichtes Verfahren die in der Theorie der Sacularstijrungen vorkommenden Gleichungen numerisch aufzulijsen. J. Reine Anger. Math. 30, 51-95.
KEYFITZ, N. 1971. Linkages of intrinsic to age-specific rates, J. Amer. Stat. Assoc. 66, 275-281.
KEYFITZ, N., AND FLIEGFX, W. 1968. “World Population: An Analysis of Vital Data,” Univ. of Chicago Press, Chicago.
LEFKOVITCH, L. P. 1965. The study of population growth in organisms grouped by stages, Biometrics 21, 1-18.
LESLIE, P. H. 1945. On the use of matrices in certain population mathematics, Biometrika 33, 183-212.
LESLIE, P. H., %ER, J. S., VIZOSO, M., AND CHITTY, H. 1955. The longevity and fertility of the Orkney vole, Mictodus orcadensis, as observed in the laboratory, PTOC. Zool. Sot. London 125, 115-l 25.
LEWIS, E. G. 1942. On the generation and growth of a population, Sankhyd 6, 93-96. LEWONTIN. R. C. 1965. Selection for colonizing ability, in “The Genetics of Colonizing
Species”(H. G. Baker and G. L. Stebbins, Eds.), pp. 77-94, Academic Press, New York. MEDAWAR, P. B. 1952. “An Unsolved Problem in Biology,” H. K. Lewis, London. MEDAWAR, P. B. 1955. The definition and measurement of senescence, Ciba Found.
Colloquia Ageing 1, 4-15. MERTZ, D. B. 1971. Life history phenomena in increasing and decreasing populations, in
“Statistical Ecology” (G. P. Patil, E. C. Pielou, and W. E. Waters, Eds.). Vol. 2, pp. 361-399, Penn. State Univ. Press, University Park, Pa.
POLLARD, J. H. 1973. “Mathematical Models for the Growth of Human Populations,” Cambridge Univ. Press, London/New York.
ROGERS, A. 1966. The multiregional matrix growth operator and the stable interregional age structure, Demography 3, 537-544.
SINKO, J. W., AND STREIFER, W. 1969. Applying models incorporating age-size structure to Daphnia, Ecology 50, 608-615.
SLOBODKIN, L. B. 1953. An algebra of population growth, Ecology 34, 513-519. SYKES, Z. M. 1969. On discrete stable population theory, Biometrics 25, 285-293. USHER, M. B. 1966. A matrix approach to the management of renewable resources with
special reference to selection forests, /. Appl. Ecol. 3, 355-367.
230 HAL CASWELL
WERNER, P. A. 197.5. Predictions of fate from rosette size in teasel, Dipsocus fullonum L., Oecologio 20, 197-201.
WERNER, P. A., AND CASWELL, H. 1977. Population growth rates and age vs. stage distribu- tion models for teasel (Dipsocus sybestris Huds.), Ecology 58, 1103-I 111.
WILLIAMS, G. C. 1957. Pleiotropy, natural selection, and the evolution of senescence, Ewolution 11, 398-411.