Embed Size (px)
Citation preview
Geo-spatial Technology & Research GISE Lab, IIT Bombay
Smita Sengupta
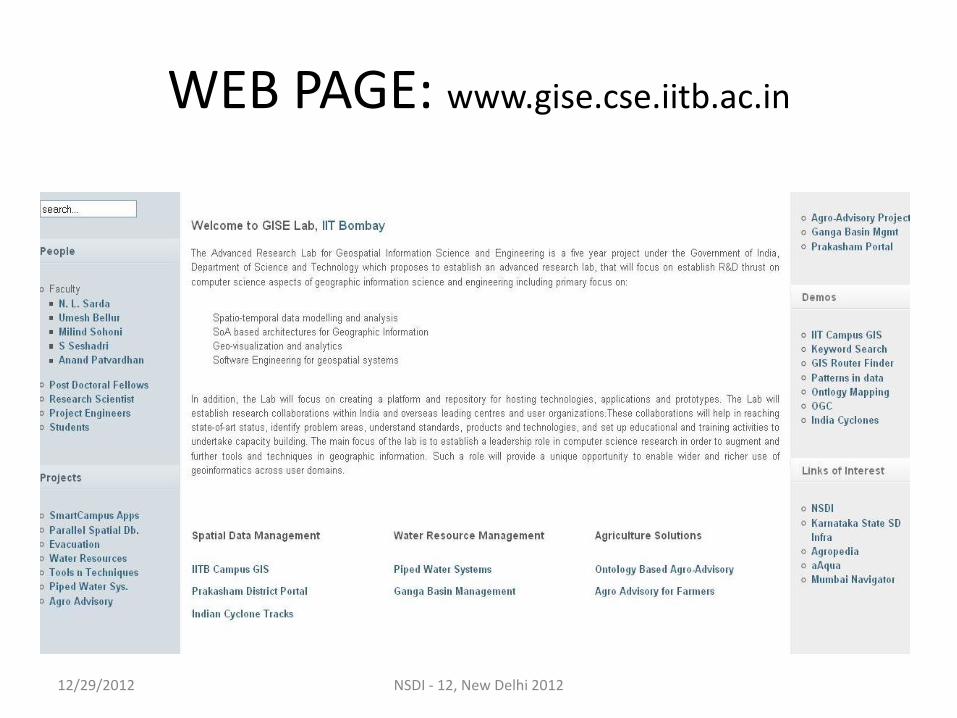
WEB PAGE: www.gise.cse.iitb.ac.in
12/29/2012 NSDI - 12, New Delhi 2012
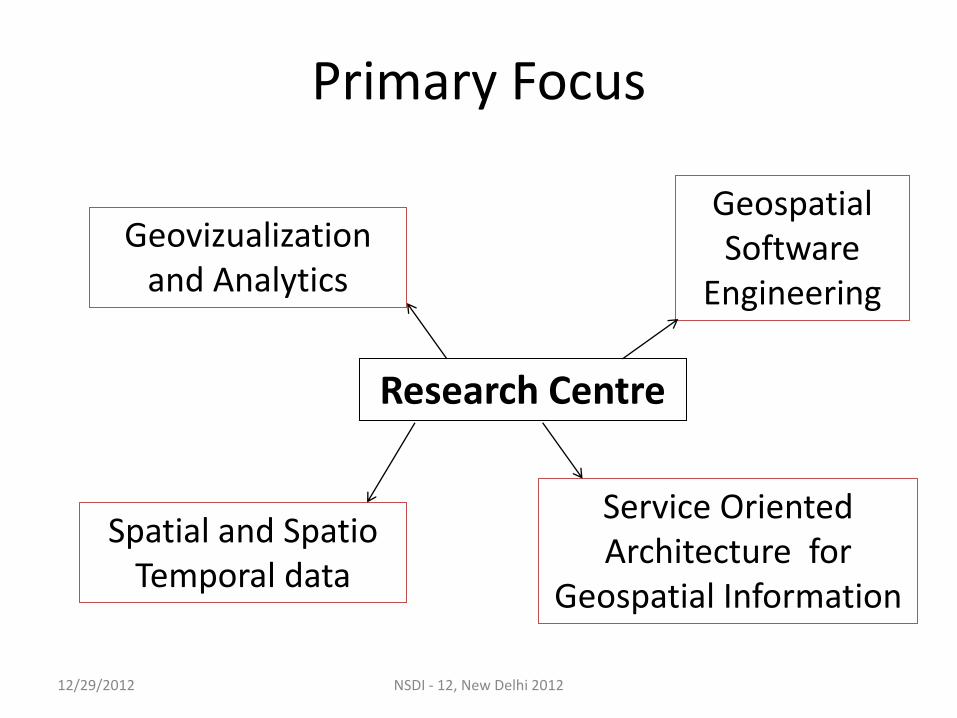
Primary Focus
Geovizualization and Analytics
Spatial and Spatio Temporal data
Geospatial Software
Engineering
Service Oriented Architecture for
Geospatial Information
Research Centre
12/29/2012 NSDI - 12, New Delhi 2012
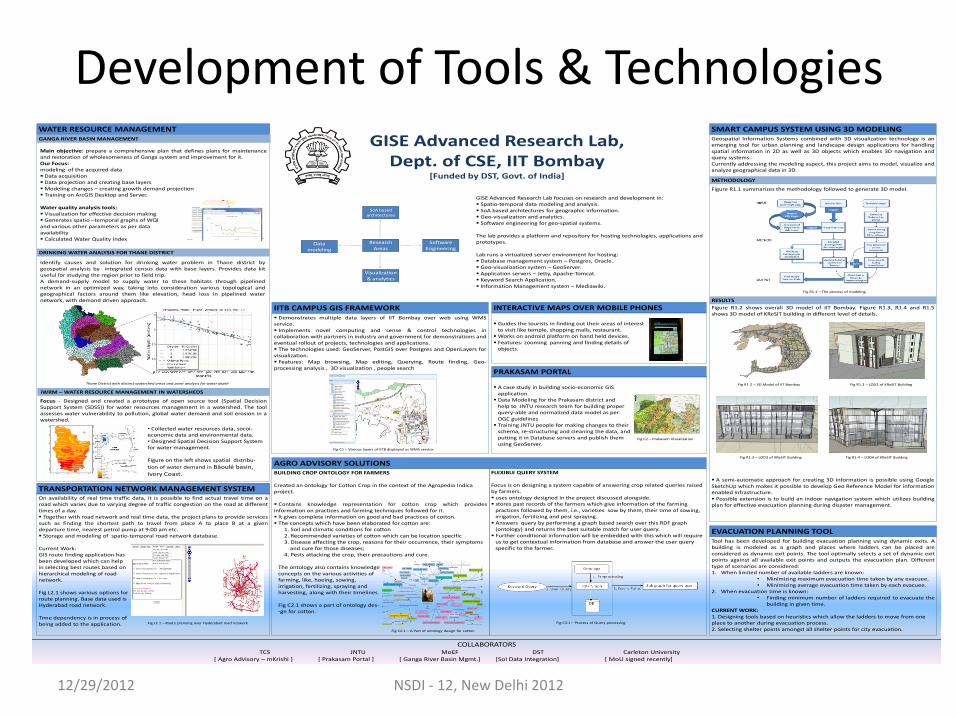
Development of Tools & Technologies
GISE Advanced Research Lab, Dept. of CSE, IIT Bombay
[Funded by DST, Govt. of India]
COLLABORATORSTCS JNTU MoEF DST Carleton University
[ Agro Advisory – mKrishi ] [ Prakasam Portal ] [ Ganga River Basin Mgmt.] [SoI Data Integration] [ MoU signed recently]
Geospatial Information Systems combined with 3D visualization technology is anemerging tool for urban planning and landscape design applications for handlingspatial information in 2D as well as 3D objects which enables 3D navigation andquery systems.Currently addressing the modeling aspect, this project aims to model, visualize andanalyze geographical data in 3D.
Figure R1.1 summarizes the methodology followed to generate 3D model.
Fig R1.1 – The process of modeling
Figure R1.2 shows overall 3D model of IIT Bombay. Figure R1.3, R1.4 and R1.5shows 3D model of KReSIT building in different level of details.
Fig R1.2 – 3D Model of IIT Bombay Fig R1.2 – LOD2 of KReSIT Building
Fig R1.3 – LOD3 of KReSIT Building Fig R1.4 – LOD4 of KReSIT Building
A semi-automatic approach for creating 3D information is possible using GoogleSketchUp which makes it possible to develop Geo Reference Model for informationenabled infrastructure. Possible extension is to build an indoor navigation system which utilizes buildingplan for effective evacuation planning during disaster management.
SMART CAMPUS SYSTEM USING 3D MODELING
METHODOLOGY
RESULTS
EVACUATION PLANNING TOOLTool has been developed for building evacuation planning using dynamic exits. Abuilding is modeled as a graph and places where ladders can be placed areconsidered as dynamic exit points. The tool optimally selects a set of dynamic exitpoints against all available exit points and outputs the evacuation plan. Differenttype of scenarios are considered:1. When limited number of available ladders are known:
• Minimizing maximum evacuation time taken by any evacuee.• Minimizing average evacuation time taken by each evacuee.
2. When evacuation time is known:• Finding minimum number of ladders required to evacuate the
building in given time.CURRENT WORK:1. Designing tools based on heuristics which allow the ladders to move from one place to another during evacuation process.2. Selecting shelter points amongst all shelter points for city evacuation.
WATER RESOURCE MANAGEMENT
TRANSPORTATION NETWORK MANAGEMENT SYSTEMOn availability of real time traffic data, it is possible to find actual travel time on aroad which varies due to varying degree of traffic congestion on the road at differenttimes of a day. Together with road network and real time data, the project plans to provide servicessuch as finding the shortest path to travel from place A to place B at a givendeparture time, nearest petrol pump at 9:00 am etc. Storage and modeling of spatio-temporal road network database.
Current Work: GIS route finding application hasbeen developed which can helpin selecting best routes based onhierarchical modeling of road network.
Fig L2.1 shows various options forroute planning. Base data used isHyderabad road network.
Time dependency is in process ofbeing added to the application.
AGRO ADVISORY SOLUTIONSBUILDING CROP ONTOLOGY FOR FARMERS
Created an ontology for Cotton Crop in the context of the Agropedia Indicaproject.
Contains knowledge representation for cotton crop which providesinformation on practices and farming techniques followed for it. It gives complete information on good and bad practices of cotton. The concepts which have been elaborated for cotton are:
1. Soil and climatic conditions for cotton2. Recommended varieties of cotton which can be location specific3. Disease affecting the crop, reasons for their occurrence, their symptoms
and cure for those diseases;4. Pests attacking the crop, their precautions and cure.
The ontology also contains knowledgeconcepts on the various activities offarming, like, hoeing, sowing,irrigation, fertilizing, spraying andharvesting, along with their timelines.
Fig C2.1 shows a part of ontology des--gn for cotton.
Fig C2.1 – A Part of ontology design for cotton
FLEXIBLE QUERY SYSTEM
Focus is on designing a system capable of answering crop related queries raised by farmers. uses ontology designed in the project discussed alongside. stores past records of the farmers which give information of the farming
practices followed by them, i.e., varieties sow by them, their time of sowing, irrigation, fertilizing and pest spraying. Answers query by performing a graph based search over this RDF graph
(ontology) and returns the best suitable match for user query. Further conditional information will be embedded with this which will require
us to get contextual information from database and answer the user query specific to the farmer.
Fig C3.1 – Process of Query processing
Main objective: prepare a comprehensive plan that defines plans for maintenanceand restoration of wholesomeness of Ganga system and improvement for it.Our Focus:modeling of the acquired data Data acquisition Data projection and creating base layersModeling changes – creating growth demand projection Training on ArcGIS Desktop and Server.
Water quality analysis tools: Visualization for effective decision making Generates spatio –temporal graphs of WQIand various other parameters as per dataavailability Calculated Water Quality Index
DRINKING WATER ANALYSIS FOR THANE DISTRICT
Identify causes and solution for drinking water problem in Thane district bygeospatial analysis by integrated census data with base layers. Provides data kituseful for studying the region prior to field trip.A demand-supply model to supply water to these habitats through pipelinednetwork in an optimized way, taking into consideration various topological andgeographical factors around them like elevation, head loss in pipelined waternetwork, with demand driven approach.
GANGA RIVER BASIN MANAGEMENT
GISE Advanced Research Lab focuses on research and development in: Spatio-temporal data modeling and analysis. SoA based architectures for geographic information. Geo-visualization and analytics. Software engineering for geo-spatial systems.
The lab provides a platform and repository for hosting technologies, applications andprototypes.
Lab runs a virtualized server environment for hosting: Database management system – Postgres, Oracle. Geo-visualization system – GeoServer. Application servers – Jetty, Apache-Tomcat. Keyword Search Application. Information Management system – Mediawiki.
Research Areas
Visualization & analytics
Data modeling
Software Engineering
SoA based architectures
IITB CAMPUS GIS FRAMEWORK Demonstrates multiple data layers of IIT Bombay over web using WMSservice. Implements novel computing and sense & control technologies incollaboration with partners in industry and government for demonstrations andeventual rollout of projects, technologies and applications. The technologies used: GeoServer, PostGIS over Postgres and OpenLayers forvisualization. Features: Map browsing, Map editing, Querying, Route finding, Geo-processing analysis , 3D visualization , people search
Fig C1 – Various layers of IITB displayed as WMS service
INTERACTIVE MAPS OVER MOBILE PHONES
Guides the tourists in finding out their areas of interest to visit like temple, shopping malls, restaurant.Works on android platform on hand held devices. Features: zooming panning and finding details of
objects.
PRAKASAM PORTAL
A case study in building socio-economic GIS application. Data Modeling for the Prakasam district and
help to JNTU research team for building properquery-able and normalized data model as per OGC guidelines Training JNTU people for making changes to their
schema, re-structuring and cleaning the data, and putting it in Database servers and publish them using GeoServer.
Fig C2 – Prakasam Visualization
Fig L2.1 – Route planning over Hyderabad road network
iWRM – WATER RESOURCE MANAGEMENT IN WATERSHEDS
Focus - Designed and created a prototype of open source tool (Spatial DecisionSupport System (SDSS)) for water resources management in a watershed. The toolassesses water vulnerability to pollution, global water demand and soil erosion in awatershed.
Thane District with distinct watershed areas and point analysis for water depth
• Collected water resources data, socoi-economic data and environmental data.• Designed Spatial Decision Support System for water management.
Figure on the left shows spatial distribu-
tion of water demand in Bâoulé basin, Ivory Coast.
12/29/2012 NSDI - 12, New Delhi 2012
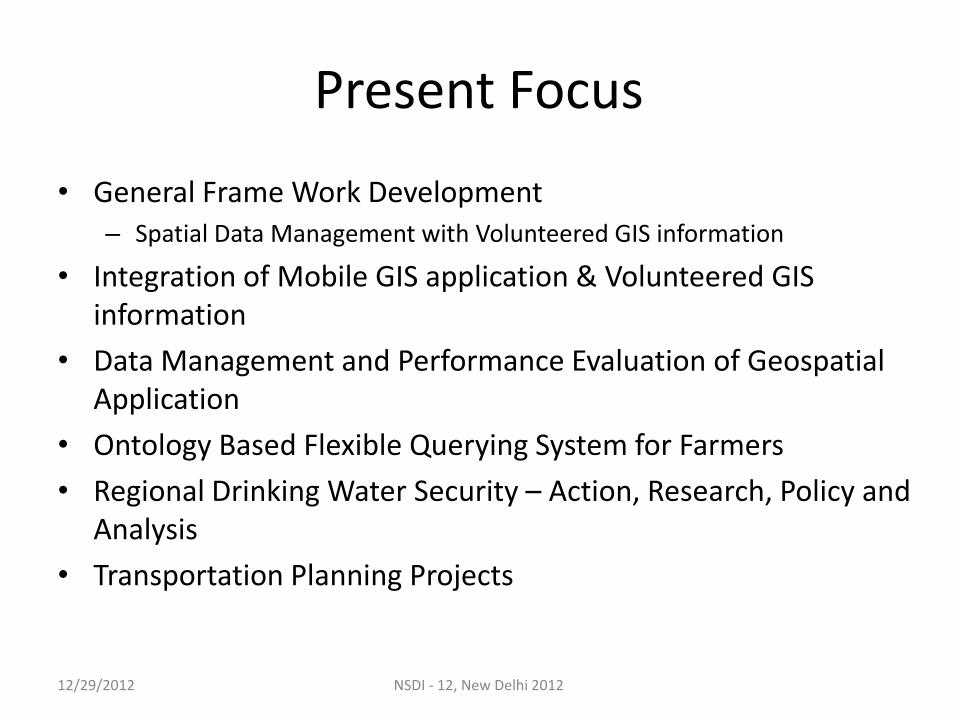
Present Focus
• General Frame Work Development – Spatial Data Management with Volunteered GIS information
• Integration of Mobile GIS application & Volunteered GIS information
• Data Management and Performance Evaluation of Geospatial Application
• Ontology Based Flexible Querying System for Farmers
• Regional Drinking Water Security – Action, Research, Policy and Analysis
• Transportation Planning Projects
12/29/2012 NSDI - 12, New Delhi 2012
General Framework
The registered users will be allowed to use this “Framework”: – Scenario I:
• To download the Framework from GISE webpage in the respective server
• Will allow to use all the available Tools & Functions
– Scenario II: • To register in GISE site & use Framework from GISE
server itself
• User will be allotted Workspace in the GISE Geoserver
12/29/2012 NSDI - 12, New Delhi 2012
Tools & Functions Following Tools & Functions will be available in the Framework:
• Upload & Download Data: shp & csv file
– Both the cases user have to register earlier
– In case of uploading of csv file ,data will be joined with existing Geometry
• Web Processing Service(WPS): Will allow user to do processing in the existing layer
– Buffer, Intersection, Union
• Editor: Allowing user to Edit the data (Add/Delet)
– This function will have proper authentication and authorization tools
– This is related to Spatial Data Management with Volunteered GIS
• Development of Styler
– Allowing user to change Style of the Features
– Allowing user to add Label
12/29/2012 NSDI - 12, New Delhi 2012
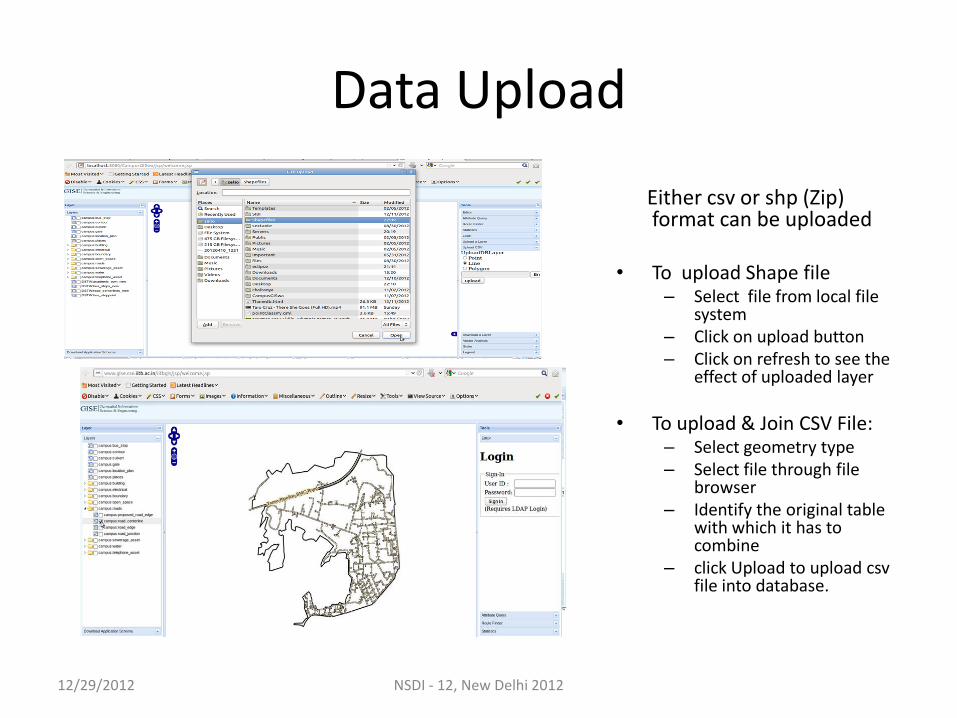
Data Upload
Either csv or shp (Zip) format can be uploaded
• To upload Shape file
– Select file from local file system
– Click on upload button – Click on refresh to see the
effect of uploaded layer
• To upload & Join CSV File: – Select geometry type – Select file through file
browser – Identify the original table
with which it has to combine
– click Upload to upload csv file into database.
12/29/2012 NSDI - 12, New Delhi 2012
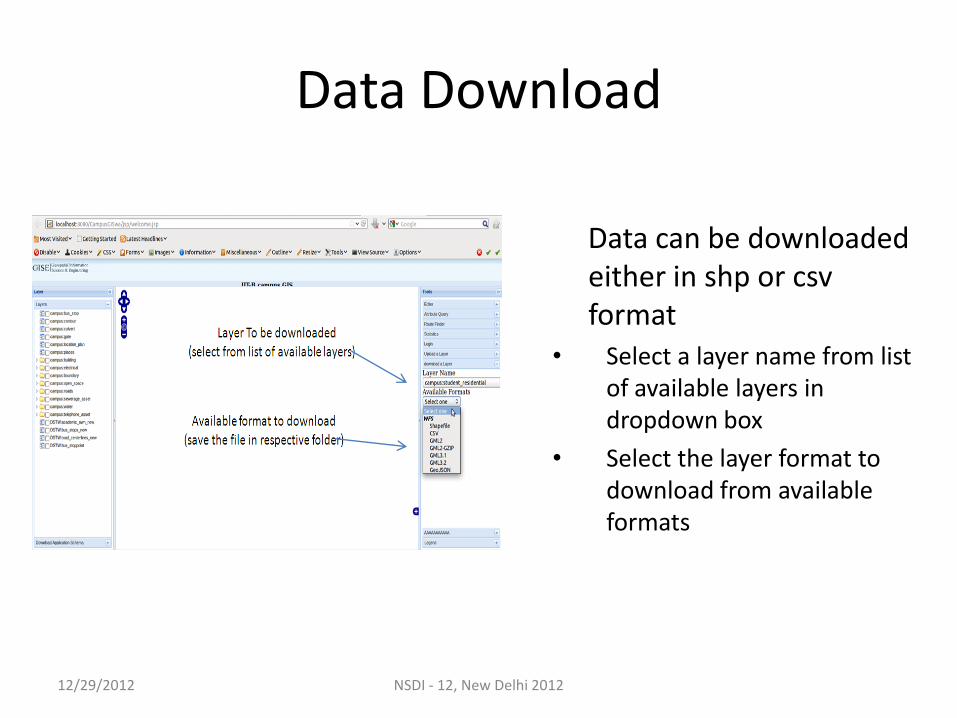
Data Download
Data can be downloaded either in shp or csv format
• Select a layer name from list of available layers in dropdown box
• Select the layer format to download from available formats
12/29/2012 NSDI - 12, New Delhi 2012
Web Processing Service (WPS)
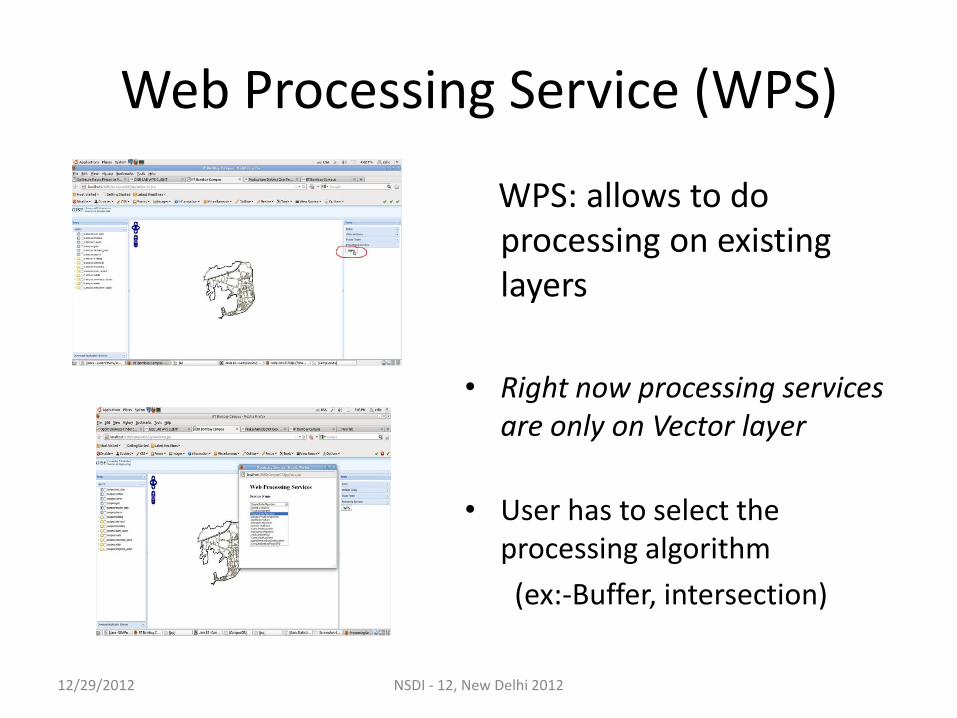
WPS: allows to do processing on existing layers
• Right now processing services are only on Vector layer
• User has to select the processing algorithm
(ex:-Buffer, intersection)
12/29/2012 NSDI - 12, New Delhi 2012
WPS - Buffer
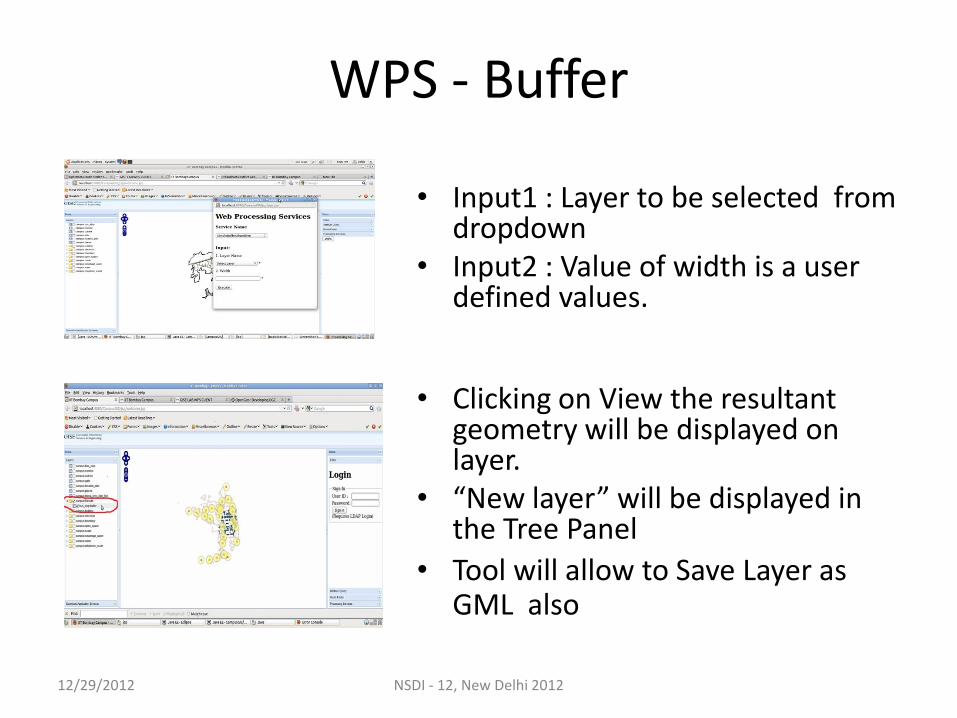
• Input1 : Layer to be selected from dropdown
• Input2 : Value of width is a user defined values.
• Clicking on View the resultant
geometry will be displayed on layer.
• “New layer” will be displayed in the Tree Panel
• Tool will allow to Save Layer as GML also
12/29/2012 NSDI - 12, New Delhi 2012
WPS - Intersection
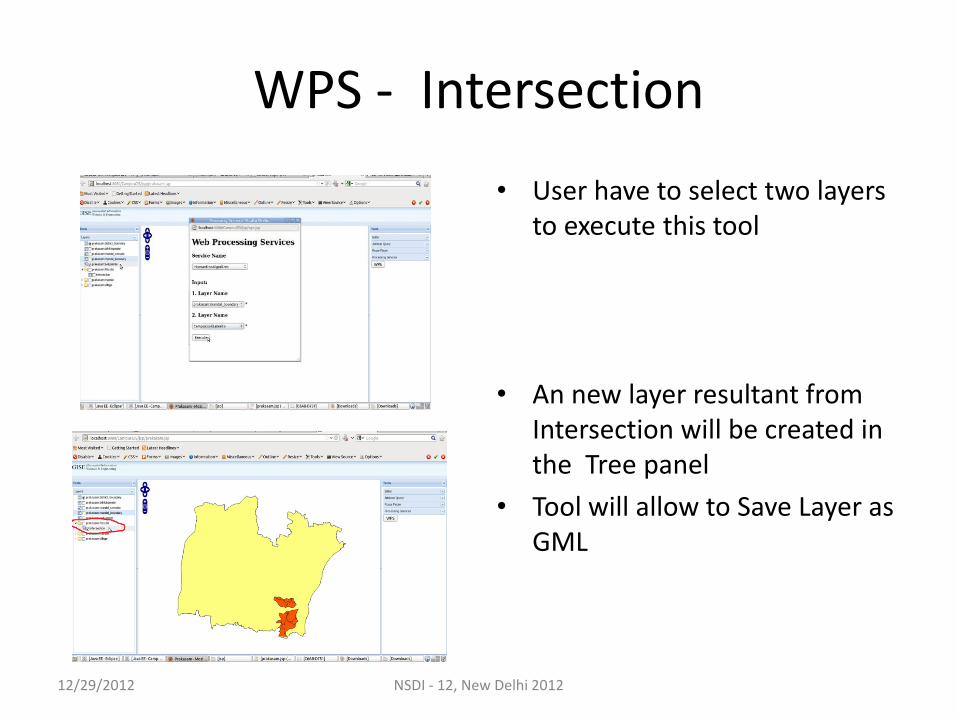
• User have to select two layers to execute this tool
• An new layer resultant from Intersection will be created in the Tree panel
• Tool will allow to Save Layer as GML
12/29/2012 NSDI - 12, New Delhi 2012
Editor
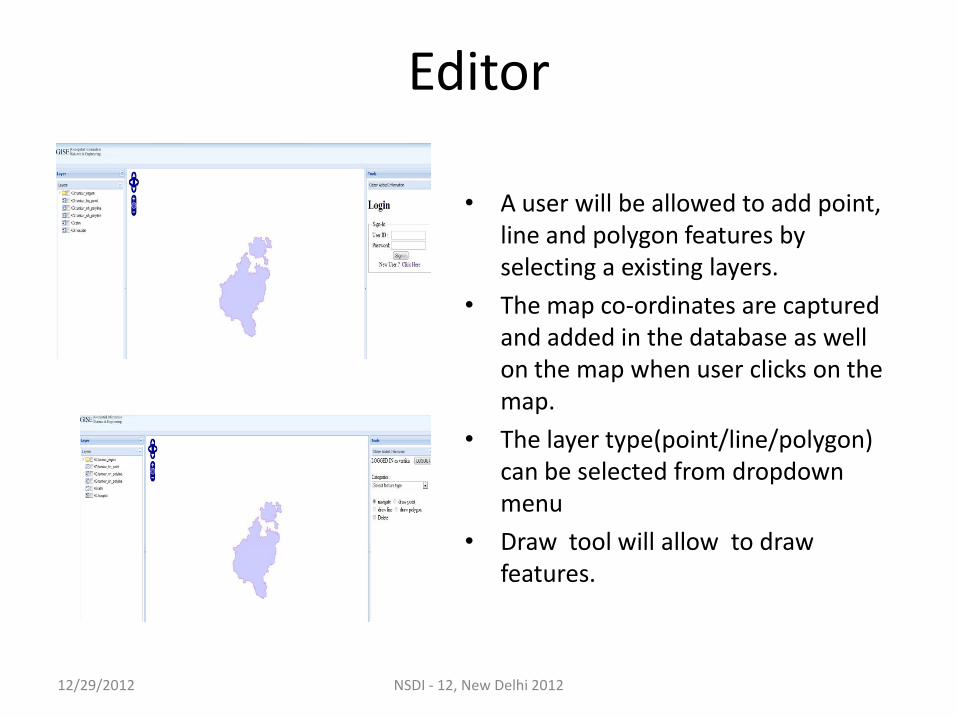
• A user will be allowed to add point, line and polygon features by selecting a existing layers.
• The map co-ordinates are captured and added in the database as well on the map when user clicks on the map.
• The layer type(point/line/polygon) can be selected from dropdown menu
• Draw tool will allow to draw features.
12/29/2012 NSDI - 12, New Delhi 2012
Editor…….contd…
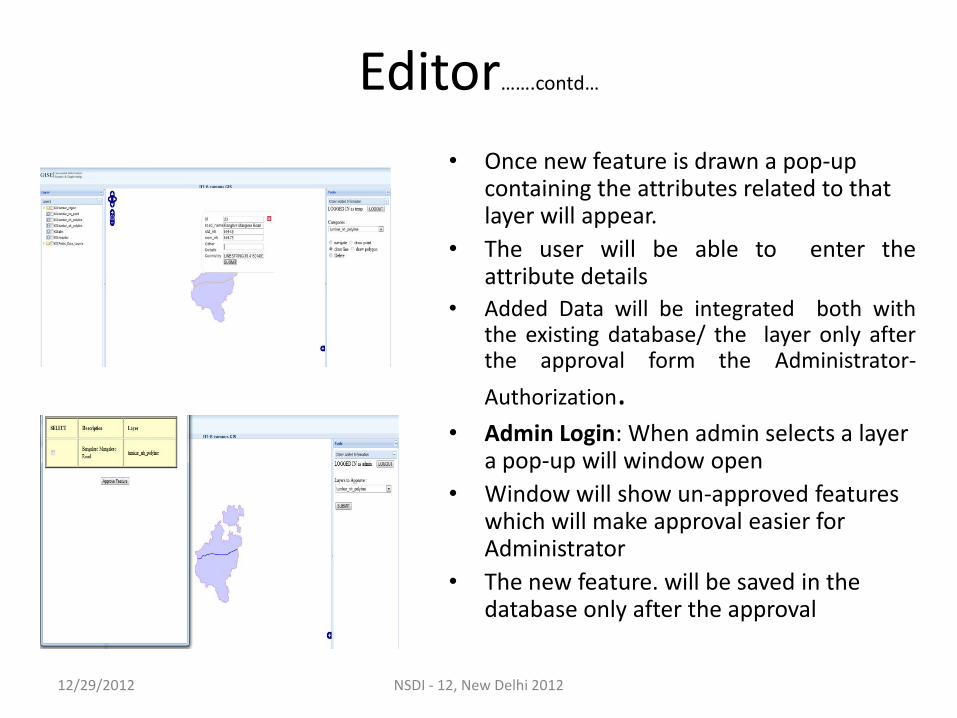
• Once new feature is drawn a pop-up containing the attributes related to that layer will appear.
• The user will be able to enter the attribute details
• Added Data will be integrated both with the existing database/ the layer only after the approval form the Administrator-
Authorization. • Admin Login: When admin selects a layer
a pop-up will window open
• Window will show un-approved features which will make approval easier for Administrator
• The new feature. will be saved in the database only after the approval
12/29/2012 NSDI - 12, New Delhi 2012
Styler
Type
– Basic Styler
• Single Symbol legend
• Labelling
– Advanced Styler
• Graduated Intervals legend
• Unique Value legend
12/29/2012 NSDI - 12, New Delhi 2012
Basic Styler
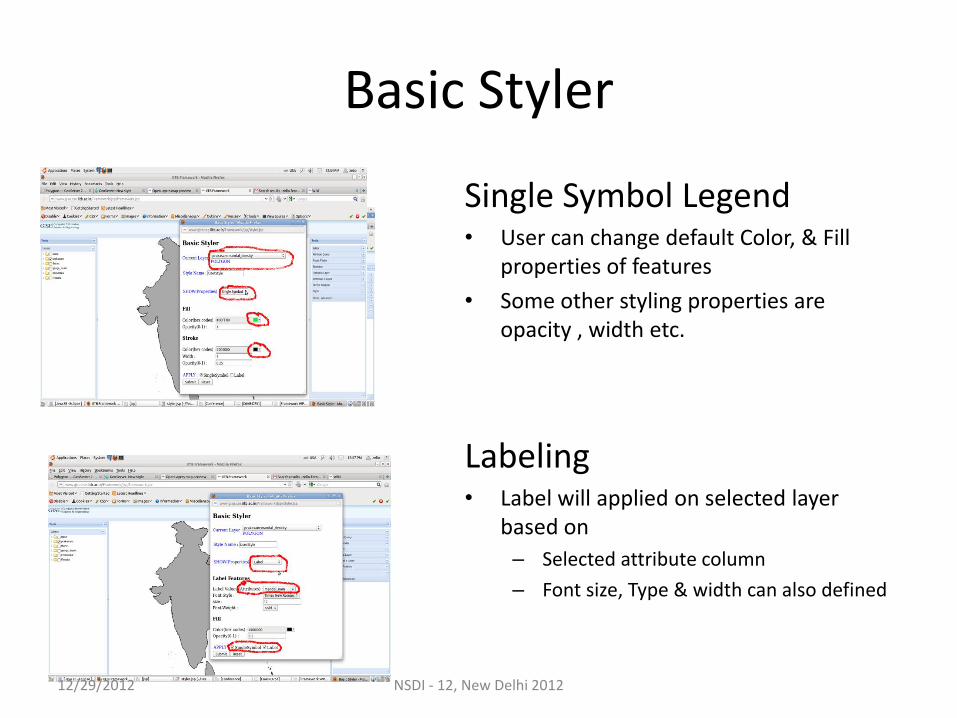
Single Symbol Legend • User can change default Color, & Fill
properties of features
• Some other styling properties are opacity , width etc.
Labeling • Label will applied on selected layer
based on
– Selected attribute column
– Font size, Type & width can also defined
12/29/2012 NSDI - 12, New Delhi 2012
Advanced Styler
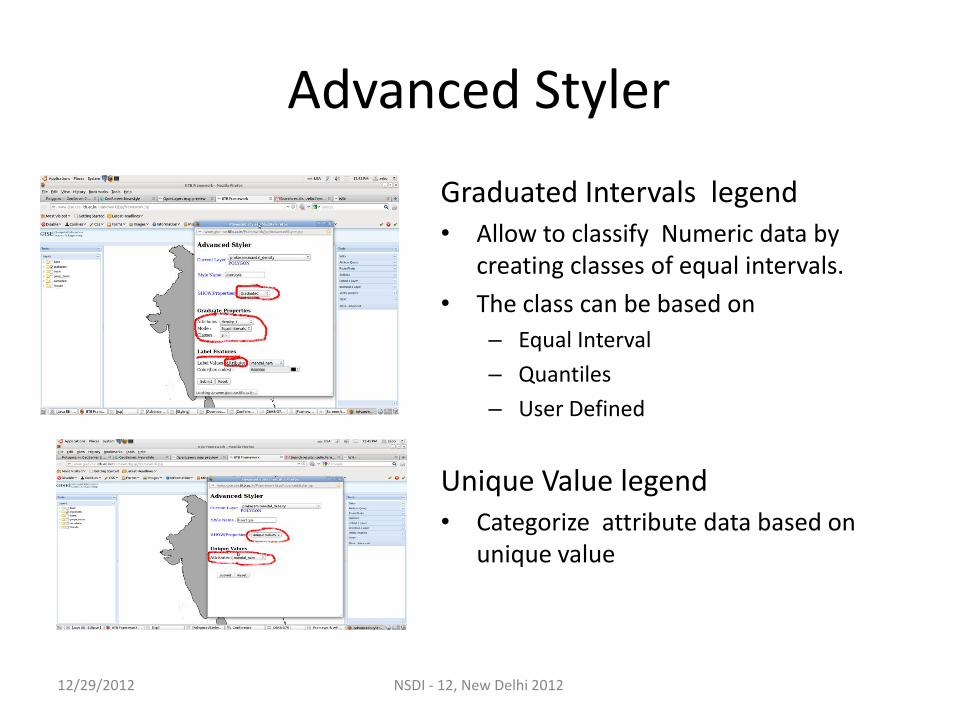
Graduated Intervals legend • Allow to classify Numeric data by
creating classes of equal intervals.
• The class can be based on
– Equal Interval
– Quantiles
– User Defined
Unique Value legend • Categorize attribute data based on
unique value
12/29/2012 NSDI - 12, New Delhi 2012
Future Plan
12/29/2012 NSDI - 12, New Delhi 2012
• Network Analysis Tools – Route creation from given data.
– Shortest Path under given Constraints
– Passengers Load Analysis
– Optimization of Time-dependent Multimodal Transportation System
• Raster Analysis Tools - WCS-WCPS for analysis
Integration of Mobile GIS application & VGI
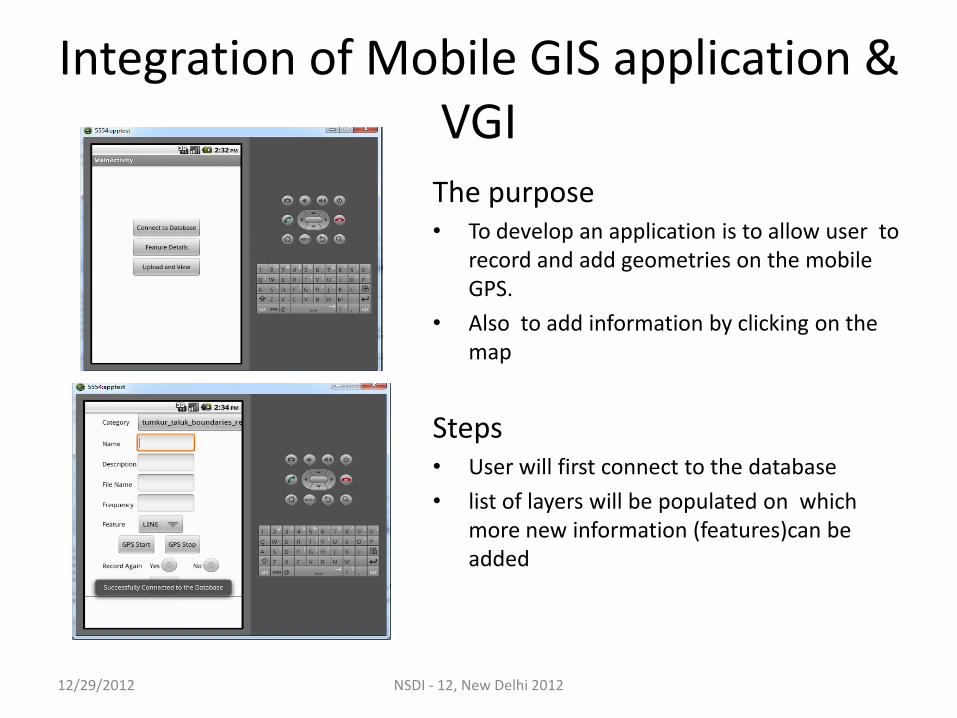
The purpose • To develop an application is to allow user to
record and add geometries on the mobile GPS.
• Also to add information by clicking on the map
Steps • User will first connect to the database
• list of layers will be populated on which more new information (features)can be added
12/29/2012 NSDI - 12, New Delhi 2012
Mobile GIS Application - Steps
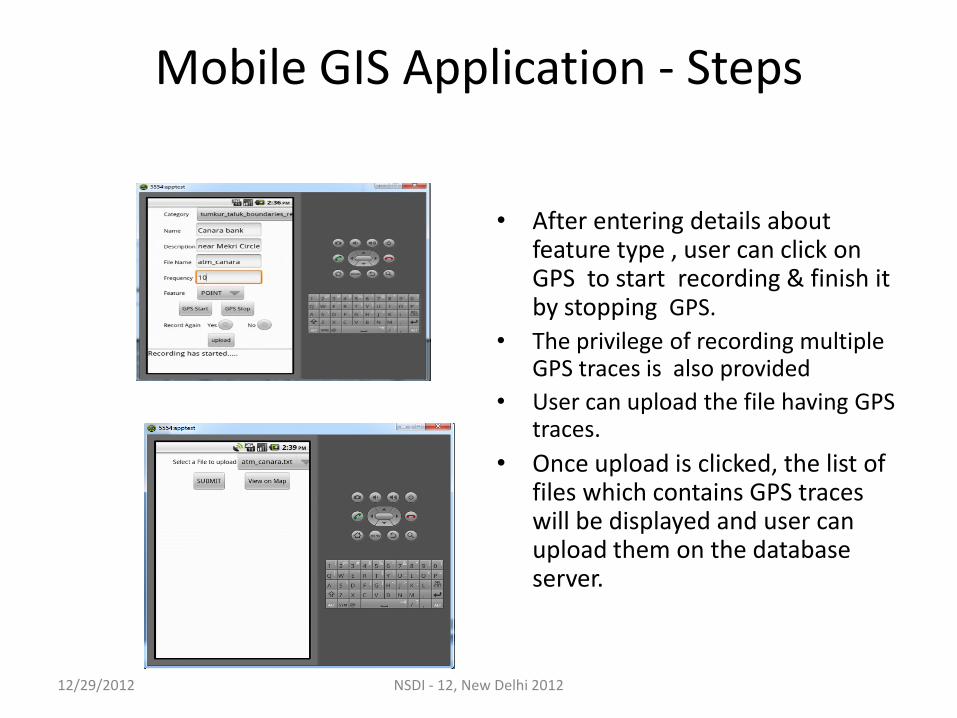
• After entering details about feature type , user can click on GPS to start recording & finish it by stopping GPS.
• The privilege of recording multiple GPS traces is also provided
• User can upload the file having GPS traces.
• Once upload is clicked, the list of files which contains GPS traces will be displayed and user can upload them on the database server.
12/29/2012 NSDI - 12, New Delhi 2012
Integration with VGI
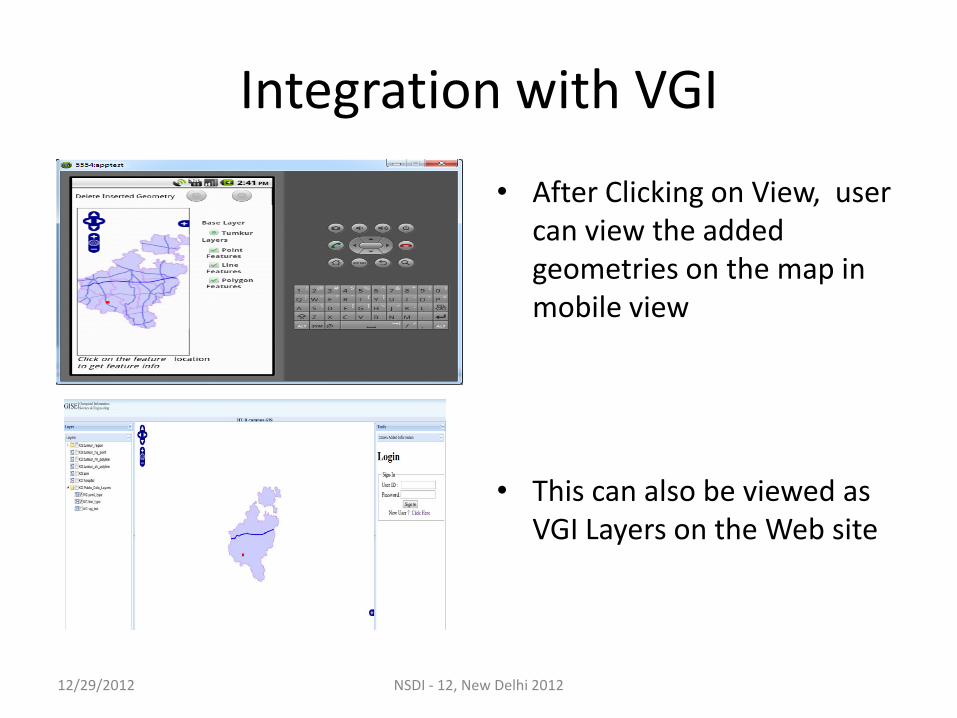
• After Clicking on View, user can view the added geometries on the map in mobile view
• This can also be viewed as VGI Layers on the Web site
12/29/2012 NSDI - 12, New Delhi 2012
Developing a Benchmark for Geospatial Applications
• A Benchmark is the act of running a computer program, or a set of programs, in order to assess the relative performance of an object.
• Benchmarking covers 2 types of processes: Functionality and Performance.
• A benchmark of vector spatial databases should ideally satisfy the following requirements: – Data structures and Queries implemented for the benchmark should not be time
consuming.
– The benchmark should be able to cover wide range of spatial features
• The aim – To develop a workload model for performance (load) testing on the vector spatial
database.
• The following performance metrics are measured: – CPU utilization
– User response time
– User wait time.
12/29/2012 NSDI - 12, New Delhi 2012
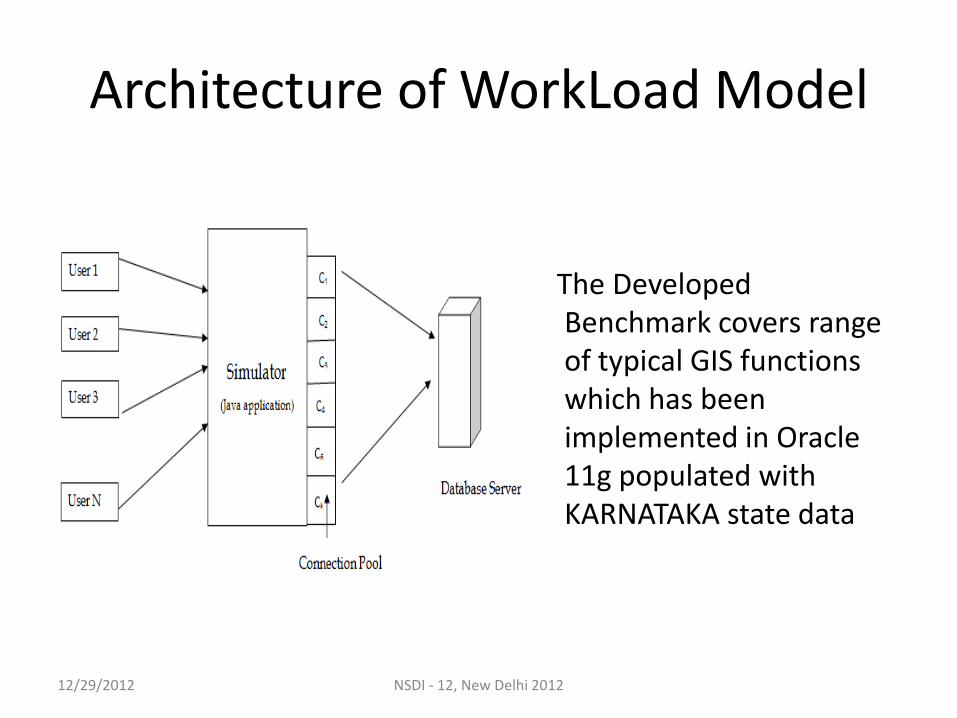
Architecture of WorkLoad Model
The Developed Benchmark covers range of typical GIS functions which has been implemented in Oracle 11g populated with KARNATAKA state data
12/29/2012 NSDI - 12, New Delhi 2012
Queries Used
The queries which are to be used in benchmark have following criteria: – Cover wide range of spatial features – Not time consuming.
The queries which have been used in the model cover following spatial Operations :
– Containment – Overlap – Intersect – Buffer – Adjacent
Note: All the queries used are parameterized so that every time different data blocks are fetched
and accurate measurement of CPU utilization can be made.
12/29/2012 NSDI - 12, New Delhi 2012
Ontology Based Flexible Querying System for Farmers
• Representation of agriculture domain knowledge about crops (*cotton), their growth, diseases, treatments and constantly improving varieties in the form of a query able ontology.
• Storing farmer’s data about the farming conditions, activities already carried out by the farmer etc.
• Simple keyword query that may just give the farmer’s observations or questions.
• An effective search and query answering system.
• Web-based interface is designed where farmer can post his query
• Search over ontology is performed which is aided by farmer’s context information from database
• Results are ranked and returned as set of paths to the user
• Farmer is also advised about his farming activity based on weather predictions
12/29/2012 NSDI - 12, New Delhi 2012
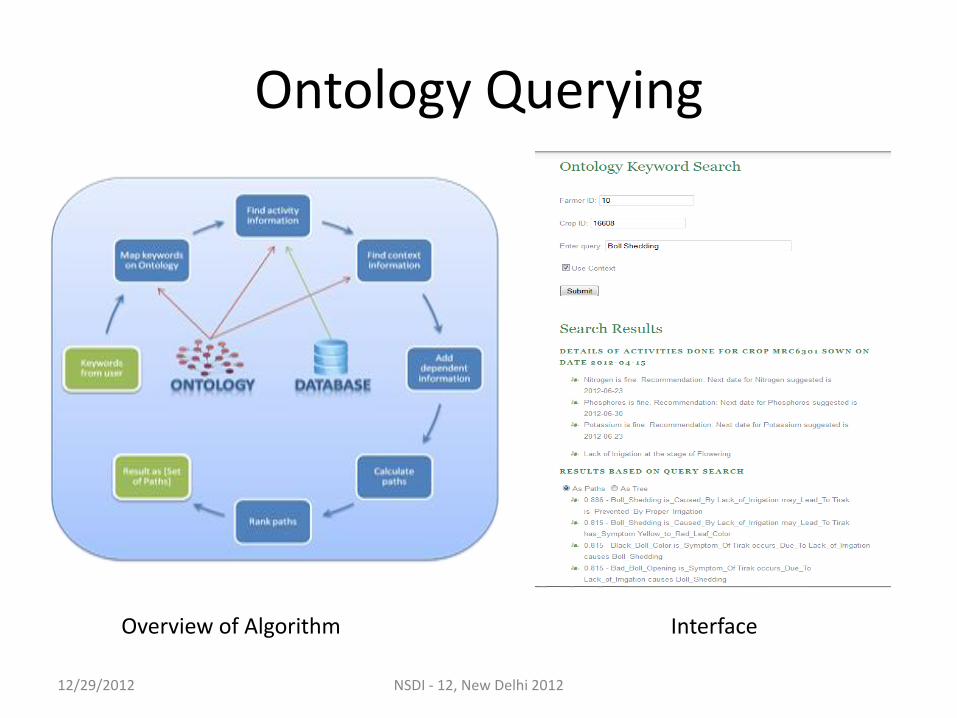
Ontology Querying
12/29/2012 NSDI - 12, New Delhi 2012
Overview of Algorithm Interface
Future Plan
• Data Mining : It allows to extract the most important information from such vast database and to uncover previously unknown patterns that may be relevant to current agricultural problems, thereby helping farmers.
• Ontology Extension: Crop knowledge evolves from time to time by the new observations seen by farmers, impact of specific local conditions etc. This requires ontology to be extended for conveying such knowledge.
• Context - Based Spatial Search: This would require finding relatedness between the farmer’s crop and the crops in nearby fields. Some of the scenarios like a disease affecting a crop would lead farmers of nearby location to be warned prior the occurrence of the disease, as it can spread in their fields too.
12/29/2012 NSDI - 12, New Delhi 2012
Regional Drinking Water Security – Action research, policy and analysis
Current research themes • Regional drinking water scheme analysis:
– GP wide SVS scheme analysis
– Thane district tanker-fed villages and assets
– Development of SVS and MVS scheme analysis protocol through Sugave scheme and Tadwadi-Morewadi analysis.
• MVS Scheme design:
– North Karjat, Mokhada
• Watershed work:
– Gudvanwadi check dam, Modeling for Ikrichapada
• GW modeling with GSDA to predict GW
• Sangli drought planning
12/29/2012 NSDI - 12, New Delhi 2012
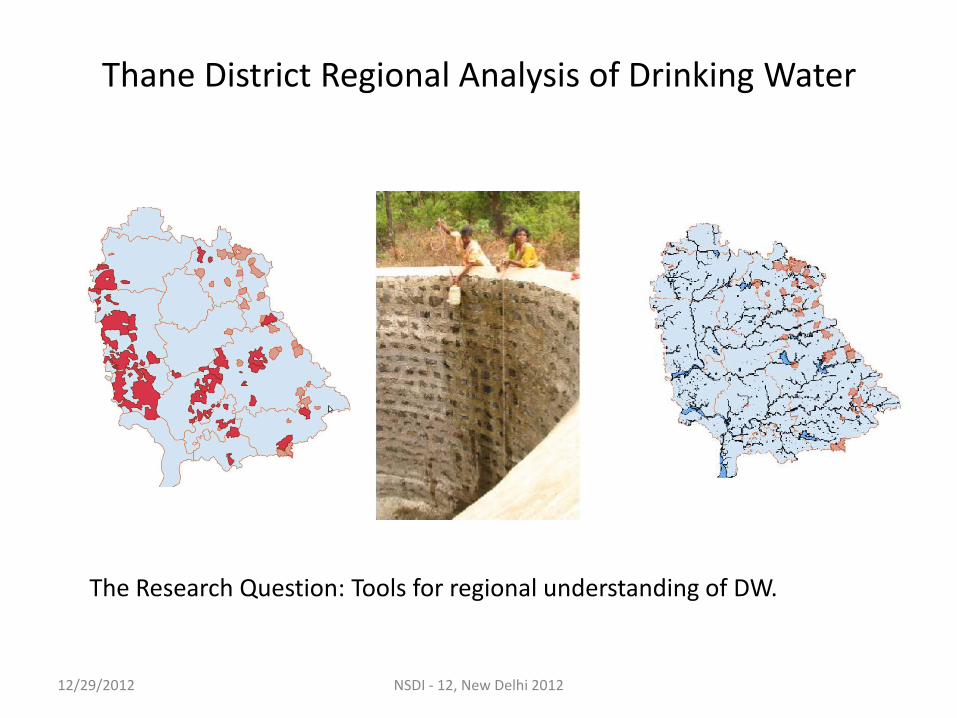
Thane District Regional Analysis of Drinking Water
The Research Question: Tools for regional understanding of DW.
12/29/2012 NSDI - 12, New Delhi 2012
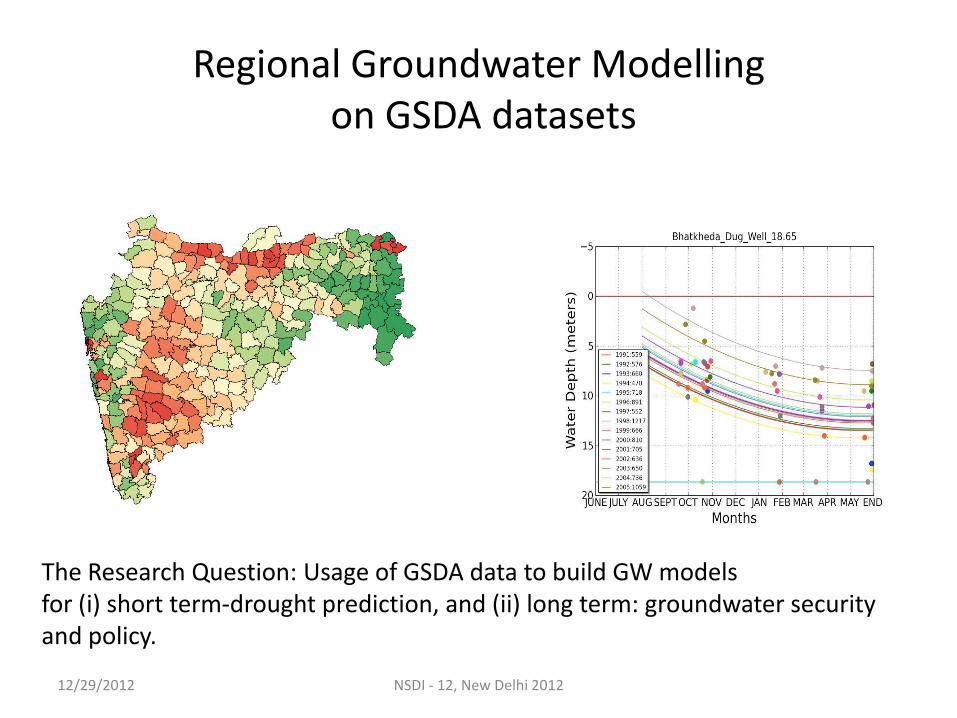
Regional Groundwater Modelling on GSDA datasets
The Research Question: Usage of GSDA data to build GW models for (i) short term-drought prediction, and (ii) long term: groundwater security and policy.
12/29/2012 NSDI - 12, New Delhi 2012
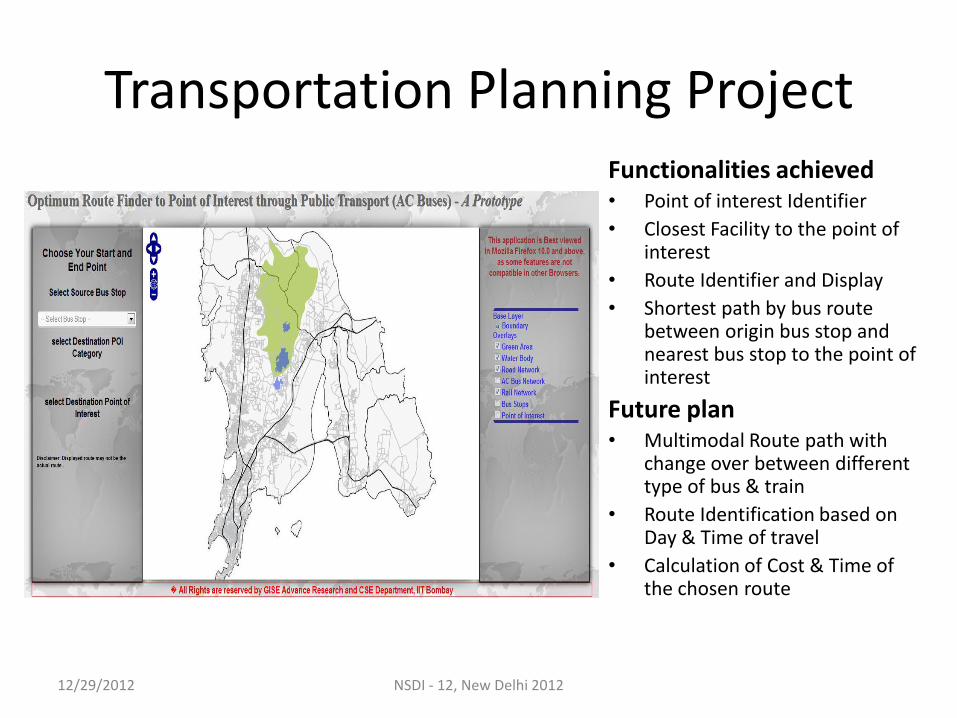
Functionalities achieved • Point of interest Identifier
• Closest Facility to the point of interest
• Route Identifier and Display
• Shortest path by bus route between origin bus stop and nearest bus stop to the point of interest
Future plan • Multimodal Route path with
change over between different type of bus & train
• Route Identification based on Day & Time of travel
• Calculation of Cost & Time of the chosen route
12/29/2012 NSDI - 12, New Delhi 2012
Transportation Planning Project