Embed Size (px)
Citation preview

A Global Transcriptional Analysis of Plasmodium Falciparum Malaria Reveals A Novel Family of Telomere-Associated lncRNAs
CitationBroadbent, Kate M., Daniel Park, Ashley R. Wolf, Daria Van Tyne, Jennifer S. Sims, Ulf Ribacke, Sarah Volkman, Manoj Duraisingh, Dyann Wirth, Pardis C. Sabeti and John L. Rinn. 2011. A global transcriptional analysis of Plasmodium falciparum malaria reveals a novel family of telomere-associated lncRNAs. Genome Biology 12(6): R56.
Published Versiondoi:10.1186/gb-2011-12-6-r56
Permanent linkhttp://nrs.harvard.edu/urn-3:HUL.InstRepos:5339087
Terms of UseThis article was downloaded from Harvard University’s DASH repository, and is made available under the terms and conditions applicable to Open Access Policy Articles, as set forth at http://nrs.harvard.edu/urn-3:HUL.InstRepos:dash.current.terms-of-use#OAP
Share Your StoryThe Harvard community has made this article openly available.Please share how this access benefits you. Submit a story .
Accessibility

1
Research
A global transcriptional analysis of Plasmodium falciparum malaria reveals a novel
family of telomere-associated lncRNAs
Kate M Broadbent1,2, Daniel Park2,3, Ashley R Wolf1,2, Daria Van Tyne4, Jennifer S
Sims4, Ulf Ribacke4, Sarah Volkman2,4,5, Manoj Duraisingh4, Dyann Wirth2,4, Pardis C
Sabeti1,2,3,6† and John L Rinn1,2,7,8*†
{AU Query: Are the following author initials correct for inclusion in the PubMed
Database: “Broadbent KM, Park D, Wolf AR, Van Tyne D, Sims JS, Ribacke U,
Volkman S, Duraisingh M, Wirth D, Sabeti PC, Rinn JL”? yes}
1Department of Systems Biology, Harvard Medical School, 200 Longwood Avenue,
Boston, MA 02115, USA
2Broad Institute, 7 Cambridge Center, Cambridge, MA 02142, USA
3Department of Organismic and Evolutionary Biology, Harvard University, 26 Oxford
Street, Cambridge, MA 02138, USA
4Department of Immunology and Infectious Diseases, Harvard School of Public Health,
651 Huntington Avenue, Boston, MA 02115, USA
5School of Nursing and Health Sciences, Simmons College, 300 The Fenway, Boston,
MA 02115, USA
6FAS Center for Systems Biology, Harvard University, 52 Oxford Street, Cambridge,
MA 02138, USA
7Beth Israel Deaconess Medical Center, 330 Brookline Avenue, Boston, MA 02215, USA

2
8Department of Stem Cell and Regenerative Biology, Harvard University, 7 Divinity
Avenue, Cambridge, MA 02138, USA
†Equal contributors
*Correspondence: John L Rinn. Email: [email protected]
Received: 7 February 2011
Revised: 27 April 2011
Accepted: 20 June 2011
Published: 20 June 2011
© 2011 Broadbent et al.; licensee BioMed Central Ltd. This is an open access article
distributed under the terms of the Creative Commons Attribution License
(http://creativecommons.org/licenses/by/2.0), which permits unrestricted use,
distribution, and reproduction in any medium, provided the original work is properly
cited.
{subject assignments: GENO, MICR, MOLE}
Abstract
Background: Mounting evidence suggests a major role for epigenetic feedback in
Plasmodium falciparum transcriptional regulation. Long non-coding RNAs (lncRNAs)
have recently emerged as a new paradigm in epigenetic remodeling. We therefore set out

3
to investigate putative roles for lncRNAs in P. falciparum transcriptional regulation.
Results: We used a high-resolution DNA tiling microarray to survey transcriptional
activity across 22.6% of the P. falciparum strain 3D7 genome. We identified 872 protein-
coding genes and 60 putative P. falciparum lncRNAs under developmental regulation
during the parasite's pathogenic human blood stage. Further characterization of lncRNA
candidates led to the discovery of an intriguing family of lncRNA telomere-associated
repetitive element transcripts, termed lncRNA-TARE. We have quantified lncRNA-
TARE expression at 15 distinct chromosome ends and mapped putative transcriptional
start and termination sites of lncRNA-TARE loci. Remarkably, we observed coordinated
and stage-specific expression of lncRNA-TARE on all chromosome ends tested, and two
dominant transcripts of approximately 1.5 kb and 3.1 kb transcribed towards the
telomere.
Conclusions: We have characterized a family of 22 telomere-associated lncRNAs in P.
falciparum. Homologous lncRNA-TARE loci are coordinately expressed after parasite
DNA replication, and are poised to play an important role in P. falciparum telomere
maintenance, virulence gene regulation, and potentially other processes of parasite
chromosome end biology. Further study of lncRNA-TARE and other promising lncRNA
candidates may provide mechanistic insight into P. falciparum transcriptional regulation.
Background {1st level heading}
The causative agent of the most severe form of human malaria, Plasmodium falciparum,
is a unicellular eukaryotic parasite transmitted through the bites of infected mosquitoes.
The most vulnerable population to malarial disease is African children, but a staggering

4
3.3 billion people - half the world’s population – are at risk for malarial infection. Despite
recent research advances [1-6], the mechanisms P. falciparum utilizes to regulate
mutually exclusive expression of multi-gene virulence families and stage-specific
expression of approximately 80% of its genome during pathogenic blood stage
development remain elusive.
Most confounding is the scarcity of sequence-specific transcription factors and cis-acting
regulatory elements, coupled with the apparent lack of both RNA interference machinery
and DNA methylation in the parasite [7,8]. However, the recent discovery of an expanded
lineage of 27 ApiAP2 (apicomplexan apetela 2) transcription factors may partially
explain how the parasite regulates its unusual genome [9,10]. Additionally, it is becoming
increasingly clear that chromatin remodeling and epigenetic memory play an important
role in blood stage-specific expression and antigenic variation of virulence genes
[6,11,12]. Notably, while the parasite lacks many of the conventional regulatory
mechanisms of other organisms, it has a full arsenal of conserved histone modifying
enzymes, and a higher than average number of RNA-binding proteins [8,13].
In eukaryotes spanning from yeast to humans, epigenetic regulation incorporates
feedback from non-coding RNAs. Specifically, long non-coding RNAs (lncRNAs) and
small non-coding RNAs often interface with RNA binding proteins and chromatin
remodeling complexes to modulate their targeted genomic loci [14-18]. For example, in
X chromosome inactivation at least seven distinct lncRNAs coordinate the selection and
silencing of an entire chromosome [19]. As another example, long telomeric repeat-

5
containing RNA (TERRA) transcripts have been recently discovered as a major
constituent of telomeric heterochromatin. TERRA interacts with telomere-associated
proteins such as telomerase, is developmentally regulated, and is implicated in telomere
replication and structural maintenance processes [20-25].
To investigate putative regulatory roles for lncRNAs in P. falciparum, we designed a
high-resolution DNA tiling array to survey transcriptional activity during the parasite’s
pathogenic human blood stage. We identified 60 lncRNA candidates and characterized
their G+C content, evolutionary conservation, expression profile, and correlation with
neighboring genes. Notably, our transcriptional profiling and subsequent analysis
revealed an outlier on all fronts: a long telomere-associated non-coding RNA gene,
termed lncRNA-TARE-4L, encoded in the telomere-associated repetitive element
(TARE) tract of chromosome four.
Upon further investigation of the lncRNA-TARE-4L locus, we discovered a multi-gene
family of lncRNA-TAREs. We have mapped homologous lncRNA-TARE loci on 22 of
28 P. falciparum chromosome ends, and quantified the coordinated, stage-specific
transcription of 15 distinct lncRNA-TARE sequences using quantitative real-time PCR
(qRT-PCR). We additionally employed rapid amplification of cDNA ends (RACE) to
map putative transcriptional start and termination sites of lncRNA-TARE genes,
including three sequences not investigated by qRT-PCR. Our RACE results suggested
two dominant transcripts of approximately 1.5 kb and 3.1 kb are transcribed from the
TARE 3 boundary towards the telomere. Interestingly, we also found that an upstream

6
sequence type B (upsB-type) var virulence gene is adjacent to each predicted lncRNA-
TARE gene and that lncRNA-TARE sequence is enriched with transcription factor
binding sites only otherwise found in upsB-type var gene promoters.
Our results complement the recent P. falciparum transcriptome studies of Otto et al. [5],
Raabe et al. [26], and others by providing stage-specific profiling and characterization of
several previously unidentified P. falciparum lncRNA candidates, including a long
telomere-associated non-coding RNA family. Specifically, we have demonstrated that
long telomere-associated lncRNAs are coordinately expressed after parasite DNA
replication from at least 18 chromosome ends. Taken together, this work provides new
insights into P. falciparum non-coding RNA transcription and contributes a previously
uncharacterized parallel between P. falciparum and model eukaryote chromosome end
biology.
Results {1st level heading}
Tiling microarray experimental design {2nd level heading}
In order to comprehensively identify and characterize long non-coding transcripts in P.
falciparum, we selected overlapping probes tiling approximately 22.6% of the P.
falciparum genome at 12-bp median resolution. Notably, our DNA tiling array design
provides over one order of magnitude denser probe coverage than previous P. falciparum
transcriptional profiling arrays, and is unique in that it deeply samples both genic and
intergenic sequence [4]. Probes cover 561 Watson (+) strand protein-coding genes, 699
Crick (-) strand protein-coding genes, two ribosomal RNA genes, and 1.73 Mb of

7
intergenic sequence on P. falciparum chromosomes 2, 3*, 4, 5*, 7, 9, 12* (asterisks
indicates partial coverage; see Materials and methods and Additional file 1 for further
genome coverage details).
We harvested RNA from highly synchronous 3D7 parasites to capture global
transcriptional changes during the parasite’s two major intraerythrocytic developmental
cycle transitions: ring to trophozoite and trophozoite to schizont stage. During the P.
falciparum intraerythrocytic developmental cycle, the parasite first exports cytoadherence
surface proteins to sequester itself in host tissue (ring stage = 0 to 24 hours). This is
followed by hemoglobin digestion and DNA replication (trophozoite stage = 24 to 36
hours), and, finally, nuclei segmentation and formation of 16 to 32 daughter merozoites
(schizont stage = 36 to 48 hours) [27,28]. Specifically, we profiled the polyadenylated
RNA population transcribed from both genomic strands at 18 (ring), 24
(ring/trophozoite), 30 (trophozoite), and 36 (trophozoite/schizont) ± 3 hours post-
erythrocyte invasion (hpi) using our custom DNA tiling microarray.
Identification of lncRNA candidates {2nd level heading}
To identify transcriptionally active regions (TARs) along the P. falciparum genome, we
analyzed normalized probe hybridization intensities using a window-based scan statistic
algorithm. As proposed by Guttman et al. [29,30], a TAR can be reasonably defined as a
contiguous stretch of tiling probes with signal intensity significantly above the
background distribution of permuted hybridization intensities. Briefly, we calculated a
scan statistic score for iterative window intervals, controlling the probability of one or

8
more intervals being erroneously called significant at 5% [31]. As the final step, we
merged overlapping intervals to define TAR boundaries. Taken together, this highly
conservative approach corrects for multiple testing and provides strong family-wise type
I error rate control in our set of significant TARs.
Our transcriptional profiling approach identified 1,360 significantly expressed TARs.
Specifically, 1,229 TARs exhibited overlap with 872 probed PlasmoDB v6.5 protein-
coding genes, 8 TARs overlapped the 2 probed ribosomal RNA genes, and 123 TARs
represented un-annotated, putative non-coding transcripts from P. falciparum intergenic
regions (Figure 1a). In summary, both ribosomal RNA genes and 64.1% of protein-
coding genes on the array were identified as expressed in at least one of the four time-
points tested. This is consistent with previous studies showing that 70 to 90% of protein-
coding genes are expressed during P. falciparum intraerythrocytic development [3-5].
Coordinates for all predicted TARs are included in Additional file 2.
We next investigated our expression data for known patterns of gene regulation. We
performed clustering analysis to confirm the stage-specific transcription cascade expected
for P. falciparum’s protein-coding genome (Figure 1b; Additional file 3), and ontology
analysis of stage-specific genes to confirm the parasite processes known to occur during
our time-points (Additional file 4). As a further control, we confirmed that known
housekeeping genes such as seryl-tRNA synthetase (PF07_0073) were not differentially
expressed, while early and late stage markers such as PFD0020c and PFB0275w were
maximally expressed in T18 and T36, respectively (Figure 1c) [3-5]. Collectively, these

9
analyses confirmed the biological representation of our samples and provided meaningful
context to investigate lncRNA expression during the parasite’s pathogenic human blood
stage.
We applied conservative criteria to identify bona fide P. falciparum lncRNAs from the
set of 123 expressed intergenic transcripts. Namely, we required transcripts to be larger
than 200 nucleotides, eliminating 46 putative small RNAs from further analysis
(Additional file 5). We also eliminated transcripts having even marginal protein-coding
potential. Briefly, we used BLASTX to translate the remaining 77 transcripts and search
for significant protein matches across all 439,884 and 12,597,337 sequences represented
in the Swissprot and non-redundant protein sequence (nr) databases, respectively. We
also searched subsets of both databases with the following organism queries:
Plasmodium, Plasmodium falciparum, and Plasmodium falciparum strain 3D7. While the
large majority of analyzed transcripts lacked any coding potential, BLASTX analysis
predicted that 17 transcripts might, in fact, be novel P. falciparum genes or pseudogenes
(Additional file 6). Thus, our conservatively filtered set of putative lncRNAs for
additional characterization consisted of 60 candidate sequences (Figure 1a; Additional
file 7).
Additional characterization of lncRNA candidates highlights a novel telomere-
associated lncRNA {2nd level heading}
To systematically prioritize the 60 putative lncRNAs for functional follow-up, we looked
for lncRNAs with similar properties to known functional transcripts in P. falciparum

10
and/or bona fide lncRNAs in other organisms. We also investigated the possibility that
lncRNA candidates may be spliced to nearby genes or represent un-annotated UTRs. To
this end, we assessed each lncRNA candidate’s G+C content and evolutionary
conservation, as well as the correlation between lncRNA and neighboring gene
expression profiles, and the distance between lncRNA and neighboring genes to infer
transcript independence.
Known classes of functional non-coding RNA in P. falciparum, such as ribosomal RNA
and transfer RNA, have high G+C content [32,33]. While high G+C content is certainly
not sufficient or necessary for function, we were nonetheless interested in the G+C
content of our putative lncRNAs. We found the average G+C content of lncRNA
candidates (15.4%) to be typical of P. falciparum intergenic regions [34] and well below
the coding transcript average (23.7%). This is not an unexpected result and, importantly,
indicates no systematic hybridization bias towards detection of expressed non-coding
regions with higher than expected G+C content. Interestingly, however, this analysis
highlighted one lncRNA with similar G+C content (32.1%) to ribosomal RNA transcripts
(Figure 2a). We termed this candidate lncRNA-TARE-4L, as it is encoded in the TARE
tract on the left end of chromosome four.
We next explored the evolutionary conservation of putative lncRNA sequences as an
indicator of preserved functionality [35]. We performed BLASTN sequence alignment
within the partially assembled, closely related Plasmodium reichenowi chimpanzee
parasite genome and across six other partially sequenced, more distant Plasmodium

11
species (Figure 2b). We found that 19 lncRNAs exhibited some level of conservation in
the Plasmodium species investigated, but that only lncRNA-TARE-4L was strongly
conserved across all species tested. To assess the significance of this result, we repeated
this analysis for 600 size-matched random intergenic sequences, as well as for ribosomal
RNAs and size-matched coding exons. We found that, respectively, 4.5%, 87.5%, and
33.3% had BLASTN hits to all Plasmodium species analyzed. Thus, the broad sequence
conservation of lncRNA-TARE-4L is significant (P-value = 0.045) and more similar to
the level of conservation expected for ribosomal RNAs and coding regions. Interestingly,
we also found that 23 of the 27 broadly conserved null intergenic sequences map to either
the telomeric or subtelomeric repeats.
The vast majority of P. falciparum genes are highly expressed only once per 48-hour
intraerythrocytic developmental cycle, and genes in related cellular processes are induced
together [3]. Given this model for functional protein-coding transcripts, we reasoned that
lncRNA candidates are more likely biologically significant if expressed in a stage-
specific manner. Moreover, regulatory lncRNAs have been reported to act in cis to their
targeted loci [35-37]. Consistent with this notion, lncRNAs that are both differentially
expressed and encoded nearby essential or pathogenic genes may be involved in
regulating these important loci. Figure 1d,e shows that putative lncRNAs are
developmentally regulated similar to protein-coding transcripts (see Materials and
methods and Additional file 3 for detailed comparisons). Additionally, we found that
many lncRNA candidates neighbor essential genes and factors involved in parasite
pathogenesis (Additional file 8).

12
Given clear patterns of transcriptional regulation, we next tested if the 60 candidate
lncRNAs were likely to be independent transcripts as opposed to un-annotated UTRs or
small spliced exons to neighboring coding genes. To this end, we measured the Pearson
correlation between putative lncRNA and neighboring gene expression profiles,
conservatively selecting the most correlated, adjacent, expressed gene as the neighboring
gene (Additional file 7, columns j and l; and see Materials and methods). We found that
40 lncRNA candidates were highly correlated, raising the possibility that they may be
spliced to or represent UTRs of adjacent coding genes. Of the remaining 20 lncRNA
candidates exhibiting patterns of correlation consistent with independent transcription, 16
displayed biologically meaningful variation across our time-points. Thus, correlation
analysis highlighted 16 candidates with clear evidence of independent transcriptional
regulation.
While the null distribution of correlations from adjacent pairs of coding genes
demonstrated that approximately 30 of 40 highly correlated lncRNA candidates may be
UTRs or otherwise spliced to nearby genes, it also suggested that 10 independent
transcripts should exhibit this level of correlation by chance (Additional file 9). To
further distinguish such potential transcripts, we considered the distance of each putative
lncRNA to the nearest neighboring coding gene. We found that 11 lncRNA candidates
were over 1 kb from a coding gene. As the mean intron length in P. falciparum is 168 bp
[34], we considered this as evidence of independence regardless of correlation value.

13
Taken together, these results point to a highly conservative set of 23 lncRNA candidates
based on correlation and distance analyses.
Strikingly, we found that lncRNA-TARE-4L exhibited the strongest evidence of
independent transcriptional regulation. lncRNA-TARE-4L is flanked by the telomere and
an upsB-type var gene (Figure 3a). However, the var gene is over 20 kb away and the
exon structure of var transcripts has been previously mapped [38,39]. Given a mean
intron length of 168 bp and maximum intron length of 4.9 kb in P. falciparum [34], the
splicing of lncRNA-TARE-4L to the nearest neighboring var gene would be biologically
unprecedented. Moreover, correlation analysis revealed that lncRNA-TARE-4L is anti-
correlated with the nearest expressed gene (r = -0.296). The nearest expressed gene
(PFD0020c) is an additional 20 kb beyond the silenced upsB-type var gene and is
profiled in Figure 1c for visual comparison to lncRNA-TARE-4L (Figure 1e, asterisks).
Collectively, lncRNA-TARE-4L emerged as the lncRNA candidate with the most
promising properties for functional follow-up. lncRNA-TARE-4L is encoded in the
TARE 2-3 subtelomeric repeat region between the telomere and a silenced upsB-type var
gene (Figure 3a), has G+C content and sequence conservation similar to that of
functional ribosomal RNA, is sharply induced after parasite DNA replication, and is
clearly an independent transcript.
As we further investigated the sequence properties of lncRNA-TARE-4L, we found that
homologous lncRNA-TARE sequences are encoded adjacent to upsB-type var genes on

14
22 of 28 P. falciparum chromosome ends (Figure 3b) [40-42]. In five cases where there is
no lncRNA-TARE gene, there is similarly not an upsB-type var gene. This perhaps
suggests concurrent evolutionary pressure acting on lncRNA-TARE and upsB-type var
genes. Consistent with this notion, the lncRNA-TARE loci are highly similar; the average
pairwise identity between sequences is 88.1% (Additional file 10).
lncRNA-TARE loci are coordinately expressed from at least 15 chromosome ends
{2nd level heading}
Given our evidence for expression of the TARE 2-3 region on chromosome 4 and
conservation of this region on 22 P. falciparum chromosome ends, we hypothesized that
the 22 TARE 2-3 regions may be coordinately expressed. We thus set out to further
investigate the expression properties of lncRNA-TARE loci in independent blood stage
time courses. In line with our array results, we expected lncRNA-TARE-4L, and
potentially other lncRNA-TARE genes, to be differentially expressed after parasite DNA
replication.
We conducted two additional highly synchronous P. falciparum time courses focused on
stage-specific time-points T20 (ring), T30 (trophozoite), and T36/T38/T40 (schizont) ± 3
hpi, and subsequently isolated RNA from each stage. We were able to design specific
primer pairs targeting 15 chromosome ends and used qRT-PCR to probe expression at the
TARE 2-3 region. Primer pairs were excluded if they did not have at least 90%
amplification efficiency or amplified non-specific products (Materials and methods;
Additional file 11).

15
We found that the TARE 2-3 region is expressed on all 15 distinct chromosome ends
tested. Remarkably, all 15 lncRNA-TARE genes are coordinately and strongly induced
after parasite DNA replication, with maximal lncRNA-TARE transcript abundance
observed in the T40 ± 3 hpi time-point (Figure 3b). This result is the first quantitative
experimental evidence showing that 15, if not more, P. falciparum chromosome ends are
transcriptionally active between the parasite’s DNA replication and cell division cycles.
Taken together, we have validated and expanded the microarray discovery of lncRNA-
TARE-4L to define a novel telomere-associated lncRNA family, termed lncRNA-TARE.
We have also shown that lncRNA-TARE is maximally expressed during an important
stage of parasite blood stage development.
RACE defines two dominant long telomere-associated transcripts {2nd level
heading}
We next pursued RACE to map putative transcriptional start and termination sites of
lncRNA-TARE. We used a priming strategy in which both the 5’ and 3’ RACE reactions
were primed using the same primer sequence, albeit reverse complemented, to ensure
amplification of a contiguous long transcript. Additionally, as we aimed to investigate the
transcript boundaries of multiple lncRNA-TARE loci in parallel, we designed RACE
primers to simultaneously target 20 lncRNA-TARE sequences (Figure 4, black triangles;
Additional file 11).

16
3’ RACE analysis suggested two dominant lncRNA-TARE species are transcribed from
the centromere towards the telomere on at least 12 different chromosome ends (Figure 4;
Additional files 12 and 13). Interestingly, we found that the longer transcript
corresponded to termination immediately after the TARE 2 element, while the shorter
transcript corresponded to termination immediately prior to TARE 2. Additionally, the
syntenic termination site for seven distinct lncRNA-TARE family members
encompassing TARE 2 was identical and corresponded to the transcript model predicted
by our sliding-window algorithm (Materials and methods). In terms of the shorter
transcript, we again found that seven distinct lncRNA-TARE species shared a precise
syntenic termination site just upstream of TARE 2 (Figure 4, asterisks).
We discovered a single putative 5’ transcriptional start site for the lncRNA-TARE locus
on the left end of chromosome 3. Notably, this start site corresponded to the boundary of
the TARE 3 element (Figure 4; Additional files 12 and 13). The intrinsic tendency of
PCR amplification of multi-gene families to result in strongly biased representation of
certain family members [43] likely explains the homogeneity of our cloned 5’ RACE
products.
Collectively, our RACE results provide strong evidence that long non-coding RNA genes
are present in the P. falciparum TARE 2-3 subtelomeric repeats. Furthermore, our results
support a model of unidirectional transcription towards the telomeres, as we were unable
to amplify transcripts of the opposite polarity. We note, however, that our results do not
explicitly rule out bidirectional transcription or the presence of alternative transcript

17
models beyond the approximately 1.5 kb and 3.1 kb species defined here. For example,
the high A+T content of the P. falciparum genome poses a technical barrier for 3’ RACE
analysis, as internal A-rich regions may hybridize with the 3’ RACE primer targeted to
poly-A transcript tails.
lncRNA-TARE loci are enriched with transcription factor binding sites {2nd level
heading}
An additional salient feature of lncRNA-TARE is that the TARE 2-3 region contains
approximately 15 occurrences of the bipartite, palindromic subtelomeric var promoter
element 2 (SPE2) motif on average [44]. This pattern seems to be non-random as there
are only two SPE2-enriched loci along the P. falciparum genome: the TARE 2-3 region
and the upstream promoter element of subtelomeric upsB-type var genes. Notably, these
two loci account for 94% of 777 predicted SPE2 consensus sites, and both the presence
and position of SPE2 sites is conserved on intact chromosome ends (Figure 4; Additional
file 10) [10,42,44,45].
Moreover, Flueck et al. [44] and others [10,46,47] have recently demonstrated that a
member of P. falciparum’s ApiAP2 transcription factor family specifically binds
subtelomeric SPE2 sites in late stage parasites. We thus further investigated, using qRT-
PCR, the expression of lncRNA-TARE-4L and the P. falciparum SPE2-interacting
protein (PfSip2; PFF0200c). We compared expression at T30 ± 3 hpi during peak DNA
replication to expression at T36, T38, and T40 ± 3 hpi during parasite schizogony. We
found lncRNA-TARE-4L and PfSip2 to have highly correlated late stage temporal

18
profiles. Our results also suggested that PfSip2 is expressed prior to maximal lncRNA-
TARE-4L expression, which may indicate PfSip2 induction of the lncRNA-TARE locus
and/or co-activation of lncRNA-TARE (Additional file 14).
Discussion {1st level heading}
In the present work we have identified and characterized several previously undetected
lncRNAs in P. falciparum, such as a novel family of 22 homologous lncRNA-TARE
genes that exhibit coordinated expression at a key stage in the P. falciparum life cycle.
This family of lncRNA-TAREs encompasses the majority of known binding sites (SPE2)
for the ApiAP2 transcription factor PfSip2 (Figure 4; Additional file 10). As PfSip2 is
expressed and specifically binds subtelomeric SPE2 sites at the stage of maximal
lncRNA-TARE transcription, these results suggest that PfSip2 binding may positively
regulate the lncRNA-TARE locus [44]. Alternatively, lncRNA-TARE transcription may
allow PfSip2 binding, or in the case that both models are valid, a regulatory feedback
loop between PfSip2 binding and lncRNA-TARE transcription may exist (Model 1 in
Figure 5) [48].
The only other conserved cluster of SPE2 sites is in the upstream promoter element of
upsB-type var genes. This suggests that lncRNA-TARE may play a role in subtelomeric
upsB-type var gene regulation. Consistent with this notion, all 22 lncRNA-TARE genes
are encoded adjacent to an upsB-type var gene. Moreover, PfSip2 is implicated in
silenced subtelomeric var gene regulation [44]. Thus, lncRNA-TARE may help regulate

19
upsB-type var genes by directly or indirectly interacting with and/or recruiting multiple
copies of PfSip2 to chromosome ends (Model 2 in Figure 5) [49].
Mutually exclusive var gene regulation is known to involve nuclear repositioning and
heritable chromatin memory marks [6,50-55]. An emerging theme in mammalian
epigenetic regulation is the association of lncRNAs with chromatin modifying
complexes, which in turn recruits these factors to their sites of action [36,56-58].
Notably, the induction of lncRNA-TARE transcription between P. falciparum DNA
replication and cell division is ideally timed to help initiate post-S-phase epigenetic
memory marks at nearby upsB-type var genes. Thus, it is possible that lncRNA-TARE
may interface with chromatin reading and/or writing factors to modulate the precise
epigenetic regulation of nearby subtelomeric var loci (Model 3 in Figure 5).
Non-coding transcripts expressed from a conserved bidirectional promoter in var gene
introns provide some precedent for the proposed link between lncRNA-TARE and var
gene regulation. Perhaps non-coincidentally, both lncRNA-TARE and var gene ‘sterile’
transcripts have a similar post-S-phase transcriptional profile [59]. However, while the 22
lncRNA-TARE loci exclusively pair with upsB-type var genes, the previously described
var gene ‘sterile’ transcripts are expressed from both silenced and activated var genes of
all types [38,60]. Thus, lncRNA-TARE may provide a different and/or additional level of
regulation unique to subtelomeric upsB-type var loci. We also note that in a
complementary study by Raabe et al. [26], small subtelomeric non-coding RNAs ranging
in size from 31 to 103 nucleotides were identified in this region. Taken together, our

20
results perhaps support a model of long precursor transcripts being processed into small
non-coding RNAs.
Interestingly, the origin and transcriptional profile of lncRNA-TARE is strongly
reminiscent of the eukaryotic non-coding RNA family TERRA. Across numerous
eukaryotic model systems, TERRA is transcribed from subtelomeric loci, associates with
telomeric repeats, and is implicated in telomere structural integrity and heterochromatin
assembly [20-25,61-66]. Consistent with a possible TERRA-like role for lncRNA-TARE,
large chromatin state changes occur at P. falciparum chromosome ends in concordance
with maximal lncRNA-TARE transcription (Model 4 in Figure 5) [67,68]. Moreover,
TERRA transcript levels are regulated by the cell cycle, with lowest TERRA abundance
observed during DNA replication [22,69]. We similarly observe the lowest lncRNA-
TARE transcript levels at T30 ± 3 hpi, which corresponds to peak parasite DNA
replication.
In summary, several pieces of evidence point to a key role for lncRNA-TARE in
transcriptional and/or epigenetic regulation of P. falciparum telomeric and subtelomeric
regions. This work motivates further experimentation to resolve the mechanistic details of
lncRNA-TARE and other promising P. falciparum lncRNA candidates.
Conclusions {1st level heading}
Our global transcriptional profiling study provides a catalyst for in-depth functional
analyses of high-confidence P. falciparum lncRNA candidates and for a full-genome

21
investigation of parasite strains beyond 3D7. We have identified and characterized 60
putative lncRNAs using conservative thresholds for statistical and biological significance,
providing 23 strong candidates for further functional experimentation, such as RNA
binding assays and expression knockdown experiments. Such future studies will be key
in establishing a direct molecular link between specific lncRNA transcripts and parasite
proteins and in determining genes modulated by lncRNAs during P. falciparum blood
stage development. Recent studies in model eukaryotes suggest that lncRNAs represent a
new paradigm in genome regulation and chromatin remodeling. Hence, profiling the non-
coding transcriptome of drug-resistant parasites, parasites with mis-regulated virulence
gene phenotypes, and hyper-virulent clinical isolates is an exciting new research direction
in the quest to eradicate malarial disease.
Materials and methods {1st level heading}
Microarray design {2nd level heading}
The DNA tiling array was designed in conjunction with Roche NimbleGen to tile a
portion of the P. falciparum genome with a targeted median probe spacing of 12 bp. The
3D7 assembly (PlasmoDB v5.5) was used as the reference sequence. The design targeted
all of chromosomes 2, 4, 7 and 9 and partial chromosomes 3:106138-147339, 5:947885-
end, and 12:start-66805 (Additional file 1). The three chromosomes tiled in their entirety
were selected at random. However, the four partially tiled chromosomes represent
regions of particular interest given our hypothesis that lncRNAs may be involved in
chromatin remodeling and clinically important parasite processes. Probes were variable
length Tm-matched long oligonucleotides, averaging 55 bp each. Probe sequences were

22
screened for excessive cross hybridization to 3D7 sequence: any probes with more than
five close Sequence Search and Alignment by Hashing Algorithm (SSAHA) matches
were eliminated [70,71]. The final design filled 366,479 probes on the array, 96.81% of
which are unique. The raw and normalized data discussed in this publication have been
deposited in NCBI's Gene Expression Omnibus and are accessible through accession
[GEO:GSE27937].
Parasite culture, RNA preparation, and cDNA labeling for microarray
hybridizations {2nd level heading}
A clone of P. falciparum strain 3D7 was cultured using standard methods [72,73] and
total RNA isolated from each sample as described [74]. Total RNA was cleaned up with
an RNeasy column (Qiagen, Valencia, CA, USA {AU query: please state the location
(city, state, country) of this company}) and concentrated in a Microcon YM-30
centrifugal filter (Millipore, Billerica, MA, USA {AU query: please state the location
(city, state, country) of this company}). Total RNA (1 µg) was then subjected to poly-A
selective amplification using Message Amp II (Ambion, Foster City, CA, USA {AU
query: please state the location (city, state, country) of this company}), substituting
biased dNTP/NTP mixes (2A/T/U:1C/G) for the solutions provided. The resulting aRNA
was labeled with Superscript II reverse transcriptase (Invitrogen, Carlsbad, CA, USA
{AU query: please state the location (city, state, country) of this company}) using
random hexamers, and either Cy3- or Cy5-dUTPs (GE Healthcare, Piscataway, NJ, USA
{AU query: please state the location (city, state, country) of this company}) for 2
hours at 42°C following a 10-minute primer annealing step at 65°C. The reaction was

23
concentrated on a Microcon YM-30 column and subjected to array hybridization per
standard NimbleGen protocol.
Data normalization and quality control {2nd level heading}
Raw data from each sample was quantile normalized [75] and log2 transformed prior to
prediction of TARs along the P. falciparum genome. We based our pre-processing
pipeline on established quality control metrics: removal of non-biological variation and a
strong correlation between raw and normalized data [76]. Additional file 15 shows
log2(intensity) distributions of each sample before and after quantile normalization,
log2(intensity) boxplots of each sample after quantile normalization, and all pair-wise
correlation scatterplots of data before and after normalization. Pearson correlation is
equal to 1.0 between raw and normalized data in all matched samples. Additional file 16
shows that, for each sample, we observed only a minimal increase in median intergenic
probe hybridization intensity with number of G+C bases. Given that we make no absolute
or quantitative expression comparisons of transcripts (only relative expression
comparisons of the same transcript across time-points) and we confirm no G+C content
bias in predicted lncRNAs, we deemed this inconsequential. Normalized data were
median centered (at zero) prior to expression profiling and data browsing in Integrated
Genomics Viewer [77].
Detection of TARs from tiling arrays {2nd level heading}
We wrote and implemented an iterative sliding window algorithm to scan each sample’s
normalized probe hybridization intensity values for statistically significant TARs.

24
Specifically, we used a single-step maxT permutation procedure (1,000 permutations) to
transform the mean probe intensity score ‘T’ calculated in each of the approximately
366,000 possible window slides along normalized data into a multiple-hypothesis
adjusted P-value [29-31]. {AU query: preceeding sentence OK as edited? yes} We
then discarded windows with adjusted P-values greater than 0.05 to control the family-
wise error-rate of windows predicted to be significant at 5%. We repeated this procedure
a total of 28 times using window sizes of 5, 10, 15, 20, 25, 30, and 40 probes. Next, we
intersected all significant windows with PlasmoDB v6.5 gene annotations, and merged
overlapping annotated windows to define the boundaries of 1,229 protein-coding TARs
and 8 ribosomal RNA TARs. Similarly, we merged overlapping windows that did not
overlap any known or predicted gene to define the boundaries of 123 un-annotated TARs.
BEDTools v4 was used for all data intersections and unions [78]. Additional file 2 lists
predicted TAR coordinates.
Filtering un-annotated TARs {2nd level heading}
We filtered un-annotated TARs by setting a minimum length criterion of 200 bp and
ensuring no BLASTX predicted coding potential. Out of 123 predicted un-annotated
TARs, 46 were under 200 bp in length (Additional file 5). We retrieved FASTA sequence
for the remaining 77 from PlasmoDB v6.5, and used the NCBI BLASTX web server to
search for any significant protein matches [79]. Default BLASTX settings (BLOSUM62,
word size 3, low complexity filtering, and so on) were used except the Expect threshold
for reporting match significance (that is, coding potential) was set at 0.01. Seventeen
sequences with an Expect score <0.01 were categorized as putative novel P. falciparum
25
genes or pseudogenes and were excluded from further lncRNA characterization
(Additional file 6). We searched both the Swissprot and Non-redundant protein sequence
(nr) databases with the following organism queries: all organisms, Plasmodium,
Plasmodium falciparum, and Plasmodium falciparum strain 3D7.
Gene Ontology term analysis of stage-specific genes {2nd level heading}
Gene Ontology (GO) term analysis of stage-specific genes was performed using GOstat
with default settings [80] and Sanger GeneDB P. falciparum gene annotations. Stage-
specific genes were determined by intersection of PlasmoDB v6.5 gene annotations with
protein-coding transcripts maximally expressed in each time-point. We looked for
overrepresented GO terms in stage-specific genes versus the 1,360 protein-coding genes
covered by the array. Additional file 4 lists all genes covered by the array, stage-specific
genes, and the top four most overrepresented GO terms in each time-point.
Evolutionary sequence conservation {2nd level heading}
FASTA sequence for the 60 putative lncRNAs and 8 ribosomal RNA transcripts was
retrieved from the 3D7 reference sequence (PlasmoDB v7.1). We also downloaded
genomic FASTA sequence from PlasmoDB v7.1 representing all eight sequenced or
partially sequenced Plasmodium species (P. falciparum, P. reichenowi, P. gallinaceum,
P. knowlesi, P. vivax, P. berghei, P. yoelli, and P. chaubadi). We searched for sequence
conservation using BLASTN (WU-BLAST 2.0MP-WashU (4 May 2006)) using the same
low-complexity filtering and context parameters as the PlasmoDB v7.1 BLAST server (-
filter seg -ctxfactor 2.00) and setting the Expect threshold for significance to 0.01. We

26
recorded the lowest BLASTN P-value within each species (Additional file 7, columns s
to z).
The broad conservation of lncRNA-TARE-4L across all eight Plasmodium species was
determined to be significant by null permutations. We chose 600 random intergenic
regions from the 3D7 reference genome (based on v.7.1 annotation). These intergenic
regions were sized to match the length distribution of the 60 putative lncRNAs, and were
included in the WU-BLAST search. Out of 600 random intergenic regions, we found
only 27 to be conserved across all 8 species, yielding an empirical P-value of 0.045.
Expression profiling {2nd level heading}
To profile each predicted TAR, we calculated its expression in each time-point as the
mean hybridization intensity of probes tiling within or up to 25 bp on either side of the
predicted TAR start and stop coordinates. The expression profile of each TAR was then
mean centered across time-points and visualized using a non-hierarchical clustering
dimension reduction algorithm. Specifically, we used non-metric multi-dimensional
scaling (nMDS) as implemented in the R-project ‘NeatMap’ package to order rows and
preserve data topology. In development and validation of the ‘NeatMap’ package,
Rajaram and Oono [81] have similarly applied nMDS to visualize yeast cell cycle
expression data. We point the reader to Figure 1d of Rajaram and Oono [81] and Figure 4
of Taguchi and Oono [82] for examples and thorough discussion of the utility of nMDS
in determining relational patterns of gene expression. Notably, because nMDS is a non-

27
linear numerical optimization technique, multiple ordinations were run to select the
optimal solution.
We conducted a detailed comparison of lncRNA and protein-coding expression, finding
lncRNA candidates to be expressed on par with protein-coding transcripts. Included in
Additional file 3 are additional visualizations of protein-coding transcript versus putative
lncRNA expression, including standard heatmaps and nMDS ordinated heatmaps without
mean centering across time-points. Additional file 3 also provides a histogram of the
maximum expression values for lncRNA candidates and protein-coding transcripts.
Notably, we found 30 lncRNA candidates (50%) to be induced by greater than two-fold
across our time course samples (Additional file 7, column k). By comparison, 309 of
1,229 protein-coding transcripts (25%) match this criterion.
Nearest-neighboring genes {2nd level heading}
Nearest neighboring genes to the set of 60 putative lncRNAs were extracted using the
Cistrome Analysis Pipeline and PlasmoDB v6.5 gene coordinates.
Correlation analysis {2nd level heading}
To infer putative lncRNA splicing or UTR relationships with neighboring coding genes,
we measured the Pearson correlation between putative lncRNA and neighboring coding
gene expression profiles (Additional file 7, column j). We conservatively defined the
neighboring coding gene to be the highest correlated, expressed gene to either side of
each putative lncRNA locus. We also examined a null distribution of correlations from

28
adjacent pairs of coding genes. We found the 60 candidate lncRNAs to be enriched for
high correlation to neighboring genes.40 of these candidates were highly correlated (r >
0.9), whereas only 10 should be highly correlated as demonstrated by our null
distribution (Additional file 9). We then further investigated the expression profiles of
lncRNA candidates with r < 0.9 to ensure correlation values reflected biologically
meaningful variation. We defined biologically meaningful variation as a greater than 0.5-
fold change across time-points.
Mapping of homologous lncRNA-TARE sequences {2nd level heading}
We used the PlasmoDB v6.5 BLASTN web server to record coordinates for homologous
lncRNA-TARE sequences based on the predicted lncRNA-TARE-4L sequence. We then
retrieved FASTA sequence of the most telomere-proximal 50,000 bp on each
chromosome end from PlasmoDB v6.5, and used JDotter [83] software to create DNA
dotplots mapping the telomeric repeats, TAREs 1 through 5, Rep20, and the first
predicted gene on each end. We placed each predicted lncRNA-TARE gene onto the
dotplot maps to confirm that lncRNA-TARE maps to TARE 2 and the sequence between
TARE 2 and TARE 3 on 22 chromosome ends. We then used Geneious to cluster
(ClustalW) and investigate the conservation of lncRNA-TARE sequences.
Parasite culture for qRT-PCR analysis {2nd level heading}
Two independent biological replicate time courses were performed to validate and
investigate lncRNA-TARE expression in more detail. For each time course, a freshly
thawed P. falciparum strain 3D7 clone was cultured using standard methods [72] in

29
human red blood cells at 4% hematocrit. RPMI-HEPES medium was supplemented with
5% human serum (O+) and 5% Albumax II (Invitrogen, Carlsbad, CA, USA {AU query:
please state the location (city, state, country) of this company}). Cultures were
initially synchronized using two 5% sorbitol solution treatments [73] spaced by 16 hours.
To then obtain highly synchronized cultures, newly formed ring-stage parasites were
selected for using 5% sorbitol solution treatments during the subsequent two re-invasion
generations. Highly synchronized cultures were expanded and harvested at stage-specific
time-points. Each harvested culture was centrifuged at 2,400 rpm in a Sorvall RT6000B,
and packed red blood cells lysed using a 0.05% (final concentration) saponin solution.
Liberated parasites were washed using phosphate-buffered saline (pH 7.4), pelleted at
13.2 rpm in a microcentrifuge, resuspended in 1 ml TRIZOL reagent, and stored at -80°C
prior to RNA extraction.
RNA preparation for qRT-PCR and RACE analysis {2nd level heading}
TRIZOL-chloroform extraction was performed and the aqueous layer applied to an
RNeasy column (Qiagen). On-column DNAse digestion was carried out for 30 minutes to
remove genomic DNA. Eluted RNA was also treated with TURBO DNase (Ambion) and
cleaned up on a second RNeasy column (Qiagen) to yield high-purity RNA samples.
qRT-PCR analysis {2nd level heading}
RNA (1 µg) from each time course sample was reverse transcribed using a random
priming strategy (Applied Biosystems cDNA High Capacity Reverse Transcription kit;
Carlsbad, CA, USA {AU query: please state the location (city, state, country) of this

30
company}) along with a minus reverse transcriptase control reaction for each sample to
confirm genomic DNA removal. qPCR reactions were carried out using 800 nM of
primers and Roche FastStart SYBR Green Master mix (Indianapolis, IN, USA {AU
query: please state the location (city, state, country) of this company}). Primer
annealing and extension (55°C/60 seconds) was carried out for 40 cycles on an Applied
Biosystems 7900 instrument.
We used PCR Miner software [84] to calculate both the cycle threshold (Ct) of each
qPCR reaction and the amplification efficiency of each primer pair. We then calculated
the relative expression of each lncRNA-TARE gene in each time course sample by
averaging technical replicates and using the reference gene PF08_0085 and reference
time-point T30 (trophozoite) for normalization. The error of normalized expression ratios
was calculated using the delta method, based on a truncated Taylor series expansion, to
account for technical variability in both the target and reference gene measurements.
Biological replicate experiments were analyzed in isolation and then normalized
expression measurements were averaged. We used a Taylor limited expansion method to
determine how error propagated in the average expression value.
qRT-PCR primer design {2nd level heading}
Primer pairs to amplify predicted lncRNA-TARE genes and the SPE2-binding protein
PfSip2 (PFF0200c) were designed using Premier Biosoft International AlleleID 7.6
software (Palo Alto, CA, USA). {AU query: please state the location (city, state,
country) of this company} AlleleID primer design software carries out highly specific

31
primer design by BLAST searching sequences and masking redundant regions prior to
primer design. We also independently verified primer specificity using BLASTN on the
PlasmoDB v6.5 website, and ensured single amplicon melting curves and no primer
dimer formation. We required primer pair amplification efficiency, as calculated by PCR
Miner software [84], to be at least 90% to ensure reproducible results. We used the
previously described housekeeping gene P08_0085 (ubiquitin conjugating enzyme 1)
[74] to calculate all normalized relative gene expression ratios. lncRNA-TARE and
PfSip2 primer sequences are listed in Additional file 11.
Rapid amplification of cDNA ends {2nd level heading}
We employed RNA ligase-mediated RACE following manufacturer specifications
(Ambion) and using 10 µg of T40 ± 3 hpi RNA mixed 1:1 from two independent time
course extractions. We used Premier Biosoft International AlleleID 7.6 software to
design primers targeting 20 lncRNA-TARE loci (Additional file 11). To map the putative
5’ cap, we used a nested priming strategy with primers spaced roughly 350 bp antisense
to the target sequence. To map 3’ termini, we used a semi-nested priming strategy using a
single antisense primer to the target sequence and nested primers corresponding to the 3’
adapter sequence. Notably, the 5’ RACE outer primer is the reverse complement of the 3’
RACE primer, ensuring capture of contiguous transcripts. Minus reverse transcriptase
control reactions were included for 3’ RACE.
Outer and inner 5’ RACE PCR cycling was performed using SuperTaq Plus polymerase
(Ambion) and the following cycling conditions: 94°C for 3 minutes, 5 cycles of 94°C for

32
30 seconds, 60°C for 30 seconds, 68°C for 3 minutes, 35 cycles of 94°C for 30 seconds,
55°C for 30 seconds, 68°C for 3 minutes, and a final extension for 10 minutes at 68°C. 3’
RACE PCR cycling was analagous except denaturation was performed at 94°C for 15
seconds and extension was performed at 68°C for 8 minutes. PCR products were gel
excised, purified using Qiagen MinElute Gel Extraction Cleanup columns, and cloned
into the pCR-2.1TOPO vector (Invitrogen).
We sequenced 27 and 10 colonies corresponding to 3’ and 5’ RACE products,
respectively, using Genewiz services and Geneious analysis software [85]. A total of 12
different lncRNA-TARE loci were unambiguously represented in sequenced 3’ RACE
products. The original chromosome and syntenic terminus coordinates on the left end of
chromosome 4 for each sequenced RACE product are included in Additional file 12
along with a graphical alignment of each sequenced RACE product to the left end of
chromosome 4 in Additional file 13. RACE products were trimmed to exclude any low-
quality base calls and vector sequence beyond the first four bases prior to alignment.
Abbreviations {1st level heading}
bp, base pair; GO, Gene Ontology; hpi, hours post-erythrocyte invasion; lncRNA, long
non-coding RNA; lncRNA-TARE, long non-coding RNA telomere-associated repetitive
element; lncRNA-TARE-4L, long non-coding RNA telomere-associated repetitive
element on chromosome four left; nMDS, non-metric multi-dimensional scaling; PCR,
polymerase chain reaction; PfSip2, P. falciparum SPE2-interacting protein; qRT-PCR,
quantitative real-time PCR; RACE, rapid amplification of cDNA ends; SPE2,

33
subtelomeric var gene promoter element 2; TAR, transcriptionally active region; TARE,
telomere-associated repetitive element; TERRA, telomeric repeat-containing RNA; upsB,
upstream sequence type B; UTR, untranslated region.
Authors' contributions {1st level heading}
JR and PS conceived of the study and participated in its design, coordination, and
interpretation. DP carried out the computational design of arrays. JS harvested and
extracted samples for arrays, and KB harvested and extracted samples for qRT-PCR and
RACE. AW performed sample labeling and array hybridizations. KB analyzed raw and
normalized data and wrote/implemented the sliding-window TAR detection algorithm.
KB and DP analyzed predicted TARs to assess biological validity and filter for lncRNA
candidates. KB and DP characterized putative lncRNAs, and KB designed/performed
qRT-PCR and RACE analysis. DW, MD, SV, DVT, and UR contributed to the
acquisition and interpretation of data. KB wrote the manuscript, JR and PS critically
revised the manuscript, and all authors have read and given approval of the version to be
published.
Acknowledgements {1st level heading}
We would like to thank M Koziol and D Shechner of the Broad Institute and Harvard
University for experimental assistance and for Figure 3b illustration support, respectively.
We would also like to thank members of the Broad Institute-Harvard Malaria Initiative
for helpful feedback throughout. This work was supported by grants from the Gates
Foundation and the National Institutes of Health Director’s New Innovator Awards

34
(1DP2OD00667-01). PCS is a Packard and Burroughs Wellcome fellow. JLR is a Damon
Runyon-Rachleff, Searle, Smith Family and Merkin Fellow. KB and DP are National
Science Foundation Graduate Research Fellows.
References {1st level heading}
1. Coleman BI, Duraisingh MT: Transcriptional control and gene silencing in
Plasmodium falciparum. Cell Microbiol 2008, 10:1935-1946.
2. Horrocks P, Wong E, Russell K, Emes RD: Control of gene expression in
Plasmodium falciparum - Ten years on. Mol Biochem Parasitol 2009, 164:9-25.
3. Bozdech Z, Llinas M, Pulliam BL, Wong ED, Zhu JC, DeRisi JL: The
transcriptome of the intraerythrocytic developmental cycle of Plasmodium
falciparum. Plos Biol 2003, 1:85-100.
4. Le Roch KG, Zhou YY, Blair PL, Grainger M, Moch JK, Haynes JD, De la Vega
P, Holder AA, Batalov S, Carucci DJ, Winzeler EA: Discovery of gene function
by expression profiling of the malaria parasite life cycle. Science 2003,
301:1503-1508.
5. Otto TD, Wilinski D, Assefa S, Keane TM, Sarry LR, Bohme U, Lemieux J,
Barrell B, Pain A, Berriman M, Newbold C, Llinas M: New insights into the
blood-stage transcriptome of Plasmodium falciparum using RNA-Seq. Mol
Microbiol 2010, 76:12-24.
6. Scherf A, Lopez-Rubio JJ, Riviere L: Antigenic variation in Plasmodium
falciparum. Annu Rev Microbiol 2008, 62:445-470.

35
7. Baum J, Papenfuss AT, Mair GR, Janse CJ, Vlachou D, Waters AP, Cowman AF,
Crabb BS, de Koning-Ward TF: Molecular genetics and comparative genomics
reveal RNAi is not functional in malaria parasites. Nucleic Acids Res 2009,
37:3788-3798.
8. Cui L, Miao J: Chromatin-mediated epigenetic regulation in the malaria
parasite Plasmodium falciparum. Eukaryot Cell 2010, 9:1138-1149.
9. Balaji S, Babu MM, Iyer LM, Aravind L: Discovery of the principal specific
transcription factors of Apicomplexa and their implication for the evolution
of the AP2-integrase DNA binding domains. Nucleic Acids Res 2005, 33:3994-
4006.
10. Campbell TL, De Silva EK, Olszewski KL, Elemento O, Llinas M: Identification
and genome-wide prediction of DNA binding specificities for the ApiAP2
family of regulators from the malaria parasite. PLoS Pathog 2010,
6:e1001165.
11. Chaal BK, Gupta AP, Wastuwidyaningtyas BD, Luah YH, Bozdech Z: Histone
deacetylases play a major role in the transcriptional regulation of the
Plasmodium falciparum life cycle. Plos Pathogens 2010, 6: e1000737.
12. Merrick CJ, Duraisingh MT: Epigenetics in Plasmodium: what do we really
know? Eukaryot Cell 2010, 9:1150-1158.
13. Coulson RM, Hall N, Ouzounis CA: Comparative genomics of transcriptional
control in the human malaria parasite Plasmodium falciparum. Genome Res
2004, 14:1548-1554.

36
14. Rinn JL, Kertesz M, Wang JK, Squazzo SL, Xu X, Brugmann SA, Goodnough
LH, Helms JA, Farnham PJ, Segal E, Chang HY: Functional demarcation of
active and silent chromatin domains in human HOX loci by noncoding
RNAs. Cell 2007, 129:1311-1323.
15. Corcoran AE: The epigenetic role of non-coding RNA transcription and
nuclear organization in immunoglobulin repertoire generation. Semin
Immunol 2010, 22:353-361.
16. Gupta RA, Shah N, Wang KC, Kim J, Horlings HM, Wong DJ, Tsai MC, Hung
T, Argani P, Rinn JL, Wang Y, Brzoska P, Kong B, Li R, West RB, van de
Vijver, MJ, Sukumar S, Chang HY: Long non-coding RNA HOTAIR
reprograms chromatin state to promote cancer metastasis. Nature 2010,
464:1071-1076.
17. Pandey RR, Mondal T, Mohammad F, Enroth S, Redrup L, Komorowski J,
Nagano T, Mancini-DiNardo D, Kanduri C: Kcnq1ot1 antisense noncoding
RNA Mediates lineage-specific transcriptional silencing through chromatin-
level regulation. Mol Cell 2008, 32:232-246.
18. Brockdorff N, Ashworth A, Kay GF, Mccabe VM, Norris DP, Cooper PJ, Swift S,
Rastan S: The product of the mouse Xist gene is a 15 kb inactive X-specific
transcript containing no conserved ORF and located in the nucleus. Cell
1992, 71:515-526.
19. Lee JT: Lessons from X-chromosome inactivation: long ncRNA as guides and
tethers to the epigenome. Genes Dev 2009, 23:1831-1842.

37
20. Schoeftner S, Blasco MA: Developmentally regulated transcription of
mammalian telomeres by DNA-dependent RNA polymerase II. Nat Cell Biol
2008, 10:228-236.
21. Schoeftner S, Blasco MA: Chromatin regulation and non-coding RNAs at
mammalian telomeres. Semin Cell Dev Biol 2010, 21:186-193.
22. Feuerhahn S, Iglesias N, Panza A, Porro A, Lingner J: TERRA biogenesis,
turnover and implications for function. FEBS Lett 2010, 584:3812-3818.
23. Redon S, Reichenbach P, Lingner J: The non-coding RNA TERRA is a natural
ligand and direct inhibitor of human telomerase. Nucleic Acids Res 2010,
38:5797-5806.
24. Azzalin CM, Reichenbach P, Khoriauli L, Giulotto E, Lingner J: Telomeric
repeat containing RNA and RNA surveillance factors at mammalian
chromosome ends. Science 2007, 318:798-801.
25. Deng Z, Norseen J, Wiedmer A, Riethman H, Lieberman PM: TERRA RNA
binding to TRF2 facilitates heterochromatin formation and ORC
recruitment at telomeres. Mol Cell 2009, 35:403-413.
26. Raabe CA, Sanchez CP, Randau G, Robeck T, Skryabin BV, Chinni SV, Kube M,
Reinhardt R, Ng GH, Manickam R, Kuryshev VY, Lanzer M, Brosius J, Tang
TH, Rozhdestvensky TS: A global view of the nonprotein-coding
transcriptome in Plasmodium falciparum. Nucleic Acids Res 2010, 38:608-617.
27. Goldberg DE, Cowman AF: Moving in and renovating: exporting proteins
from Plasmodium into host erythrocytes. Nat Rev Microbiol 2010, 8:617-621.

38
28. Maier AG, Cooke BM, Cowman AF, Tilley L: Malaria parasite proteins that
remodel the host erythrocyte. Nat Rev Microbiol 2009, 7:341-354.
29. Guttman M, Amit I, Garber M, French C, Lin MF, Feldser D, Huarte M, Zuk O,
Carey BW, Cassady JP, Cabili MN, Jaenisch R, Mikkelsen TS, Jacks T, Hacohen
N, Bernstein BE, Kellis M, Regev A, Rinn JL, Lander ES: Chromatin signature
reveals over a thousand highly conserved large non-coding RNAs in
mammals. Nature 2009, 458:223-227.
30. Guttman M, Mies C, Dudycz-Sulicz K, Diskin SJ, Baldwin DA, Stoeckert CJ, Jr.,
Grant GR: Assessing the significance of conserved genomic aberrations using
high resolution genomic microarrays. PLoS Genet 2007, 3:e143.
31. Dudoit S, Shaffer JP, Boldrick JC: Multiple hypothesis testing in microarray
experiments. Stat Sci 2003, 18:71-103.
32. Chakrabarti K, Pearson M, Grate L, Sterne-Weiler T, Deans J, Donohue JP, Ares
M, Jr.: Structural RNAs of known and unknown function identified in
malaria parasites by comparative genomics and RNA analysis. RNA 2007,
13:1923-1939.
33. Upadhyay R, Bawankar P, Malhotra D, Patankar S: A screen for conserved
sequences with biased base composition identifies noncoding RNAs in the A-
T rich genome of Plasmodium falciparum. Mol Biochem Parasitol 2005,
144:149-158.
34. Gardner MJ, Hall N, Fung E, White O, Berriman M, Hyman RW, Carlton JM,
Pain A, Nelson KE, Bowman S, Paulsen IT, James K, Eisen JA, Rutherford K,
Salzberg SL, Craig A, Kyes S, Chan MS, Nene V, Shallom SJ, Suh B, Peterson J,

39
Angiuoli S, Pertea M, Allen J, Selengut J, Haft D, Mather MW, Vaidya AB,
Martin DM, et al.: Genome sequence of the human malaria parasite
Plasmodium falciparum. Nature 2002, 419:498-511.
35. Mattick JS: The genetic signatures of noncoding RNAs. PLoS Genet 2009,
5:e1000459.
36. Koziol MJ, Rinn JL: RNA traffic control of chromatin complexes. Curr Opin
Genet Dev 2010, 20:142-148.
37. Orom UA, Derrien T, Beringer M, Gumireddy K, Gardini A, Bussotti G, Lai F,
Zytnicki M, Notredame C, Huang Q, Guigo R, Shiekhattar R: Long noncoding
RNAs with enhancer-like function in human cells. Cell 2010, 143:46-58.
38. Epp C, Li F, Howitt CA, Chookajorn T, Deitsch KW: Chromatin associated
sense and antisense noncoding RNAs are transcribed from the var gene
family of virulence genes of the malaria parasite Plasmodium falciparum.
RNA 2009, 15:116-127.
39. Deitsch KW, del Pinal A, Wellems TE: Intra-cluster recombination and var
transcription switches in the antigenic variation of Plasmodium falciparum.
Mol Biochem Parasitol 1999, 101:107-116.
40. Figueiredo L, Scherf A: Plasmodium telomeres and telomerase: the usual
actors in an unusual scenario. Chromosome Res 2005, 13:517-524.
41. Scherf A, Figueiredo LM, Freitas-Junior LH: Plasmodium telomeres: a
pathogen's perspective. Curr Opin Microbiol 2001, 4:409-414.

40
42. Lavstsen T, Salanti A, Jensen AT, Arnot DE, Theander TG: Sub-grouping of
Plasmodium falciparum 3D7 var genes based on sequence analysis of coding
and non-coding regions. Malaria J 2003, 2:27.
43. Esumi S, Kaneko R, Kawamura Y, Yagi T: Split single-cell RT-PCR analysis of
Purkinje cells. Nat Protoc 2006, 1:2143-2151.
44. Flueck C, Bartfai R, Niederwieser I, Witmer K, Alako BT, Moes S, Bozdech Z,
Jenoe P, Stunnenberg HG, Voss TS: A major role for the Plasmodium
falciparum ApiAP2 protein PfSIP2 in chromosome end biology. PLoS Pathog
2010, 6:e1000784.
45. Painter HJ, Campbell TL, Llinas M: The Apicomplexan AP2 family: integral
factors regulating Plasmodium development. Mol Biochem Parasitol 2011,
176:1-7.
46. De Silva EK, Gehrke AR, Olszewski K, Leon I, Chahal JS, Bulyk ML, Llinas M:
Specific DNA-binding by apicomplexan AP2 transcription factors. Proc Natl
Acad Sci U S A 2008, 105:8393-8398.
47. Voss TS, Kaestli M, Vogel D, Bopp S, Beck HP: Identification of nuclear
proteins that interact differentially with Plasmodium falciparum var gene
promoters. Mol Microbiol 2003, 48:1593-1607.
48. Bond AM, Vangompel MJ, Sametsky EA, Clark MF, Savage JC, Disterhoft JF,
Kohtz JD: Balanced gene regulation by an embryonic brain ncRNA is critical
for adult hippocampal GABA circuitry. Nat Neurosci 2009, 12:1020-1027.

41
49. Kino T, Hurt DE, Ichijo T, Nader N, Chrousos GP: Noncoding RNA gas5 is a
growth arrest- and starvation-associated repressor of the glucocorticoid
receptor. Science Signaling 2010, 3:ra8.
50. Duraisingh MT, Voss TS, Marty AJ, Duffy MF, Good RT, Thompson JK, Freitas-
Junior LH, Scherf A, Crabb BS, Cowman AF: Heterochromatin silencing and
locus repositioning linked to regulation of virulence genes in Plasmodium
falciparum. Cell 2005, 121:13-24.
51. Dzikowski R, Deitsch KW: Genetics of antigenic variation in Plasmodium
falciparum. Curr Genet 2009, 55:103-110.
52. Dzikowski R, Li F, Amulic B, Eisberg A, Frank M, Patel S, Wellems TE, Deitsch
KW: Mechanisms underlying mutually exclusive expression of virulence
genes by malaria parasites. EMBO Rep 2007, 8:959-965.
53. Scherf A, Riviere L, Lopez-Rubio JJ: SnapShot: var gene expression in the
malaria parasite. Cell 2008, 134:190-U112.
54. Freitas-Junior LH, Hernandez-Rivas R, Ralph SA, Montiel-Condado D,
Ruvalcaba-Salazar OK, Rojas-Meza AP, Mancio-Silva L, Leal-Silvestre RJ,
Gontijo AM, Shorte S, Scherf A: Telomeric heterochromatin propagation and
histone acetylation control mutually exclusive expression of antigenic
variation genes in malaria parasites. Cell 2005, 121:25-36.
55. Voss TS, Tonkin CJ, Marty AJ, Thompson JK, Healer J, Crabb BS, Cowman AF:
Alterations in local chromatin environment are involved in silencing and
activation of subtelomeric var genes in Plasmodium falciparum. Mol Microbiol
2007, 66:139-150.

42
56. Bernstein E, Allis CD: RNA meets chromatin. Genes Dev 2005, 19:1635-1655.
57. Nagano T, Fraser P: Emerging similarities in epigenetic gene silencing by long
noncoding RNAs. Mamm Genome 2009, 20:557-562.
58. Tsai MC, Manor O, Wan Y, Mosammaparast N, Wang JK, Lan F, Shi Y, Segal E,
Chang HY: Long noncoding RNA as modular scaffold of histone modification
complexes. Science 2010, 329:689-693.
59. Su XZ, Heatwole VM, Wertheimer SP, Guinet F, Herrfeldt JA, Peterson DS,
Ravetch JA, Wellems TE: The large diverse gene family var encodes proteins
involved in cytoadherence and antigenic variation of Plasmodium falciparum-
infected erythrocytes. Cell 1995, 82:89-100.
60. Ralph SA, Bischoff E, Mattei D, Sismeiro O, Dillies MA, Guigon G, Coppee JY,
David PH, Scherf A: Transcriptome analysis of antigenic variation in
Plasmodium falciparum--var silencing is not dependent on antisense RNA.
Genome Biol 2005, 6:R93.
61. Deng Z, Campbell AE, Lieberman PM: TERRA, CpG methylation and
telomere heterochromatin: lessons from ICF syndrome cells. Cell Cycle 2010,
9:69-74.
62. Horard B, Gilson E: Telomeric RNA enters the game. Nat Cell Biol 2008,
10:113-115.
63. Xu Y, Suzuki Y, Ito K, Komiyama M: Telomeric repeat-containing RNA
structure in living cells. Proc Natl Acad Sci U S A 2010, 107:14579-14584.
64. Luke B, Lingner J: TERRA: telomeric repeat-containing RNA. EMBO J 2009,
28:2503-2510.
43
65. Caslini C, Connelly JA, Serna A, Broccoli D, Hess JL: MLL associates with
telomeres and regulates telomeric repeat-containing RNA transcription. Mol
Cell Biol 2009, 29:4519-4526.
66. Luke B, Panza A, Redon S, Iglesias N, Li Z, Lingner J: The Rat1p 5' to 3'
exonuclease degrades telomeric repeat-containing RNA and promotes
telomere elongation in Saccharomyces cerevisiae. Mol Cell 2008, 32:465-477.
67. Ponts N, Harris EY, Prudhomme J, Wick I, Eckhardt-Ludka C, Hicks GR,
Hardiman G, Lonardi S, Le Roch KG: Nucleosome landscape and control of
transcription in the human malaria parasite. Genome Res 2010, 20:228-238.
68. Westenberger SJ, Cui L, Dharia N, Winzeler E: Genome-wide nucleosome
mapping of Plasmodium falciparum reveals histone-rich coding and histone-
poor intergenic regions and chromatin remodeling of core and subtelomeric
genes. BMC Genomics 2009, 10:610.
69. Porro A, Feuerhahn S, Reichenbach P, Lingner J: Molecular dissection of
telomeric repeat-containing RNA biogenesis unveils the presence of distinct
and multiple regulatory pathways. Mol Cell Biol 2010, 30:4808-4817.
70. Ning Z, Cox AJ, Mullikin JC: SSAHA: a fast search method for large DNA
databases. Genome Res 2001, 11:1725-1729.
71. Morgulis A, Gertz EM, Schaffer AA, Agarwala R: WindowMasker: window-
based masker for sequenced genomes. Bioinformatics 2006, 22:134-141.
72. Trager W, Jensen JB: Human malaria parasites in continuous culture. Science
1976, 193:673-675.

44
73. Lambros C, Vanderberg JP: Synchronization of Plasmodium falciparum
erythrocytic stages in culture. J Parasitol 1979, 65:418-420.
74. Sims JS, Militello KT, Sims PA, Patel VP, Kasper JM, Wirth DF: Patterns of
gene-specific and total transcriptional activity during the Plasmodium
falciparum intraerythrocytic developmental cycle. Eukaryot Cell 2009, 8:327-
338.
75. Bolstad BM, Irizarry RA, Astrand M, Speed TP: A comparison of normalization
methods for high density oligonucleotide array data based on variance and
bias. Bioinformatics 2003, 19:185-193.
76. Thomassen GO, Rowe AD, Lagesen K, Lindvall JM, Rognes T: Custom design
and analysis of high-density oligonucleotide bacterial tiling microarrays.
PLoS One 2009, 4:e5943.
77. Robinson JT, Thorvaldsdottir H, Winckler W, Guttman M, Lander ES, Getz G,
Mesirov JP: Integrative genomics viewer. Nat Biotechnol 2011, 29:24-26.
78. Quinlan AR, Hall IM: BEDTools: a flexible suite of utilities for comparing
genomic features. Bioinformatics 2010, 26:841-842.
79. Gish W, States DJ: Identification of protein coding regions by database
similarity search. Nat Genet 1993, 3:266-272.
80. Beissbarth T, Speed TP: GOstat: find statistically overrepresented Gene
Ontologies within a group of genes. Bioinformatics 2004, 20:1464-1465.
81. Rajaram S, Oono Y: NeatMap--non-clustering heat map alternatives in R.
BMC Bioinformatics 2010, 11:45.

45
82. Taguchi YH, Oono Y: Relational patterns of gene expression via non-metric
multidimensional scaling analysis. Bioinformatics 2005, 21:730-740.
83. Brodie R, Roper RL, Upton C: JDotter: a Java interface to multiple dotplots
generated by dotter. Bioinformatics 2004, 20:279-281.
84. Zhao S, Fernald RD: Comprehensive algorithm for quantitative real-time
polymerase chain reaction. J Comput Biol 2005, 12:1047-1064.
85. Drummond AJ, Ashton B, Buxton S, Cheung M, Heled J, Kearse M, Moir R,
Stones-Havas S, Thierer T, Wilson A: Geneious v5.1
[http://www.geneious.com/default,28,downloads.sm] {AU query: URL OK?
yes}
86. Escalante AA, Ayala FJ: Phylogeny of the malarial genus Plasmodium, derived
from rRNA gene sequences. Proc Natl Acad Sci U S A 1994, 91:11373-11377.

46
{Figure legends}
{AU QUERY: Please ensure that all figure titles are 15 words or less. Any
additional information should be placed in the figure legend.}
Figure 1. Global transcriptional profiling reveals 60 putative P. falciparum long
non-coding RNAs under developmental regulation. (a) We identified 1,360 TARs
along the P. falciparum genome, of which 1,229, 8, and 123 predicted transcripts exhibit
overlap with known protein-coding genes, ribosomal RNA genes, and un-annotated
intergenic regions, respectively. Further filtering of un-annotated transcripts for putative
lncRNAs eliminated 46 putative small RNAs and 17 putative novel protein-coding genes
or pseudogenes, leaving a set of 60 putative lncRNAs for additional characterization.
(b,d) Protein-coding and putative lncRNA transcripts follow the global expression
cascade expected during the P. falciparum intraerythrocytic developmental cycle. The
mean log2 probe hybridization for each transcript is plotted from time-points T18, T24,
T30, and T36 ±3 hpi corresponding to the ring, ring/trophozoite, trophozoite, and
trophozoite/schizont intraerythrocytic stages of parasite growth (pictured below each
column). Rows are mean centered. (c,e) Housekeeping gene seryl-tRNA synthetase
(PF07_0073), early stage marker (PFD0020c), and late stage marker (PFB0275w) exhibit
expected differential expression patterns. Examples of putative lncRNAs are also shown,
including lncRNA-TARE-4L (***). Positive probe hybridization intensities are plotted
from each sample after quantile normalization, log2 transformation, and median
centering.

47
Figure 2. Additional characterization of putative lncRNAs highlights the striking
properties of a telomere-associated lncRNA. (a) Guanine-cytosine (G+C) content
comparison between predicted non-coding and protein-coding transcripts shows that non-
coding G+C content is typically lower than coding transcript G+C content. lncRNA-
TARE-4L (highlighted in red and indicated by arrow) and ribosomal RNAs (indicated by
asterisks) have high G+C content. (b) The sequence of eight functional rRNAs is broadly
conserved across Plasmodium species. The sequence of 19 putative lncRNAs is also
significantly conserved in at least one other species (BLASTN P-value <0.01),
suggesting a preserved functional role. lncRNA-TARE-4L is strongly conserved across
all eight species analyzed. Such a broad level of conservation is rarely seen in randomly
sampled intergenic regions from P. falciparum (P-value = 0.045). Rows are ordered by
number of species with BLASTN hits (P-value <0.01), and then by strength of hits
(defined by the product of P-values). Species are clustered based on the phylogeny
proposed by Escalante and Alaya [86]. BLAST, basic local alignment and search tool.
Figure 3. The telomere-associated lncRNA-TARE family neighbors upsB-type var
loci and is coordinately expressed during parasite schizogony. (a) Dot plot analysis of
the first 50,000 bp on chromosome 4 pinpoints lncRNA-TARE-4L in the TARE 2-3
region between the telomere (Tel) and a silenced upsB-type var virulence gene. (b)
Subtelomeric features are diagrammed on the 11 chromosomes (Chr) from which we
were able to specifically amplify lncRNA-TARE sequence. Features are not to scale, and
grayed out chromosome ends were not probed. Notably, an upsB-type var gene (orange)
is located adjacent to each predicted lncRNA-TARE gene (red). Furthermore, qRT-PCR

48
amplification of 15 distinct lncRNA-TARE genes shows a coordinated pattern of late
stage expression. lncRNA-TARE relative expression is plotted in time-points T20, T30,
and T40 ±3 hpi with respect to T30. Error bars represent the propagated standard error of
the mean (pSEM) from two biological replicate experiments. Housekeeping gene
PF08_0085 was used as the reference gene.
Figure 4. RACE suggests two long telomere-associated transcripts are transcribed
in the TARE 2-3 region. 3’ RACE products of seven distinct lncRNA-TARE sequences
terminated at a precise syntenic site on either side of TARE 2 (asterisks). Taken together
with the 5’ RACE product suggests two species approximately 1.5 kb and 3.1 kb in
length are transcribed towards the telomeres from the TARE 3 boundary. Genome-wide,
the palindromic SPE2 DNA motif (green triangles) is enriched only in the TARE 2-3
region from which lncRNA-TARE is transcribed and in the upstream promoter element
of upsB-type var genes. Primers are depicted as black triangles and numbers represent
base-pair coordinates corresponding to the left end of chromosome 4. SPE2, subtelomeric
var gene promoter element 2.
Figure 5. Potential models for lncRNA-TARE at P. falciparum chromosome ends.
Model 1: PfSip2 binding at SPE2 sites induces lncRNA-TARE transcription and/or vice
versa. Model 2: lncRNA-TARE guides multiple copies of PfSip2 to chromosome ends.
Model 3: lncRNA-TARE recruits chromatin-remodeling factors to initiate post-S-phase
silencing chromatin memory marks at upsB-type var loci. Model 4: lncRNA-TARE

49
facilitates telomeric heterochromatin assembly and/or interacts with telomere-associated
proteins. POL II, RNA polymerase II; TXN, transcription factor.

50
Additional files
Additional file 1: DNA tiling array genome coverage. Number of probes per 10 kb
plotted by genomic position.
Additional file 2: All TARs. Chromosome, coordinates, and expression profile for all
1,360 TARs identified along the P. falciparum genome.
Additional file 3: Comparison of lncRNA and protein-coding expression. A figure
providing a detailed comparison of lncRNA and protein-coding expression. Standard
heatmaps and non-metric multi-dimensional scaling ordinated heatmaps of lncRNA and
protein-coding transcript expression profiles without mean centering across time-points.
Maximum expression value histogram for lncRNAs versus protein-coding transcripts.
Additional file 4: Stage-specific Gene Ontology analysis. All genes represented on the
array, stage-specific genes, and the top four over-represented Gene Ontology terms in
each time-point.
Additional file 5: Putative small RNAs. Chromosome, coordinates, and length of 46
putative small RNAs eliminated from the lncRNA candidate list.

51
Additional file 6: Putative genes or pseudogenes. Chromosome, coordinates, length,
and BLASTX results for 17 putative genes or pseudogenes eliminated from the lncRNA
candidate list.
Additional file 7: Putative lncRNAs. A table of 60 putative P. falciparum lncRNAs and
their properties. Characteristics of 60 P. falciparum lncRNA candidates.
Additional file 8: Neighboring genes. Nearest gene to each side of lncRNA candidates
and gene descriptions.
Additional file 9: Correlation analysis. Distribution of expression correlations between
putative lncRNAs and neighboring coding genes as compared to the null model of
adjacent pairs of coding genes.
Additional file 10: lncRNA-TARE homology and SPE2 sites. A figure providing
various characterizations of homologous lncRNA-TARE loci. Plot of consensus identity,
location of conserved SPE2 transcription factor binding sites, and an un-rooted clustering
of lncRNA-TARE loci.
Additional file 11: qRT-PCR and RACE primers. A table of primer sequences used in
this study. Gene-specific lncRNA-TARE/PfSip2 (PFF0200c) qRT-PCR primer sequences
and family-specific lncRNA-TARE RACE primer sequences.

52
Additional file 12: RACE syntenic transcript coordinates. Original chromosome and
syntenic coordinates on the left end of chromosome 4 for each sequenced RACE product.
Additional file 13: RACE sequencing alignments. Graphical alignments of each
sequenced RACE product to the left end of chromosome 4.
Additional file 14: PfSip2 and lncRNA-TARE-4L co-expression. qRT-PCR
investigation of the lncRNA-TARE-4L versus PfSip2 locus in trophozoite and schizont
stage samples.
Additional file 15: Raw and normalized data assessment. Probe hybridization
intensity distributions and correlation scatterplots for each sample before and after
quantile normalization.
Additional file 16: Probe hybridization intensity versus G+C content. Boxplots of
intergenic probe hybridization intensities for each sample. Probes are grouped according
to number of G+C bases.

1360 identified TARs
8 ribosomal RNA transcripts (2 genes)
123 un-annotated transcripts
46 putative small RNAs
17 putative novel protein-coding genes
or pseudo-genes
60 putative long non-coding RNAs
Additional characterization
T18 T24 T30 T36
T18 T24 T30 T36
0
6
0
6
0
6
0
6
T18
T24
T30
T36
PF07_0073
1620 bp
PFD0020c
11306 bp
PFB0275w
1698 bp
0
6
0
6
0
6
0
6
T18
T24
T30
T36
lncRNAcandidate
1139 bp
lncRNAcandidate
804 bp
lncRNAcandidate
3753 bp******
(b)(a) (c)
(d) (e)77
1229 protein-coding transcripts (872 genes)
1229 protein-coding transcripts (872 genes)
−2−1012
−2−1012
red blood cellparasite
parasite DNA

(b)
(a)
G+C content
non-coding transcripts
protein-coding transcriptsde
nsity
10% 20% 30% 40%0%
5
15
0
10
20
******
**
puta
tive
lncR
NA
srR
NA
rRN
A
lncRNA-TARE-4L
P.falci
paru
m
P.reich
enow
i
P.gall
inace
um
P.know
lesi
P.viva
x
P.ber
ghei
P.yoeli
i
P.chab
audi
BLASTN -log10(p-value)
51015202530
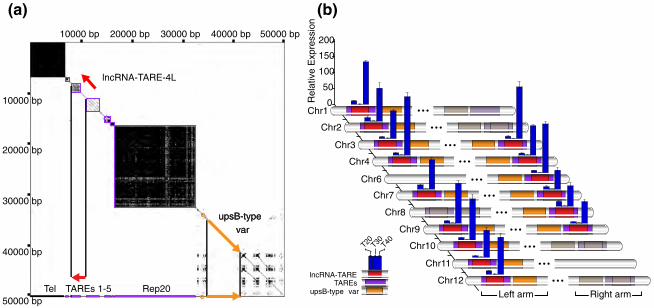
0
50
100
150
200
Chr1
Chr2
Chr3
Chr4
Chr6
Chr7
Chr8
Chr9
Chr10
Chr11
Chr12
Rel
ativ
e E
xpre
ssio
n
upsB-type varTAREs
lncRNA-TARE
T30T20 T40
Left arm Right armTel Rep20
.
10000 bp 20000 bp 30000 bp 40000 bp 50000 bp
10000 bp
20000 bp
30000 bp
40000 bp
50000 bp
lncRNA-TARE-4L
upsB-type var
upsB-type var
.TAREs 1-5
(a) (b)

6,000 6,500 7,000 7,500 8,000 8,500 9,000 9,500 10,000 10,500 11,000 11,500
telomere TARE 3TARE 2TARE 1
12,000
predicted transcript
lncRNA-TARE-4L
lncRNA-TARE-4L
predicted SPE2 sites
syntenic 5’ RACE products
11278
9821
syntenic 3’ RACE products
8221
***
****
***
****

2
34
TXNPfSip2
TXNPfSip2
POL II
TXNPfSip2
?
?
lncRNA-TARE
Protein-X?
?
Protein-X
upsB-type var
?
Protein-X
?
1
Protein-X
Protein-X
lncRNA-TARE lncRNA-TARE
telomerelncRNA-TARE gene
...
telomere replication, repair, segregation, structural maintenance TXN
PfSip2
Protein-X
?
silencing chromatin memory marks
telomeric heterochromatin assembly