Embed Size (px)
Citation preview

A Guide to Developing aPedestrian Safety Action Plan
An Arizona Supplement to the
National “How to Develop a Pedestrian Safety Action Plan”
Arizona Department of TransportationHighway Enhancements for Safety (HES)
April 9, 2007


i
A Guide to Developing a Pedestrian Safety Action Plan: An Arizona Supplement to the
National “How to Develop a Pedestrian Safety Action Plan”
EXECUTIVE SUMMARY
INTRODUCTION Arizona ranked fifth in the nation in pedestrian fatality rates per 100,000 population in 2005. The Federal Highway Administration (FHWA) offered Arizona the opportunity to be one of the thirteen focus states receiving federal assistance to develop a Statewide Pedestrian Safety Action Plan (PSAP). The Arizona Department of Transportation (ADOT) is leading the initiative in coordination with FHWA Arizona Division Office and the Arizona Governor’s Office of Highway Safety (GOHS). All Metropolitan Planning Organizations (MPO), Council of Governments (COG) and selected cities were invited to participate. The City of Phoenix, one of five focus cities identified by FHWA based on pedestrian fatalities, has actively participated from the beginning; Phoenix has completed a draft PSAP. TIMELINE The following timeline was developed in early 2006 following an FHWA workshop on “How to Develop a Pedestrian Safety Action Plan”.
Description Date Status/Outcome
Introductory Meeting December 04 Formed a Pedestrian Safety
Group
Arizona Supplement to the
national How to Develop a
Pedestrian Safety Action Plan
May 06 - Present Reviewed by FHWA in
February 2007 and finalized
for distribution March 07
National Pedestrian Safety Focus
States/Cities Meeting
October 05 Five representatives from
Arizona participated
Workshop on How to Develop a
Pedestrian Safety Action Plan
January 06 Two workshops at Phoenix
and Tucson with 90
participants
Workshop on Designing
Accessible Pedestrian Facilities
October 06 Phoenix workshop with 40
participants
Workshop on Designing Streets
for Pedestrian Safety
February 07 Two workshops at Phoenix
and Flagstaff with 70
participants
ADOT PSAP October 07 Funding expected FY 08 and
RFP under preparation
Phoenix PSAP March 07 Draft in review by the City
Council

ii
ACCOMPLISHMENTS
• Formed a statewide pedestrian safety group • Hosted three pedestrian-related workshops sponsored by FHWA • Developed the Arizona supplement to the National “How to Develop a Pedestrian
Safety Action Plan” ACTION ITEMS
• April 07: Distribute the Arizona supplement to the National How-to-Guide • April 07 – September 07: Develop scope of work and RFP for ADOT PSAP • October 07 – August 08: Develop ADOT PSAP • Ongoing: Provide technical assistance and guidance to local jurisdictions • Ongoing: Include local agency action plans into the overall statewide plan • Annually: Evaluate the ADOT and statewide PSAP performance

1
BACKGROUND
The commitment to safety for all modes of transportation should be one of the top priorities of Arizona agencies and local governments. This guidebook provides the framework to effectively improve pedestrian safety in your community. Since enactment of the Intermodal Surface Transportation Efficiency Act (ISTEA) in 1991, all modes of transportation must be considered for inclusion. With more pedestrian accommodations being built into the system, it is vital that due consideration is made for pedestrian safety. If pedestrian safety is already a priority, this guide will assist in creating a Pedestrian Safety Action Plan (PSAP). An action plan facilitates the following:
• Inclusion of pedestrian safety into project development • Development of public awareness and education campaigns • Increased pedestrian-safety project funding and construction
Each year there are approximately 4,600 pedestrian deaths on our nation’s roadways; this is about 11 percent of all traffic fatalities (1). This percentage is typically much higher in urban areas, accounting for 25 to 40 percent of all traffic fatalities (2). Another 70,000 pedestrians are injured in roadway crashes annually (1). Over the last three years (2003-2005), Arizona experienced an annual average of 142 pedestrian fatalities and 1,524 pedestrian injuries. The State’s average pedestrian fatality rate was 2.64 per 100,000 population; the national average was 1.65 per 100,000 population in 2005. Arizona ranks fifth in the nation in pedestrian fatality rates per 100,000 population (3). The Federal Highway Administration (FHWA) established a goal in 2003 of reducing pedestrian fatalities and injuries by 10 percent by the year 2008, which would amount to 465 lives saved (4). The following graph shows pedestrian fatalities decreasing nationally from 2001 through 2004, but rising again from 2004 to 2005.
Pedestrian Fatalities in the Nation
4600
4650
4700
4750
4800
4850
4900
4950
5000
2001 2002 2003 2004 2005
Year

2
In Arizona the trend is similar and Pedestrian Safety Action Plans are a way to reverse this trend locally and statewide.
Pedestrian Fatalities in Arizona
80
100
120
140
160
180
2001 2002 2003 2004 2005
Year
The national goal of reducing pedestrian fatalities prompted FHWA to identify states and metropolitan areas with above-average crash statistics. States with more than 150 fatalities or with a pedestrian fatality rate above 2.5 per 100,000 population and cities with a high number of pedestrian fatalities were targeted. Arizona is one of thirteen focus states and Phoenix is one of five focus cities based on these criteria. Because of the need to address traffic safety in Arizona, the Governor’s Traffic Safety Advisory Council (GTSAC) adopted the Arizona Transportation Safety Plan in 2005 (5). This plan empowered six technical sub-committees along with communication and legislative sub-committees to address media and legislative needs, respectively. One of the emphasis areas is improving pedestrian and bicyclist safety. Learn more about the Council and Plan by visiting the GTSAC website (www.gtsac.org). This statewide pedestrian safety initiative parallels the GTSAC mission, and creates many partnering and funding opportunities.
The Arizona Department of Transportation (ADOT) Highway Enhancements for Safety (HES) Section is leading the development of a Statewide PSAP with support from the various federal, state and local jurisdiction stakeholders. The Pedestrian Safety Group members envision the State and local jurisdictions developing unique PSAPs to meet their individual needs. An effective PSAP will contain clearly stated goals and objectives for improving pedestrian safety. The City of Phoenix PSAP will be finalized in Summer 2007. The Phoenix PSAP sets goals and performance measures for improving pedestrian safety and synthesizes their existing pedestrian safety policies and procedures. The Arizona Department of Transportation is currently developing their PSAP, and along with FHWA and the City of Phoenix can provide technical assistance and guidance to local jurisdictions.

3
INTRODUCTION This is the Arizona supplement to the National “How to Develop a Pedestrian Safety Action Plan” (2). The purpose of this guide is to provide a summary of the national How-to-Guide elements along with Arizona applications and resources. The elements discussed in this guide are:
• Goals and Objectives • Identifying Stakeholders • Data Collection • Data Analysis • Funding • Routine Monitoring
In each of these elements, there are Arizona-specific examples. There is also a section dedicated to good examples in Arizona. In using this guide, it is recommended to refer the National How-to-Guide available online (www.walkinginfo.org). GOALS AND OBJECTIVES Goal Setting The statewide goal is improving pedestrian safety throughout Arizona. In their action plan, each jurisdiction should set specific goals that coincide with the statewide goal. Defining Objectives The statewide objective is reducing pedestrian fatalities and injuries in Arizona by implementing Statewide PSAP. The exact reduction goal will be included in the Arizona Strategic Highway Safety Plan (SHSP) submitted to FHWA in October 2007. An effective PSAP should define specific and measurable objectives for reducing pedestrian fatalities and injuries. Specific objectives facilitate practical and achievable strategies, and provide the parameters for measuring progress. IDENTIFYING STAKEHOLDERS Stakeholder involvement is an essential element in creating publicly supported policies, programs, and projects to improve pedestrian safety while creating a more walkable community. Stakeholders are individuals with an interest in safe and walkable communities and include local jurisdictions’ elected officials and staff, pedestrian and neighborhood advocates, community business members, and the general public. Stakeholders provide the political support for policies and budgets for pedestrian safety programs and other pedestrian improvements. Elected officials need this support, guidance, and input to lead the community in providing safer pedestrian conditions.

4
Each local jurisdiction should form a Pedestrian Advisory Board (PAB) to provide political support for pedestrian safety projects and to ensure oversight of policies and programs affecting pedestrian safety. Local jurisdictions should establish PABs with stakeholders from the following groups:
• Local jurisdictions – including traffic and transportation engineers, planners, neighborhood services officials and, parks, public works, police, and development services staff within the jurisdiction. Optional members might include attorneys and public transportation staff. Representatives from the local Metropolitan Planning Organization (MPO), Council of Governments (COG), ADOT, and FHWA Arizona Division office may be included for technical support and guidance.
• Private sector – members of the business and development communities, public
health organizations, and media outlets.
• Citizen organizations – neighborhood associations, and non-profit organizations (e.g., Safe Kids Coalition, the Federation for the Blind). Representatives from the disabled community can provide valuable insight.
• Individual citizens – choose these members based on their broad interest and
long-term commitment to the community, and not on a single issue they may have.
Strategies for Involving Stakeholders Pedestrian Advisory Boards should be manageable in size and meet periodically (monthly or bi-monthly). . The ideal PAB size ranges from 10 to 20 members to provide diversity of membership and input. Private sector, citizen organization, and individual citizen memberships should be for a limited time (1 to 2 years) to promote membership turnover and new input, but appointments should be staggered to promote continuity. Non-governmental candidates should apply for membership and be interviewed before appointment to a PAB. Candidates need to have the broader interests of the community in mind, be good listeners, and willing to work collaboratively on problem solving. Some important concepts for obtaining stakeholder input include:
Provide quality information to PAB members: Non-technical PAB members need information about pedestrian safety and other pedestrian issues to provide informed and constructive input and feedback.
Setting the PAB agenda: The PAB chair should coordinate with jurisdiction staff
to develop an agenda for each meeting. Topics will include information to PAB members as well as topics for review and input. These include agency policies and practices and design review for individual projects, and funding/budget input.
5
Plans reviews: The PABs should review neighborhood plans, downtown strategic plans, or other geographically-based design plans. They should be involved in reviewing and approving the templates for roadway cross-sections that will be “pedestrian friendly”.
Establish venues for participation: In addition to having regular meetings and
communication with members, outreach opportunities include attending public meetings, and e-mails and telephone calls from the public.
Create special-issue task forces: A special-issue task force may be useful for
large, complicated, controversial, or highly emotional issues such as school safety problems. When forming a special-issue task force, the same principles used to form the PAB are appropriate.
DATA COLLECTION Data collection is an important initial step towards pedestrian safety analysis and enhancements for any community. Jurisdictions may find the data elements shown below useful in analyzing pedestrian safety:
• Crash Data • Hospital Discharge and Emergency Department Data • Roadway Data • Traffic Counts • Driver and Pedestrian Behavioral Studies • Travel Surveys
Crash Data Timely and accurate crash data helps identify a jurisdiction’s safety needs. It is important to know precisely how and where the crash occurred (which street was being crossed, was it driveway or sidewalk related or a pedestrian walking along the roadway crash). It is recommended that computerized crash data only be used to identify high crash locations, corridors or areas. The individual police reports need to be reviewed to fully evaluate how the crashes occurred to begin to identify countermeasures. Arizona traffic crash data is available from the Motor Vehicle Division - Traffic Records Section, of ADOT. The Traffic Records Section collects copies of all traffic crash reports filed within the state of Arizona and compiles them into the Accident Location Identification Surveillance System (ALISS). At present, data from crash reports is available on the ALISS within three to eight months of the crash and data requests from the public are available within three days to a month of such a request. The most useful crash data elements for an effective pedestrian safety analysis are listed below:
• Age and gender of both the driver and pedestrian • Date and time of day • Direction of travel

6
• Driver and pedestrian physical conditions (e.g. drug or alcohol use) • Driver and/or pedestrian citations • Driver Speed • Lighting conditions • Weather condition
Some of ALISS data deficiencies are underreporting of crashes, errors in jurisdiction reporting, lack of a detailed citation tracking system, and errors in street names. These deficiencies may impede a jurisdiction's effort to identify high crash-frequency locations. The GTSAC Traffic Records Coordinating Committee (TRCC) has developed some strategies to address these issues. Hospital Discharge and Emergency Department Data Hospital intake and emergency room records can sometimes yield information on pedestrian crashes that are unreported or crashes that do not involve a motor vehicle (e.g., a bicycle-pedestrian crash, pedestrian walking on the curb). In a recent study on data from three states, 64% of the reported pedestrian injury events did not involve a motor vehicle. Due to privacy concerns, hospital data may not be easy to obtain. However, Arizona Department of Health Services has access to aggregate injury data from both hospital discharge and hospital emergency department that is available upon request. Roadway Data The Arizona Highway Performance Monitoring System (HPMS) on the ADOT Transportation Planning Division's website (http://tpd.azdot.gov/datateam/hpms.php) provides useful roadway data for all State highways and routes. The Works Consulting, LLC (http://www.azhighwaydata.com) website has HPMS information for other publicly-maintained roads. The most useful roadway data elements for an effective pedestrian safety analysis are listed below:
• Existing pedestrian facilities (e.g. sidewalks, pedestrian signals, marked crosswalks, etc.)
• Grade [longitudinal or cross-section] • Median type and width • Number of lanes • Pedestrian traffic generators (e.g. grocery stores, bars, etc.) • Posted Speed Limit • Road surface condition (e.g., wet, dry, snow) • Roadway width • Shoulder width • Sight obstructions • Street lighting (e.g., presence, functioning) • Traffic signal timing

7
For the State system, Photo Log Viewer is available on ADOT’s intranet providing useful roadway data. Sidewalk inventory maintained by local agencies is a good source of sidewalk data for analysis (e.g. Pima Association of Governments’ sidewalk inventory). Traffic Counts Annual Average Daily Traffic (AADT) for the study location may be available in the individual jurisdictions’ traffic databases as well as on their jurisdiction websites, if any. For example, the AADT data for the State system is provided on the Transportation Planning Divisions' website (http://tpd.azdot.gov/data/aadt.php). Other jurisdictions need to contact the appropriate department. In addition to vehicular counts, collecting pedestrian counts and analyzing traffic patterns may explain pedestrian activity in a study area. The count times should reflect the pedestrian crash patterns by time-of-day. Counts should be subdivided into 15 minute intervals, and individual crossing locations should be tallied separately. Elderly and child pedestrian counts should be summarized separately from adult pedestrians, and bicyclists should not be included in the counts. Driver and Pedestrian Behavioral Studies Studying a location's pedestrian and driver behavior is often useful in identifying probable crash contributing factors. Behavioral studies should be part of the field reviews conducted at identified high crash-frequency locations. Also, inferences regarding behavior can be made from a review of the crash records. Travel Surveys Travel surveys of non-motorized roadway users can provide useful information on pedestrian activity in an area, including the extent of the activity, and information on trip generators and attractors. Travel surveys are especially important when a jurisdiction does not routinely collect pedestrian volume data.
DATA ANALYSIS Analyzing Information Potential locations for pedestrian safety improvements within a jurisdiction are identifiable through computerized crash data analysis. For example, pedestrian crashes involving a pedestrian crossing an intersection and a turning vehicle should be coded as “Vehicle Turn/Merge” crash type. Crash typing helps in identifying specific countermeasures as detailed in the “PEDSAFE: Pedestrian Safety Guide and Countermeasure Selection System”, published by FHWA (6). At least three to five years of crash data should be used to identify the locations and prioritize the pedestrian safety improvements. Evaluation sites can be the following:

8
• Spot Locations • Corridors • Target Areas • Entire Jurisdiction
Spot Locations Pedestrian safety concerns may focus on a specific location. Improvements at such locations are mostly operational or construction related. Examples include curb extensions, repainting crosswalks, and removing sight obstructions. Education and enforcement measures include spot enforcement through installation of photo enforcement (red-light running) cameras and drivers-yield-to-pedestrian laws. Corridors A study segment can be subdivided into roadway segments of 0.5 mile to 5 mile in length. Analysis of the crash data for roadway segments may reveal crash patterns such as those occurring predominantly at night, at transit stops, at marked crosswalk, at un-signalized intersections and so on. Crashes can be reduced by implementing countermeasures throughout the corridor like providing sidewalks or street lighting in locations with a high number of nighttime crashes. Target Areas Geographic Information Systems (GIS) data is useful in identifying the target areas within a jurisdiction. Use one to three years of pedestrian crash data to identify area-wide pedestrian crash patterns. Examples of engineering improvements include area-wide traffic calming, installation of Americans with Disabilities Act (ADA) compliant curb ramps, and curb radius reduction. Entire Jurisdiction Use policy, plans, and engineering design guideline changes to address pedestrian safety issues in an entire jurisdiction. A lack of pedestrian crashes at a location does not mean that it is safe for pedestrians. It may mean that the conditions are not ideal for pedestrian activity or that there is a perceived danger. A pedestrian safety analysis should therefore consider other factors in addition to crash frequencies. Education and enforcement measures include radio and television public service announcements, and photo enforcement (red-light running) cameras. For example, the Federal Highway Administration has a Pedestrian Safety Campaign available to any state or local jurisdiction (http://safety.fhwa.dot.gov/local_program/pedcampaign/index.htm). The use of "pedestrian decoys" for enforcing the requirement to yield to pedestrians in crosswalks can also be employed.

9
Pedestrian Crash Database Because of limited resources, smaller jurisdictions rarely have a separate database for recording pedestrian crashes. These jurisdictions might use the Pedestrian and Bicycle Crash Analysis Tool (PBCAT), Version 2.0 (7), developed by FHWA to provide a list of viable countermeasures for local officials to consider. Creating a database with pedestrian crash type is one of the features of the PBCAT. Linking this database to the vehicle database is also possible. The Fatality Analysis Reporting System (FARS) also facilitates the understanding of fatal pedestrian crashes. Crashes involving children, the elderly, and persons with disabilities should be analyzed for patterns or trends. Crashes in work zones, recreational areas, and at special events should also be specifically studied. Prioritizing Concerns For identifying high crash locations, 3 to 5 years of crash data is typically needed. For identifying high crash corridors or areas, 1 to 3 years of crash data may be needed. After the high crash-frequency locations are identified, countermeasures should be developed to address the apparent pedestrian safety issues. Pedestrian Road Safety Audits (RSAs) are very useful in identifying possible countermeasures. A multi-disciplinary team should perform RSAs for all of the identified high crash-frequency locations. Typical RSA promptlist items include pedestrian clearance times at signalized intersections, driver visibility of pedestrians, and buffer space between travel lanes and sidewalks. FHWA has developed guidelines and promptlists for Pedestrian RSA which are based on the RSA Guidelines. More information on RSAs can be found at http://safety.fhwa.dot.gov/state_program/rsa/index.htm. A point-based ranking system can be developed for the purpose of prioritizing locations for providing pedestrian safety improvements. Such a system ranks a location's priority for pedestrian safety improvements by weighting the collected crash and roadway data elements and other factors deemed important by the jurisdiction. The system is called the Pedestrian Needs Index (also called Pedestrian Potential Index or Pedestrian Deficiencies Index). While a pedestrian crash index may work well for some agencies, a ranking by pure numbers or a combination of numbers and severity may work just as well. Other factors to consider are availability of right-of-way, public support, travel demand, cost of improvement, funding, and safety benefits. Jurisdictions can use GIS to rank locations for pedestrian safety improvements.

10
FUNDING Funding is critical to implement pedestrian safety improvements. This section describes how fiscally-constrained jurisdictions can make safety improvements in the following ways:
• Routine accommodation in new projects • Public-private partnerships • Dedicated funds and set asides, and • Annual maintenance budgets
Routine Accommodation in New Projects Routinely including pedestrian facilities with other roadway improvement projects is a cost-effective strategy for reducing pedestrian crashes and encouraging more walking. Routine accommodation is the construction of pedestrian infrastructure as part of regular public and private development and traffic maintenance practices. Routine Accommodation can involve lighting, sidewalks, wheelchair ramps and building of raised medians as a part of developer improvements. Routine accommodation would also include the use of wider sidewalks and sidewalk buffers to move pedestrians farther away from traffic, and narrower street cross-sections to make crossings easier. Most pedestrian infrastructure is built in conjunction with other projects: pedestrian crossings are built in conjunction with the construction of intersections; pedestrian signals are installed in conjunctions with traffic signals; and most sidewalks in residential neighborhoods are built as part of house construction. The same applies to traffic maintenance practices; installing high-visibility crosswalk markings after pavement overlays is an example of a good practice. Routine accommodation allows for significant improvements over time, even if there is no special funding available for pedestrian safety improvements. Routine accommodation for new projects does not diminish the importance of addressing high-frequency crash locations, corridors, and other targeted areas immediately.
Where a developer does not install an improvement along their project due to the fact that an agency arterial street improvement project will be built or a signal is not yet warranted, they should be required to create an escrow account for their share of the improvements to lessen the cost to the general taxpayers, and build the improvements when warranted or in conjunction with an upcoming roadway improvement project. Examples of Routine Accommodation
• Use of developer fees • Implementing updated design standards (e.g. installing countdown pedestrian
signals)

11
Public-Private Partnerships Both public works and private development projects provide partnership opportunities for improving pedestrian safety in addition to what might be accomplished through routine accommodation. For example, increase in funding opportunities for infrastructure improvements, opportunities to construct sidewalks with resurfacing projects, opportunities for placing utilities underground and eliminating obstructions on sidewalks etc. Examples of Public-Private Partnerships 1. Safe Routes to School, Phoenix, AZ The City of Phoenix partnered with school boards to provide funding for the Safe Routes to School program. A twenty-seven thousand dollar grant for additional police enforcement at schools and brighter safety vests for crossing guards came from the Governor’s Office of Highway Safety. The Maricopa Association of Governments (MAG) partnered with Phoenix to expand the school crossing guard training across the entire metropolitan area. Any community can adopt the Phoenix School Safety program if there is a political will to fund the program elements and devote the resources to school crossing safety. For more on this example, see the MAG web site. 2. Pedestrian Amenities along 7th Avenue, Phoenix, AZ Seventh Avenue between Indian School Road and Camelback Road in Phoenix, Arizona is the location of the project with the phase one demonstration at Glenrosa Street. This public-private partnership was among Arizona State University’s School of Architecture, the 7th Avenue Merchants Association, the Melrose Neighborhood, and the City of Phoenix: Departments of Street Transportation, Neighborhood Services, Public Art, Planning, Community and Economic Development and Development Services. The project will help in the development of prototypes for city public spaces and private development. The project is designed to form a new multi-use pedestrian street network linking the commercial strip with surrounding neighborhoods, parks, restaurants and community services. The shade, street lighting, sidewalks, and signage create display areas, outdoor seating and recreation areas with both the merchants and the neighborhoods in mind.
3. Grand Canyon Greenway, Grand Canyon, AZ Grand Canyon is one of the most popular tourist destinations in the world with the number of visitors per year expected to be around 7 million in the next couple of years. To improve the experience of the visitors, the Greenway project was started with the funding from Nina Mason Pulliam Charitable Trust, American Airlines, the Dr. Scholl Foundation, the Haiman Foundation, Bicycle Belongs, the National Park Service, Arizona Department of Transportation and the U.S. Department of Transportation. The

12
first two phases of the project facilitated the opening of 4.5 miles of trials. The third and fourth phases are in the construction stage with more than 9 miles of trails to be added. Dedicated Funds and Set Asides There are many dedicated, set-aside funds for pedestrian and/or bicycle improvements in Arizona. The statewide Transportation Enhancement Program is one example of such a fund. Sales tax set-aside funds are a local jurisdiction example. Set asides are either a percentage of a larger fund; for example, a percentage of Federal funds (beyond the mandated Federal Enhancement fund) for pedestrian and/or bicycle projects; or set asides with an independent funding source; typical examples include developer funds (funds deposited by developers into a centralized fund or escrow account for future use), resource funds (taxes on extracted natural resources such as gravel or oil), and real estate excise funds.
Examples of Arizona's Dedicated Funding Sources
• County Sales Tax • Maricopa County – Proposition 400: A percentage of the funds go towards
pedestrian improvements • Pima County – Regional Transportation Authority plan: $60 million for
greenways, pathways, bikeways, and sidewalks and $20 million for Elderly and Pedestrian Safety Improvements such as signalized pedestrian crossings, pedestrian access improvements and Safe Routes to School.
• ADOT Transportation Enhancement Program • Statewide Safe Routes to School (New) • Governor’s Office of Highway Safety 402 Program • ADOT Highway Safety Improvement Program (lighting, sidewalk installation,
analysis and identification) Annual Maintenance Budget Existing annual maintenance budgets can be used to make small but important pedestrian improvements. For example, limited budgets for painting marked crosswalks can be focused around schools and high crash locations. Crosswalks can be widened or changed to high-visibility markings when they are scheduled to be repainted. Crosswalk signs scheduled for replacement can be upgraded to the brighter fluorescent signs that have been adopted by the Manual on Uniform Traffic Control Devices (MUTCD) as an option for pedestrian and bicycle warning signs. Examples of using Annual Maintenance Budget
• Replacing old signs, re-striping crosswalks • Pima County Regional Transportation Plan for maintenance and continuation of
pedestrian and bicycle facilities

13
Examples of Annual Maintenance Budgets include programs for reviewing and re-striping crosswalks on a periodic basis, and reviewing and maintaining street lights (by the agency or through a contact with a power company or other company), cleaning and replacement of traffic signs, and the detection and removal of visibility obstructions involving landscaping (trees, bushes). Other examples include budgets to make sure that traffic and pedestrian signals are working properly, the timing remains correct and that push buttons and WALK/DON'T WALK signal lights are checked periodically and replaced when needed (preferably before a light goes out). Agencies need to develop and preserve their annual maintenance budgets adequately to accomplish routine items that promote pedestrian safety. Sidewalk repair is another item, especially problems due to frost-heave in the colder climates or heat-buckling in the desert climates. ROUTINE MONITORING Routine monitoring is necessary for the jurisdictions to make sure the implemented improvements are working properly. In routine monitoring, jurisdictions should:
• Conduct an annual analysis of pedestrian crashes • Map and inventory pedestrian facilities (crosswalk, sidewalks, etc.) • Monitor new signal installations and conduct before-after analysis • Work with pedestrian advisory committee to survey pedestrian needs and,
address comments and concerns Routine monitoring requires that a jurisdiction have the staff or a reporting mechanism with other staff (such as the police) or from the public to identify and address problem locations such as missing signs, broken sidewalks and faded crosswalks. Some jurisdictions have created "adopt-a-street" programs to get a higher level of surveillance from the public, and others have created reporting systems within an agency so that police know where to report pedestrian and traffic problems that they observe while driving on the streets.
14
GOOD EXAMPLES IN ARIZONA State Projects and Programs Projects on the Arizona State Highway System that helped improve pedestrian safety include:
1. Providing street lighting 2. Providing sidewalks 3. Intersection improvements 4. Providing portable 15mph signs
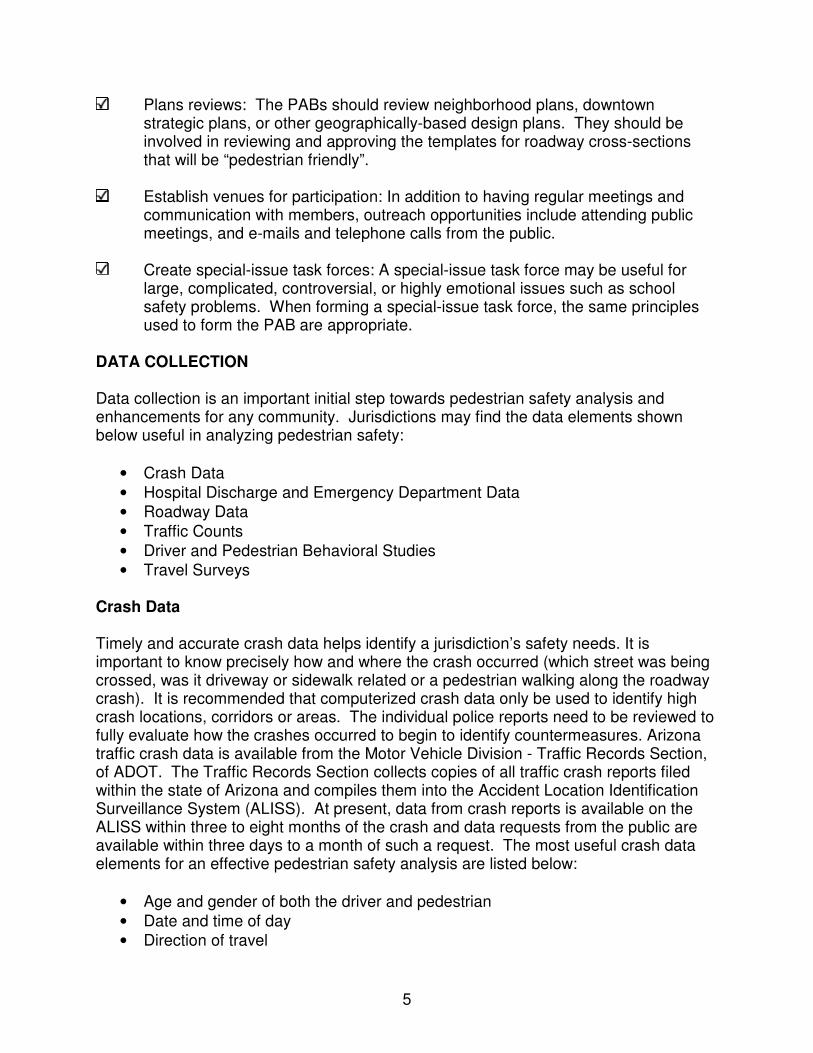
Street lighting along US 163 in Kayenta Street lighting was provided along US 163, from MP 393.5 to MP 395.5 in 2003. In the three years “before” the street lighting was provided, this specific highway segment experienced four pedestrian crashes- two fatal, one incapacitating and one possible injury. An “after” study reported a single crash resulting in a pedestrian fatality, showing a considerable improvement in pedestrian safety.
Street lighting along US 163 Arizona Safe Routes to School Program (SRTS) The purpose of SRTS is to encourage and enable children to safely bicycle and walk to/from school. Eligible projects in the Arizona SRTS program include Non-Infrastructure and Infrastructure projects. Below are examples of the types of projects eligible for the program. More information can be found at www.azdot.gov/saferoutes/.

15
Non-Infrastructure projects These include education and enforcement efforts. Education efforts include teaching children about bicycling and walking safety skills, the health effects of walking and biking, the impact to the environment, the broad range of transportation choices, and events and activities that promote walking and biking to school safely. Enforcement efforts include ensuring that traffic laws are obeyed (including enforcement of speeds, yielding to pedestrians in crossings and proper walking and bicycling behaviors) and initiating community enforcement activities. Encouragement efforts include events, activities, and educational giveaways to promote bicycling and walking (including bike helmet giveaways/fittings and mileage clubs). Following are examples of the eligible Non-Infrastructure projects:
• Bike Rodeos • Walking school bus/bike train • Parent-focused education • Student-focused education • Speed reduction/driver education • Targeted pedestrian safety • Bicycle helmet giveaways and fittings
Infrastructure projects These are the projects designed to reduce potential pedestrian and bicycle conflicts with motor vehicle traffic; reduce traffic volume around schools; and/or establish safer and fully accessible crossings, walkways, trails, or bikeways. Following are examples of eligible Infrastructure Projects:
• Trail construction • Crossing improvements • On-street bicycle facility • Traffic diversion • Sidewalk improvement • Pick-up/drop-off zone improvements • Traffic signals • Street striping • Street narrowing
Local Projects and Programs Many traditional and innovative pedestrian safety improvement projects have already proven to be successful in Arizona. These projects show how stakeholder involvement, community support, creativity and experimentation help improve safety for pedestrians. Some of the projects within the local jurisdictions include:
16
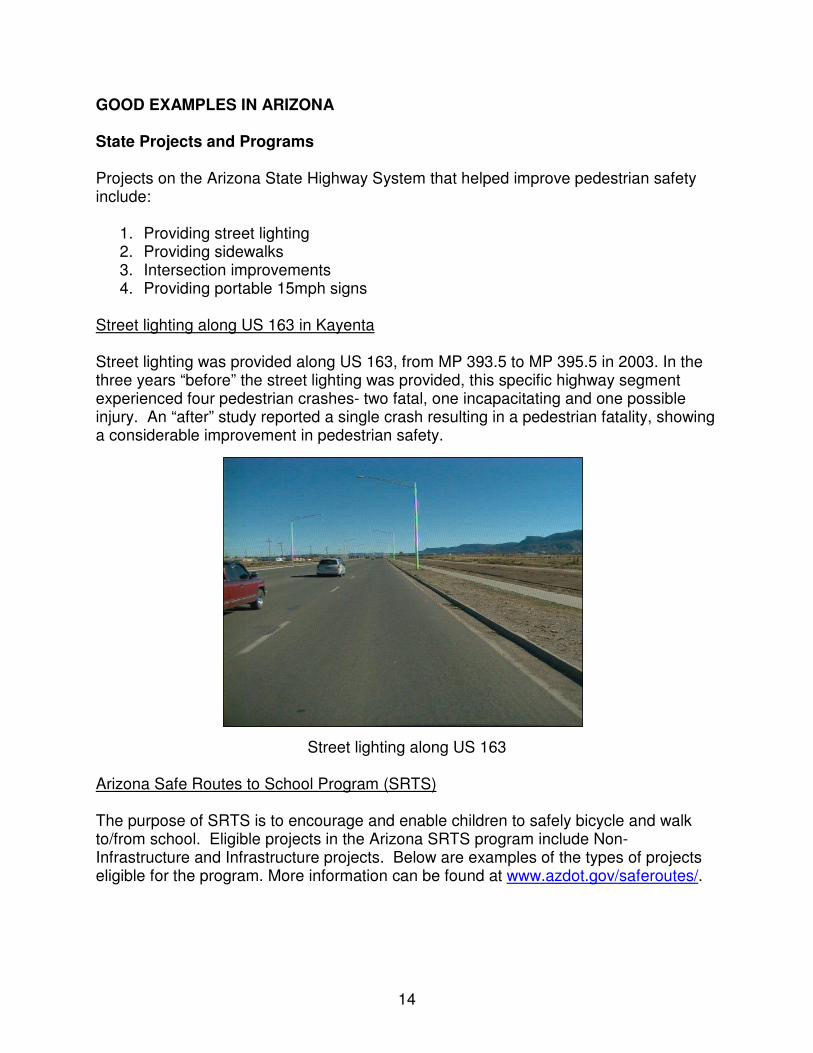
Greenway Pedestrian Bridge in Phoenix The students of the Aire Libre Elementary School needed some form of accommodation to cross the new seven-lane Greenway Parkway. A steel-truss pedestrian bridge was relocated from Mercury Mine School where it was no longer needed due to reconstruction of the roadway, to the new site over the Greenway Parkway. New ADA compliant ramps, staircases and footings were designed and built along with minor artistic additions to the bridge. This project was possible thorough excellent cooperation between various agencies to produce the desired results. Over 60 students use this bridge every school day (6).
Greenway Pedestrian Bridge in Phoenix Two-Stage Crosswalk in Phoenix A two-stage crosswalk consisting of a fenced center pedestrian safety Island with ladder design crosswalks on either side and advanced stop bars on approaches was provided near Van Buren Street and 32nd Avenue. This design forces the pedestrians to face oncoming traffic before crossing the second half of the street. The stagger always has to be in the right direction so the pedestrian turns to the right before crossing the second half of the street. Pedestrians wishing to cross the street at this location need to watch only one approach of traffic and enter the median island, which provides refuge before the pedestrian can safely watch and cross the other half of the street. This countermeasure has received great community support and the City currently has five two-staged crosswalks installed within their jurisdiction.

17
Two-Stage Crosswalk and Pedestrian Crossing Island Park Trail Bridges in Prescott Pedestrians and bicyclists did not use the West Granite Creek Park to travel between the east and west parts of the city because of heavy through motor vehicle traffic. Prescott Bicycle and Pedestrian Master Plan included the development of a one-mile trail in the park. The plan to make improvements was passed by the City Council but without any dedicated set aside funding. Apart from the land trail itself, four creek crossings formed part of the trail development. In the face of severe budget constraints, the first phase of the trail construction was successful through volunteer labor. Two temporary bridges were built and another two utilized volunteer labor and material like scrap rebar and plate steel to keep the construction costs low. The project was fully supported by the community and was immensely successful with many pedestrians and bicyclists seen through the park after the trail development (6).
Fifth Street Traffic Calming in Tempe Neighborhood residents expressed serious concern over the increasing traffic volumes and high speeds on the Fifth Street which serves an elementary school, a park, a community center and a market along the way. As a result, the City of Tempe formed the Fifth Street Pedestrian Enhancement and Traffic Calming Project. Existing sidewalks were widened and bicycle lanes were provided. Traffic chokers, on street parking, and pedestrian-level street lighting were also provided. The project was successful with the neighborhood residents experiencing improved walkability and increased safety along the street (6).

18
Median Island and Bicycle lane in Tempe
HAWK Installations in Tucson High-intensity Activated crossWalK (HAWK) is a beacon signal consisting of a customized traffic signal head with a red-yellow-red lens. The signal is activated by the pedestrian when the pedestrian wishes to cross the street. A flashing yellow is followed by a solid yellow advising the drivers to prepare to stop. The signal then changes to solid red at which time a WALK signal is indicated to the pedestrian. The beacon signal then converts to an alternating flashing red and the drivers can proceed when safe after stopping at the crosswalk. Tucson had also implemented innovative technologies like the Pedestrian Light Control Activated (PELICAN), and Two (groups) CAN (TOCAN) traffic signals. At PELICAN signals, pedestrians cross the street in two stages- to a median island and then to a second signalized crossing point a short distance away where the pedestrian needs to activate another pedestrian crossing button. The two crossings delay the pedestrian only minimally and allow the signal operation to fit into the arterial synchronization thus reducing the number of stops, delays, accidents and air quality environmental issues. TOCAN is designed to provide a safe crossing for the "two" groups-pedestrians and bicyclists. A traditional full signal would be inappropriate where only a crossing for bicyclists in needed and may encourage cut through traffic too if provided. TOCAN is a bicycle-pedestrian signal that extends the traffic light for the two specific groups based on the information provided by cameras that detect bicycles or pedestrians
.

19
HAWK Installation in Tucson Broadway Diamondback Pedestrian/ Bicycle Bridge in Tucson The objective was to build a bridge over a busy intersection as a key link in Tucson pedestrian path system. This project utilized local, transportation enhancement as well as Federal Highway Surface Transportation Program (STP) funds. This project proved very successful with a high number of pedestrians and bicyclists using the bridge. The bridge itself has become a city landmark.
Broadway Diamondback Rattlesnake Pedestrian/ Bicycle Arizona Safe Kids Program Arizona Safe Kids program is a statewide program for the prevention of unintentional injury to children under 15 years of age. Arizona Safe Kids is a member of the National Safe Kids Campaign. Childhood injuries are the leading cause of death for Arizona’s children. Sixty-Six percent of preventable child deaths in Arizona in 2003 were due to

20
unintentional injury (accidents) according to the Arizona Child Fatality Review Board. Motor vehicle crashes are the most common cause of injury. Mission of the program is to reduce unintentional injuries to Arizona children by creating safer homes and communities through education and intervention. Community assessments and action plans are developed each year, providing detailed strategies to reduce childhood injury in communities across Arizona. In Arizona, there are five local Safe Kids Coalitions, one local chapter, and the Arizona State Coalition. Local Safe Kids Coalitions throughout Arizona receive leadership and technical assistance from Arizona Safe Kids. Local Coalition accomplishments include regular car seat testing events, a permanent car seat testing site, child passenger safety technician certification and development of resource materials for public education.
Tucson Safe Kids Program

21
ABBREVIATIONS USED
REFERENCES
1. Safe Pedestrians and a Walkable America. FHWA, U.S. Department of
Transportation. Pedestrian Forum, Vol. 36, Fall 2006. http://safety.fhwa.dot.gov/ped_bike/ped/pedforum/pedforum_fall06.html
2. How to Develop a Pedestrian Safety Action Plan. Publication FHWA-SA-05-12.
FHWA, U.S. Department of Transportation, February 2006. http://www.walkinginfo.org/pp/howtoguide2006.htm
3. Traffic Safety Facts Annual Reports 2005. Publication DOT HS 810 631. Annual
Reports, NHTSA, U.S. Department of Transportation. http://www-nrd.nhtsa.dot.gov/departments/nrd-30/ncsa/AvailInf.html
AADT Annual Average Daily Traffic
ADA Americans with Disabilities Act
ADOT Arizona Department of Transportation
ALISS Accident Location Identification Surveillance System
COG Council of Governments
FARS Fatality Analysis Reporting System
FHWA Federal Highway Administration
GIS Geographic Information Systems
GTSAC Governor’s Traffic Safety Advisory Council
HAWK High-intensity Activated crossWalK
HES Highway Enhancements for Safety
HPMS Highway Performance Monitoring System
ISTEA Intermodal Surface Transportation Efficiency Act
MAG Maricopa Association of Governments
MPO Metropolitan Planning Organization
MUTCD Manual on Uniform Traffic Control Devices
PAB Pedestrian Advisory Board
PBCAT Pedestrian and Bicycle Crash Analysis Tool
PELICAN PEdestrian Light Control Activated
PSAP Pedestrian Safety Action Plan
RSA Road Safety Audit
SHSP Strategic Highway Safety Plan
SRTS Safe Routes to School
STP Surface Transportation Program
TOCAN TwO (groups) CAN
TRCC Traffic Records Coordinating Committee

22
4. Saving Lives: A Vital FHWA Goal by A. George Ostensen, FHWA Public Roads. January/February 2003.
http://www.tfhrc.gov/pubrds/03jan/01.htm 5. The Arizona Transportation Safety Plan 2005. www.gtsac.org
6. PEDSAFE: Pedestrian Safety Guide and Countermeasure Selection System,
Publication FHWA-SA-04-003. FHWA, U.S. Department of Transportation. September 2004. http://www.walkinginfo.org/pedsafe/index.cfm
7. PBCAT: Pedestrian and Bicyclist Crash Analysis Tool, http://walkinginfo.org/pc/pbcat.cfm
PHOTO CREDITS Arizona Department of Transportation; City of Phoenix; City of Tucson; Pedestrian and Bicycle Information Center Image Library, www.pedbikeimages.org CONTACTS For additional information, please contact either Kohinoor Kar, ADOT-HES ([email protected]) or Karen King, FHWA Arizona Division Office ([email protected]).