Embed Size (px)
Citation preview
Available online at www.sciencedirect.com
www.elsevier.com/locate/gca
ScienceDirect
Geochimica et Cosmochimica Acta 173 (2016) 352–372
A new lunar high-Ti basalt type defined from clasts in Apollo16 breccia 60639
A.L. Fagan a,b,c,⇑, C.R. Neal a,b
aDepartment of Civil and Environmental Engineering and Earth Sciences, University of Notre Dame, Notre Dame, IN 46556, United StatesbNASA Lunar Science Institute, United States
cGeosciences and Natural Resources Department, College of Arts and Sciences, 331 Stillwell Building, Western Carolina University,
Cullowhee, NC 28723, United States
Received 2 August 2013; accepted in revised form 12 August 2015; Available online 31 August 2015
Abstract
This paper reports the detailed examination of three basalt clasts from Apollo 16 breccia 60639 that represent a new vari-ant of high-Ti basalt returned from the Moon by the Apollo 16 mission. Mineral chemistry and whole-rock analyses wereconducted on aliquots from three clasts (breccia matrix, basalt, and basalt + breccia matrix). The basalt clasts, which arenot overtly porphyritic, contain compositionally zoned pyroxene, olivine, and plagioclase crystals that represent the evolutionof the magma during crystallization; ilmenite does not exhibit major-element compositional zoning within individual crystals.Mineral compositions are distinct between the basalt and breccia matrix lithologies. In addition, whole-rock analyses identifyclear compositional differences between the basalt and breccia matrix lithologies in both major and trace element concentra-tions. The composition of the mixed lithology aliquots (i.e., basalt + breccia matrix) do not indicate simple two componentmixing (i.e., compositions are not intermediate to the basalt and breccia end-members); this apparent incongruity can beaccounted for by adding �19–40% plagioclase to an amalgamation of the average basalt and individual breccia clast compo-sitions via impact mixing. Whole-rock analyses are consistent with previous analyses of one 60639 basalt clast, which wereinterpreted to indicate chemical similarity with Apollo 11 and 17 basalts. However, both major and trace elements suggestthat the 60639 basalt clasts examined here have compositions that are distinct from Apollo 11 and 17 high-Ti basalts.Although the 60639 basalt clasts have similar characteristics to a variety of previously identified basalt types, the more exten-sive whole-rock analyses reported here indicate that they represent a type of Apollo high-Ti basalt heretofore unrecognized inthe Apollo and lunar meteorite collections. By placing these new analyses in the context of other mare basalt compositions, apetrogenetic model for the basalts found in breccia 60639 is presented.� 2015 Elsevier Ltd. All rights reserved.
1. INTRODUCTION
The Apollo landing sites were predominantly located inmare areas, with the exception of Apollo 16, which landedin the Descartes highlands region. The Apollo 16 area is
http://dx.doi.org/10.1016/j.gca.2015.08.007
0016-7037/� 2015 Elsevier Ltd. All rights reserved.
⇑ Corresponding author at: Geosciences and Natural ResourcesDepartment, College of Arts and Sciences, 331 Stillwell Building,Western Carolina University, Cullowhee, NC 28723, United States.
E-mail address: [email protected] (A.L. Fagan).
dominated by highlands anorthositic material and appearedto be devoid of mare deposits. Rare basaltic samples andglasses are, however, present (Table 1) as fragments in rego-lith samples or as small clasts in breccias, as with breccia60639 (e.g., Dowty et al., 1974; Delano, 1975; Muraliet al., 1976; Ma et al., 1976; Simon and Papike, 1987;Zeigler et al., 2006). It was assumed that these samples wereintroduced to the Descartes Highlands from elsewhere onthe Moon as impact ejecta given the lack of visible localmare deposits.
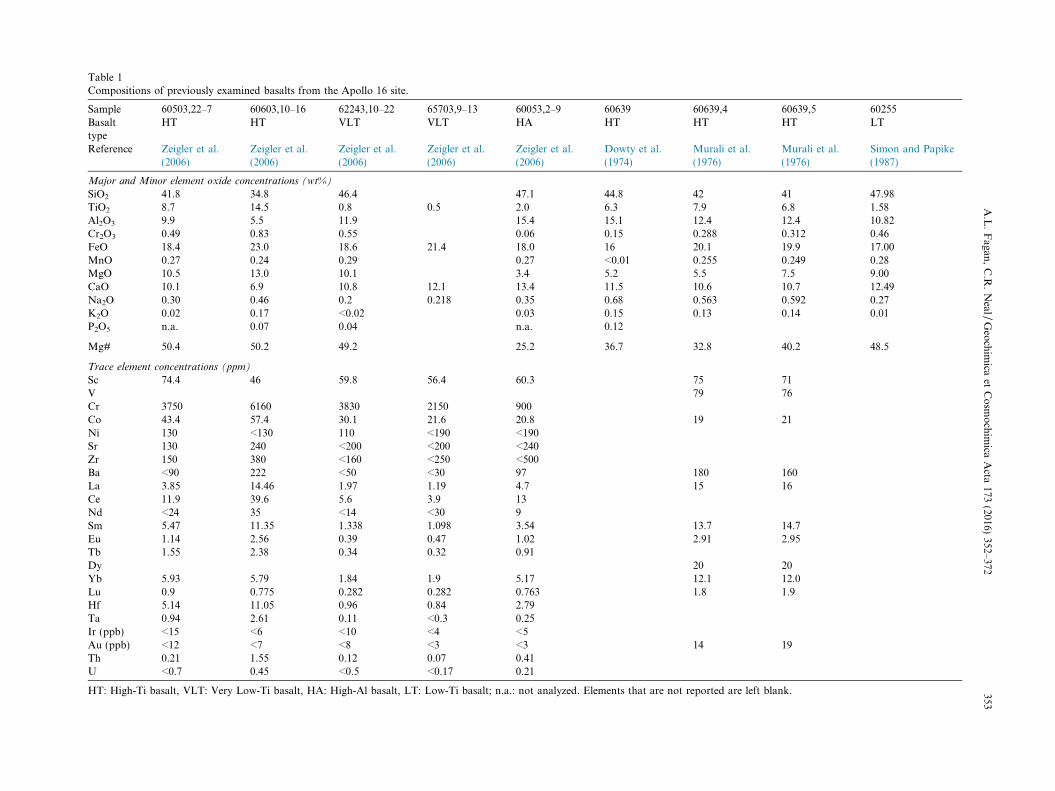
Table 1Compositions of previously examined basalts from the Apollo 16 site.
Sample 60503,22–7 60603,10–16 62243,10–22 65703,9–13 60053,2–9 60639 60639,4 60639,5 60255Basalttype
HT HT VLT VLT HA HT HT HT LT
Reference Zeigler et al.(2006)
Zeigler et al.(2006)
Zeigler et al.(2006)
Zeigler et al.(2006)
Zeigler et al.(2006)
Dowty et al.(1974)
Murali et al.(1976)
Murali et al.(1976)
Simon and Papike(1987)
Major and Minor element oxide concentrations (wt%)
SiO2 41.8 34.8 46.4 47.1 44.8 42 41 47.98TiO2 8.7 14.5 0.8 0.5 2.0 6.3 7.9 6.8 1.58Al2O3 9.9 5.5 11.9 15.4 15.1 12.4 12.4 10.82Cr2O3 0.49 0.83 0.55 0.06 0.15 0.288 0.312 0.46FeO 18.4 23.0 18.6 21.4 18.0 16 20.1 19.9 17.00MnO 0.27 0.24 0.29 0.27 <0.01 0.255 0.249 0.28MgO 10.5 13.0 10.1 3.4 5.2 5.5 7.5 9.00CaO 10.1 6.9 10.8 12.1 13.4 11.5 10.6 10.7 12.49Na2O 0.30 0.46 0.2 0.218 0.35 0.68 0.563 0.592 0.27K2O 0.02 0.17 <0.02 0.03 0.15 0.13 0.14 0.01P2O5 n.a. 0.07 0.04 n.a. 0.12
Mg# 50.4 50.2 49.2 25.2 36.7 32.8 40.2 48.5
Trace element concentrations (ppm)
Sc 74.4 46 59.8 56.4 60.3 75 71V 79 76Cr 3750 6160 3830 2150 900Co 43.4 57.4 30.1 21.6 20.8 19 21Ni 130 <130 110 <190 <190Sr 130 240 <200 <200 <240Zr 150 380 <160 <250 <500Ba <90 222 <50 <30 97 180 160La 3.85 14.46 1.97 1.19 4.7 15 16Ce 11.9 39.6 5.6 3.9 13Nd <24 35 <14 <30 9Sm 5.47 11.35 1.338 1.098 3.54 13.7 14.7Eu 1.14 2.56 0.39 0.47 1.02 2.91 2.95Tb 1.55 2.38 0.34 0.32 0.91Dy 20 20Yb 5.93 5.79 1.84 1.9 5.17 12.1 12.0Lu 0.9 0.775 0.282 0.282 0.763 1.8 1.9Hf 5.14 11.05 0.96 0.84 2.79Ta 0.94 2.61 0.11 <0.3 0.25Ir (ppb) <15 <6 <10 <4 <5Au (ppb) <12 <7 <8 <3 <3 14 19Th 0.21 1.55 0.12 0.07 0.41U <0.7 0.45 <0.5 <0.17 0.21
HT: High-Ti basalt, VLT: Very Low-Ti basalt, HA: High-Al basalt, LT: Low-Ti basalt; n.a.: not analyzed. Elements that are not reported are left blank.
A.L.Fagan
,C.R
.Neal/
Geochim
icaet
Cosm
ochim
icaActa
173(2016)
352–372353
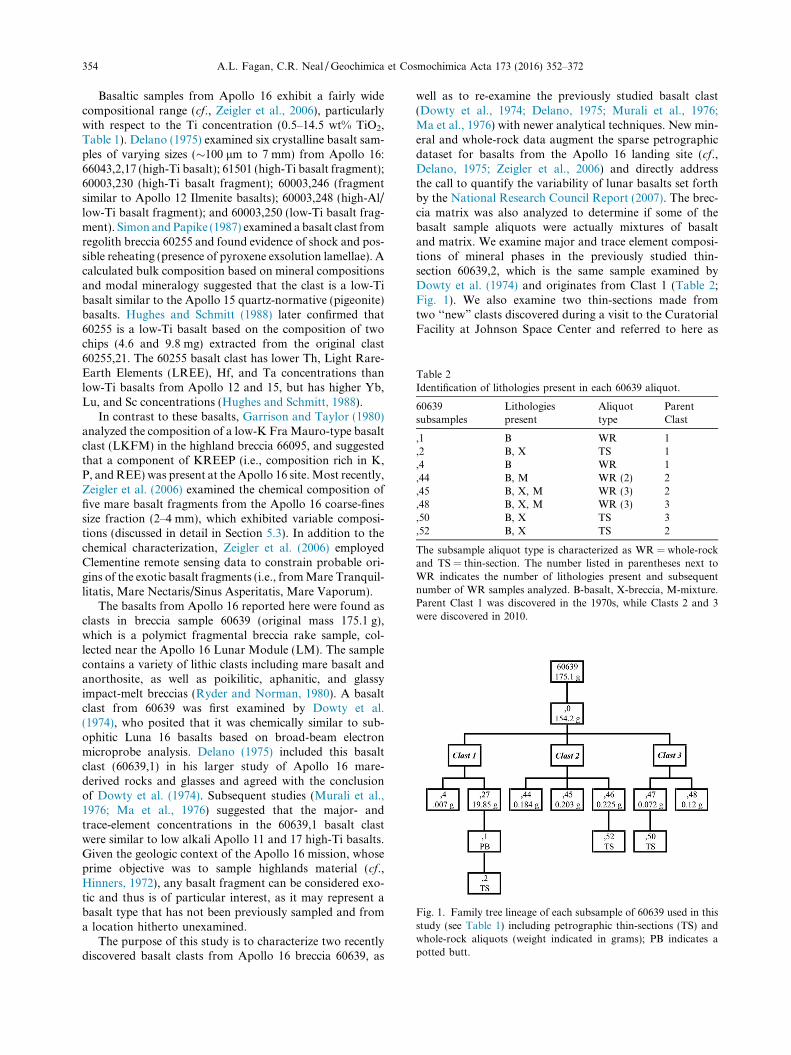
Table 2Identification of lithologies present in each 60639 aliquot.
60639subsamples
Lithologiespresent
Aliquottype
ParentClast
,1 B WR 1,2 B, X TS 1,4 B WR 1,44 B, M WR (2) 2,45 B, X, M WR (3) 2,48 B, X, M WR (3) 3,50 B, X TS 3,52 B, X TS 2
The subsample aliquot type is characterized as WR = whole-rockand TS = thin-section. The number listed in parentheses next toWR indicates the number of lithologies present and subsequentnumber of WR samples analyzed. B-basalt, X-breccia, M-mixture.Parent Clast 1 was discovered in the 1970s, while Clasts 2 and 3were discovered in 2010.
Fig. 1. Family tree lineage of each subsample of 60639 used in thisstudy (see Table 1) including petrographic thin-sections (TS) andwhole-rock aliquots (weight indicated in grams); PB indicates apotted butt.
354 A.L. Fagan, C.R. Neal /Geochimica et Cosmochimica Acta 173 (2016) 352–372
Basaltic samples from Apollo 16 exhibit a fairly widecompositional range (cf., Zeigler et al., 2006), particularlywith respect to the Ti concentration (0.5–14.5 wt% TiO2,Table 1). Delano (1975) examined six crystalline basalt sam-ples of varying sizes (�100 lm to 7 mm) from Apollo 16:66043,2,17 (high-Ti basalt); 61501 (high-Ti basalt fragment);60003,230 (high-Ti basalt fragment); 60003,246 (fragmentsimilar to Apollo 12 Ilmenite basalts); 60003,248 (high-Al/low-Ti basalt fragment); and 60003,250 (low-Ti basalt frag-ment). Simon andPapike (1987) examined a basalt clast fromregolith breccia 60255 and found evidence of shock and pos-sible reheating (presence of pyroxene exsolution lamellae). Acalculated bulk composition based on mineral compositionsand modal mineralogy suggested that the clast is a low-Tibasalt similar to the Apollo 15 quartz-normative (pigeonite)basalts. Hughes and Schmitt (1988) later confirmed that60255 is a low-Ti basalt based on the composition of twochips (4.6 and 9.8 mg) extracted from the original clast60255,21. The 60255 basalt clast has lower Th, Light Rare-Earth Elements (LREE), Hf, and Ta concentrations thanlow-Ti basalts from Apollo 12 and 15, but has higher Yb,Lu, and Sc concentrations (Hughes and Schmitt, 1988).
In contrast to these basalts, Garrison and Taylor (1980)analyzed the composition of a low-K FraMauro-type basaltclast (LKFM) in the highland breccia 66095, and suggestedthat a component of KREEP (i.e., composition rich in K,P, andREE) was present at the Apollo 16 site.Most recently,Zeigler et al. (2006) examined the chemical composition offive mare basalt fragments from the Apollo 16 coarse-finessize fraction (2–4 mm), which exhibited variable composi-tions (discussed in detail in Section 5.3). In addition to thechemical characterization, Zeigler et al. (2006) employedClementine remote sensing data to constrain probable ori-gins of the exotic basalt fragments (i.e., fromMare Tranquil-litatis, Mare Nectaris/Sinus Asperitatis, Mare Vaporum).
The basalts from Apollo 16 reported here were found asclasts in breccia sample 60639 (original mass 175.1 g),which is a polymict fragmental breccia rake sample, col-lected near the Apollo 16 Lunar Module (LM). The samplecontains a variety of lithic clasts including mare basalt andanorthosite, as well as poikilitic, aphanitic, and glassyimpact-melt breccias (Ryder and Norman, 1980). A basaltclast from 60639 was first examined by Dowty et al.(1974), who posited that it was chemically similar to sub-ophitic Luna 16 basalts based on broad-beam electronmicroprobe analysis. Delano (1975) included this basaltclast (60639,1) in his larger study of Apollo 16 mare-derived rocks and glasses and agreed with the conclusionof Dowty et al. (1974). Subsequent studies (Murali et al.,1976; Ma et al., 1976) suggested that the major- andtrace-element concentrations in the 60639,1 basalt clastwere similar to low alkali Apollo 11 and 17 high-Ti basalts.Given the geologic context of the Apollo 16 mission, whoseprime objective was to sample highlands material (cf.,Hinners, 1972), any basalt fragment can be considered exo-tic and thus is of particular interest, as it may represent abasalt type that has not been previously sampled and froma location hitherto unexamined.
The purpose of this study is to characterize two recentlydiscovered basalt clasts from Apollo 16 breccia 60639, as
well as to re-examine the previously studied basalt clast(Dowty et al., 1974; Delano, 1975; Murali et al., 1976;Ma et al., 1976) with newer analytical techniques. New min-eral and whole-rock data augment the sparse petrographicdataset for basalts from the Apollo 16 landing site (cf.,Delano, 1975; Zeigler et al., 2006) and directly addressthe call to quantify the variability of lunar basalts set forthby the National Research Council Report (2007). The brec-cia matrix was also analyzed to determine if some of thebasalt sample aliquots were actually mixtures of basaltand matrix. We examine major and trace element composi-tions of mineral phases in the previously studied thin-section 60639,2, which is the same sample examined byDowty et al. (1974) and originates from Clast 1 (Table 2;Fig. 1). We also examine two thin-sections made fromtwo ‘‘new” clasts discovered during a visit to the CuratorialFacility at Johnson Space Center and referred to here as
A.L. Fagan, C.R. Neal /Geochimica et Cosmochimica Acta 173 (2016) 352–372 355
Clasts 2 and 3 (Table 2; Fig. 1). The new data are put in thecontext of other lunar basalt compositions and a petroge-netic model is developed for the 60639 basalt clasts.
2. GEOLOGIC CONTEXT AND SAMPLE
DESCRIPTION
Sample 60639 was collected during Extra-VehicularActivity 3 of the Apollo 16 mission at station 100, whichwas also known as the general location of the Lunar Mod-ule (LM) and Apollo Lunar Surface Experiments Package(ALSEP). Station 100 lies approximately 70 m W-SW ofthe LM in a region with approximately level terrain, no cra-ters in the immediate vicinity, and with �1/8 of the col-lected rocks having been buried in the regolith (Sutton,1981). The top portion of 60639 is completely coated inglass (Morris et al., 1986), but the remaining sides are freeof such a coating. The newly discovered basalt clasts onceresided on the bottom side of 60639 in close proximity toan anorthosite fragment (Warren and Wasson, 1978).
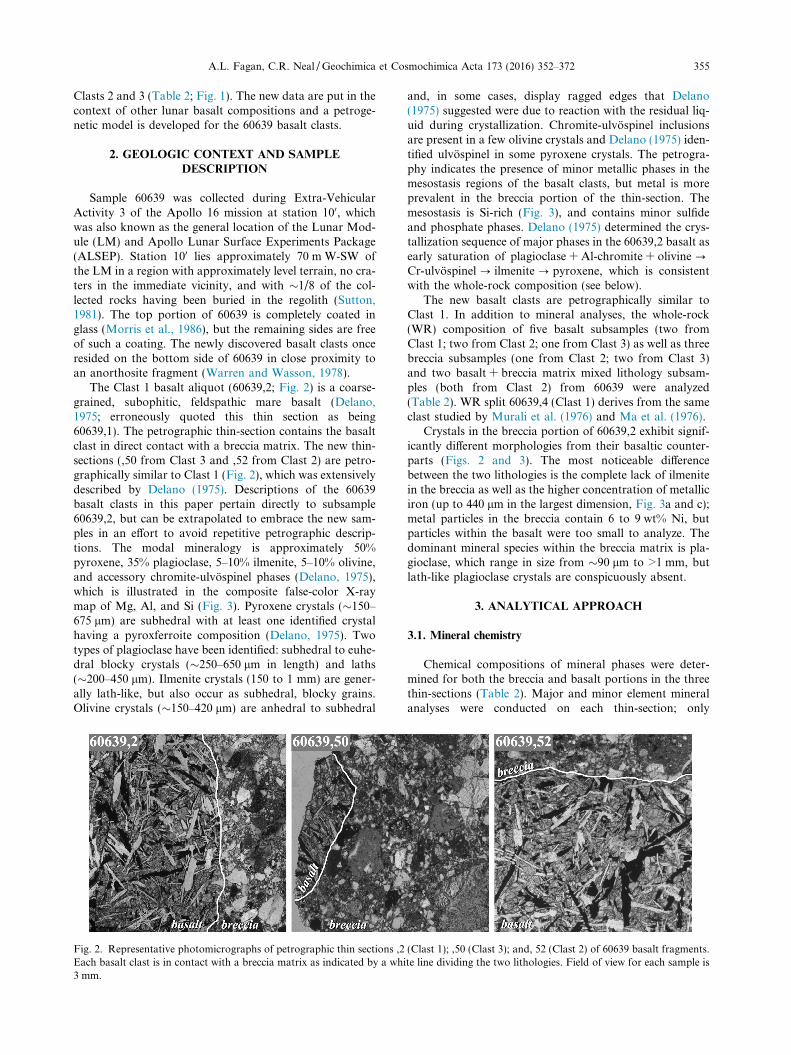
The Clast 1 basalt aliquot (60639,2; Fig. 2) is a coarse-grained, subophitic, feldspathic mare basalt (Delano,1975; erroneously quoted this thin section as being60639,1). The petrographic thin-section contains the basaltclast in direct contact with a breccia matrix. The new thin-sections (,50 from Clast 3 and ,52 from Clast 2) are petro-graphically similar to Clast 1 (Fig. 2), which was extensivelydescribed by Delano (1975). Descriptions of the 60639basalt clasts in this paper pertain directly to subsample60639,2, but can be extrapolated to embrace the new sam-ples in an effort to avoid repetitive petrographic descrip-tions. The modal mineralogy is approximately 50%pyroxene, 35% plagioclase, 5–10% ilmenite, 5–10% olivine,and accessory chromite-ulvospinel phases (Delano, 1975),which is illustrated in the composite false-color X-raymap of Mg, Al, and Si (Fig. 3). Pyroxene crystals (�150–675 lm) are subhedral with at least one identified crystalhaving a pyroxferroite composition (Delano, 1975). Twotypes of plagioclase have been identified: subhedral to euhe-dral blocky crystals (�250–650 lm in length) and laths(�200–450 lm). Ilmenite crystals (150 to 1 mm) are gener-ally lath-like, but also occur as subhedral, blocky grains.Olivine crystals (�150–420 lm) are anhedral to subhedral
Fig. 2. Representative photomicrographs of petrographic thin sections ,2Each basalt clast is in contact with a breccia matrix as indicated by a wh3 mm.
and, in some cases, display ragged edges that Delano(1975) suggested were due to reaction with the residual liq-uid during crystallization. Chromite-ulvospinel inclusionsare present in a few olivine crystals and Delano (1975) iden-tified ulvospinel in some pyroxene crystals. The petrogra-phy indicates the presence of minor metallic phases in themesostasis regions of the basalt clasts, but metal is moreprevalent in the breccia portion of the thin-section. Themesostasis is Si-rich (Fig. 3), and contains minor sulfideand phosphate phases. Delano (1975) determined the crys-tallization sequence of major phases in the 60639,2 basalt asearly saturation of plagioclase + Al-chromite + olivine ?Cr-ulvospinel ? ilmenite ? pyroxene, which is consistentwith the whole-rock composition (see below).
The new basalt clasts are petrographically similar toClast 1. In addition to mineral analyses, the whole-rock(WR) composition of five basalt subsamples (two fromClast 1; two from Clast 2; one from Clast 3) as well as threebreccia subsamples (one from Clast 2; two from Clast 3)and two basalt + breccia matrix mixed lithology subsam-ples (both from Clast 2) from 60639 were analyzed(Table 2). WR split 60639,4 (Clast 1) derives from the sameclast studied by Murali et al. (1976) and Ma et al. (1976).
Crystals in the breccia portion of 60639,2 exhibit signif-icantly different morphologies from their basaltic counter-parts (Figs. 2 and 3). The most noticeable differencebetween the two lithologies is the complete lack of ilmenitein the breccia as well as the higher concentration of metalliciron (up to 440 lm in the largest dimension, Fig. 3a and c);metal particles in the breccia contain 6 to 9 wt% Ni, butparticles within the basalt were too small to analyze. Thedominant mineral species within the breccia matrix is pla-gioclase, which range in size from �90 lm to >1 mm, butlath-like plagioclase crystals are conspicuously absent.
3. ANALYTICAL APPROACH
3.1. Mineral chemistry
Chemical compositions of mineral phases were deter-mined for both the breccia and basalt portions in the threethin-sections (Table 2). Major and minor element mineralanalyses were conducted on each thin-section; only
(Clast 1); ,50 (Clast 3); and, 52 (Clast 2) of 60639 basalt fragments.ite line dividing the two lithologies. Field of view for each sample is
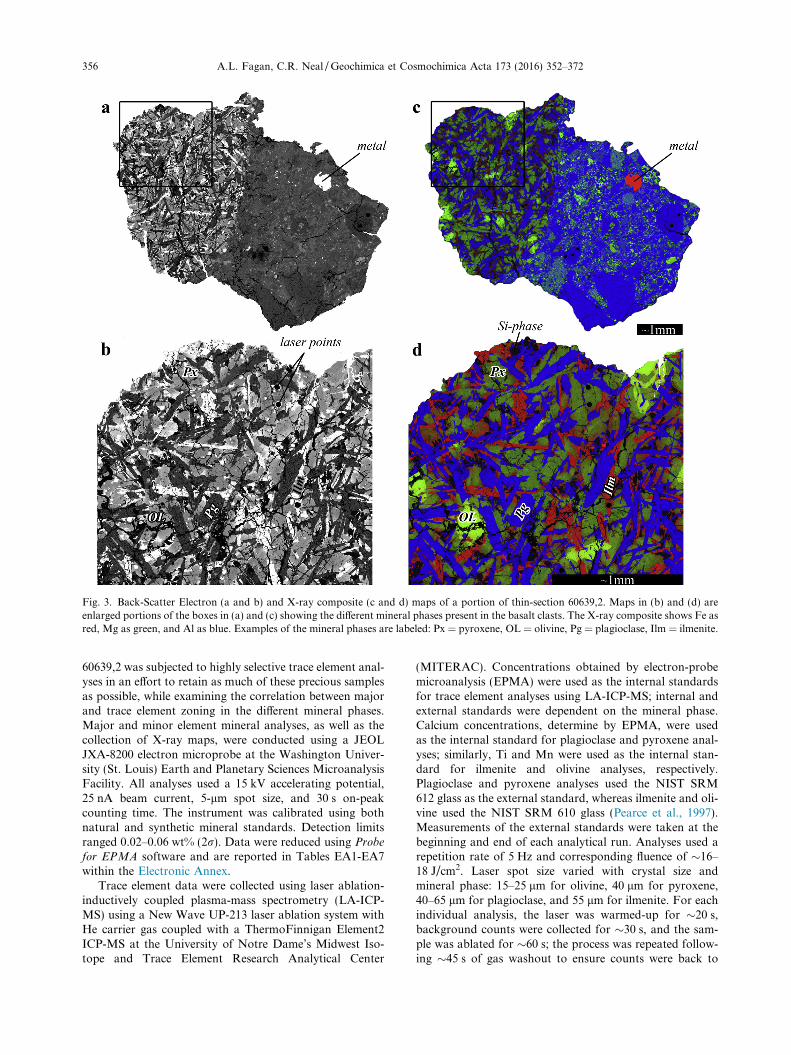
Fig. 3. Back-Scatter Electron (a and b) and X-ray composite (c and d) maps of a portion of thin-section 60639,2. Maps in (b) and (d) areenlarged portions of the boxes in (a) and (c) showing the different mineral phases present in the basalt clasts. The X-ray composite shows Fe asred, Mg as green, and Al as blue. Examples of the mineral phases are labeled: Px = pyroxene, OL = olivine, Pg = plagioclase, Ilm = ilmenite.
356 A.L. Fagan, C.R. Neal /Geochimica et Cosmochimica Acta 173 (2016) 352–372
60639,2 was subjected to highly selective trace element anal-yses in an effort to retain as much of these precious samplesas possible, while examining the correlation between majorand trace element zoning in the different mineral phases.Major and minor element mineral analyses, as well as thecollection of X-ray maps, were conducted using a JEOLJXA-8200 electron microprobe at the Washington Univer-sity (St. Louis) Earth and Planetary Sciences MicroanalysisFacility. All analyses used a 15 kV accelerating potential,25 nA beam current, 5-lm spot size, and 30 s on-peakcounting time. The instrument was calibrated using bothnatural and synthetic mineral standards. Detection limitsranged 0.02–0.06 wt% (2r). Data were reduced using Probe
for EPMA software and are reported in Tables EA1-EA7within the Electronic Annex.
Trace element data were collected using laser ablation-inductively coupled plasma-mass spectrometry (LA-ICP-MS) using a New Wave UP-213 laser ablation system withHe carrier gas coupled with a ThermoFinnigan Element2ICP-MS at the University of Notre Dame’s Midwest Iso-tope and Trace Element Research Analytical Center
(MITERAC). Concentrations obtained by electron-probemicroanalysis (EPMA) were used as the internal standardsfor trace element analyses using LA-ICP-MS; internal andexternal standards were dependent on the mineral phase.Calcium concentrations, determine by EPMA, were usedas the internal standard for plagioclase and pyroxene anal-yses; similarly, Ti and Mn were used as the internal stan-dard for ilmenite and olivine analyses, respectively.Plagioclase and pyroxene analyses used the NIST SRM612 glass as the external standard, whereas ilmenite and oli-vine used the NIST SRM 610 glass (Pearce et al., 1997).Measurements of the external standards were taken at thebeginning and end of each analytical run. Analyses used arepetition rate of 5 Hz and corresponding fluence of �16–18 J/cm2. Laser spot size varied with crystal size andmineral phase: 15–25 lm for olivine, 40 lm for pyroxene,40–65 lm for plagioclase, and 55 lm for ilmenite. For eachindividual analysis, the laser was warmed-up for �20 s,background counts were collected for �30 s, and the sam-ple was ablated for �60 s; the process was repeated follow-ing �45 s of gas washout to ensure counts were back to
A.L. Fagan, C.R. Neal /Geochimica et Cosmochimica Acta 173 (2016) 352–372 357
original background levels. Elemental concentrations werecalculated using GLITTER� software (Van Achterberghet al., 2001; XP version, Simon Jackson, Macquarie Univer-sity) and are reported with uncertainties in Tables EA1-EA7 in the Electronic Annex.
3.2. Whole-rock chemistry
The basaltic clasts were plucked from 60639 by the cura-torial staff at Johnson Space Center using stainless steeltools and the aliquots sent to the University of NotreDame. All sides of each fragment were examined and pho-tographed under the microscope to determine if the frag-ment was composed of (1) pure basalt, (2) breccia matrix,or (3) a mixed lithology of basalt + breccia matrix (Table 3).Where appropriate, aliquots were split into subsamplesbased on lithologic type as defined by: basalt, breccia, ora mixed lithology (basalt + breccia matrix). Some aliquotscontained large amounts of breccia matrix that were unableto be successfully removed entirely from the basalt por-tions, thus these were classified as basalt + breccia mix-tures. Two aliquots from Clast 1 (,1A and ,4; Table 3)were not subject to subdivision, as they were determinedupon inspection to be composed entirely of basalt. Each ali-quot and subdivision was hand-ground with an agate mor-tar and pestle in a Class 1000 clean laboratory; the mortarand pestle were cleaned with ultrapure (double distilled)HNO3 (diluted to 5% with 18 MX H2O) and thoroughlydried prior to use and between samples to avoid cross-contamination. Each sample was dissolved in ultrapureHF and HNO3, in a ratio of 2:1, before being brought toa final volume of �100 g (�10 g for smaller samples; i.e.,aliquots ,4 and ,45; see Table 3) in 5% HNO3. Dilution fac-tors were noted and applied during data reduction. Thisdissolution does not allow Si to be directly measured, asdissolution in hydrofluoric acid forms volatile silicatetrafluoride, but it does allow all other major (and minor)elements to be quantified along with trace elements on thesame sample aliquot. The SiO2 concentration was calcu-lated by difference. Given the low sample masses, this
Table 3Sample masses of aliquot subsamples used in determination of60639 whole-rock chemistry.
60639 Subsample Lithology in subsplit* Mass (g)
,1A B 0.057,4 B 0.003,44 B 0.048
M 0.028,45 B 0.002
M 0.018X 0.055
,48 B 0.024M 0.035X 0.013
*Abbreviations for lithologies present in appropriate subsplits areas follows: B-basalt, X-breccia matrix, M-mixture of basalt andbreccia matrix.
method maximized the amount of data obtained for suchsmall samples.
Major and minor element concentrations were quanti-fied in solution-mode using a Perkin Elmer 3300 XLOptima ICP-Optical Emission Spectrometry (ICP-OES) atthe University of Notre Dame’s Center for EnvironmentalScience and Technology (CEST). Instrument sensitivitywas quantified using 6 calibration solutions of known con-centrations, including a blank solution, and to the U.S.Geological Survey (USGS) basalt Standard ReferenceMaterial (SRM) BIR-1 (Flanagan, 1984; Gladney andRoelandts, 1988; Govindaruju, 1994). Three additionalUSGS SRMs (BHVO-1, BHVO-2, BCR-2) and two proce-dural blanks were also analyzed as unknowns (‘‘unk”).Throughout the analyses, blanks (bk) and drift (D) correc-tion samples were analyzed to follow instrument precisionand drift in the analysis order of: D-unk-bk-unk-D-SRM-unk-bk-unk-repeat. Most aliquots and subsequent divisionswere analyzed in triplicate for major element concentra-tions; exceptions were ,4-B (Clast 1) and ,45-B (Clast 2),which were only run in duplicate due to small sample sizes(Table 3). Each individual analysis represents an average ofthree consecutive measurements by the ICP-OES. Thismethod for determining major elements in whole-rock sam-ples via ICP-OES is described in more detail in Mahoneyet al. (2001).
Trace element concentration data were collected viasolution-mode ICP-MS with the Thermo-Finnigan Elemen-t2 ICP-MS instrument at MITERAC. The protocol of Neal(2001) was followed for analyses and data reduction (usingthe standard addition method). Procedural blanks andUSGS SRMs were analyzed as unknowns. With the excep-tion of the two smallest samples (,4-B and ,45-B), each sam-ple was analyzed in duplicate. Some analyzed aliquots ofthe USGS SRMs had similar masses to the large(�0.05 g) basalt clasts whereas others were similar to thesmaller mass basalt clasts (�0.003 g). Both sample sizesreproduced the reference data for these SRMs, which illus-trates the representative nature of analyzing small masses.In addition, the relative homogeneity of the 60639 basaltssuggests the small sample size did not introduce errorsdue to unrepresentative sampling.
3.3. Textural analysis
As a complement to compositional analyses, crystal sizedistributions (CSDs) can be used to quantitatively investi-gate igneous processes through the use of texture (e.g.,Cashman and Marsh, 1988; Higgins, 1996). PlagioclaseCSDs were determined for the basalt portion of Clasts 1and 2 (thin sections ,2 and ,52). A CSD analysis was notperformed on Clast 3 (,50) due to the small size of the basaltclast represented in the section (Fig. 2) and subsequentsmall population (<100) of plagioclase crystals; at least250 crystals are deemed necessary to perform a statisticallysignificant CSD analysis (Morgan and Jerram, 2006).Although pyroxene is more abundant in the basalt than pla-gioclase, the boundaries of the pyroxene grains are difficultto determine based on visual inspection of the thin section,thus plagioclase was selected as the preferred phase for
358 A.L. Fagan, C.R. Neal /Geochimica et Cosmochimica Acta 173 (2016) 352–372
analyses. Furthermore, plagioclase CSDs can be directlycompared to recent plagioclase CSDs from other Apollobasalts (Hui et al., 2011; Neal et al., 2015).
Individual plagioclase crystals were traced from digitalphotomicrographs using Adobe Photoshop� and importedinto ImageJ (Higgins and Chandrasekharam, 2007), whichcan be used to measure the major and minor axes,roundness, and area of each crystal. Crystals with dimen-sions < 0.03 mm, approximately the thickness of thethin-section, are likely to be a projection of the crystalrather than an accurate measurement, thus crystals withthe minor axis < 0.03 mm were eliminated so as not to skewthe final dataset (Higgins, 2000). The major and minor axesof selected crystals were imported into CSDslice (Morganand Jerram, 2006) to determine the best-fit short, interme-diate, and long axes of the 3-D crystal habit. All determinedcrystal dimensions, habit, and total sample area wereimported into CSD corrections 1.39 (Higgins, 2000, 2002;Higgins and Chandrasekharam, 2007), which calculatesthe 3-D CSD using 5 bins per decade. CSDs are tradition-ally represented as the natural log of the population densityagainst the corrected crystal size length (Cashman andMarsh, 1988).
4. RESULTS
4.1. Mineral phase analyses
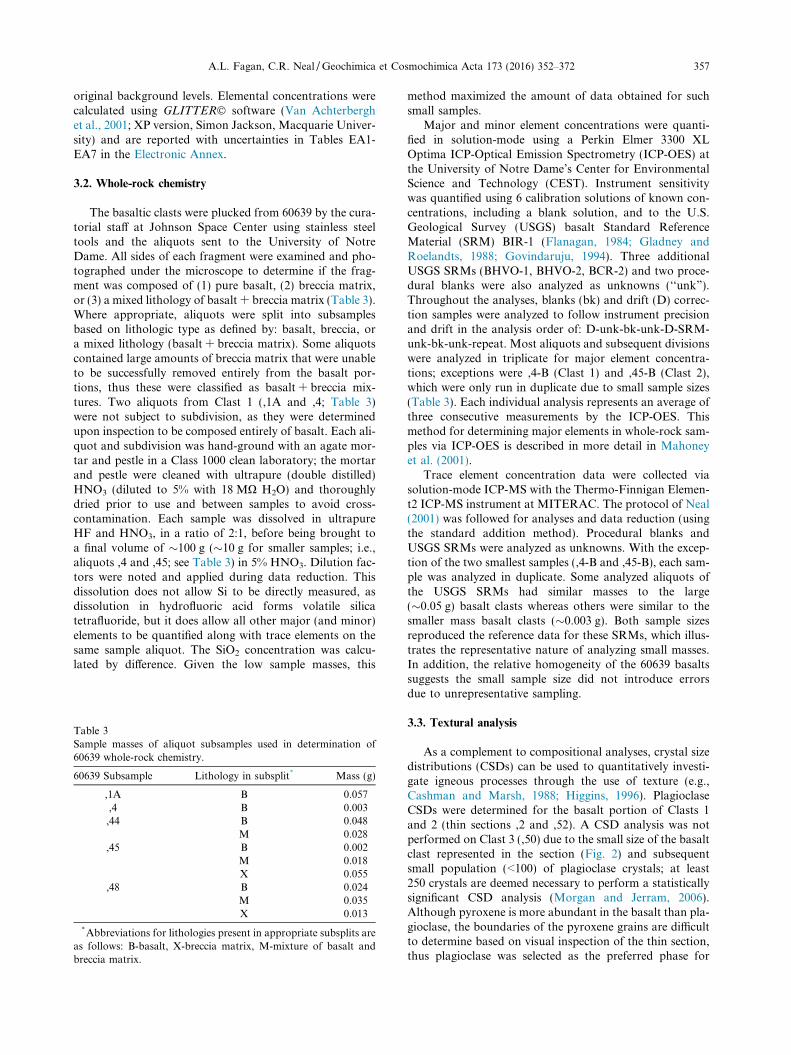
Individual mineral chemistries are reported in the Elec-tronic Annex (Tables EA1-EA7) in order of the modal min-eralogy of the 60639 basalt clasts (Delano, 1975);representative major- and minor-element mineral analysesare listed in Table 4. Pyroxene is the most abundant phasein the basalts (�50%) and is predominantly augite in com-position, similar to Apollo 11 and 17 basalts (Fig. 4;Table EA1). Some pyroxene crystals are zoned with augitecores ranging to an Fe-rich rim. Pyroxene analyses from thebasalt clasts reveal the presence of at least two Mg-rich andthree Fe-rich pigeonite cores. The major element composi-tion of pyroxenes, which are less common in the breccia,are generally similar between the different lithologies(Fig. 4a); an exception to this similarity is two enstatitegrains (Wo1.9�2.6En51.9�55.4Fs42.1�46.2) found in the brecciathat is associated with Clast 3. Only pyroxenes from theClast 1 basalt and Clast 3 breccia are Fe-rich.
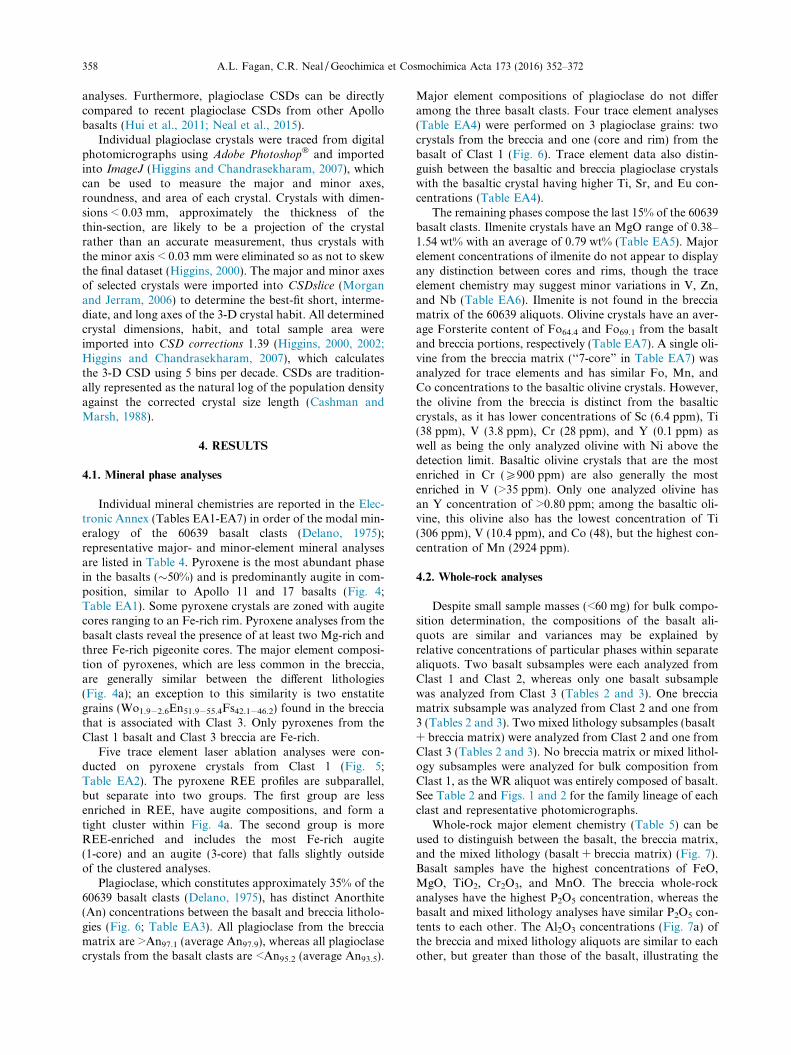
Five trace element laser ablation analyses were con-ducted on pyroxene crystals from Clast 1 (Fig. 5;Table EA2). The pyroxene REE profiles are subparallel,but separate into two groups. The first group are lessenriched in REE, have augite compositions, and form atight cluster within Fig. 4a. The second group is moreREE-enriched and includes the most Fe-rich augite(1-core) and an augite (3-core) that falls slightly outsideof the clustered analyses.
Plagioclase, which constitutes approximately 35% of the60639 basalt clasts (Delano, 1975), has distinct Anorthite(An) concentrations between the basalt and breccia litholo-gies (Fig. 6; Table EA3). All plagioclase from the brecciamatrix are >An97.1 (average An97.9), whereas all plagioclasecrystals from the basalt clasts are <An95.2 (average An93.5).
Major element compositions of plagioclase do not differamong the three basalt clasts. Four trace element analyses(Table EA4) were performed on 3 plagioclase grains: twocrystals from the breccia and one (core and rim) from thebasalt of Clast 1 (Fig. 6). Trace element data also distin-guish between the basaltic and breccia plagioclase crystalswith the basaltic crystal having higher Ti, Sr, and Eu con-centrations (Table EA4).
The remaining phases compose the last 15% of the 60639basalt clasts. Ilmenite crystals have an MgO range of 0.38–1.54 wt% with an average of 0.79 wt% (Table EA5). Majorelement concentrations of ilmenite do not appear to displayany distinction between cores and rims, though the traceelement chemistry may suggest minor variations in V, Zn,and Nb (Table EA6). Ilmenite is not found in the brecciamatrix of the 60639 aliquots. Olivine crystals have an aver-age Forsterite content of Fo64.4 and Fo69.1 from the basaltand breccia portions, respectively (Table EA7). A single oli-vine from the breccia matrix (‘‘7-core” in Table EA7) wasanalyzed for trace elements and has similar Fo, Mn, andCo concentrations to the basaltic olivine crystals. However,the olivine from the breccia is distinct from the basalticcrystals, as it has lower concentrations of Sc (6.4 ppm), Ti(38 ppm), V (3.8 ppm), Cr (28 ppm), and Y (0.1 ppm) aswell as being the only analyzed olivine with Ni above thedetection limit. Basaltic olivine crystals that are the mostenriched in Cr (P900 ppm) are also generally the mostenriched in V (>35 ppm). Only one analyzed olivine hasan Y concentration of >0.80 ppm; among the basaltic oli-vine, this olivine also has the lowest concentration of Ti(306 ppm), V (10.4 ppm), and Co (48), but the highest con-centration of Mn (2924 ppm).
4.2. Whole-rock analyses
Despite small sample masses (<60 mg) for bulk compo-sition determination, the compositions of the basalt ali-quots are similar and variances may be explained byrelative concentrations of particular phases within separatealiquots. Two basalt subsamples were each analyzed fromClast 1 and Clast 2, whereas only one basalt subsamplewas analyzed from Clast 3 (Tables 2 and 3). One brecciamatrix subsample was analyzed from Clast 2 and one from3 (Tables 2 and 3). Two mixed lithology subsamples (basalt+ breccia matrix) were analyzed from Clast 2 and one fromClast 3 (Tables 2 and 3). No breccia matrix or mixed lithol-ogy subsamples were analyzed for bulk composition fromClast 1, as the WR aliquot was entirely composed of basalt.See Table 2 and Figs. 1 and 2 for the family lineage of eachclast and representative photomicrographs.
Whole-rock major element chemistry (Table 5) can beused to distinguish between the basalt, the breccia matrix,and the mixed lithology (basalt + breccia matrix) (Fig. 7).Basalt samples have the highest concentrations of FeO,MgO, TiO2, Cr2O3, and MnO. The breccia whole-rockanalyses have the highest P2O5 concentration, whereas thebasalt and mixed lithology analyses have similar P2O5 con-tents to each other. The Al2O3 concentrations (Fig. 7a) ofthe breccia and mixed lithology aliquots are similar to eachother, but greater than those of the basalt, illustrating the
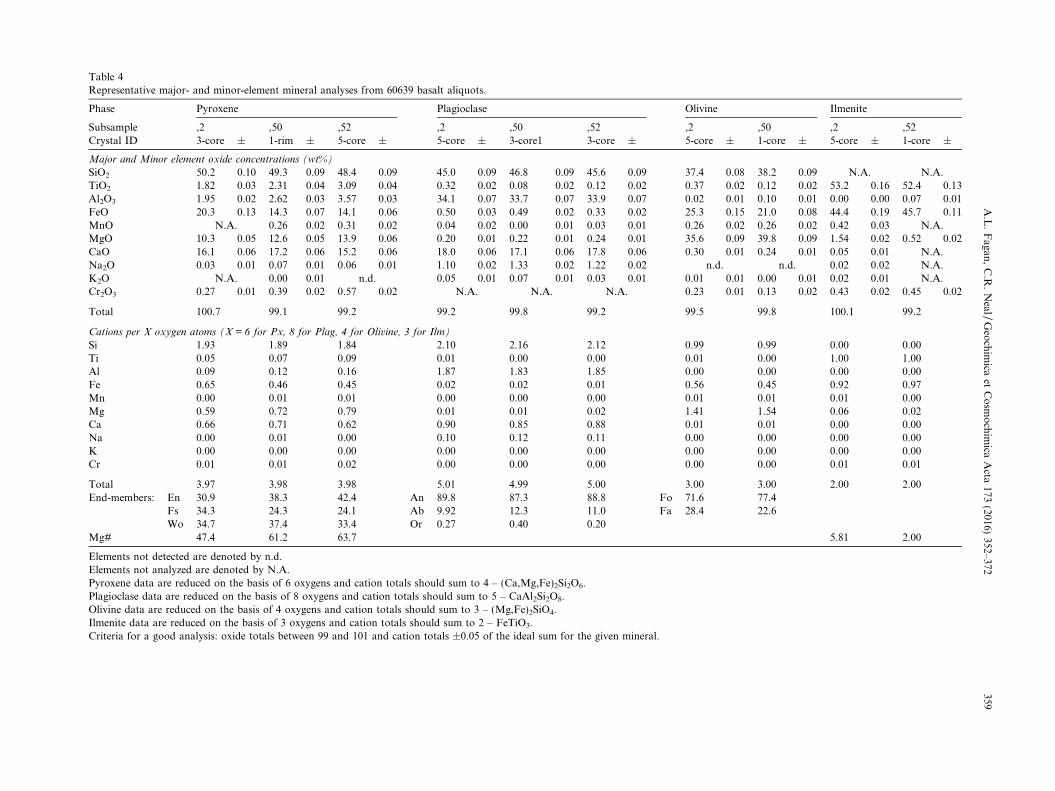
Table 4Representative major- and minor-element mineral analyses from 60639 basalt aliquots.
Phase Pyroxene Plagioclase Olivine Ilmenite
Subsample ,2 ,50 ,52 ,2 ,50 ,52 ,2 ,50 ,2 ,52Crystal ID 3-core ± 1-rim ± 5-core ± 5-core ± 3-core1 3-core ± 5-core ± 1-core ± 5-core ± 1-core ±
Major and Minor element oxide concentrations (wt%)
SiO2 50.2 0.10 49.3 0.09 48.4 0.09 45.0 0.09 46.8 0.09 45.6 0.09 37.4 0.08 38.2 0.09 N.A. N.A.TiO2 1.82 0.03 2.31 0.04 3.09 0.04 0.32 0.02 0.08 0.02 0.12 0.02 0.37 0.02 0.12 0.02 53.2 0.16 52.4 0.13Al2O3 1.95 0.02 2.62 0.03 3.57 0.03 34.1 0.07 33.7 0.07 33.9 0.07 0.02 0.01 0.10 0.01 0.00 0.00 0.07 0.01FeO 20.3 0.13 14.3 0.07 14.1 0.06 0.50 0.03 0.49 0.02 0.33 0.02 25.3 0.15 21.0 0.08 44.4 0.19 45.7 0.11MnO N.A. 0.26 0.02 0.31 0.02 0.04 0.02 0.00 0.01 0.03 0.01 0.26 0.02 0.26 0.02 0.42 0.03 N.A.MgO 10.3 0.05 12.6 0.05 13.9 0.06 0.20 0.01 0.22 0.01 0.24 0.01 35.6 0.09 39.8 0.09 1.54 0.02 0.52 0.02CaO 16.1 0.06 17.2 0.06 15.2 0.06 18.0 0.06 17.1 0.06 17.8 0.06 0.30 0.01 0.24 0.01 0.05 0.01 N.A.Na2O 0.03 0.01 0.07 0.01 0.06 0.01 1.10 0.02 1.33 0.02 1.22 0.02 n.d. n.d. 0.02 0.02 N.A.K2O N.A. 0.00 0.01 n.d. 0.05 0.01 0.07 0.01 0.03 0.01 0.01 0.01 0.00 0.01 0.02 0.01 N.A.Cr2O3 0.27 0.01 0.39 0.02 0.57 0.02 N.A. N.A. N.A. 0.23 0.01 0.13 0.02 0.43 0.02 0.45 0.02
Total 100.7 99.1 99.2 99.2 99.8 99.2 99.5 99.8 100.1 99.2
Cations per X oxygen atoms (X = 6 for Px, 8 for Plag, 4 for Olivine, 3 for Ilm)
Si 1.93 1.89 1.84 2.10 2.16 2.12 0.99 0.99 0.00 0.00Ti 0.05 0.07 0.09 0.01 0.00 0.00 0.01 0.00 1.00 1.00Al 0.09 0.12 0.16 1.87 1.83 1.85 0.00 0.00 0.00 0.00Fe 0.65 0.46 0.45 0.02 0.02 0.01 0.56 0.45 0.92 0.97Mn 0.00 0.01 0.01 0.00 0.00 0.00 0.01 0.01 0.01 0.00Mg 0.59 0.72 0.79 0.01 0.01 0.02 1.41 1.54 0.06 0.02Ca 0.66 0.71 0.62 0.90 0.85 0.88 0.01 0.01 0.00 0.00Na 0.00 0.01 0.00 0.10 0.12 0.11 0.00 0.00 0.00 0.00K 0.00 0.00 0.00 0.00 0.00 0.00 0.00 0.00 0.00 0.00Cr 0.01 0.01 0.02 0.00 0.00 0.00 0.00 0.00 0.01 0.01
Total 3.97 3.98 3.98 5.01 4.99 5.00 3.00 3.00 2.00 2.00End-members: En 30.9 38.3 42.4 An 89.8 87.3 88.8 Fo 71.6 77.4
Fs 34.3 24.3 24.1 Ab 9.92 12.3 11.0 Fa 28.4 22.6Wo 34.7 37.4 33.4 Or 0.27 0.40 0.20
Mg# 47.4 61.2 63.7 5.81 2.00
Elements not detected are denoted by n.d.Elements not analyzed are denoted by N.A.Pyroxene data are reduced on the basis of 6 oxygens and cation totals should sum to 4 – (Ca,Mg,Fe)2Si2O6.Plagioclase data are reduced on the basis of 8 oxygens and cation totals should sum to 5 – CaAl2Si2O8.Olivine data are reduced on the basis of 4 oxygens and cation totals should sum to 3 – (Mg,Fe)2SiO4.Ilmenite data are reduced on the basis of 3 oxygens and cation totals should sum to 2 – FeTiO3.Criteria for a good analysis: oxide totals between 99 and 101 and cation totals ±0.05 of the ideal sum for the given mineral.
A.L.Fagan
,C.R
.Neal/
Geochim
icaet
Cosm
ochim
icaActa
173(2016)
352–372359
Fig. 4. Major element compositions of pyroxene from (a) 60639basalt and breccia lithologies and (b) pyroxene compositional fieldsfrom Apollo 11 and 17 high-Ti basalts Papike et al. (1976).
Fig. 5. REE compositions of selected basaltic pyroxene from60639,2. The REE data are normalized to chondritic meteorites(Anders and Grevesse, 1989).
Fig. 6. Plagioclase major element (An% vs. TiO2) compositions.Average error bars are shown and have been estimated from repeatanalyses.
360 A.L. Fagan, C.R. Neal /Geochimica et Cosmochimica Acta 173 (2016) 352–372
dominance of plagioclase in the breccia. All three lithologictypes represented here have overlapping concentrations ofCaO, K2O, and Na2O (Table 5).
The three analyzed lithologic groups are enriched inincompatible trace elements (Table 6, see Table 7 for USGSStandard Reference Materials) relative to chondrites (cf.,Anders and Grevesse, 1989; Fig. 7c). The basalt subsamplesare enriched in Sc, V, Cr, Cu, Zn, Sr, Y, Zr, and Hf. Themixed lithology and breccia matrix subsamples exhibithigher concentrations of Ni and Co in response to thehigher concentration of metal in the breccia (Table 6;Fig. 3). High-field strength elements also show a distinctionbetween the groups: the basalt subsamples are the richest inHf, Zr, Ta, and Y, but exhibit the lowest concentration ofU and Th. In contrast, the breccia subsamples have thehighest Th, whereas the mixed lithology subsamples gener-ally exhibit low Zr, Hf, Y, and Ta but yield concentrationsof Th and U that are intermediate to the basalt and brecciaanalyses. Among the large ion lithophile elements, thebasalt subsamples have the highest concentration of Sr,but have the lowest Rb and Cs concentrations. In contrast,the breccia subsamples have the highest Rb and the mixedlithology subsamples have the lowest Ba; the mixed lithol-ogy and breccia subsamples have similar Cs and Sr concen-
trations to each other. Finally, the breccia and mixedlithology subsamples are more enriched in Pb than thebasalt subsamples by a factor of 2 to 4.
The REE profiles of the basalt clasts are subparallel andexhibit a slight concave down shape with a maximum in themiddle REE (Fig. 7c). In contrast, both the breccia matrixand the mixed lithology subsamples display subparallel,LREE-enriched profiles and all exhibit a strong negativeEu anomaly. The Clast 3 breccia is enriched in the REE rel-ative to the Clast 2 breccia, although the profiles are sub-parallel. Most notably, although the mixed lithology is acombination of basalt clast + breccia matrix, the REE pro-files of these samples do not appear to reflect this associa-tion, as the mixed lithology subsamples do not displayREE profiles purely intermediate to the basalt and breccia.
4.3. Crystal size distributions (CSD)
Plagioclase from the basalt portions of the Clasts 1 (,2)and 2 (,52) petrographic thin-sections have similar CSDprofiles (Fig. 8a). Both CSDs are approximately linearand subparallel to each other. Clast 1 displays a downwardcurve at low crystal populations and Clast 2 appears tohave a deficit of crystals in the �0.3 mm size range. If, how-ever, the Clast 2 CSD is extrapolated between the �0.5 mmand the �0.2 mm size bins, it is remarkably similar to thatof Clast 1. The overall shapes of these plagioclase CSDs aresimilar to those from Apollo 14 high-Al Group B and Cbasalts (Fig. 8c and d), but not Group A basalts (Fig. 8b)(Hui et al., 2011; Neal et al., 2015).
5. INTERPRETATION AND DISCUSSION
5.1. Textural analyses
The linear nature of the basaltic plagioclase CSDs(Fig. 8) indicate uninterrupted crystal nucleation and
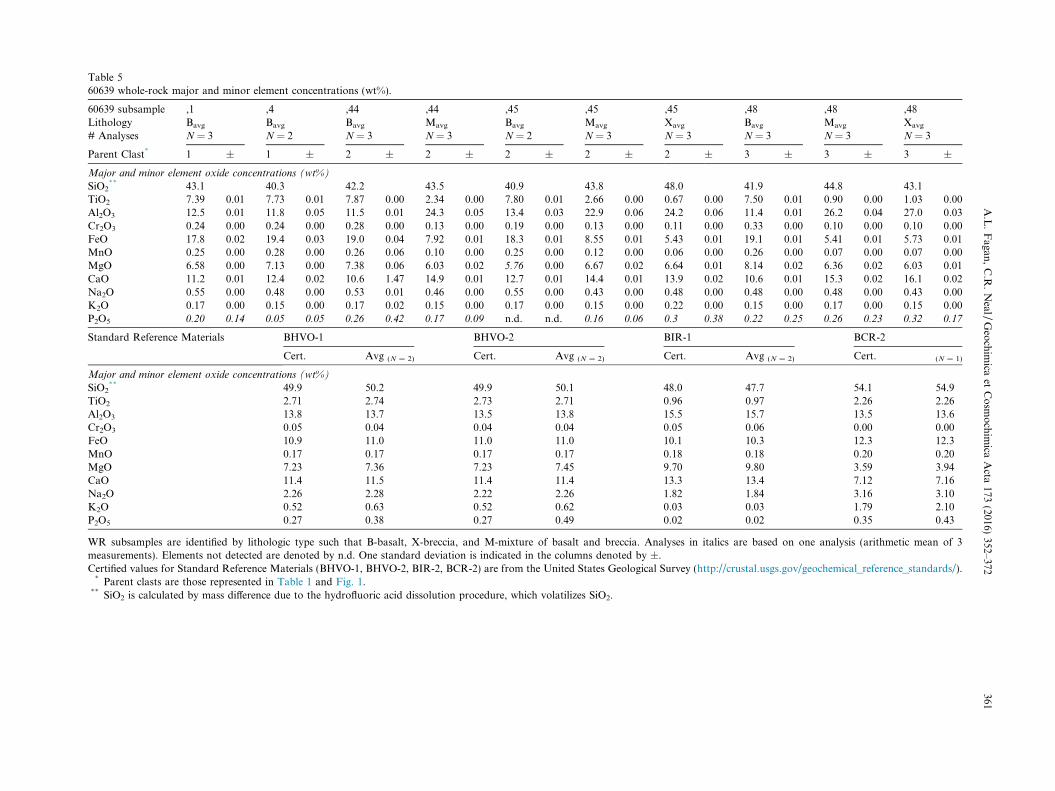
Table 560639 whole-rock major and minor element concentrations (wt%).
60639 subsample ,1 ,4 ,44 ,44 ,45 ,45 ,45 ,48 ,48 ,48Lithology Bavg Bavg Bavg Mavg Bavg Mavg Xavg Bavg Mavg Xavg
# Analyses N = 3 N = 2 N = 3 N = 3 N = 2 N = 3 N = 3 N = 3 N = 3 N = 3
Parent Clast* 1 ± 1 ± 2 ± 2 ± 2 ± 2 ± 2 ± 3 ± 3 ± 3 ±
Major and minor element oxide concentrations (wt%)
SiO2** 43.1 40.3 42.2 43.5 40.9 43.8 48.0 41.9 44.8 43.1
TiO2 7.39 0.01 7.73 0.01 7.87 0.00 2.34 0.00 7.80 0.01 2.66 0.00 0.67 0.00 7.50 0.01 0.90 0.00 1.03 0.00Al2O3 12.5 0.01 11.8 0.05 11.5 0.01 24.3 0.05 13.4 0.03 22.9 0.06 24.2 0.06 11.4 0.01 26.2 0.04 27.0 0.03Cr2O3 0.24 0.00 0.24 0.00 0.28 0.00 0.13 0.00 0.19 0.00 0.13 0.00 0.11 0.00 0.33 0.00 0.10 0.00 0.10 0.00FeO 17.8 0.02 19.4 0.03 19.0 0.04 7.92 0.01 18.3 0.01 8.55 0.01 5.43 0.01 19.1 0.01 5.41 0.01 5.73 0.01MnO 0.25 0.00 0.28 0.00 0.26 0.06 0.10 0.00 0.25 0.00 0.12 0.00 0.06 0.00 0.26 0.00 0.07 0.00 0.07 0.00MgO 6.58 0.00 7.13 0.00 7.38 0.06 6.03 0.02 5.76 0.00 6.67 0.02 6.64 0.01 8.14 0.02 6.36 0.02 6.03 0.01CaO 11.2 0.01 12.4 0.02 10.6 1.47 14.9 0.01 12.7 0.01 14.4 0.01 13.9 0.02 10.6 0.01 15.3 0.02 16.1 0.02Na2O 0.55 0.00 0.48 0.00 0.53 0.01 0.46 0.00 0.55 0.00 0.43 0.00 0.48 0.00 0.48 0.00 0.48 0.00 0.43 0.00K2O 0.17 0.00 0.15 0.00 0.17 0.02 0.15 0.00 0.17 0.00 0.15 0.00 0.22 0.00 0.15 0.00 0.17 0.00 0.15 0.00P2O5 0.20 0.14 0.05 0.05 0.26 0.42 0.17 0.09 n.d. n.d. 0.16 0.06 0.3 0.38 0.22 0.25 0.26 0.23 0.32 0.17
Standard Reference Materials BHVO-1 BHVO-2 BIR-1 BCR-2
Cert. Avg (N = 2) Cert. Avg (N = 2) Cert. Avg (N = 2) Cert. (N = 1)
Major and minor element oxide concentrations (wt%)
SiO2** 49.9 50.2 49.9 50.1 48.0 47.7 54.1 54.9
TiO2 2.71 2.74 2.73 2.71 0.96 0.97 2.26 2.26Al2O3 13.8 13.7 13.5 13.8 15.5 15.7 13.5 13.6Cr2O3 0.05 0.04 0.04 0.04 0.05 0.06 0.00 0.00FeO 10.9 11.0 11.0 11.0 10.1 10.3 12.3 12.3MnO 0.17 0.17 0.17 0.17 0.18 0.18 0.20 0.20MgO 7.23 7.36 7.23 7.45 9.70 9.80 3.59 3.94CaO 11.4 11.5 11.4 11.4 13.3 13.4 7.12 7.16Na2O 2.26 2.28 2.22 2.26 1.82 1.84 3.16 3.10K2O 0.52 0.63 0.52 0.62 0.03 0.03 1.79 2.10P2O5 0.27 0.38 0.27 0.49 0.02 0.02 0.35 0.43
WR subsamples are identified by lithologic type such that B-basalt, X-breccia, and M-mixture of basalt and breccia. Analyses in italics are based on one analysis (arithmetic mean of 3measurements). Elements not detected are denoted by n.d. One standard deviation is indicated in the columns denoted by ±.Certified values for Standard Reference Materials (BHVO-1, BHVO-2, BIR-2, BCR-2) are from the United States Geological Survey (http://crustal.usgs.gov/geochemical_reference_standards/).* Parent clasts are those represented in Table 1 and Fig. 1.
** SiO2 is calculated by mass difference due to the hydrofluoric acid dissolution procedure, which volatilizes SiO2.
A.L.Fagan
,C.R
.Neal/
Geochim
icaet
Cosm
ochim
icaActa
173(2016)
352–372361
Fig. 7. Average whole-rock major element compositions of 60639basalt, breccia matrix, and basalt + breccia mixed lithology: (a)Mg/(Mg+Fe2+) vs. Al2O3 (wt%); (b) TiO2 (wt%) vs. Hf (ppm); (c)average REE profiles normalized to chondritic meteorites (Andersand Grevesse, 1989); (d) Clast 2 and Clast 3 basalt + breccia mixedlithologies and mixing calculation REE profiles using the Clast 2breccia and Clast 3 breccia from Table 8.
362 A.L. Fagan, C.R. Neal /Geochimica et Cosmochimica Acta 173 (2016) 352–372
growth (Marsh, 1988, 1998) without substantial influenceby crystal accumulation, magma mixing, or textural coars-ening, which would alter the crystal nucleation and growthrates (e.g., Marsh, 1988; Higgins, 1996). This is consistentwith the lack of plagioclase phenocrysts or any other phe-nocryst phase. The downward curve in Clast 1 at small cor-rected crystal lengths is likely a consequence of theresolution of the optical thin-section image used and num-ber of crystals available. The total sample area and numberof plagioclase crystals were larger for Clast 1 and the smal-ler crystal population of Clast 2 probably accounts for theslight downward kink at �0.3 mm (emphasized by a rela-tively large error on this data point). The similarity of thetwo plagioclase CSDs indicates the basalt clasts likely expe-rienced similar cooling histories and may possibly havebeen derived from similar basalt flows (if not the sameflow).
5.2. Mineral chemistry
All mineral phases are compositionally similar amongthe three basalt clasts and indicate that they probably rep-resent fragments from the same basalt eruption if not thesame flow unit. Plagioclase and pyroxene compositionsreflect crystallization from an evolving magma throughtheir core-to-rim zonations. For example, plagioclase rimsgenerally have a higher Fe/(Fe + Mg) ratio than the cores(also reflected in the pyroxenes); plagioclase rims also havelower An contents due to increased Na2O (Table EA3).These zonations are consistent with crystallization froman evolving melt. In addition, whereas the basaltic plagio-clase typically display TiO2 concentrations of 0.10 wt% ormore, the breccia plagioclase crystals all have 60.04 wt%TiO2. The partition coefficient for Ti in plagioclase is sub-stantially less than that in ilmenite, thus the compositionof the basaltic plagioclase crystals confirm that they crystal-ized before ilmenite to produce high Ti concentrations; thiscrystallization sequence agrees with that suggested byDelano (1975). In contrast, the lower-Ti breccia plagioclasecrystals likely crystallized from a different, lower-Ti melt.
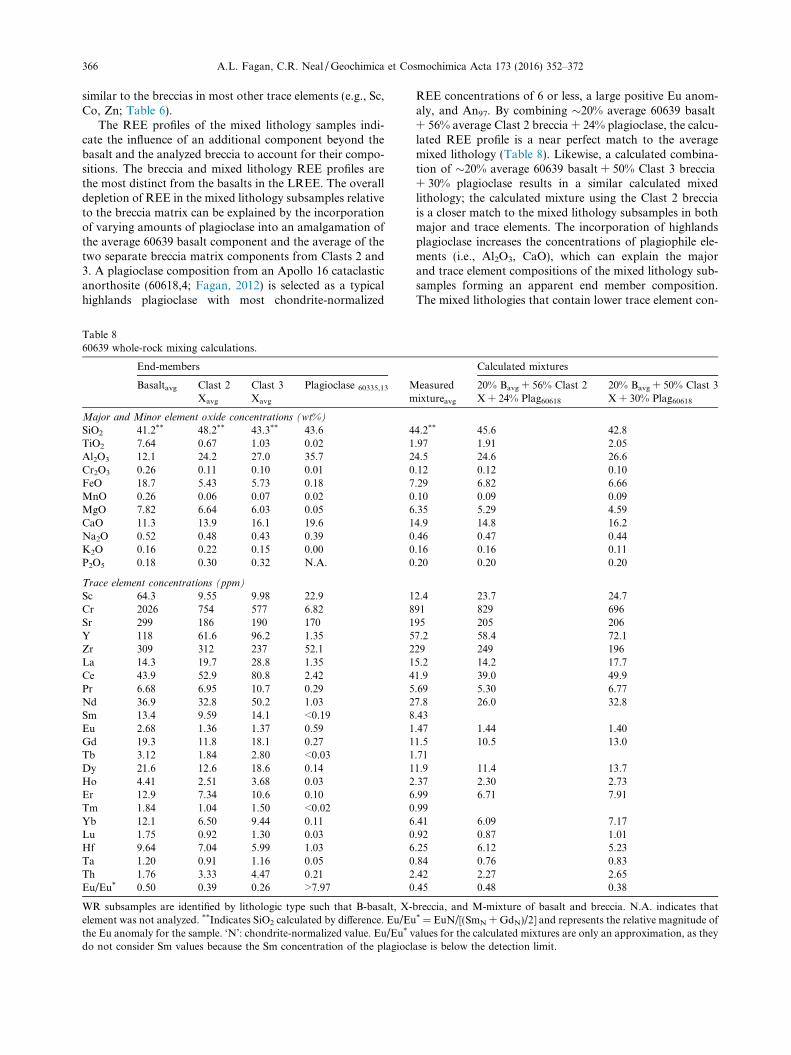
Crystal chemistry of pyroxene shows that cores are gen-erally enriched in Mg over Fe relative to the rims (Fig. 9a).At least one pyroxene (#2 in Clast 2) has a rim that isslightly more enriched in Mg over Fe relative to the core(Fig. 4a), which may indicate that the crystal was cut insuch a way during the thin-sectioning process to cause the‘‘rim” to more accurately reflect a core composition. Thepresence of Fe-rich pyroxene (Fig. 4a), including metastablepyroxferroite identified by Delano (1975), indicates rapidcooling (Lindsley et al., 1972). The pyroxene chemistryreported here is consistent with that determined byDelano (1975) and is also similar to pyroxene major ele-ment chemistry of mare-derived rocks from other Apollo16 stations (Delano, 1975). Pyroxene analyses from the60639 basalt clasts have Ti/Al ratios �0.5 (Fig. 9b) withcores typically more abundant in Ti and Al than the rims.Titanium and Al are incompatible in both Mg- and Fe-rich pyroxenes (Dygert et al., 2014), so a Ti/Al ratio of�0.5 is consistent with the original crystallization sequence
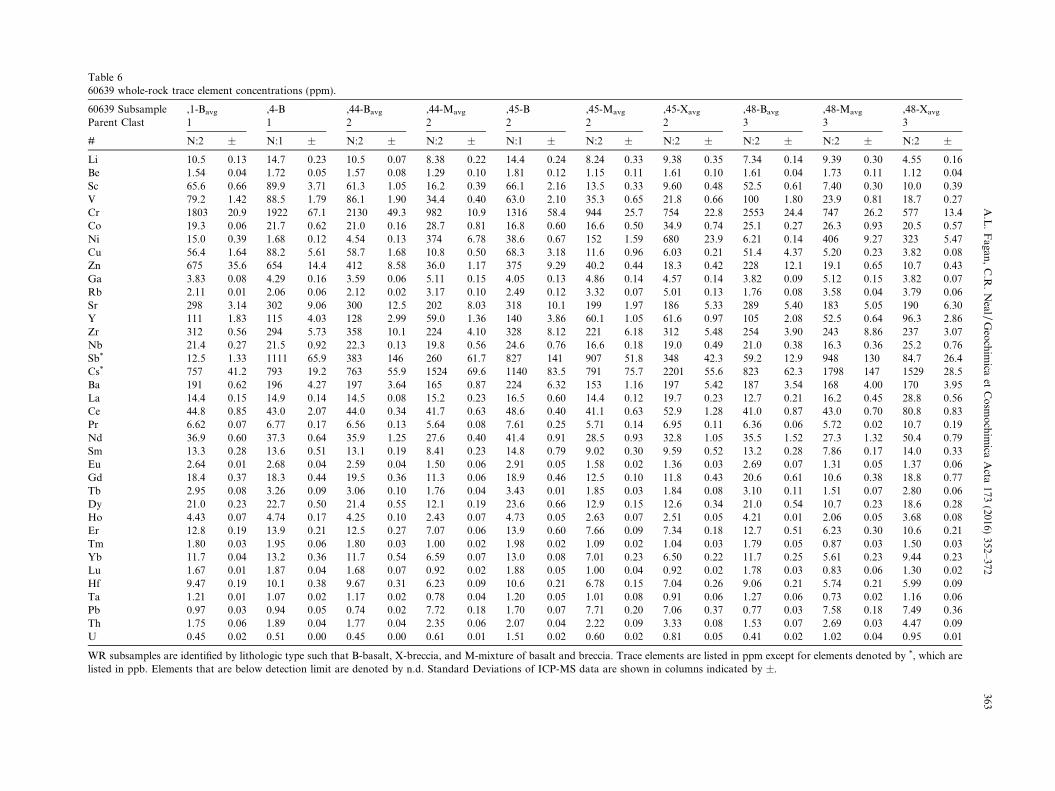
Table 660639 whole-rock trace element concentrations (ppm).
60639 Subsample ,1-Bavg ,4-B ,44-Bavg ,44-Mavg ,45-B ,45-Mavg ,45-Xavg ,48-Bavg ,48-Mavg ,48-Xavg
Parent Clast 1 1 2 2 2 2 2 3 3 3
# N:2 ± N:1 ± N:2 ± N:2 ± N:1 ± N:2 ± N:2 ± N:2 ± N:2 ± N:2 ±
Li 10.5 0.13 14.7 0.23 10.5 0.07 8.38 0.22 14.4 0.24 8.24 0.33 9.38 0.35 7.34 0.14 9.39 0.30 4.55 0.16Be 1.54 0.04 1.72 0.05 1.57 0.08 1.29 0.10 1.81 0.12 1.15 0.11 1.61 0.10 1.61 0.04 1.73 0.11 1.12 0.04Sc 65.6 0.66 89.9 3.71 61.3 1.05 16.2 0.39 66.1 2.16 13.5 0.33 9.60 0.48 52.5 0.61 7.40 0.30 10.0 0.39V 79.2 1.42 88.5 1.79 86.1 1.90 34.4 0.40 63.0 2.10 35.3 0.65 21.8 0.66 100 1.80 23.9 0.81 18.7 0.27Cr 1803 20.9 1922 67.1 2130 49.3 982 10.9 1316 58.4 944 25.7 754 22.8 2553 24.4 747 26.2 577 13.4Co 19.3 0.06 21.7 0.62 21.0 0.16 28.7 0.81 16.8 0.60 16.6 0.50 34.9 0.74 25.1 0.27 26.3 0.93 20.5 0.57Ni 15.0 0.39 1.68 0.12 4.54 0.13 374 6.78 38.6 0.67 152 1.59 680 23.9 6.21 0.14 406 9.27 323 5.47Cu 56.4 1.64 88.2 5.61 58.7 1.68 10.8 0.50 68.3 3.18 11.6 0.96 6.03 0.21 51.4 4.37 5.20 0.23 3.82 0.08Zn 675 35.6 654 14.4 412 8.58 36.0 1.17 375 9.29 40.2 0.44 18.3 0.42 228 12.1 19.1 0.65 10.7 0.43Ga 3.83 0.08 4.29 0.16 3.59 0.06 5.11 0.15 4.05 0.13 4.86 0.14 4.57 0.14 3.82 0.09 5.12 0.15 3.82 0.07Rb 2.11 0.01 2.06 0.06 2.12 0.02 3.17 0.10 2.49 0.12 3.32 0.07 5.01 0.13 1.76 0.08 3.58 0.04 3.79 0.06Sr 298 3.14 302 9.06 300 12.5 202 8.03 318 10.1 199 1.97 186 5.33 289 5.40 183 5.05 190 6.30Y 111 1.83 115 4.03 128 2.99 59.0 1.36 140 3.86 60.1 1.05 61.6 0.97 105 2.08 52.5 0.64 96.3 2.86Zr 312 0.56 294 5.73 358 10.1 224 4.10 328 8.12 221 6.18 312 5.48 254 3.90 243 8.86 237 3.07Nb 21.4 0.27 21.5 0.92 22.3 0.13 19.8 0.56 24.6 0.76 16.6 0.18 19.0 0.49 21.0 0.38 16.3 0.36 25.2 0.76Sb* 12.5 1.33 1111 65.9 383 146 260 61.7 827 141 907 51.8 348 42.3 59.2 12.9 948 130 84.7 26.4Cs* 757 41.2 793 19.2 763 55.9 1524 69.6 1140 83.5 791 75.7 2201 55.6 823 62.3 1798 147 1529 28.5Ba 191 0.62 196 4.27 197 3.64 165 0.87 224 6.32 153 1.16 197 5.42 187 3.54 168 4.00 170 3.95La 14.4 0.15 14.9 0.14 14.5 0.08 15.2 0.23 16.5 0.60 14.4 0.12 19.7 0.23 12.7 0.21 16.2 0.45 28.8 0.56Ce 44.8 0.85 43.0 2.07 44.0 0.34 41.7 0.63 48.6 0.40 41.1 0.63 52.9 1.28 41.0 0.87 43.0 0.70 80.8 0.83Pr 6.62 0.07 6.77 0.17 6.56 0.13 5.64 0.08 7.61 0.25 5.71 0.14 6.95 0.11 6.36 0.06 5.72 0.02 10.7 0.19Nd 36.9 0.60 37.3 0.64 35.9 1.25 27.6 0.40 41.4 0.91 28.5 0.93 32.8 1.05 35.5 1.52 27.3 1.32 50.4 0.79Sm 13.3 0.28 13.6 0.51 13.1 0.19 8.41 0.23 14.8 0.79 9.02 0.30 9.59 0.52 13.2 0.28 7.86 0.17 14.0 0.33Eu 2.64 0.01 2.68 0.04 2.59 0.04 1.50 0.06 2.91 0.05 1.58 0.02 1.36 0.03 2.69 0.07 1.31 0.05 1.37 0.06Gd 18.4 0.37 18.3 0.44 19.5 0.36 11.3 0.06 18.9 0.46 12.5 0.10 11.8 0.43 20.6 0.61 10.6 0.38 18.8 0.77Tb 2.95 0.08 3.26 0.09 3.06 0.10 1.76 0.04 3.43 0.01 1.85 0.03 1.84 0.08 3.10 0.11 1.51 0.07 2.80 0.06Dy 21.0 0.23 22.7 0.50 21.4 0.55 12.1 0.19 23.6 0.66 12.9 0.15 12.6 0.34 21.0 0.54 10.7 0.23 18.6 0.28Ho 4.43 0.07 4.74 0.17 4.25 0.10 2.43 0.07 4.73 0.05 2.63 0.07 2.51 0.05 4.21 0.01 2.06 0.05 3.68 0.08Er 12.8 0.19 13.9 0.21 12.5 0.27 7.07 0.06 13.9 0.60 7.66 0.09 7.34 0.18 12.7 0.51 6.23 0.30 10.6 0.21Tm 1.80 0.03 1.95 0.06 1.80 0.03 1.00 0.02 1.98 0.02 1.09 0.02 1.04 0.03 1.79 0.05 0.87 0.03 1.50 0.03Yb 11.7 0.04 13.2 0.36 11.7 0.54 6.59 0.07 13.0 0.08 7.01 0.23 6.50 0.22 11.7 0.25 5.61 0.23 9.44 0.23Lu 1.67 0.01 1.87 0.04 1.68 0.07 0.92 0.02 1.88 0.05 1.00 0.04 0.92 0.02 1.78 0.03 0.83 0.06 1.30 0.02Hf 9.47 0.19 10.1 0.38 9.67 0.31 6.23 0.09 10.6 0.21 6.78 0.15 7.04 0.26 9.06 0.21 5.74 0.21 5.99 0.09Ta 1.21 0.01 1.07 0.02 1.17 0.02 0.78 0.04 1.20 0.05 1.01 0.08 0.91 0.06 1.27 0.06 0.73 0.02 1.16 0.06Pb 0.97 0.03 0.94 0.05 0.74 0.02 7.72 0.18 1.70 0.07 7.71 0.20 7.06 0.37 0.77 0.03 7.58 0.18 7.49 0.36Th 1.75 0.06 1.89 0.04 1.77 0.04 2.35 0.06 2.07 0.04 2.22 0.09 3.33 0.08 1.53 0.07 2.69 0.03 4.47 0.09U 0.45 0.02 0.51 0.00 0.45 0.00 0.61 0.01 1.51 0.02 0.60 0.02 0.81 0.05 0.41 0.02 1.02 0.04 0.95 0.01
WR subsamples are identified by lithologic type such that B-basalt, X-breccia, and M-mixture of basalt and breccia. Trace elements are listed in ppm except for elements denoted by *, which arelisted in ppb. Elements that are below detection limit are denoted by n.d. Standard Deviations of ICP-MS data are shown in columns indicated by ±.
A.L.Fagan
,C.R
.Neal/
Geochim
icaet
Cosm
ochim
icaActa
173(2016)
352–372363
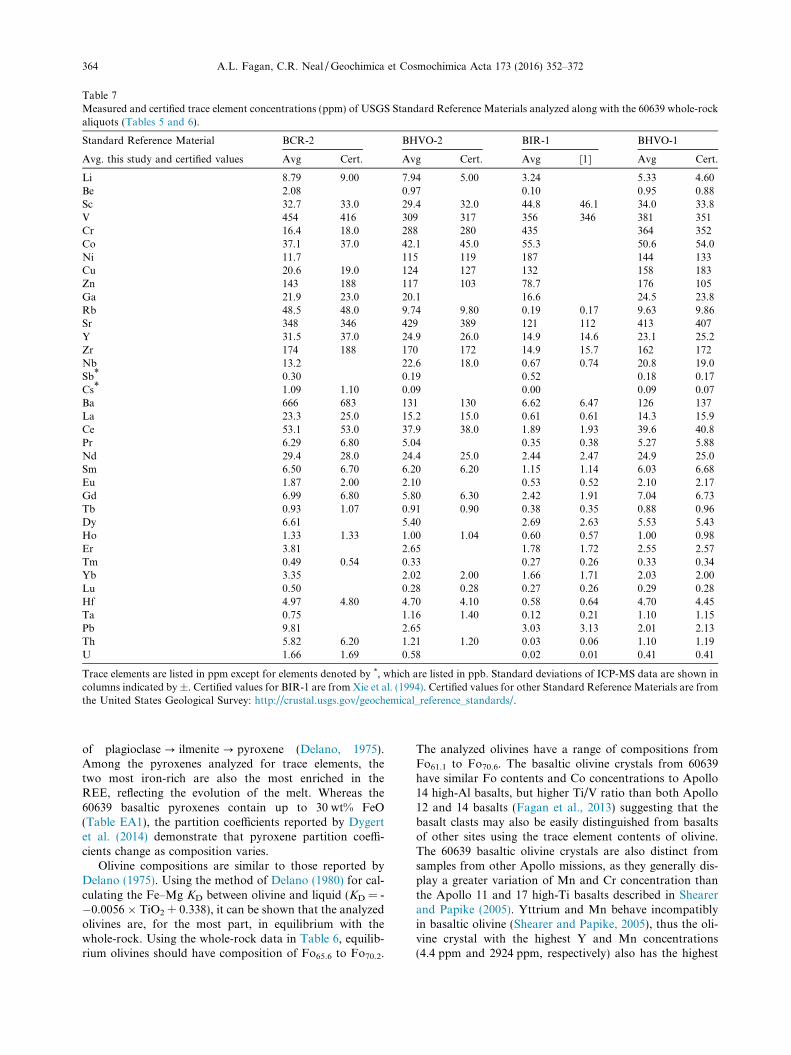
Table 7Measured and certified trace element concentrations (ppm) of USGS Standard Reference Materials analyzed along with the 60639 whole-rockaliquots (Tables 5 and 6).
Standard Reference Material BCR-2 BHVO-2 BIR-1 BHVO-1
Avg. this study and certified values Avg Cert. Avg Cert. Avg [1] Avg Cert.
Li 8.79 9.00 7.94 5.00 3.24 5.33 4.60Be 2.08 0.97 0.10 0.95 0.88Sc 32.7 33.0 29.4 32.0 44.8 46.1 34.0 33.8V 454 416 309 317 356 346 381 351Cr 16.4 18.0 288 280 435 364 352Co 37.1 37.0 42.1 45.0 55.3 50.6 54.0Ni 11.7 115 119 187 144 133Cu 20.6 19.0 124 127 132 158 183Zn 143 188 117 103 78.7 176 105Ga 21.9 23.0 20.1 16.6 24.5 23.8Rb 48.5 48.0 9.74 9.80 0.19 0.17 9.63 9.86Sr 348 346 429 389 121 112 413 407Y 31.5 37.0 24.9 26.0 14.9 14.6 23.1 25.2Zr 174 188 170 172 14.9 15.7 162 172Nb 13.2 22.6 18.0 0.67 0.74 20.8 19.0Sb* 0.30 0.19 0.52 0.18 0.17Cs* 1.09 1.10 0.09 0.00 0.09 0.07Ba 666 683 131 130 6.62 6.47 126 137La 23.3 25.0 15.2 15.0 0.61 0.61 14.3 15.9Ce 53.1 53.0 37.9 38.0 1.89 1.93 39.6 40.8Pr 6.29 6.80 5.04 0.35 0.38 5.27 5.88Nd 29.4 28.0 24.4 25.0 2.44 2.47 24.9 25.0Sm 6.50 6.70 6.20 6.20 1.15 1.14 6.03 6.68Eu 1.87 2.00 2.10 0.53 0.52 2.10 2.17Gd 6.99 6.80 5.80 6.30 2.42 1.91 7.04 6.73Tb 0.93 1.07 0.91 0.90 0.38 0.35 0.88 0.96Dy 6.61 5.40 2.69 2.63 5.53 5.43Ho 1.33 1.33 1.00 1.04 0.60 0.57 1.00 0.98Er 3.81 2.65 1.78 1.72 2.55 2.57Tm 0.49 0.54 0.33 0.27 0.26 0.33 0.34Yb 3.35 2.02 2.00 1.66 1.71 2.03 2.00Lu 0.50 0.28 0.28 0.27 0.26 0.29 0.28Hf 4.97 4.80 4.70 4.10 0.58 0.64 4.70 4.45Ta 0.75 1.16 1.40 0.12 0.21 1.10 1.15Pb 9.81 2.65 3.03 3.13 2.01 2.13Th 5.82 6.20 1.21 1.20 0.03 0.06 1.10 1.19U 1.66 1.69 0.58 0.02 0.01 0.41 0.41
Trace elements are listed in ppm except for elements denoted by *, which are listed in ppb. Standard deviations of ICP-MS data are shown incolumns indicated by ±. Certified values for BIR-1 are from Xie et al. (1994). Certified values for other Standard Reference Materials are fromthe United States Geological Survey: http://crustal.usgs.gov/geochemical_reference_standards/.
364 A.L. Fagan, C.R. Neal /Geochimica et Cosmochimica Acta 173 (2016) 352–372
of plagioclase ? ilmenite ? pyroxene (Delano, 1975).Among the pyroxenes analyzed for trace elements, thetwo most iron-rich are also the most enriched in theREE, reflecting the evolution of the melt. Whereas the60639 basaltic pyroxenes contain up to 30 wt% FeO(Table EA1), the partition coefficients reported by Dygertet al. (2014) demonstrate that pyroxene partition coeffi-cients change as composition varies.
Olivine compositions are similar to those reported byDelano (1975). Using the method of Delano (1980) for cal-culating the Fe–Mg KD between olivine and liquid (KD = -�0.0056 � TiO2 + 0.338), it can be shown that the analyzedolivines are, for the most part, in equilibrium with thewhole-rock. Using the whole-rock data in Table 6, equilib-rium olivines should have composition of Fo65.6 to Fo70.2.
The analyzed olivines have a range of compositions fromFo61.1 to Fo70.6. The basaltic olivine crystals from 60639have similar Fo contents and Co concentrations to Apollo14 high-Al basalts, but higher Ti/V ratio than both Apollo12 and 14 basalts (Fagan et al., 2013) suggesting that thebasalt clasts may also be easily distinguished from basaltsof other sites using the trace element contents of olivine.The 60639 basaltic olivine crystals are also distinct fromsamples from other Apollo missions, as they generally dis-play a greater variation of Mn and Cr concentration thanthe Apollo 11 and 17 high-Ti basalts described in Shearerand Papike (2005). Yttrium and Mn behave incompatiblyin basaltic olivine (Shearer and Papike, 2005), thus the oli-vine crystal with the highest Y and Mn concentrations(4.4 ppm and 2924 ppm, respectively) also has the highest
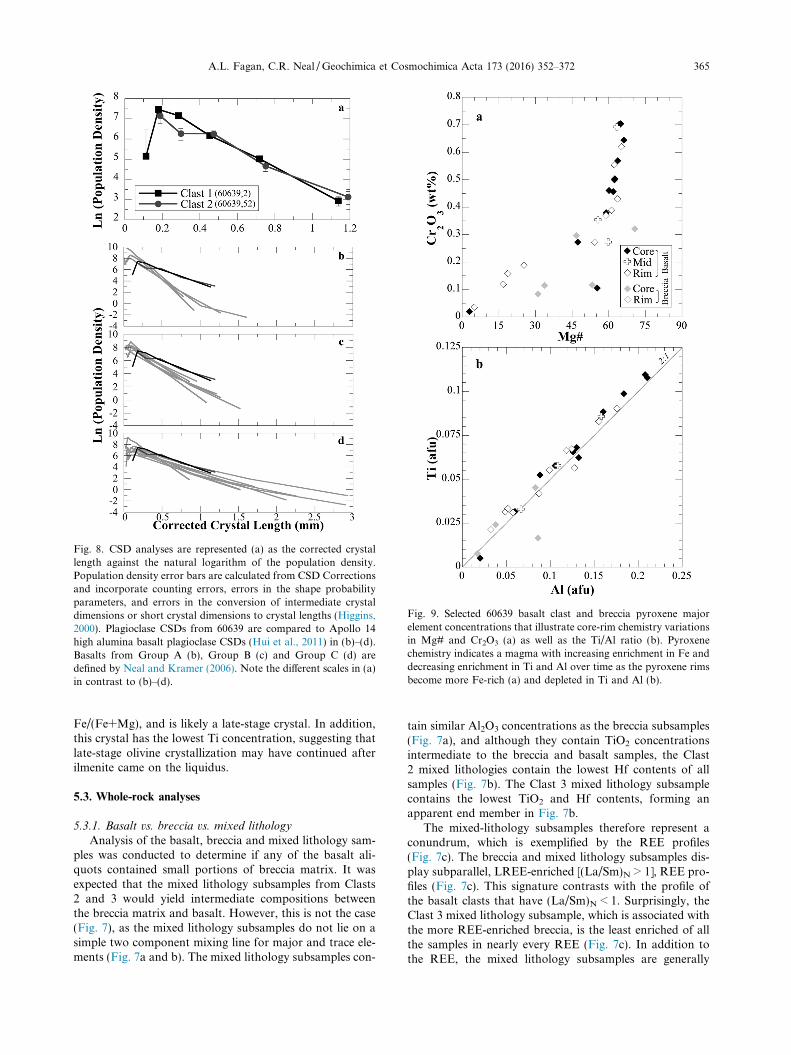
Fig. 8. CSD analyses are represented (a) as the corrected crystallength against the natural logarithm of the population density.Population density error bars are calculated from CSD Correctionsand incorporate counting errors, errors in the shape probabilityparameters, and errors in the conversion of intermediate crystaldimensions or short crystal dimensions to crystal lengths (Higgins,2000). Plagioclase CSDs from 60639 are compared to Apollo 14high alumina basalt plagioclase CSDs (Hui et al., 2011) in (b)–(d).Basalts from Group A (b), Group B (c) and Group C (d) aredefined by Neal and Kramer (2006). Note the different scales in (a)in contrast to (b)–(d).
Fig. 9. Selected 60639 basalt clast and breccia pyroxene majorelement concentrations that illustrate core-rim chemistry variationsin Mg# and Cr2O3 (a) as well as the Ti/Al ratio (b). Pyroxenechemistry indicates a magma with increasing enrichment in Fe anddecreasing enrichment in Ti and Al over time as the pyroxene rimsbecome more Fe-rich (a) and depleted in Ti and Al (b).
A.L. Fagan, C.R. Neal /Geochimica et Cosmochimica Acta 173 (2016) 352–372 365
Fe/(Fe+Mg), and is likely a late-stage crystal. In addition,this crystal has the lowest Ti concentration, suggesting thatlate-stage olivine crystallization may have continued afterilmenite came on the liquidus.
5.3. Whole-rock analyses
5.3.1. Basalt vs. breccia vs. mixed lithology
Analysis of the basalt, breccia and mixed lithology sam-ples was conducted to determine if any of the basalt ali-quots contained small portions of breccia matrix. It wasexpected that the mixed lithology subsamples from Clasts2 and 3 would yield intermediate compositions betweenthe breccia matrix and basalt. However, this is not the case(Fig. 7), as the mixed lithology subsamples do not lie on asimple two component mixing line for major and trace ele-ments (Fig. 7a and b). The mixed lithology subsamples con-
tain similar Al2O3 concentrations as the breccia subsamples(Fig. 7a), and although they contain TiO2 concentrationsintermediate to the breccia and basalt samples, the Clast2 mixed lithologies contain the lowest Hf contents of allsamples (Fig. 7b). The Clast 3 mixed lithology subsamplecontains the lowest TiO2 and Hf contents, forming anapparent end member in Fig. 7b.
The mixed-lithology subsamples therefore represent aconundrum, which is exemplified by the REE profiles(Fig. 7c). The breccia and mixed lithology subsamples dis-play subparallel, LREE-enriched [(La/Sm)N > 1], REE pro-files (Fig. 7c). This signature contrasts with the profile ofthe basalt clasts that have (La/Sm)N < 1. Surprisingly, theClast 3 mixed lithology subsample, which is associated withthe more REE-enriched breccia, is the least enriched of allthe samples in nearly every REE (Fig. 7c). In addition tothe REE, the mixed lithology subsamples are generally
366 A.L. Fagan, C.R. Neal /Geochimica et Cosmochimica Acta 173 (2016) 352–372
similar to the breccias in most other trace elements (e.g., Sc,Co, Zn; Table 6).
The REE profiles of the mixed lithology samples indi-cate the influence of an additional component beyond thebasalt and the analyzed breccia to account for their compo-sitions. The breccia and mixed lithology REE profiles arethe most distinct from the basalts in the LREE. The overalldepletion of REE in the mixed lithology subsamples relativeto the breccia matrix can be explained by the incorporationof varying amounts of plagioclase into an amalgamation ofthe average 60639 basalt component and the average of thetwo separate breccia matrix components from Clasts 2 and3. A plagioclase composition from an Apollo 16 cataclasticanorthosite (60618,4; Fagan, 2012) is selected as a typicalhighlands plagioclase with most chondrite-normalized
Table 860639 whole-rock mixing calculations.
End-members
Basaltavg Clast 2Xavg
Clast 3Xavg
Plagioclase 60335,13 Mm
Major and Minor element oxide concentrations (wt%)
SiO2 41.2** 48.2** 43.3** 43.6 4TiO2 7.64 0.67 1.03 0.02 1Al2O3 12.1 24.2 27.0 35.7 2Cr2O3 0.26 0.11 0.10 0.01 0FeO 18.7 5.43 5.73 0.18 7MnO 0.26 0.06 0.07 0.02 0MgO 7.82 6.64 6.03 0.05 6CaO 11.3 13.9 16.1 19.6 1Na2O 0.52 0.48 0.43 0.39 0K2O 0.16 0.22 0.15 0.00 0P2O5 0.18 0.30 0.32 N.A. 0
Trace element concentrations (ppm)
Sc 64.3 9.55 9.98 22.9 1Cr 2026 754 577 6.82 8Sr 299 186 190 170 1Y 118 61.6 96.2 1.35 5Zr 309 312 237 52.1 2La 14.3 19.7 28.8 1.35 1Ce 43.9 52.9 80.8 2.42 4Pr 6.68 6.95 10.7 0.29 5Nd 36.9 32.8 50.2 1.03 2Sm 13.4 9.59 14.1 <0.19 8Eu 2.68 1.36 1.37 0.59 1Gd 19.3 11.8 18.1 0.27 1Tb 3.12 1.84 2.80 <0.03 1Dy 21.6 12.6 18.6 0.14 1Ho 4.41 2.51 3.68 0.03 2Er 12.9 7.34 10.6 0.10 6Tm 1.84 1.04 1.50 <0.02 0Yb 12.1 6.50 9.44 0.11 6Lu 1.75 0.92 1.30 0.03 0Hf 9.64 7.04 5.99 1.03 6Ta 1.20 0.91 1.16 0.05 0Th 1.76 3.33 4.47 0.21 2Eu/Eu* 0.50 0.39 0.26 >7.97 0
WR subsamples are identified by lithologic type such that B-basalt, X-belement was not analyzed. **Indicates SiO2 calculated by difference. Eu/Euthe Eu anomaly for the sample. ‘N’: chondrite-normalized value. Eu/Eu* vdo not consider Sm values because the Sm concentration of the plagiocl
REE concentrations of 6 or less, a large positive Eu anom-aly, and An97. By combining �20% average 60639 basalt+ 56% average Clast 2 breccia + 24% plagioclase, the calcu-lated REE profile is a near perfect match to the averagemixed lithology (Table 8). Likewise, a calculated combina-tion of �20% average 60639 basalt + 50% Clast 3 breccia+ 30% plagioclase results in a similar calculated mixedlithology; the calculated mixture using the Clast 2 brecciais a closer match to the mixed lithology subsamples in bothmajor and trace elements. The incorporation of highlandsplagioclase increases the concentrations of plagiophile ele-ments (i.e., Al2O3, CaO), which can explain the majorand trace element compositions of the mixed lithology sub-samples forming an apparent end member composition.The mixed lithologies that contain lower trace element con-
Calculated mixtures
easuredixtureavg
20% Bavg + 56% Clast 2X + 24% Plag60618
20% Bavg + 50% Clast 3X + 30% Plag60618
4.2** 45.6 42.8.97 1.91 2.054.5 24.6 26.6.12 0.12 0.10.29 6.82 6.66.10 0.09 0.09.35 5.29 4.594.9 14.8 16.2.46 0.47 0.44.16 0.16 0.11.20 0.20 0.20
2.4 23.7 24.791 829 69695 205 2067.2 58.4 72.129 249 1965.2 14.2 17.71.9 39.0 49.9.69 5.30 6.777.8 26.0 32.8.43.47 1.44 1.401.5 10.5 13.0.711.9 11.4 13.7.37 2.30 2.73.99 6.71 7.91.99.41 6.09 7.17.92 0.87 1.01.25 6.12 5.23.84 0.76 0.83.42 2.27 2.65.45 0.48 0.38
reccia, and M-mixture of basalt and breccia. N.A. indicates that* = EuN/[(SmN + GdN)/2] and represents the relative magnitude ofalues for the calculated mixtures are only an approximation, as theyase is below the detection limit.
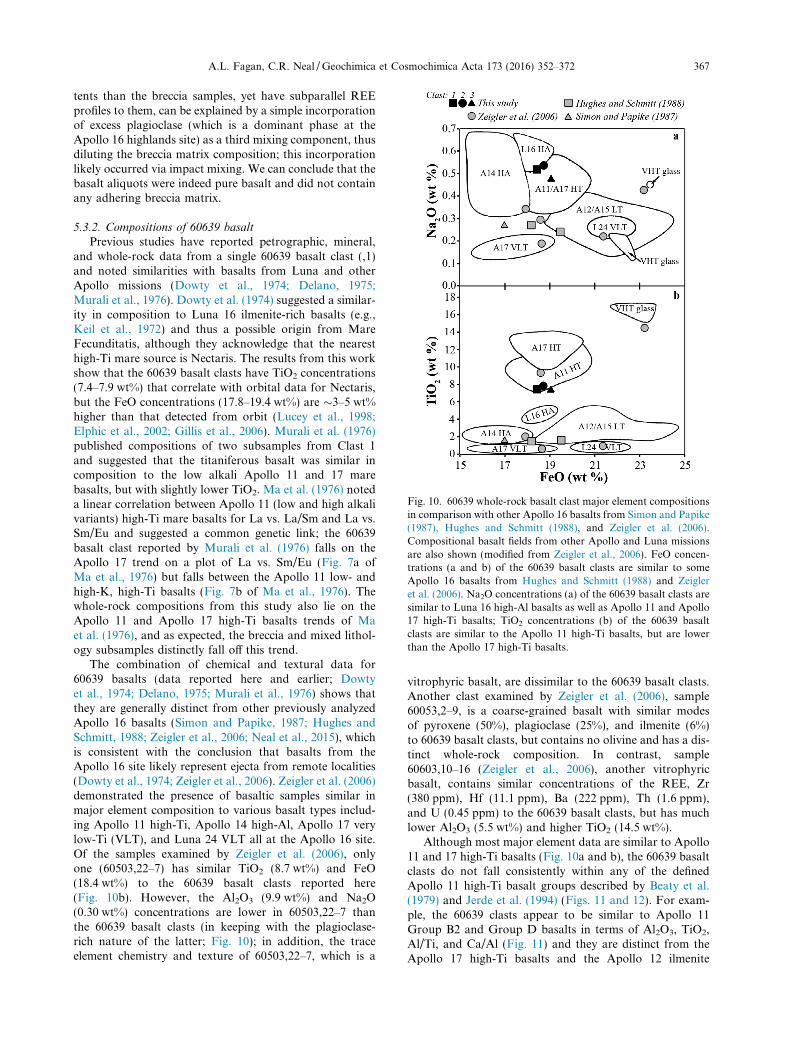
Fig. 10. 60639 whole-rock basalt clast major element compositionsin comparison with other Apollo 16 basalts from Simon and Papike(1987), Hughes and Schmitt (1988), and Zeigler et al. (2006).Compositional basalt fields from other Apollo and Luna missionsare also shown (modified from Zeigler et al., 2006). FeO concen-trations (a and b) of the 60639 basalt clasts are similar to someApollo 16 basalts from Hughes and Schmitt (1988) and Zeigleret al. (2006). Na2O concentrations (a) of the 60639 basalt clasts aresimilar to Luna 16 high-Al basalts as well as Apollo 11 and Apollo17 high-Ti basalts; TiO2 concentrations (b) of the 60639 basaltclasts are similar to the Apollo 11 high-Ti basalts, but are lowerthan the Apollo 17 high-Ti basalts.
A.L. Fagan, C.R. Neal /Geochimica et Cosmochimica Acta 173 (2016) 352–372 367
tents than the breccia samples, yet have subparallel REEprofiles to them, can be explained by a simple incorporationof excess plagioclase (which is a dominant phase at theApollo 16 highlands site) as a third mixing component, thusdiluting the breccia matrix composition; this incorporationlikely occurred via impact mixing. We can conclude that thebasalt aliquots were indeed pure basalt and did not containany adhering breccia matrix.
5.3.2. Compositions of 60639 basalt
Previous studies have reported petrographic, mineral,and whole-rock data from a single 60639 basalt clast (,1)and noted similarities with basalts from Luna and otherApollo missions (Dowty et al., 1974; Delano, 1975;Murali et al., 1976). Dowty et al. (1974) suggested a similar-ity in composition to Luna 16 ilmenite-rich basalts (e.g.,Keil et al., 1972) and thus a possible origin from MareFecunditatis, although they acknowledge that the nearesthigh-Ti mare source is Nectaris. The results from this workshow that the 60639 basalt clasts have TiO2 concentrations(7.4–7.9 wt%) that correlate with orbital data for Nectaris,but the FeO concentrations (17.8–19.4 wt%) are �3–5 wt%higher than that detected from orbit (Lucey et al., 1998;Elphic et al., 2002; Gillis et al., 2006). Murali et al. (1976)published compositions of two subsamples from Clast 1and suggested that the titaniferous basalt was similar incomposition to the low alkali Apollo 11 and 17 marebasalts, but with slightly lower TiO2. Ma et al. (1976) noteda linear correlation between Apollo 11 (low and high alkalivariants) high-Ti mare basalts for La vs. La/Sm and La vs.Sm/Eu and suggested a common genetic link; the 60639basalt clast reported by Murali et al. (1976) falls on theApollo 17 trend on a plot of La vs. Sm/Eu (Fig. 7a ofMa et al., 1976) but falls between the Apollo 11 low- andhigh-K, high-Ti basalts (Fig. 7b of Ma et al., 1976). Thewhole-rock compositions from this study also lie on theApollo 11 and Apollo 17 high-Ti basalts trends of Maet al. (1976), and as expected, the breccia and mixed lithol-ogy subsamples distinctly fall off this trend.
The combination of chemical and textural data for60639 basalts (data reported here and earlier; Dowtyet al., 1974; Delano, 1975; Murali et al., 1976) shows thatthey are generally distinct from other previously analyzedApollo 16 basalts (Simon and Papike, 1987; Hughes andSchmitt, 1988; Zeigler et al., 2006; Neal et al., 2015), whichis consistent with the conclusion that basalts from theApollo 16 site likely represent ejecta from remote localities(Dowty et al., 1974; Zeigler et al., 2006). Zeigler et al. (2006)demonstrated the presence of basaltic samples similar inmajor element composition to various basalt types includ-ing Apollo 11 high-Ti, Apollo 14 high-Al, Apollo 17 verylow-Ti (VLT), and Luna 24 VLT all at the Apollo 16 site.Of the samples examined by Zeigler et al. (2006), onlyone (60503,22–7) has similar TiO2 (8.7 wt%) and FeO(18.4 wt%) to the 60639 basalt clasts reported here(Fig. 10b). However, the Al2O3 (9.9 wt%) and Na2O(0.30 wt%) concentrations are lower in 60503,22–7 thanthe 60639 basalt clasts (in keeping with the plagioclase-rich nature of the latter; Fig. 10); in addition, the traceelement chemistry and texture of 60503,22–7, which is a
vitrophyric basalt, are dissimilar to the 60639 basalt clasts.Another clast examined by Zeigler et al. (2006), sample60053,2–9, is a coarse-grained basalt with similar modesof pyroxene (50%), plagioclase (25%), and ilmenite (6%)to 60639 basalt clasts, but contains no olivine and has a dis-tinct whole-rock composition. In contrast, sample60603,10–16 (Zeigler et al., 2006), another vitrophyricbasalt, contains similar concentrations of the REE, Zr(380 ppm), Hf (11.1 ppm), Ba (222 ppm), Th (1.6 ppm),and U (0.45 ppm) to the 60639 basalt clasts, but has muchlower Al2O3 (5.5 wt%) and higher TiO2 (14.5 wt%).
Although most major element data are similar to Apollo11 and 17 high-Ti basalts (Fig. 10a and b), the 60639 basaltclasts do not fall consistently within any of the definedApollo 11 high-Ti basalt groups described by Beaty et al.(1979) and Jerde et al. (1994) (Figs. 11 and 12). For exam-ple, the 60639 clasts appear to be similar to Apollo 11Group B2 and Group D basalts in terms of Al2O3, TiO2,Al/Ti, and Ca/Al (Fig. 11) and they are distinct from theApollo 17 high-Ti basalts and the Apollo 12 ilmenite
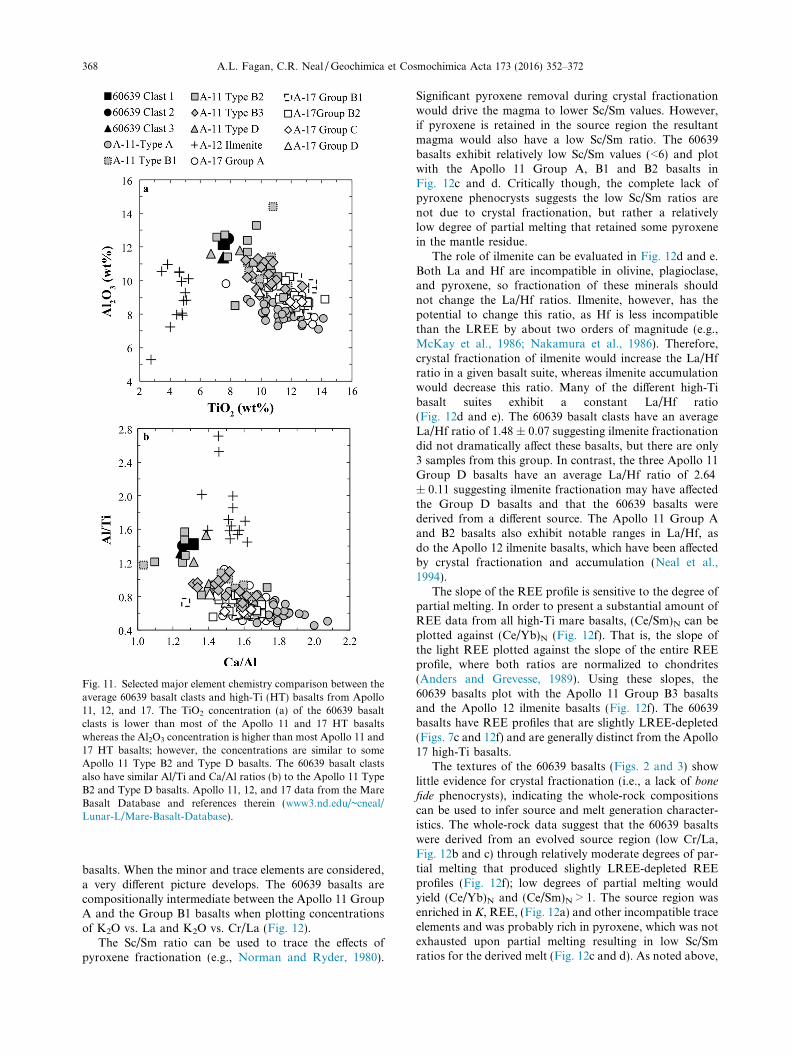
Fig. 11. Selected major element chemistry comparison between theaverage 60639 basalt clasts and high-Ti (HT) basalts from Apollo11, 12, and 17. The TiO2 concentration (a) of the 60639 basaltclasts is lower than most of the Apollo 11 and 17 HT basaltswhereas the Al2O3 concentration is higher than most Apollo 11 and17 HT basalts; however, the concentrations are similar to someApollo 11 Type B2 and Type D basalts. The 60639 basalt clastsalso have similar Al/Ti and Ca/Al ratios (b) to the Apollo 11 TypeB2 and Type D basalts. Apollo 11, 12, and 17 data from the MareBasalt Database and references therein (www3.nd.edu/~cneal/Lunar-L/Mare-Basalt-Database).
368 A.L. Fagan, C.R. Neal /Geochimica et Cosmochimica Acta 173 (2016) 352–372
basalts. When the minor and trace elements are considered,a very different picture develops. The 60639 basalts arecompositionally intermediate between the Apollo 11 GroupA and the Group B1 basalts when plotting concentrationsof K2O vs. La and K2O vs. Cr/La (Fig. 12).
The Sc/Sm ratio can be used to trace the effects ofpyroxene fractionation (e.g., Norman and Ryder, 1980).
Significant pyroxene removal during crystal fractionationwould drive the magma to lower Sc/Sm values. However,if pyroxene is retained in the source region the resultantmagma would also have a low Sc/Sm ratio. The 60639basalts exhibit relatively low Sc/Sm values (<6) and plotwith the Apollo 11 Group A, B1 and B2 basalts inFig. 12c and d. Critically though, the complete lack ofpyroxene phenocrysts suggests the low Sc/Sm ratios arenot due to crystal fractionation, but rather a relativelylow degree of partial melting that retained some pyroxenein the mantle residue.
The role of ilmenite can be evaluated in Fig. 12d and e.Both La and Hf are incompatible in olivine, plagioclase,and pyroxene, so fractionation of these minerals shouldnot change the La/Hf ratios. Ilmenite, however, has thepotential to change this ratio, as Hf is less incompatiblethan the LREE by about two orders of magnitude (e.g.,McKay et al., 1986; Nakamura et al., 1986). Therefore,crystal fractionation of ilmenite would increase the La/Hfratio in a given basalt suite, whereas ilmenite accumulationwould decrease this ratio. Many of the different high-Tibasalt suites exhibit a constant La/Hf ratio(Fig. 12d and e). The 60639 basalt clasts have an averageLa/Hf ratio of 1.48 ± 0.07 suggesting ilmenite fractionationdid not dramatically affect these basalts, but there are only3 samples from this group. In contrast, the three Apollo 11Group D basalts have an average La/Hf ratio of 2.64± 0.11 suggesting ilmenite fractionation may have affectedthe Group D basalts and that the 60639 basalts werederived from a different source. The Apollo 11 Group Aand B2 basalts also exhibit notable ranges in La/Hf, asdo the Apollo 12 ilmenite basalts, which have been affectedby crystal fractionation and accumulation (Neal et al.,1994).
The slope of the REE profile is sensitive to the degree ofpartial melting. In order to present a substantial amount ofREE data from all high-Ti mare basalts, (Ce/Sm)N can beplotted against (Ce/Yb)N (Fig. 12f). That is, the slope ofthe light REE plotted against the slope of the entire REEprofile, where both ratios are normalized to chondrites(Anders and Grevesse, 1989). Using these slopes, the60639 basalts plot with the Apollo 11 Group B3 basaltsand the Apollo 12 ilmenite basalts (Fig. 12f). The 60639basalts have REE profiles that are slightly LREE-depleted(Figs. 7c and 12f) and are generally distinct from the Apollo17 high-Ti basalts.
The textures of the 60639 basalts (Figs. 2 and 3) showlittle evidence for crystal fractionation (i.e., a lack of bonefide phenocrysts), indicating the whole-rock compositionscan be used to infer source and melt generation character-istics. The whole-rock data suggest that the 60639 basaltswere derived from an evolved source region (low Cr/La,Fig. 12b and c) through relatively moderate degrees of par-tial melting that produced slightly LREE-depleted REEprofiles (Fig. 12f); low degrees of partial melting wouldyield (Ce/Yb)N and (Ce/Sm)N > 1. The source region wasenriched in K, REE, (Fig. 12a) and other incompatible traceelements and was probably rich in pyroxene, which was notexhausted upon partial melting resulting in low Sc/Smratios for the derived melt (Fig. 12c and d). As noted above,
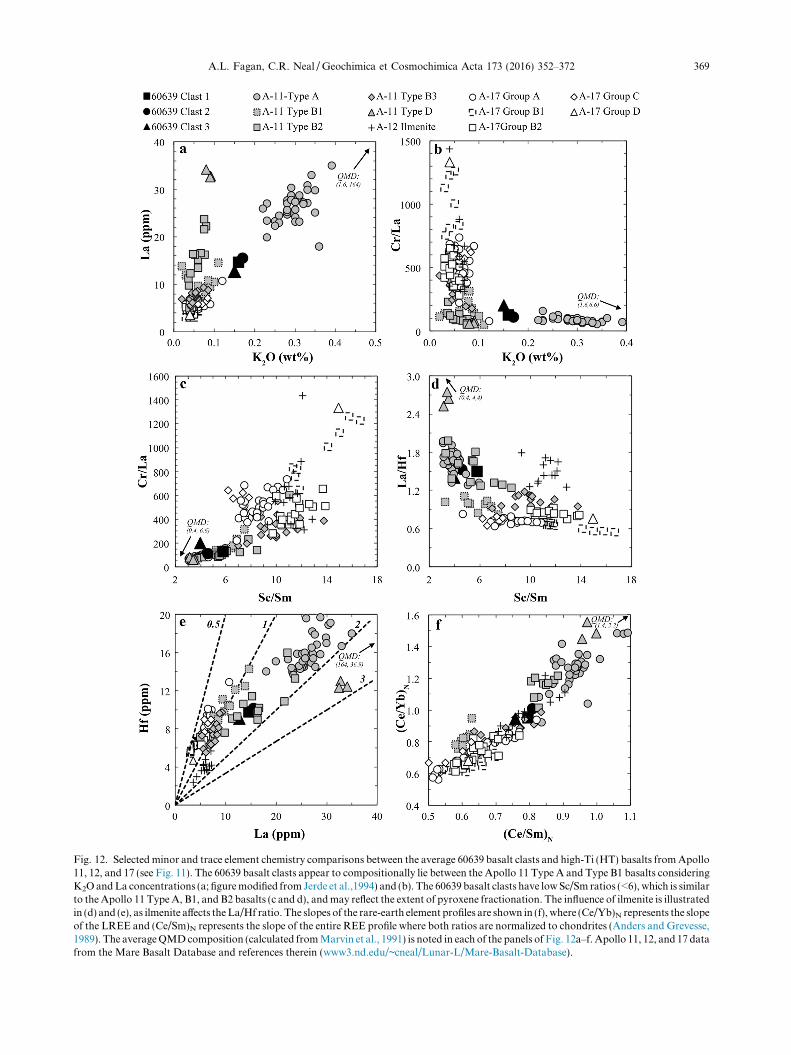
Fig. 12. Selectedminor and trace element chemistry comparisons between the average 60639 basalt clasts and high-Ti (HT) basalts fromApollo11, 12, and 17 (see Fig. 11). The 60639 basalt clasts appear to compositionally lie between the Apollo 11 Type A and Type B1 basalts consideringK2OandLa concentrations (a; figuremodified from Jerde et al.,1994) and (b). The 60639 basalt clasts have lowSc/Sm ratios (<6), which is similarto the Apollo 11 TypeA, B1, and B2 basalts (c and d), andmay reflect the extent of pyroxene fractionation. The influence of ilmenite is illustratedin (d) and (e), as ilmenite affects theLa/Hf ratio. The slopes of the rare-earth element profiles are shown in (f), where (Ce/Yb)N represents the slopeof the LREE and (Ce/Sm)N represents the slope of the entire REE profile where both ratios are normalized to chondrites (Anders and Grevesse,1989). The averageQMDcomposition (calculated fromMarvin et al., 1991) is noted in each of the panels of Fig. 12a–f. Apollo 11, 12, and 17 datafrom the Mare Basalt Database and references therein (www3.nd.edu/~cneal/Lunar-L/Mare-Basalt-Database).
A.L. Fagan, C.R. Neal /Geochimica et Cosmochimica Acta 173 (2016) 352–372 369
370 A.L. Fagan, C.R. Neal /Geochimica et Cosmochimica Acta 173 (2016) 352–372
the lack of pyroxene phenocrysts in the 60639 basalts(Figs. 2 and 3) indicates crystal fractionation was notresponsible for the low Sc/Sm values.
5.4. Petrogenesis of the 60639 basalts
The 60639 basalt clasts plot at the lower end of the high-Ti basalt designation (cf. Neal and Taylor, 1992), but theycontain relatively high Al2O3 contents (Fig. 11a), similar tothe Apollo 14 high-Al basalts (e.g., Neal and Kramer,2006). In terms of Al2O3 and TiO2 contents, the 60639basalts are similar to the Group D basalts and some ofthe more fractionated Group B2 basalts from Apollo 11(Beaty et al., 1979; Ma et al., 1980; Jerde et al., 1994)(Fig. 11a). However, the K2O concentrations of the 60639clasts are unique amongst the high-Ti basalts returned fromthe Moon (Fig. 12a and b). The 60639 clasts appear to havebeen derived from a fractionated source with low Cr/Laconcentrations similar to the Apollo 11 Group A basalts(Fig. 12b and c), but with different concentrations in othertrace elements such as Hf, La, and the Sc/Sm ratio(Fig. 12d and e). In terms of the REE profiles, though,the 60639 basalts are distinct from Apollo 17 high-Tibasalts and are similar to some of the Apollo 11 Type B3basalts (Fig. 12f).
The lack of consistent overarching similarities withanother single high-Ti basalt group indicates that the60639 basalts are a unique type of basalt that has not pre-viously been recognized in the current sample collection.That being said, the 60639 basalts do have similar Cr/La,K/La, La/Hf and Sc/Sm ratios to the high-K Apollo 11Group A basalts (Fig. 12a–e). Jerde et al. (1994) concludedthat the Apollo 11 Group A basalts were derived from asource region that is distinct from the other Apollo 11high-Ti basalt groups, and assimilated an evolvedKREEP-like material that was much younger than urK-REEP (cf. Warren, 1985). This component was coined‘‘neu-KREEP” (Jerde et al., 1994) and was similar to thecomposition of quartz monzodiorite (QMD) describedfrom the Apollo 15 site (e.g., Marvin et al., 1991). The aver-age QMD composition (calculated from Marvin et al.,1991) is noted in each of the panels of Fig. 12a–f. The60639 basalts lie on a trajectory between QMD and a par-ent approximated by the Apollo 11 Group B3 basalt(Fig. 12a–f). Note that Jerde et al. (1994) used an Apollo11 orange glass composition as the parent for these basalts(composition from Delano, 1986) in their modeling. Quali-tatively speaking, the Apollo 11 Group A basalts containthe highest QMD signature followed by the 60639 basalts.The Apollo 11 Group B1 basalts also appear to lie on thistrajectory (Fig. 12a–e), but apparently experienced smallerdegrees of assimilation of QMD compared to the 60639and Group A basalts. Jerde et al. (1994) concluded thatthe Apollo 11 Group B1 basalts (along with groups B3and D) were not affected by such assimilation; Fig. 12f sup-ports this conclusion, as the B1 basalts are the most LREE-depleted of all the Apollo 11 basalt groups.
The implication from the discussion above is that the60639 basalts also may have experienced evolution throughassimilation of a QMD-like material. While the petroge-
netic process may have been similar to that proposed forthe Apollo 11 Group A basalts, the higher Al/Ti and lowerCa/Al ratios (Fig. 11b) of the 60639 basalts suggest deriva-tion from a source unrelated to the Apollo 11 basalts.Another implication is that an evolved, QMD-like materialwas also present in the crust beneath the lava flows fromwhich the 60639 basalt clasts were derived. Using the neu-KREEP composition (Jerde et al., 1994) and the measuredApollo 11 Orange glass composition (Shearer and Papike,1993) as the parent composition, the REE profiles andK2O content of the average Apollo 11 Type A basalt com-position can be produced by bulk mixing of �15% neu-KREEP with 85% of the parent. The REE profiles andK2O content of 60639 basalts require �7% of the neu-KREEP component. Few other trace elements are givenfor neu-KREEP by Jerde et al. (1994), hence we show theaverage composition of QMD from Marvin et al. (1991)in Fig. 12. Bulk mixing rather than assimilation coupledwith fractional crystallization (AFC) is used because ofthe lack of phenocrysts in the 60639 basalts, and this pro-cess also approximates the Apollo 11 Type A basalts.
Neal and Taylor (1992) proposed a lunar mare basaltclassification based primarily on TiO2, with secondary andtertiary subdivisions based upon Al2O3 and K contents,respectively (see Fig. 3 in Neal and Taylor, 1992). The pri-mary groups are very-low-Ti, low-Ti, and high-Ti with sub-divisions placed at 1 and 6 wt% TiO2, respectively. Each ofthese Ti groups was divided into high- and low-Al (divisionat 11 wt% Al2O3), and then each of these Ti-Al groups wassubdivided into low- and high-K (division at 2000 ppm K).Therefore, Neal and Taylor (1992) proposed a 12-fold clas-sification scheme for mare basalts, seven of which were pop-ulated by samples. The 60639 basalts are the first samples tofall within the proposed high-Ti/high-Al/low-K group.
6. SUMMARY AND CONCLUSIONS
Mineral compositions are indistinguishable between the60639 basalt clasts indicating that the aliquots are derivedeither from a single basalt flow or from the same horizonof different flows of the same composition. The brecciamatrix is derived from material other than the basalts asdemonstrated by different mineral compositions.
Basalt + breccia matrix mixed lithology whole-rockanalyses compositionally cluster together indicating similarend-member components, but the two breccia analyses arecompositionally distinct from one another suggesting thebreccia composition is variable. Such a mixture requires athird component, such as excess plagioclase. The trace ele-ment concentrations and REE profiles of the mixed lithol-ogy subsamples can be accounted for by mixing �20%basalt + 61% Clast 2 breccia + 19% plagioclase or, simi-larly, �20% basalt + 40% Clast 3 breccia + 40% plagio-clase, where plagioclase acts as an analog for anorthosite.
These basalts evolved through �7% assimilation of aQMD-like material. However, the textures show a lack ofphenocrysts indicating that assimilation was not accompa-nied by fractional crystallization. The low Sc/Sm and Cr/La ratios exhibited by the 60639 basalts suggest derivationfrom an evolved, pyroxene-rich source region. We conclude
A.L. Fagan, C.R. Neal /Geochimica et Cosmochimica Acta 173 (2016) 352–372 371
that the 60639 basalts represent the first example of a high-Ti/high-Al/low-K lunar basalt from the Moon. Thesebasalts were derived from a source region enriched in ilme-nite, plagioclase, and pyroxene (i.e., late-stage cumulates)and that pyroxene was retained in the mantle residue aftermelting; this is consistent with a shallow source, as the den-ser ilmenite will sink, but the lighter plagioclase will not,and the Sc/Sm ratio will be low. Although this could indi-cate that not all ilmenite sank during evolution of the LunarMagma Ocean, such a conjecture is beyond the scope ofthis study. These basalts may have been derived from MareNectaris as the TiO2 content seems to be consistent,although the FeO content of the 60639 basalts is higherthan what appears to be defined for this area from remotesensing (17–19 wt% vs. 14–15 wt%).
ACKNOWLEDGEMENT
This work was partially supported by NASA Lunar ScienceInstitute contract NNA09DB33A (PI David A. Kring) and subcon-tract 02713-05 to C.R.N. Many thanks are due to Paul Carpenterfor assistance with the EPMA at Washington University in St.Louis and to Jon Loftus for assistance with the ICP-OES chemicalanalyses at the Center for Environmental Science and Technology(CEST) at the University of Notre Dame. This research owesincomparable gratitude to Dr. Antonio Simonetti for guidanceand unending patience with the use of the ICP-MS facilities atMITERAC, University of Notre Dame. We also thank Dr. BradJolliff and two anonymous reviewers for their constructive reviews,which helped to improve the manuscript.
APPENDIX A. SUPPLEMENTARY DATA
Supplementary data associated with this article can befound, in the online version, at http://dx.doi.org/10.1016/j.gca.2015.08.007.
REFERENCES
Anders E. and Grevesse N. (1989) Abundances of the elements:meteoritic and solar. Geochim. Cosmochim. Acta 53, 197–214.
Beaty D. W., Hill S. M. R. and Albee A. L. (1979) The petrologyand chemistry of basaltic fragments from the Apollo 11 soil,part 1. Proceed. Lunar Planet. Sci. Conf. 10, 41–75.
Cashman K. V. and Marsh B. D. (1988) Crystal size distribution(CSD) in rocks and the kinetics and dynamics of crystallizationII: Makaopuhi lava lake. Contrib. Mineral. Petrol. 99, 292–305.
Delano J. W. (1975) Petrology of the Apollo 16 mare component:Mare Nectaris. 6th Proc. Lunar Sci. Conf., 15–47.
Delano J. W. (1980) Chemistry and liquidus phase relations ofApollo 15 red glass: Implications for the deep lunar interior.11th Proceed. Lunar Sci. Conf., 251–288.
Delano J. W. (1986) Pristine lunar glasses: Criteria, data, andimplications. 16th Proceed. Lunar Sci. Conf. 5, D201–D213.
Dowty E., Keil K. and Prinz M. (1974) Igneous rocks from Apollo16 rake samples. 5th Proceed. Lunar Sci. Conf., 431–445.
Dygert N., Liang Y., Sun C. and Hess P. C. (2014) Anexperimental study of trace element partitioning between augiteand Fe-rich basalts. Geochim. Cosmochim. Acta 132, 170–186.
Elphic R. C., Lawrence D. J., Feldman W. C., Barraclough B. L.,Gasnault O. M., Maurice S., Lucey P. G., Blewett D. T. andBinder A. B. (2002) Lunar prospector neutron spectrometer
constraints on TiO2. J. Geophys. Res. 107. http://dx.doi.org/10.1029/2000JE001460.
Fagan A. L. (2012) Volcanic and impact processes on Mars and theMoon. Unpub. Ph. D. dissertation, Univ. Notre Dame. 308 pp.
Fagan A. L., Neal C. R., Simonetti A., Donohue P. H. andO’Sullivan K. M. (2013) Distinguishing between Apollo 14impact melt and pristine mare basalt samples by geochemicaland textural analyses of olivine. Geochim. Cosmochim. Acta
106, 429–445.Flanagan F. J. (1984) Three USGS mafic rock reference samples,
W-2, DNC-1, and BIR-1. US Geol. Surv. Bull. 1623, 54.Garrison, Jr., J. R. and Taylor L. A. (1980) Genesis of highland
basalt breccias: a view from 66095. Proceed. Conf. Lunar
Highlands Crust, 395–417.Gillis-Davis J. J., Lucey P. G. and Hawke B. R. (2006) Testing the
relation between UV-vis color and TiO2 content of the lunarmaria. Geochim. Cosmochim. Acta 70, 6079–6102.
Gladney E. S. and Roelandts I. (1988) 1987 compilation ofelemental concentration data for USGS BIR-1, DNC-1, and W-2. Geostand. Newslett. 12, 63–118.
Govindaruju K. (1994) 1994 compilation of working values anddescriptions for 383 geostandards. Geostand. Newslett. 118, 1–158.
Higgins M. D. (1996) Crystal size distributions and other quan-titative textural measurements in lavas and tuff from Egmontvolcano (Mt. Taranaki) New Zealand. Bull. Volcanol. 58, 194–204.
Higgins M. D. (2000) Measurement of crystal size distributions.Am. Mineral. 85, 1105–1116.
Higgins M. D. (2002) Closure in crystal size distributions (CSD),verification of CSD calculations, and the significance of CSDfans. Am. Mineral. 87, 171–175.
Higgins M. D. and Chandrasekharam D. (2007) Nature of sub-volcanic Magma Chambers, Deccan Province, India: evidencefrom quantitative textural analysis of plagioclase megacrysts inthe giant plagioclase basalts. J. Petrol. 48, 885–900.
Hinners N. W. (1972) Apollo 16 site selection. In Apollo 16
Preliminary Science Report, NASA, Washington, DC.Hughes S. S. and Schmitt R. A. (1988) Chemistry of a unique low-
titanium basalt clast extracted from 60255 regolith breccia. 19thLunar Planet Sci. Conf., 515–516.
Hui H., Oshrin J. G. and Neal C. R. (2011) Investigation into thepetrogenesis of Apollo 14 high-Al basaltic melts through crystalstratigraphy of plagioclase. Geochim. Cosmochim. Acta 75,6439–6460.
Jerde E. A., Snyder G. A., Taylor L. A., Liu Y.-G. and Schmitt R.A. (1994) The origin and evolution of lunar high-Ti basalts:Periodic melting of a single source at Mare Tranquilitatis.Geochim. Cosmochim. Acta 58, 515–527.
Keil K., Kurat G., Prinz M. and Green J. (1972) Lithic fragments,glasses and chondrules from Luna 16 fines. Earth Planet Sci.
Lett. 13, 243–256.Lindsley D. H., Papike J. J. and Bence A. E. (1972) Pyroxferroite:
breakdown at low-pressure and high temperature (abstract). InLunar Sci. III, 483–485.
Lucey P. G., Blewett D. T. and Hawke B. R. (1998) Mapping theFeO and TiO2 content of the lunar surface with multispectralimagery. J. Geophys. Res. 103, 3679–3699.
Ma M.-S., Murali A. V. and Schmitt R. A. (1976) Chemicalconstraints for mare basalt genesis. 7th Proceed. Lunar. Sci.
Conf., 1673–1695.Ma M.-S., Schmitt R. A., Beaty D. W. and Albee A. L. (1980) The
petrology and chemistry of basaltic fragments from the Apollo11 soil: Drive tubes 10004 and 10005. 11th Proceed. Lunar
Planet Sci. Conf., 37–47.
372 A.L. Fagan, C.R. Neal /Geochimica et Cosmochimica Acta 173 (2016) 352–372
Mahoney J. J., Fitton J. G., Wallace P. J., and Coffin M. (2001)Basement drilling of the Ontong Java Plateau: covering Leg 192of the cruises of the Drilling Vessel ‘‘Joides Resolution”, ApraHarbour, Guam, to Apra Harbor, Guam, Sites 1183–1187, 8September-7 November 2000. In Proc. Of the Ocean Drilling
Program, Initial Reports, 192. College Station, TX, USA, TexasA & M University Ocean Drilling Program. pp. 75.
Marsh B. D. (1988) Crystal size distribution (CSD) in rocks and thekinetics and dynamics of crystallization I. Theory. Contrib.
Mineral. Petrol. 99, 277–291.Marsh B. D. (1998) On the interpretation of crystal size distribu-
tions in magmatic systems. J. Petrol. 39, 553–599.Marvin U. B., Lidstom M. M., Holmberg B. B. and Martinez R. R.
(1991) New observations on the quartz Monzodiorite-Granitesuite. Proceed. Lunar Planet. Sci. Conf. 21, 119–135.
McKay G., Wagstaff J. and Yang S.-R. (1986) Zirconium,Hafnium, and Rare Earth Element partition coefficients forilmenite and other minerals in high-Ti lunar mare basalts: anexperimental study. Proceed. Lunar Planet. Sci. Conf. 16, J.
Geophys. Res. 91, D229–D237.Morgan D. J. and Jerram D. A. (2006) On estimating crystal shape
for crystal size distribution analysis. J. Volcanol. Geotherm. Res.
154, 1–7.Morris R. V., See T. H. and Horz F. (1986) Composition of the
Cayley Formation at Apollo as inferred from impact meltsplashes. 17th Proceed. Lunar Planet. Sci. Conf., J. Geophys.
Res. 90, E21–E42.Murali A. V., Ma M.-S. and Schmitt R. A. (1976) Mare basalt
60639, Another Eastern Lunar Basalt. Lunar Planet. Sci. VII.,583–584.
Nakamura Y., Fujimaki H., Nakamura N., Tatsumoto M., McKayG. A. and Wagstaff J. (1986) Hf, Zr, and REE partitioncoefficients between ilmenite and liquid: implications for lunarpetrogenesis. Proc. Lunar Planet. Sci. Conf. 16, in J. Geophys.
Res. 91, D239–D250.National Research Council (2007) The scientific context for
exploration of the Moon, final report. The National AcademiesPress, Washington, DC.
Neal C. R. (2001) Interior of the Moon: the presence of garnet inthe primitive deep lunar mantle. J. Geophys. Res. 106, 27865–27885.
Neal C. R. and Kramer G. Y. (2006) The petrogenesis of theApollo 14 high-Al mare basalts. Am. Mineral. 91, 1521–1535.
Neal C. R. and Taylor L. A. (1992) Petrogenesis of mare basalts: arecord of lunar volcanism. Geochim. Cosmochim. Acta 56,2177–2211.
Neal C. R., Hacker M. D., Taylor L. A., Schmitt R. A. and Liu Y.-G. (1994) Basalt generation at the Apollo 12 site, part 2: sourceheterogeneity, multiple melts, and crustal contamination.Meteoritics 29, 349–361.
Neal C. R., Donohue P. H., Fagan A. L., O’Sullivan K., Oshrin J.and Roberts S. (2015) Distinguishing between basalts producedby endogenic volcanism and impact processes: a non-destruc-tive method using quantitative petrography of lunar basalticsamples. Geochim. Cosmochim. Acta 148, 62–80.
Norman M. and Ryder G. (1980) Geochemical constraints on theigneous evolution of the lunar crust. 11th Proceed. Lunar
Planet. Sci. Conf., 317–331.Papike J. J., Hodges F. N. and Bence A. E. (1976) Mare basalts:
crystal chemistry, mineralogy, and petrology. Rev. Geophys.
Space Phys. 14, 475–540.Pearce N. J. G., Perkins W. T., Westgate J. A., Gorton M. P.,
Jackson S. E., Neal C. R. and Chenery S. P. (1997) Acompilation of new and published major and trace element datafor NIST SRM 610 and NIST SRM 612 glass referencematerials. Geostandard. Newslett. 21, 115–144.
Ryder G. and Norman M. (1980) Catalog of Apollo 16 Rocks.NASA Cur. Branch Pub 16904, 52, JSC.
Shearer C. K. and Papike J. J. (1993) Basaltic magmatism on theMoon: a perspective from volcanic picritic glass beads.Geochim. Cosmochim. Acta 57, 4785–4812.
Shearer C. K. and Papike J. J. (2005) Early crustal buildingprocesses on the Moon: models for the petrogenesis of themagnesian suite. Geochim. Cosmochim. Acta 69, 3445–3461.
Simon S. B. and Papike J. J. (1987) Petrology of a low-titaniummare basalt from Apollo 16 regolith breccia 60255. 18th Lunar
Planet. Sci. Conf., 922–923.Sutton R. L. (1981) Documentation of Apollo 16 samples. In
Geology of the Apollo 16 area, central lunar highlands. (Ulrichet al.) USGS Prof. Paper 1048.
Van Achterbergh E., Ryan C. G., Jackson S. E. and Griffin W. L.(2001) Data reduction software for LA-ICP-MS. In Laser-
Ablation-ICPMS in the Earth Sciences: Principles and Applica-
tions (ed. P. Sylvester). Mineralogical Association of Canada,pp. 239–243.
Warren P. H. (1985) The magma ocean concept and lunarevolution. Ann. Rev. Earth Planet. Sci. 13, 201–240.
Warren P. H. and Wasson J. T. (1978) Compositional-petrographicinvestigation of pristine nonmare rocks. 9th Proceed. Lunar
Planet. Sci. Conf., 185–217.Xie Q., Jain J., Sun M., Kerrich R. and Fan J. (1994) ICP-MS
analysis of basalt BIR-1 for trace elements. Geostand. Newslett.
18, 53–63.Zeigler R., Korotev R. L., Haskin L. A., Jolliff B. L. and Gillis J. J.
(2006) Petrography and geochemistry of five new Apollo16mare basalts and evidence for post-basin deposition of basalticmaterial at the site. Meteorit. Planet. Sci. 41, 263–284.
Associate editor: Maud Boyet


![BASALT - hometyles.com · 190 191 rodapiÉ basalt rect. 8 x 59 cm. p 11 [59x59 cm] 23,6”x23,6” basalt basalt perla rect. 59 x 59 cm. basalt perla antideslizante rect. 59 x 59](https://img.pdfslide.net/doc/110x75/6062510f5dcd07038d28a84f/basalt-190-191-rodapi-basalt-rect-8-x-59-cm-p-11-59x59-cm-236ax236a.jpg)

![LMC References - NASA · PDF fileAnand M., Taylor L. A., Nazarov M. A., and Patchen A. (2003) Petrologic comparisons of lunar mare basalt meteorites Dh-287A and NWA 032 [bstract] Lunar](https://img.pdfslide.net/doc/110x75/5a7189227f8b9aa2538cf4d6/lmc-references-nasa-nbsppdf-fileanand-m-taylor-l-a-nazarov-m.jpg)