Embed Size (px)
Citation preview
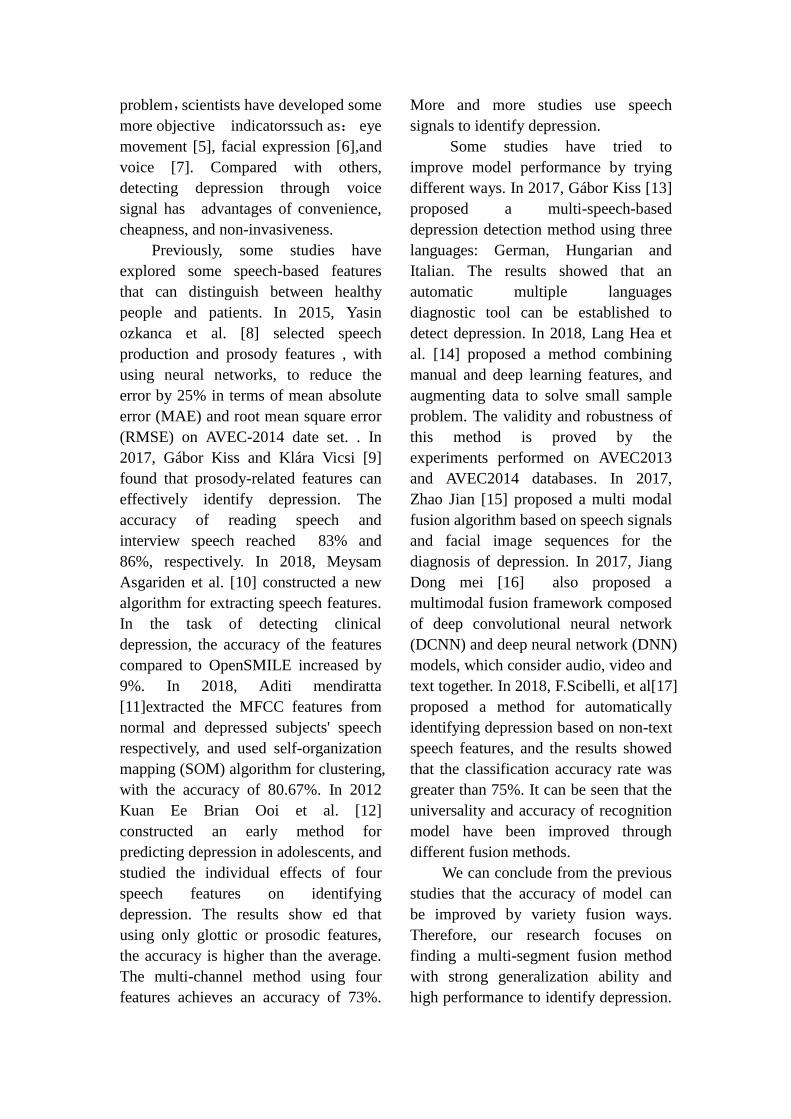
A Novel Decision Tree for Depression
Recognition in Speech Zhenyu Liu1, Dongyu Wang1, Lan Zhang4 and Bin Hu* 1,2,3
1. Gansu Provincial Key Laboratory of Wearable Computing, School of Information
Science and Engineering, Lanzhou University, Lanzhou, China
2. CAS Center for Excellence in Brain Science and Intelligence Technology,
Shanghai Institutes for Biological Sciences, Chinese Academy of Sciences,
Shanghai, China
3. Joint Research Center for Cognitive Neurosensor Technology of Lanzhou
University & Institute of Semiconductors, Chinese Academy of Sciences, Beijing,
China
4. Lanzhou University Second Hospital, Lanzhou, China
[email protected], [email protected], [email protected], [email protected]
Abstract—Depression is a common
mental disorder worldwide which
causes a range of serious outcomes.
The diagnosis of depression relies on
patient-reported scales and
psychiatrist’s interview which may
lead to subjective bias. In recent years,
more and more researchers are
devoted to depression recognition in
speech , which may be an effective
and objective indicator. This study
proposes a new speech segment fusion
method based on decision tree to
improve the depression recognition
accuracy and conducts a validation on
a sample of 52 subjects (23 depressed
patients and 29 healthy controls).
The recognition accuracy are 75.8%
and 68.5% for male and female
respectively on gender-dependent
models. It can be concluded from the
data that the proposed decision tree
model can improve the depression
classification performance.
Keywords—Depression; speech;
decision tree; classification
I. INTRODUCTION
Depression is a kind of affective
disorder, and its main clinical
manifestations are persistently
significant negative emotions. The
World Health Organization (WHO)
listed depression as one of the most
serious causes of disability in the world.
According to the prediction of the World
Health Organization, depression will
become the second leading cause of
disability in the world by 2030 [1].
Worse still, the cost of treatment for
depression is expensive. According to
Olesen et al., in 2010, about 30.3 million
people were affected by depression, with
an average of 797 euros per person in
the treatment of depression and 464
euros in indirect medical expenses in the
EU [2]. A common diagnostic method is
to use depression scales ,like Patient
Health Questionaire (PHQ-9)[3], and
Hamilton Depression Scale (HAM-D)[4].
These scales are based on the honesty of
patients, so there is a certain risk for data
authenticity . In order to solve this
problem,scientists have developed some
more objective indicatorssuch as: eye
movement [5], facial expression [6],and
voice [7]. Compared with others,
detecting depression through voice
signal has advantages of convenience,
cheapness, and non-invasiveness.
Previously, some studies have
explored some speech-based features
that can distinguish between healthy
people and patients. In 2015, Yasin
ozkanca et al. [8] selected speech
production and prosody features , with
using neural networks, to reduce the
error by 25% in terms of mean absolute
error (MAE) and root mean square error
(RMSE) on AVEC-2014 date set. . In
2017, Gábor Kiss and Klára Vicsi [9]
found that prosody-related features can
effectively identify depression. The
accuracy of reading speech and
interview speech reached 83% and
86%, respectively. In 2018, Meysam
Asgariden et al. [10] constructed a new
algorithm for extracting speech features.
In the task of detecting clinical
depression, the accuracy of the features
compared to OpenSMILE increased by
9%. In 2018, Aditi mendiratta
[11]extracted the MFCC features from
normal and depressed subjects' speech
respectively, and used self-organization
mapping (SOM) algorithm for clustering,
with the accuracy of 80.67%. In 2012
Kuan Ee Brian Ooi et al. [12]
constructed an early method for
predicting depression in adolescents, and
studied the individual effects of four
speech features on identifying
depression. The results show ed that
using only glottic or prosodic features,
the accuracy is higher than the average.
The multi-channel method using four
features achieves an accuracy of 73%.
More and more studies use speech
signals to identify depression.
Some studies have tried to
improve model performance by trying
different ways. In 2017, Gábor Kiss [13]
proposed a multi-speech-based
depression detection method using three
languages: German, Hungarian and
Italian. The results showed that an
automatic multiple languages
diagnostic tool can be established to
detect depression. In 2018, Lang Hea et
al. [14] proposed a method combining
manual and deep learning features, and
augmenting data to solve small sample
problem. The validity and robustness of
this method is proved by the
experiments performed on AVEC2013
and AVEC2014 databases. In 2017,
Zhao Jian [15] proposed a multi modal
fusion algorithm based on speech signals
and facial image sequences for the
diagnosis of depression. In 2017, Jiang
Dong mei [16] also proposed a
multimodal fusion framework composed
of deep convolutional neural network
(DCNN) and deep neural network (DNN)
models, which consider audio, video and
text together. In 2018, F.Scibelli, et al[17]
proposed a method for automatically
identifying depression based on non-text
speech features, and the results showed
that the classification accuracy rate was
greater than 75%. It can be seen that the
universality and accuracy of recognition
model have been improved through
different fusion methods.
We can conclude from the previous
studies that the accuracy of model can
be improved by variety fusion ways.
Therefore, our research focuses on
finding a multi-segment fusion method
with strong generalization ability and
high performance to identify depression.
We will also compare it with the
multi-segment fusion methods
previously studied. In order to explain
which paradigm fusion methods can
mostly improve universality and
accuracy, we will calculate the accuracy
of each paradigm separately, at last
we state our conclusions.
The structure of the rest of this
paper is as follows: the second section
mainly introduces database and data
preprocessing, the third section mainly
introduces extraction features and
classification, the fourth section shows
the experimental results, the fifth section
is the discussion part, and the sixth
section gives the conclusion.
II. SPEECH DATABASE
On the basis of careful study of
previous studies, we designed a data
acquisition scheme. We recruit 52
Chinese people (23 depressed patients
and 29 healthy controls) to participate
in our experiment. The data contained in
this publicly available data set are
collected at the Second Affiliated
Hospital of Lanzhou University. This
data set has the following
characteristics:
1. Each participant has , a total of 29
recordings, which are under three
different emotional stimulus (positive,
neutral and negative).
2. The healthy and depressed
subjects were basically matched by
gender, age and education level. And,
the amount of subjects in each group are
balanced.
3. All speech data are collected by
using high-quality equipments.
The data set of this disclosure
includes two parts: the healthy group
and the depressed group, including 29
cases in the healthy group and 23 cases
in the depressed group, aged from 18 to
55.(See TABLE I). All patients were in
accordance with DSM-IV [18], and
before admission, they were diagnosed
by mini [19], and required to speak
fluent Chinese and sign informed
consent.
TABLE I. Demographic data of male
and female subjects
Healthy
controls
Depression
patients
Male 20 16
Female 9 7
Four types of voice data are
collected in the experiment, namely
interview voice, passage reading,
vocabulary reading and description
pictures. There are 29 questions in total.
The details are as follows:
Interview: there are 18 questions
from several commonly used depression
assessment scales, such as DSM-IV [20]
and Hamilton Depression Scale [4]. ,
there are six positive questions, six
neutral questions and six negative
questions. During the whole recording
process, the speaker answers the
questions independently according to the
specified questions without any
intervention from others.
Passage reading: it contains an
allegory story "north wind and sun" [21],
and the speaker reads the full text
according to the prompts on the screen.
Vocabulary reading: it includes six
groups of words, including two groups
of positive materials, two groups of
neutral materials and two groups of
negative materials. Each group contains
ten words. The speaker reads the
materials according to the usual speed of
speech according to the prompts.
Picture Description: it contains four
pictures, the first three pictures are
from the Chinese Facial Affective
Picture System [22], which are used as
positive , neutral and negative stimulus
materials, and the last picture is from the
Thematic Apperception Test. The
speaker describes the picture content in
turn and guesses why the characters in
this picture are in this state.
The experimental acquisition site is
provided by the Second Affiliated
Hospital of Lanzhou University. Before
the experiment, the noise in the test
room is under 60dB.The voice
acquisition software is Adobe Audition
CS6, the microphone used is Newsmy
TLM102, the sound card is RME
FIREFACEUCX, the recording
sampling frequency is 44.1 KHz, the
sampling depth is 24bit, and the mono
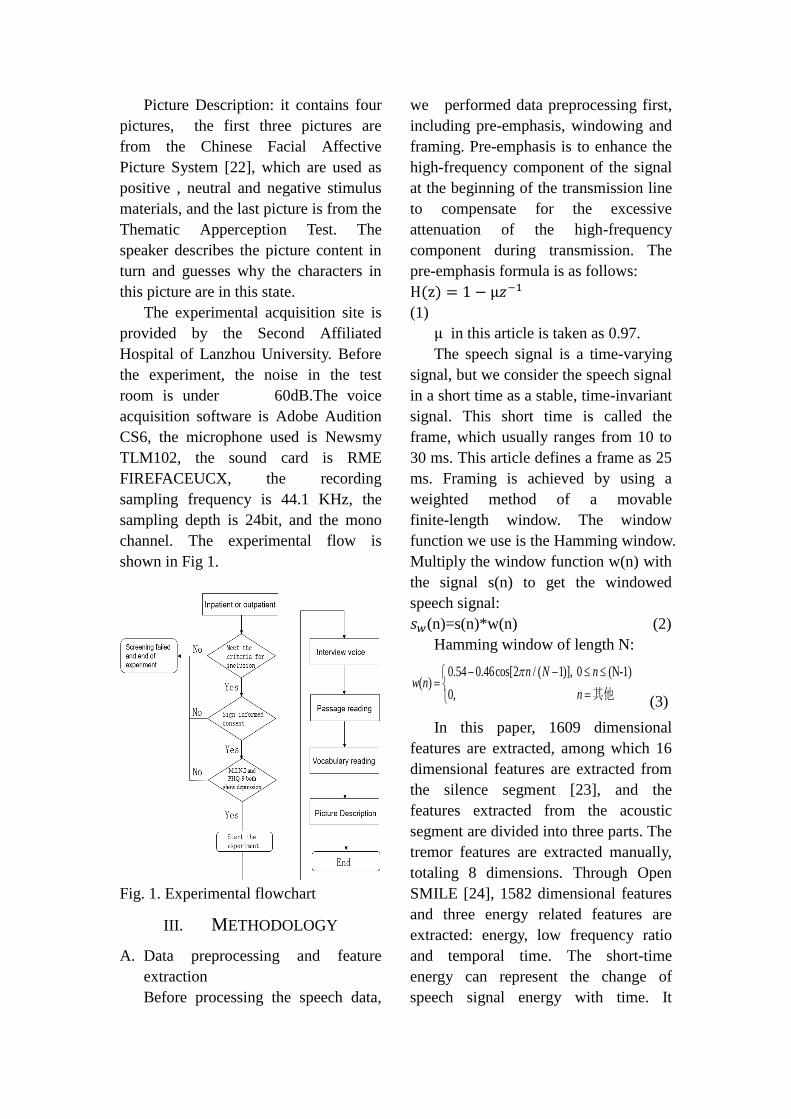
channel. The experimental flow is
shown in Fig 1.
Fig. 1. Experimental flowchart
III. METHODOLOGY
A. Data preprocessing and feature
extraction
Before processing the speech data,
we performed data preprocessing first,
including pre-emphasis, windowing and
framing. Pre-emphasis is to enhance the
high-frequency component of the signal
at the beginning of the transmission line
to compensate for the excessive
attenuation of the high-frequency
component during transmission. The
pre-emphasis formula is as follows:
H(z) = 1 − μ𝑧−1
(1)
μ in this article is taken as 0.97.
The speech signal is a time-varying
signal, but we consider the speech signal
in a short time as a stable, time-invariant
signal. This short time is called the
frame, which usually ranges from 10 to
30 ms. This article defines a frame as 25
ms. Framing is achieved by using a
weighted method of a movable
finite-length window. The window
function we use is the Hamming window.
Multiply the window function w(n) with
the signal s(n) to get the windowed
speech signal:
𝑠𝑤(n)=s(n)*w(n) (2)
Hamming window of length N:
0.54 0.46cos[2 / ( 1)], 0 (N-1)( )
0, 其他
n N nw n
n
(3)
In this paper, 1609 dimensional
features are extracted, among which 16
dimensional features are extracted from
the silence segment [23], and the
features extracted from the acoustic
segment are divided into three parts. The
tremor features are extracted manually,
totaling 8 dimensions. Through Open
SMILE [24], 1582 dimensional features
and three energy related features are
extracted: energy, low frequency ratio
and temporal time. The short-time
energy can represent the change of
speech signal energy with time. It
reflects the change of speech signal
amplitude, which is helpful to recognize
depression. Each feature is explained as
follows:
The features that are extracted from
the silent segment are also called pause
features, or each pause reflects the brain
response of the speaker at that time. To a
certain extent, pause features can
distinguish normal and depression
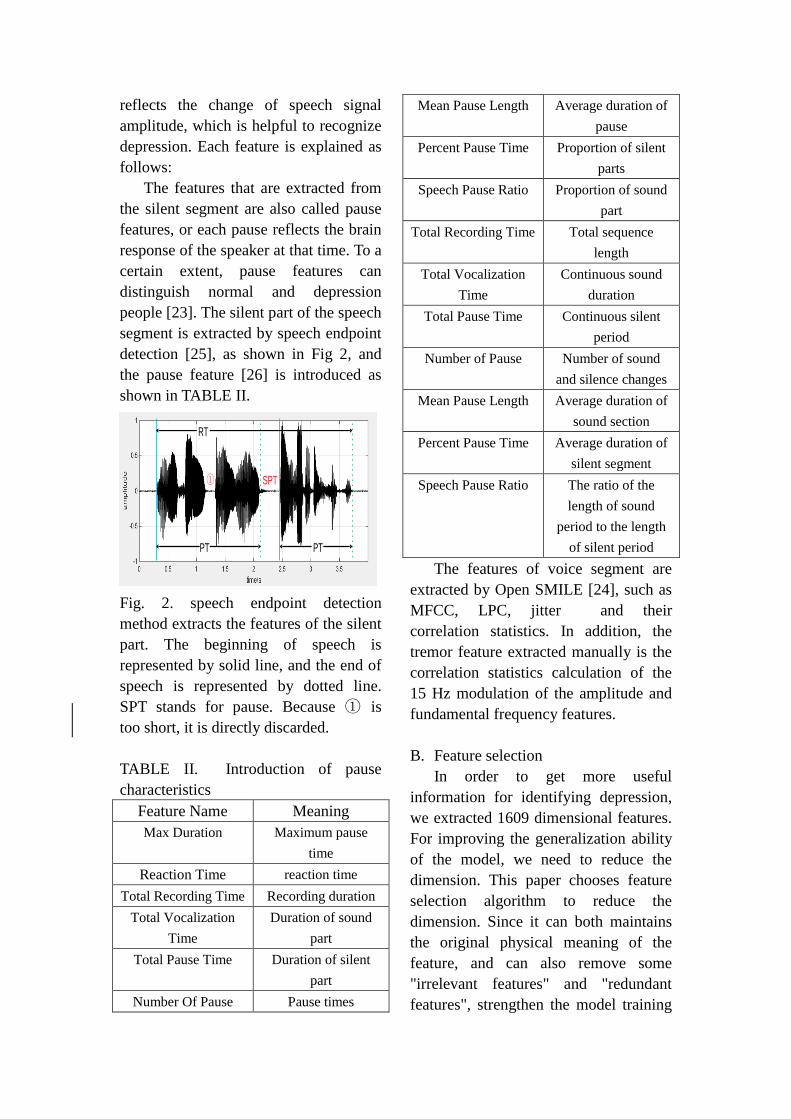
people [23]. The silent part of the speech
segment is extracted by speech endpoint
detection [25], as shown in Fig 2, and
the pause feature [26] is introduced as
shown in TABLE II.
Fig. 2. speech endpoint detection
method extracts the features of the silent
part. The beginning of speech is
represented by solid line, and the end of
speech is represented by dotted line.
SPT stands for pause. Because ① is
too short, it is directly discarded.
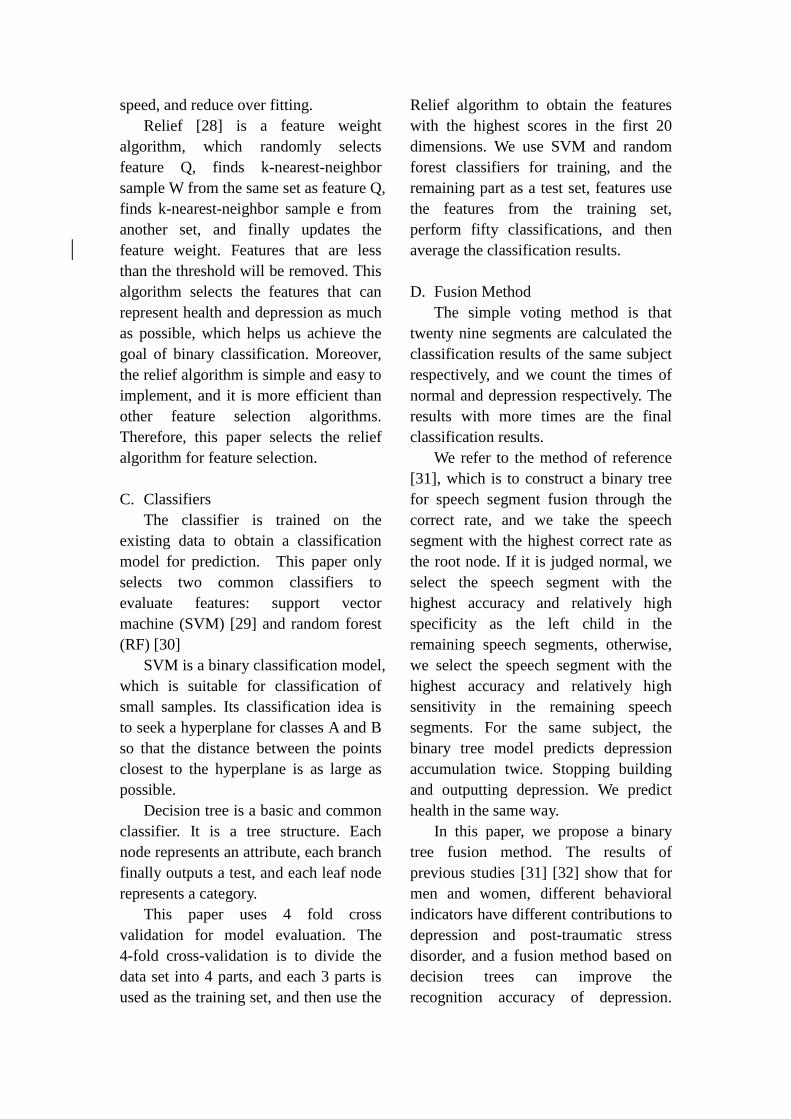
TABLE II. Introduction of pause
characteristics
Feature Name Meaning
Max Duration Maximum pause
time
Reaction Time reaction time
Total Recording Time Recording duration
Total Vocalization
Time
Duration of sound
part
Total Pause Time Duration of silent
part
Number Of Pause Pause times
Mean Pause Length Average duration of
pause
Percent Pause Time Proportion of silent
parts
Speech Pause Ratio Proportion of sound
part
Total Recording Time Total sequence
length
Total Vocalization
Time
Continuous sound
duration
Total Pause Time Continuous silent
period
Number of Pause Number of sound
and silence changes
Mean Pause Length Average duration of
sound section
Percent Pause Time Average duration of
silent segment
Speech Pause Ratio The ratio of the
length of sound
period to the length
of silent period
The features of voice segment are
extracted by Open SMILE [24], such as
MFCC, LPC, jitter and their
correlation statistics. In addition, the
tremor feature extracted manually is the
correlation statistics calculation of the
15 Hz modulation of the amplitude and
fundamental frequency features.
B. Feature selection
In order to get more useful
information for identifying depression,
we extracted 1609 dimensional features.
For improving the generalization ability
of the model, we need to reduce the
dimension. This paper chooses feature
selection algorithm to reduce the
dimension. Since it can both maintains
the original physical meaning of the
feature, and can also remove some
"irrelevant features" and "redundant
features", strengthen the model training
RT
PT PT
SPT①
speed, and reduce over fitting.
Relief [28] is a feature weight
algorithm, which randomly selects
feature Q, finds k-nearest-neighbor
sample W from the same set as feature Q,
finds k-nearest-neighbor sample e from
another set, and finally updates the
feature weight. Features that are less
than the threshold will be removed. This
algorithm selects the features that can
represent health and depression as much
as possible, which helps us achieve the
goal of binary classification. Moreover,
the relief algorithm is simple and easy to
implement, and it is more efficient than
other feature selection algorithms.
Therefore, this paper selects the relief
algorithm for feature selection.
C. Classifiers
The classifier is trained on the
existing data to obtain a classification
model for prediction. This paper only
selects two common classifiers to
evaluate features: support vector
machine (SVM) [29] and random forest
(RF) [30]
SVM is a binary classification model,
which is suitable for classification of
small samples. Its classification idea is
to seek a hyperplane for classes A and B
so that the distance between the points
closest to the hyperplane is as large as
possible.
Decision tree is a basic and common
classifier. It is a tree structure. Each
node represents an attribute, each branch
finally outputs a test, and each leaf node
represents a category.
This paper uses 4 fold cross
validation for model evaluation. The
4-fold cross-validation is to divide the
data set into 4 parts, and each 3 parts is
used as the training set, and then use the
Relief algorithm to obtain the features
with the highest scores in the first 20
dimensions. We use SVM and random
forest classifiers for training, and the
remaining part as a test set, features use
the features from the training set,
perform fifty classifications, and then
average the classification results.
D. Fusion Method
The simple voting method is that
twenty nine segments are calculated the
classification results of the same subject
respectively, and we count the times of
normal and depression respectively. The
results with more times are the final
classification results.
We refer to the method of reference
[31], which is to construct a binary tree
for speech segment fusion through the
correct rate, and we take the speech
segment with the highest correct rate as
the root node. If it is judged normal, we
select the speech segment with the
highest accuracy and relatively high
specificity as the left child in the
remaining speech segments, otherwise,
we select the speech segment with the
highest accuracy and relatively high
sensitivity in the remaining speech
segments. For the same subject, the
binary tree model predicts depression
accumulation twice. Stopping building
and outputting depression. We predict
health in the same way.
In this paper, we propose a binary
tree fusion method. The results of
previous studies [31] [32] show that for
men and women, different behavioral
indicators have different contributions to
depression and post-traumatic stress
disorder, and a fusion method based on
decision trees can improve the
recognition accuracy of depression.
Therefore, we propose a new tree fusion
scheme. It's different from the second
method. Our method is an automatic
method to fuse SVM models of multiple
speech segments, in which the root node
is the most sensitive SVM model, and
the subsequent nodes are also selected
according to the sensitivity and
specificity.
We use specificity and sensitivity to
build a binary tree for speech segment
fusion. The binary tree is a tree structure
with a maximum of two sub trees at
each node. Usually, the sub trees are
called left subtree and right subtree.
Sensitivity refers to the probability of
not being missed when diagnosing a
disease, and specificity refers to the
probability that there is no misdiagnosis
when diagnosing a disease. Therefore,
we use specificity and sensitivity to
evaluate the ability to identify health and
depression, respectively. We use this
binary tree to simulate the process of
diagnosing depression in the scale. The
modeling process is to set the most
sensitive speech segment as the root
node. If the judgment is normal, the
most specific speech segment is selected
as the left child among the remaining
speech segments. Otherwise, the most
sensitive speech segment is selected as
the right child among the remaining
speech segments. For the same subject,
the binary tree model predicts health
cumulatively twice, that is, stops
building, outputs healthy results, and
predicts depression for the same way.
Each node of the binary tree is an SVM
model of the selected speech segment,
which is used to output the result. A
binary tree has a maximum of four
layers, so it is fast to model and has a
certain generalization ability. The
pseudocode for creating a binary tree is
as follows:
Begin
health = 0;// Number of times is that
the model judged that
the subject was healthy
depression = 0; // Number of times
is that the model
judged that the
subject was
depression
// Assign the most sensitive speech
segment to the root node
Node.data = max(sensitivity);
while(health < 2 || depression <2)
if(SVM(node.data) == 1)
// Select the most specific
speech segment among
the remaining speech
segments as the left child
node.left.data =
max(specificity);
node = node.left;
health++;
else
// Select the most sensitive
speech segment among
the remaining speech
segments as the right
child
node.right.data=
max(sensitivity);
node = node.right;
depression ++;
// Output result
if health == 2
return health;
else
return depression;
end
end
IV. EXPERIMENTS AND
RESULTS
Previous studies have proved that
paradigm fusion can improve the
accuracy of the model. Different
paradigms have different abilities to
recognize health and depression. The
accuracy can only represent the overall
performance of the paradigm. We need
to use specificity and sensitivity to
evaluate the ability of the paradigm to
recognize health and depression
respectively. Therefore, we assume that
the performance of speech segment
fusion can be improved by building a
binary tree with specificity and
sensitivity. In this experiment, three
fusion methods are used to fuse the
classification results of each speech
segment. Among them, the feature is the
twenty dimensional feature with the
highest score selected by relief
algorithm.
We calculate the performance of
each speech segment separately as a
comparison with the results of the fusion
method. The process is as follows:
First, we divide the data set into 4
parts by using 4 fold cross validation,
each 3 parts are used as the training set,
then we get the top 20 dimension
features by Relief algorithm, use SVM
and random forest classifiers for training,
the remaining one is used as the test set,
and use the features from the training set
for 50 times of classification, and finally
average the classification results.
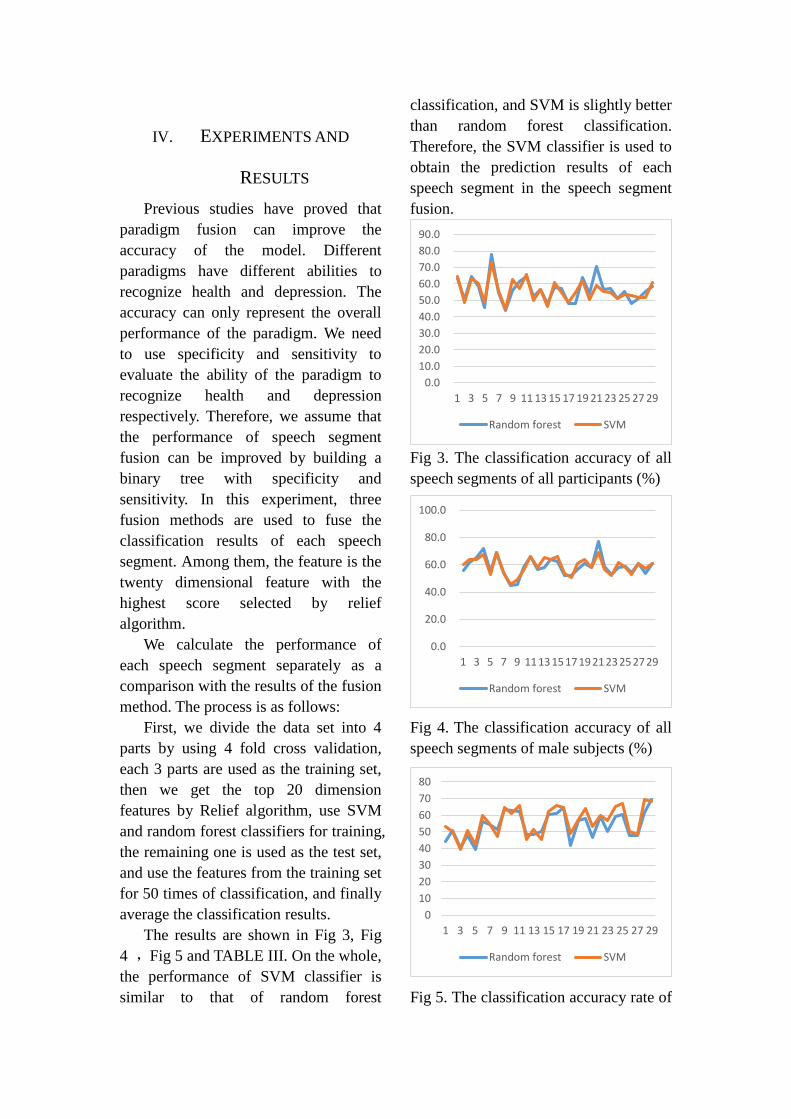
The results are shown in Fig 3, Fig
4 ,Fig 5 and TABLE III. On the whole,
the performance of SVM classifier is
similar to that of random forest
classification, and SVM is slightly better
than random forest classification.
Therefore, the SVM classifier is used to
obtain the prediction results of each
speech segment in the speech segment
fusion.
Fig 3. The classification accuracy of all
speech segments of all participants (%)
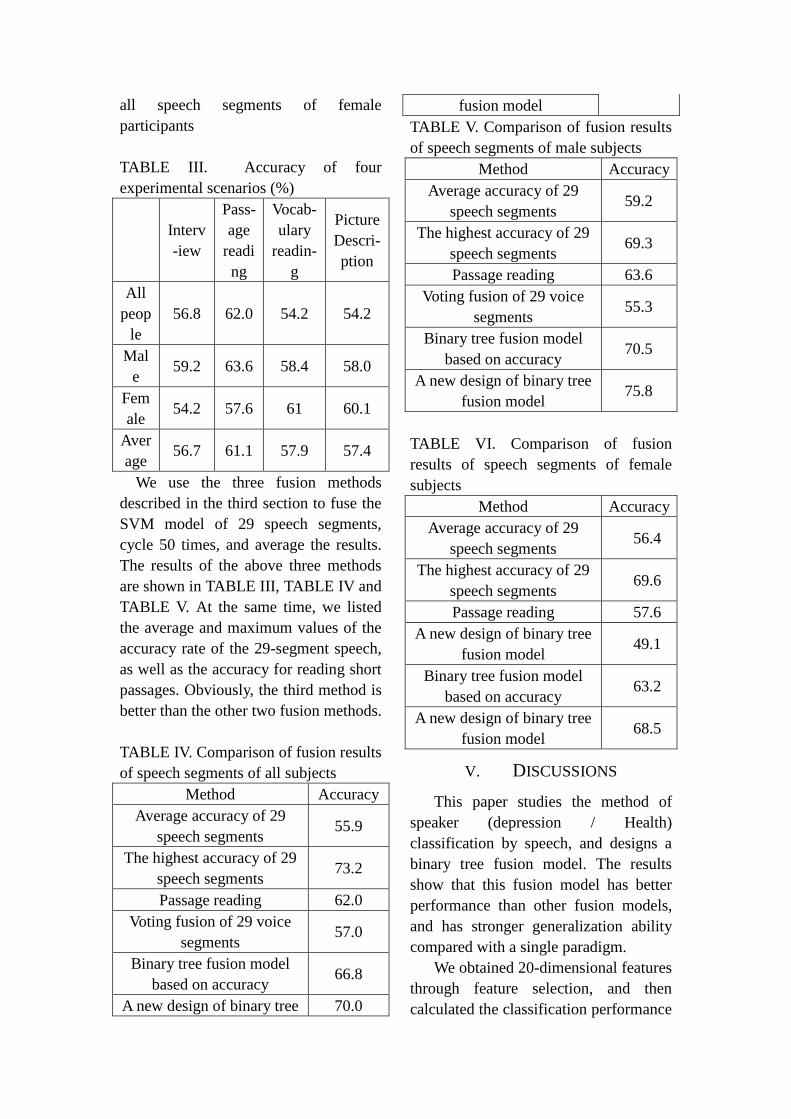
Fig 4. The classification accuracy of all
speech segments of male subjects (%)
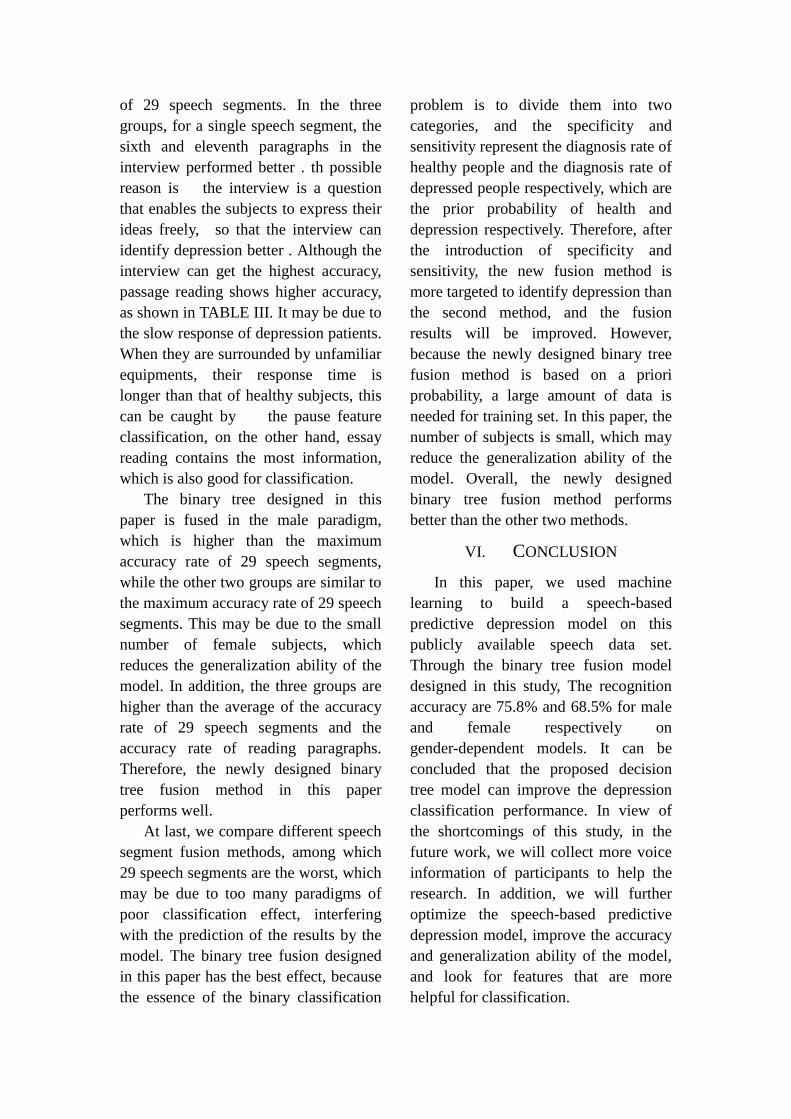
Fig 5. The classification accuracy rate of
0.0
10.0
20.0
30.0
40.0
50.0
60.0
70.0
80.0
90.0
1 3 5 7 9 11 13 15 17 19 21 23 25 27 29
Random forest SVM
0.0
20.0
40.0
60.0
80.0
100.0
1 3 5 7 9 11 13 15 17 19 21 23 25 27 29
Random forest SVM
0
10
20
30
40
50
60
70
80
1 3 5 7 9 11 13 15 17 19 21 23 25 27 29
Random forest SVM
all speech segments of female
participants
TABLE III. Accuracy of four
experimental scenarios (%)
Interv
-iew
Pass-
age
readi
ng
Vocab-
ulary
readin-
g
Picture
Descri-
ption
All
peop
le
56.8 62.0 54.2 54.2
Mal
e 59.2 63.6 58.4 58.0
Fem
ale 54.2 57.6 61 60.1
Aver
age 56.7 61.1 57.9 57.4
We use the three fusion methods
described in the third section to fuse the
SVM model of 29 speech segments,
cycle 50 times, and average the results.
The results of the above three methods
are shown in TABLE III, TABLE IV and
TABLE V. At the same time, we listed
the average and maximum values of the
accuracy rate of the 29-segment speech,
as well as the accuracy for reading short
passages. Obviously, the third method is
better than the other two fusion methods.
TABLE IV. Comparison of fusion results
of speech segments of all subjects
Method Accuracy
Average accuracy of 29
speech segments 55.9
The highest accuracy of 29
speech segments 73.2
Passage reading 62.0
Voting fusion of 29 voice
segments 57.0
Binary tree fusion model
based on accuracy 66.8
A new design of binary tree 70.0
fusion model
TABLE V. Comparison of fusion results
of speech segments of male subjects
Method Accuracy
Average accuracy of 29
speech segments 59.2
The highest accuracy of 29
speech segments 69.3
Passage reading 63.6
Voting fusion of 29 voice
segments 55.3
Binary tree fusion model
based on accuracy 70.5
A new design of binary tree
fusion model 75.8
TABLE VI. Comparison of fusion
results of speech segments of female
subjects
Method Accuracy
Average accuracy of 29
speech segments 56.4
The highest accuracy of 29
speech segments 69.6
Passage reading 57.6
A new design of binary tree
fusion model 49.1
Binary tree fusion model
based on accuracy 63.2
A new design of binary tree
fusion model 68.5
V. DISCUSSIONS
This paper studies the method of
speaker (depression / Health)
classification by speech, and designs a
binary tree fusion model. The results
show that this fusion model has better
performance than other fusion models,
and has stronger generalization ability
compared with a single paradigm.
We obtained 20-dimensional features
through feature selection, and then
calculated the classification performance
of 29 speech segments. In the three
groups, for a single speech segment, the
sixth and eleventh paragraphs in the
interview performed better . th possible
reason is the interview is a question
that enables the subjects to express their
ideas freely, so that the interview can
identify depression better . Although the
interview can get the highest accuracy,
passage reading shows higher accuracy,
as shown in TABLE III. It may be due to
the slow response of depression patients.
When they are surrounded by unfamiliar
equipments, their response time is
longer than that of healthy subjects, this
can be caught by the pause feature
classification, on the other hand, essay
reading contains the most information,
which is also good for classification.
The binary tree designed in this
paper is fused in the male paradigm,
which is higher than the maximum
accuracy rate of 29 speech segments,
while the other two groups are similar to
the maximum accuracy rate of 29 speech
segments. This may be due to the small
number of female subjects, which
reduces the generalization ability of the
model. In addition, the three groups are
higher than the average of the accuracy
rate of 29 speech segments and the
accuracy rate of reading paragraphs.
Therefore, the newly designed binary
tree fusion method in this paper
performs well.
At last, we compare different speech
segment fusion methods, among which
29 speech segments are the worst, which
may be due to too many paradigms of
poor classification effect, interfering
with the prediction of the results by the
model. The binary tree fusion designed
in this paper has the best effect, because
the essence of the binary classification
problem is to divide them into two
categories, and the specificity and
sensitivity represent the diagnosis rate of
healthy people and the diagnosis rate of
depressed people respectively, which are
the prior probability of health and
depression respectively. Therefore, after
the introduction of specificity and
sensitivity, the new fusion method is
more targeted to identify depression than
the second method, and the fusion
results will be improved. However,
because the newly designed binary tree
fusion method is based on a priori
probability, a large amount of data is
needed for training set. In this paper, the
number of subjects is small, which may
reduce the generalization ability of the
model. Overall, the newly designed
binary tree fusion method performs
better than the other two methods.
VI. CONCLUSION
In this paper, we used machine
learning to build a speech-based
predictive depression model on this
publicly available speech data set.
Through the binary tree fusion model
designed in this study, The recognition
accuracy are 75.8% and 68.5% for male
and female respectively on
gender-dependent models. It can be
concluded that the proposed decision
tree model can improve the depression
classification performance. In view of
the shortcomings of this study, in the
future work, we will collect more voice
information of participants to help the
research. In addition, we will further
optimize the speech-based predictive
depression model, improve the accuracy
and generalization ability of the model,
and look for features that are more
helpful for classification.
ACKNOWLEDGMENT
This work was supported in part by
the National Key Research and
Development Program of China (Grant
No. 2019YFA0706200), in part by the
National Natural Science Foundation of
China (Grant No.61632014,
No.61627808, No.61210010,
No.61802159), in part by the National
Basic Research Program of China (973
Program, Grant No.2014CB744600),and
in part by the Program of Beijing
Municipal Science & Technology
Commission (Grant
No.Z171100000117005).
REFERENCES
[1] Mandrusiak M , Rudd M D , Joiner T E ,
et al. Warning Signs for Suicide on the
Internet: A Descriptive Study[J]. Suicide
and Life‐Threatening Behavior, 2006,
36.
[2] Olesen J , Gustavsson A , Svensson M ,
et al. The economic cost of brain
disorders in Europe[J]. European Journal
of Neurology, 2012, 19(1):155-162.
[3] K. Kroenke, R. L. Spitzer, and J. B.
Williams, "The PHQ-9: validity of a
brief depression severity measure,"
Journal of General Internal Medicine,
vol. 16, pp. 606-613, 2001.
[4] Hamilton M A X . A Rating Scale for
Depression[J]. Journal of Neurology
Neurosurgery & Psychiatry, 1960,
23(1):56-62.
[5] Kupfer, D. Foster, F. G. Interval between
onset of sleep and rapid-eye-movement
sleep as an indicator of depression [J].
Lancet. 1972, 300: 684-686.
[6] Girard, J. M., Cohn, J. F., Mahoor, M. H,
et al. Social risk and depression: Evidence
from manual and automatic facial
expression analysis[C]. IEEE
International Conference and Workshops
on Automatic Face and Gesture
Recognition. 2013: 1-8.
[7] France D J , Shiavi R G , Silverman S ,
et al. Acoustical properties of speech as
indicators of depression and suicidal
risk[J]. IEEE Transactions on
Biomedical Engineering, 2000,
47(7):829-837.
[8] Mitra V, Shriberg E. Effects of feature
type, learning algorithm and speaking
style for depression detection from
speech[C]//2015 IEEE International
Conference on Acoustics, Speech and
Signal Processing (ICASSP). IEEE, 2015:
4774-4778.
[9] Gábor Kiss, Klára Vicsi. Comparison of
read and spontaneous speech in case of
Automatic Detection of Depression[C]//
CogInfoCom 2017. IEEE, 2017.
[10] Asgari M, Shafran I. Improvements to
harmonic model for extracting better
speech features in clinical applications[J].
Computer Speech & Language, 2018, 47:
298-313.
[11] Mendiratta A, Scibelli F, Esposito A M, et
al. Automatic detection of depressive
states from speech[M]//Multidisciplinary
Approaches to Neural Computing.
Springer, Cham, 2018: 301-314.
[12] Ooi K E B, Lech M, Allen N B.
Multichannel weighted speech
classification system for prediction of
major depression in adolescents[J]. IEEE
Transactions on Biomedical Engineering,
2012, 60(2): 497-506.
[13] Kiss G, Vicsi K. Investigation of
cross-lingual depression prediction
possibilities based on speech
processing[C]//2017 8th IEEE
International Conference on Cognitive
Infocommunications (CogInfoCom).
IEEE, 2017: 000097-000102.
[14] He L, Cao C. Automated depression
analysis using convolutional neural
networks from speech[J]. Journal of
biomedical informatics, 2018, 83:
103-111.
[15] Zhao J , Su W , Jia J , et al. Research on
depression detection algorithm combine
acoustic rhythm with sparse face
recognition[J]. Cluster Computing, 2017.
[16] Yang L, Jiang D, Xia X, et al. Multimodal
measurement of depression using deep
learning models[C]//Proceedings of the
7th Annual Workshop on Audio/Visual
Emotion Challenge. ACM, 2017: 53-59.
[17] Scibelli F, Roffo G, Tayarani M, et al.
Depression Speaks: Automatic
Discrimination between Depressed and
Non-Depressed Speakers Based on
Nonverbal Speech Features[C]//2018
IEEE International Conference on
Acoustics, Speech and Signal Processing
(ICASSP). IEEE, 2018: 6842-6846.
[18] Do L L T N . American Psychiatric
Association Diagnostic and Statistical
Manual of Mental Disorders
(DSM-IV)[M]// Encyclopedia of Child
Behavior and Development. Springer US,
2011.
[19] Y, Lecrubier, and, et al. The Mini
International Neuropsychiatric Interview
(MINI). A short diagnostic structured
interview: reliability and validity
according to the CIDI[J]. European
Psychiatry, 1997.
[20] Do L L T N . American Psychiatric
Association Diagnostic and Statistical
Manual of Mental Disorders
(DSM-IV)[M]// Encyclopedia of Child
Behavior and Development. Springer US,
2011.
[21] Jason. The North Wind and the Sun[J].
2003, 15: 13-23.
[22] Gong X , Huang Y X , Wang Y , et al.
Revision of the Chinese facial affective
picture system[J]. Chinese Mental Health
Journal, 2011.
[23] Liu Z , Kang H , Feng L , et al. Speech
pause time: A potential biomarker for
depression detection[C]// IEEE
International Conference on
Bioinformatics & Biomedicine. IEEE
Computer Society, 2017.
[24] Eyben F , Martin Wöllmer, Björn
Schuller. openSMILE -- The Munich
Versatile and Fast Open-Source Audio
Feature Extractor[C]// Proceedings of the
9th ACM International Conference on
Multimedia, MM 2010. ACM, 2010.
[25] Sohn J , Kim N S , Sung W . A statistical
model-based voice activity detection[J].
IEEE Signal Processing Letters, 1999,
6(1):1-3.
[26] Liu Z , Kang H , Feng L , et al. Speech
pause time: A potential biomarker for
depression detection[C]// 2017 IEEE
International Conference on
Bioinformatics and Biomedicine (BIBM).
IEEE, 2017.
[27] Xie Y , Li D , Zhang D , et al. An
Improved Multi-label Relief Feature
Selection Algorithm for Unbalanced
Datasets[J]. 2017.
[28] Kira K , Rendell L A . The Feature
Selection Problem: Traditional Methods
and a New Algorithm[C]// Proceedings of
the 10th National Conference on Artificial
Intelligence. San Jose, CA, July 12-16,
1992. AAAI Press, 1992.
[29] Boser B E . A Training Algorithm for
Optimal Margin Classifiers[J].
Proceedings of Annual Acm Workshop on
Computational Learning Theory, 2008,
5:144--152.
[30] Breiman L . Random Forests[J]. Machine
Learning, 2001, 45(1):5-32.
[31] Yang L, Jiang D, He L, et al. Decision
Tree Based Depression Classification

from Audio Video and Language
Information[C]. acm multimedia, 2016:
89-96.
[32] Low L S A , Maddage N C , Lech M , et
al. Detection of Clinical Depression in
Adolescents ’ Speech During Family
Interactions[J]. IEEE Transactions on
Biomedical Engineering, 2011,
58(3):574-586.