Embed Size (px)
Citation preview

A novel method to calibrate DOI function of a PET detectorwith a dual-ended-scintillator readout
Yiping Shaoa�
Department of Imaging Physics, University of Texas M.D. Anderson Cancer Center,1515 Holcombe Boulevard, Unit 600, Houston, Texas 77030
Rutao YaoDepartment of Nuclear Medicine, State University of New York at Buffalo, 105 Parker Hall,3435 Main Street, Buffalo, New York 14214
Tianyu MaDepartment of Nuclear Medicine, State University of New York at Buffalo, 105 Parker Hall,3435 Main Street, Buffalo, New York 14214 and Department of Engineering Physics, Tsinghua University,Beijing, 100084, People’s Republic of China
�Received 5 May 2008; revised 26 September 2008; accepted for publication 20 October 2008;published 20 November 2008�
The detection of depth-of-interaction �DOI� is a critical detector capability to improve the PETspatial resolution uniformity across the field-of-view and will significantly enhance, in particular,small bore system performance for brain, breast, and small animal imaging. One promising tech-nique of DOI detection is to use dual-ended-scintillator readout that uses two photon sensors todetect scintillation light from both ends of a scintillator array and estimate DOI based on the ratioof signals �similar to Anger logic�. This approach needs a careful DOI function calibration toestablish accurate relationship between DOI and signal ratios, and to recalibrate if the detectioncondition is shifted due to the drift of sensor gain, bias variations, or degraded optical coupling, etc.However, the current calibration method that uses coincident events to locate interaction positionsinside a single scintillator crystal has severe drawbacks, such as complicated setup, long andrepetitive measurements, and being prone to errors from various possible misalignments among thesource and detector components. This method is also not practically suitable to calibrate multipleDOI functions of a crystal array. To solve these problems, a new method has been developed thatrequires only a uniform flood source to irradiate a crystal array without the need to locate theinteraction positions, and calculates DOI functions based solely on the uniform probability distri-bution of interactions over DOI positions without knowledge or assumption of detector responses.Simulation and experiment have been studied to validate the new method, and the results show thatthe new method, with a simple setup and one single measurement, can provide consistent andaccurate DOI functions for the entire array of multiple scintillator crystals. This will enable anaccurate, simple, and practical DOI function calibration for the PET detectors based on the designof dual-ended-scintillator readout. In addition, the new method can be generally applied to calibrat-ing other types of detectors that use the similar dual-ended readout to acquire the radiation inter-action position. © 2008 American Association of Physicists in Medicine.�DOI: 10.1118/1.3021118�
Key words: depth of interaction, detector calibration, positron emission tomography
I. INTRODUCTION
It is well known that the PET performance can be signifi-cantly improved if its detectors can measure depth-of-interaction �DOI�, since this will reduce the parallex errordue to the crystal penetration by energetic 511 keV gammaphotons, minimize the spatial resolution loss �mainly alongthe radial direction� at the off-center region, and improve thespatial resolution uniformity across the field-of-view �FOV�.1
This DOI measurement capability is particularly importantfor a system with small bore configuration since it leads tosevere parallex errors.2,3 One common remedy to this prob-lem is to use short crystals ��10 mm�; however, this signifi-
4
cantly reduces system sensitivity.5829 Med. Phys. 35 „12…, December 2008 0094-2405/2008/35„
There are several different detector designs to measureDOI, with different performance trade-offs.5–17 One designthat has been well studied is to measure DOI by detectingsignals from both ends of a crystal with compact photonsensors such as avalanche photo diodes �APDs�.8,14,18,19 Forsimplicity, this detector design is defined as “dual-ended-scintillator readout” in this study, or simply the DES readout.Since the ratio of the signals is related to the interactionposition along the crystal long axis, DOI can be calculatedbased on a predetermined function between the signal ratioand DOI, which in principle is to apply “Anger logic” tocalculate the one-dimensional interaction position. This func-tion, defined as DOI function in this study, has to be experi-
mentally determined for each and every crystal inside a crys-582912…/5829/12/$23.00 © 2008 Am. Assoc. Phys. Med.

5830 Shao, Yao, and Ma: A novel method to calibrate the DOI function 5830
tal array. The required accuracy in determining such DOIfunction varies with detector and system designs, and usuallyis �5.0 mm for the system with detector ring diameter at�10.0 cm or larger.14,18,19 Since DOI function may drift overtime due to various factors such as the gain drift of photonsensors, variations of operating conditions �e.g., voltage biasand temperature�, and the change of optical coupling be-tween the scintillators and photon sensors, etc., DOI functionis expected to be recalibrated periodically during the opera-tion of a practical PET system.
Several methods have been studied to measure DOI func-tion of either a single crystal or an array of crystals withone-to-one coupling between a crystal and a photonsensor.20–22 However, as will be illustrated in the followingsection, there are severe drawbacks or limitations associatedwith these current methods which make them difficult to beused for a practical PET detector.
In this study, we have developed and validated a newcalibration method to measure DOI function with the DESreadout. The method was investigated with both Monte Carlosimulations and experimental measurements and comparedwith the current method. The results have shown that thenew method can accurately measure DOI function withoutthe technical problems existing in the current methods. Thenew method is expected to provide a good solution to themeasurement and recalibration of DOI functions for PET de-tectors that use the DES readout with a one-to-one couplingbetween a crystal and a photon sensor.
It is important to point out that both the current methodand new method are applied for a detector with an indepen-dent readout of one-to-one coupling between a crystal and aphoton sensor. In practice, many PET detectors are designedwith sharing of scintillation photons and/or electric signalsamong different crystals in order to reduce the complexity ofreadout. However, one performance drawback of these detec-tors is that the accuracy to determine the interaction crystaland DOI with DES readout will be reduced owing to thecrystal cross-talk. The level of this inaccuracy is dependent
APD APD
Timing signal from summed APDs
Timing signal from 2nd detector
Coincidence
circuit
Second detector
Pointsource
511 KeV γ
511 KeV γ
Valid eventtrigger
FIG. 1. Schematic drawing of the primary current method to measure DOIfunction. A primary scintillator crystal is read out from its two ends by twophoton sensors �e.g., avalanche photodiode�. A point source and a seconddetector are used to electronically collimate the interaction positions �DOI�.The ratio of measured signals from the first detector at different interactionpositions is used to calculate DOI function.
on the specific characteristics and amount of the crystal
Medical Physics, Vol. 35, No. 12, December 2008
cross-talk and needs to be addressed individually. The newmethod calibrates DOI function with independent crystalreadout and will provide a basis to further investigate theimpact from crystal cross-talk.
II. METHOD
II.A. Current methods of a DOI function measurement
The primary current method to determine DOI function isto use a coincidence method to locate the interaction positionfor measuring the relationship between DOI and the signalratio.8 As schematically shown in Fig. 1, a point source isplaced between the primary detector �with its DOI functionto be determined� and a second small dimension detector.Coincidence events between the two detectors are acquiredto electronically collimate the interaction �DOI� positionalong the long axis of the primary detector. The signal ratiosbetween the two photon sensors at the two ends of the pri-mary detector are calculated to establish the relationship be-tween this particular DOI position and its corresponding val-ues of signal ratios. In order to measure DOI function, whichis the relationship between DOI positions and the signal ra-tios over the entire crystal length, the point source and thesecond detector have to be moved along the long axis of theprimary detector for taking multiple measurements at differ-ent DOI positions.
There are several drawbacks associated with this method:It requires a complicated experimental setup of two detectorsand coincidence processing; it measures multiple DOI posi-tions over the crystal which leads to lengthy acquisition timeand potential detector performance variations; and it is proneto measurement errors due to potential misalignment amongthe detectors and the source, etc. More importantly, it is dif-ficult if not impossible for this method to measure DOI func-tions of all crystals inside an array, since inevitable intercrys-tal scatters can severely blur DOI localization. Therefore, itis very challenging to use this method to calibrate a practicalPET detector that consists of an array of crystals.
There are two other methods that have been developed tomeasure DOI function of an array of crystals, which arebriefly summarized below:
APD APD
D0Z
FIG. 2. Schematic drawing of the new method. There is no second detectorand coincidence processing. A parallel beam of gamma rays irradiates thecrystal to generate a uniform distribution of interaction positions over thecrystal length D.
�1� The second method is based on irradiating the crystals
5831 Shao, Yao, and Ma: A novel method to calibrate the DOI function 5831
f1m1r1
f2r2
m2
f1m1r1
f2r2
m2
(a)
(b)
30 cm
Point source
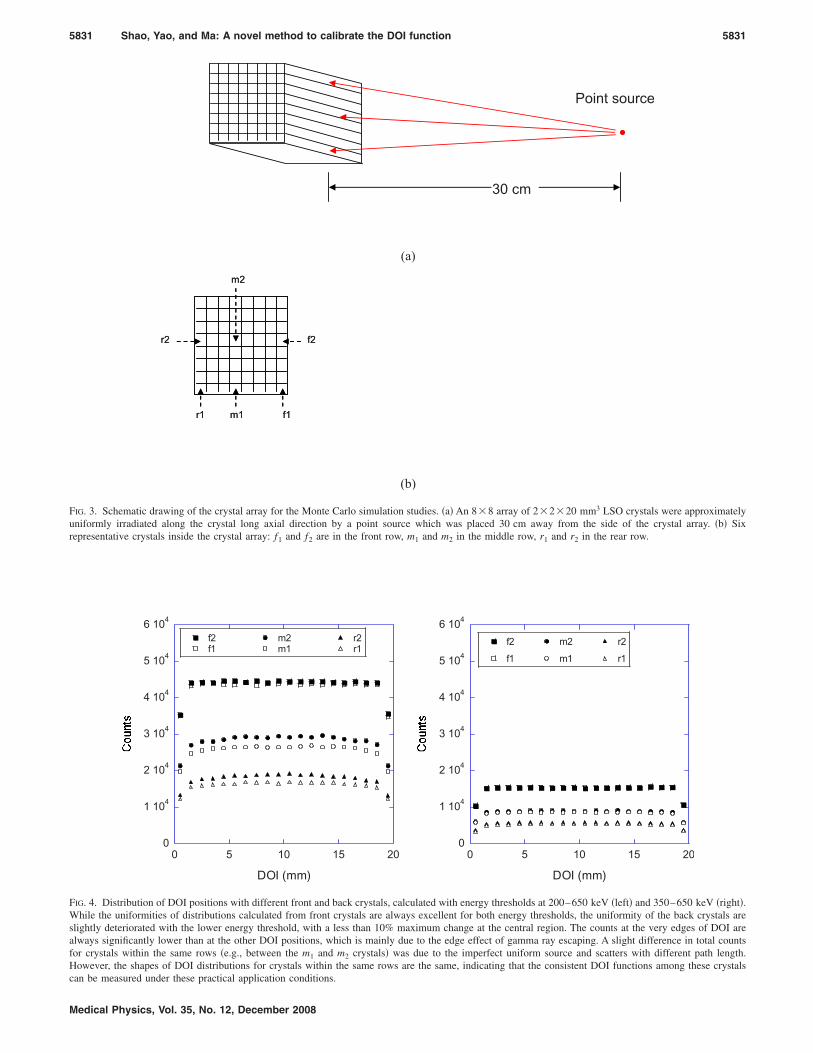
FIG. 3. Schematic drawing of the crystal array for the Monte Carlo simulation studies. �a� An 8�8 array of 2�2�20 mm3 LSO crystals were approximatelyuniformly irradiated along the crystal long axial direction by a point source which was placed 30 cm away from the side of the crystal array. �b� Sixrepresentative crystals inside the crystal array: f and f are in the front row, m and m in the middle row, r and r in the rear row.
1 2 1 2 1 20
1 104
2 104
3 104
4 104
5 104
6 104
0 5 10 15 20
f2f1
m2m1
r2r1
DOI (mm)
0
1 104
2 104
3 104
4 104
5 104
6 104
0 5 10 15 20
f2
f1
m2
m1
r2
r1
DOI (mm)
FIG. 4. Distribution of DOI positions with different front and back crystals, calculated with energy thresholds at 200–650 keV �left� and 350–650 keV �right�.While the uniformities of distributions calculated from front crystals are always excellent for both energy thresholds, the uniformity of the back crystals areslightly deteriorated with the lower energy threshold, with a less than 10% maximum change at the central region. The counts at the very edges of DOI arealways significantly lower than at the other DOI positions, which is mainly due to the edge effect of gamma ray escaping. A slight difference in total countsfor crystals within the same rows �e.g., between the m1 and m2 crystals� was due to the imperfect uniform source and scatters with different path length.However, the shapes of DOI distributions for crystals within the same rows are the same, indicating that the consistent DOI functions among these crystals
can be measured under these practical application conditions.Medical Physics, Vol. 35, No. 12, December 2008

5832 Shao, Yao, and Ma: A novel method to calibrate the DOI function 5832
from the imaging object side of the detector array, withthe gamma ray beam parallel to the long axis of thecrystals.21 Since the distribution of interaction probabil-ity along this direction should in theory be exponential,the density of detected DOI positions is also expected tobe exponential if both photon sensors have the samegain. Assuming that the detected signal ratios are lin-early dependent on DOI positions, one can extract theinformation about DOI function by fitting the energyspectra of the two detectors with corresponding expectedexponential functions. The drawbacks of the method arethat it is challenging to precisely align the long axis ofcrystals with the beam, and even a small misalignmentwith small deviation angle could lead to augmented er-rors; intercrystal scatter can significantly alter the ex-pected exponential distribution of DOI positions; and theaccuracy of the method is strongly dependent on thelinearity of the detected signals with DOI positions,while in reality this relationship is usually complicatedand can be very different from a linear function.18,19,23
�2� The third method uses LSO’s natural background radia-tion as a uniform source across the long axis of thecrystals.22 The method also assumes a linear relationshipbetween the detected signal ratios and DOI positions. Inaddition, it also requires symmetric performance be-tween the two photon sensors, which has to be achievedby adjusting their gains. By fitting and linearly dividingthe distribution of signal ratios detected from the photonsensors, one can estimate DOI function. Similar to thesecond method, the accuracy of the third method willstrongly depend on if there is a good linear relationshipbetween the detected signal ratios and DOI positions, aswell as equal signal gains of the two detectors. Besides,it requires estimating the rising and falling edges of thedistribution of signal ratios empirically from an addi-tional prior detector calibration, which is cumbersomeand can lead to more errors. If the gains of the photondetector shift differently, the method is unable to recali-
PMTPMTLSO (1.8x2x20 mm3)
LSO
30mm
PMTPMTPMTPMTLSO (1.8x2x20 mm3)
LSO
30mm
Na-22Na-22
FIG. 5. Schematic drawing of experimental setup for DOI measurement withthe new method. A 1.8�2�20 mm3 LSO crystal was wrapped with whiteTeflon tape and read out by two single-channel PMTs �Hamamatsu R7400-02�. A Na-22 point source was placed �213.0 mm away from the crystal.For measuring DOI function of a back crystal, a bulk of LSO with�30.0 mm thickness was placed between the crystal to be detected and thesource to mimic the attenuation and scatter effects that will pose to backcrystals. The detector operating conditions were kept the same during themeasurements.
brate DOI function.
Medical Physics, Vol. 35, No. 12, December 2008
Overall, the second and third methods are strongly depen-dent on several assumptions and approximations that may bevalid for certain particular detectors and operations. How-ever, they do not provide a general calibration method thatcan be used for different detector performances at variousdifferent detector operation conditions.
II.B. New method of a DOI function measurement
The concept of the new method is shown in Fig. 2: Thedetector is uniformly irradiated from the side so that interac-tions are uniformly distributed over the crystal depth. Theprobability of the interaction, P�z�, will be constantly distrib-uted over the axis z. Since the total probability of interactionequals to 1, we have
�0
D
P�z�dz = P�z��0
D
dz = P�z�*D = 1, �1�
where D is the total length of the crystal and z is the depth orDOI position. From Eq. �1�, we have P�z�=1 /D. The ratio ofsignals detected from two photon sensors at the two scintil-lator ends can be defined as
R = s1/�s1 + s2� , �2�
where s1 and s2 are the signal amplitudes from the two indi-vidual photon sensors. The collected histogram of R is de-noted as H�R�, which is a measured distribution of R. Aprobability density function �PDF� can be calculated fromH�R� as
PDF�R� = H�R���0
1
H�R�dR . �3�
PDF�R� is a measured probability corresponding to an inter-action at a DOI position z that will produce the signal ratioequal to R. If there is no signal dispersion from the detector
0
0.2
0.4
0.6
0.8
1
0 5 10 15 20
DOI (mm)
K=0.5
K=1.0
K=2.0
FIG. 6. Signal ratio as a function of DOI position with simulated interac-tions, with K=0.5, 1.0, and 2.0. A signal amplitude was calculated based onthe light collection function defined in Eq. �8� and �9�, without any disper-sion. These functions are considered as the original DOI functions. All thesecalculations were based on one front crystal, indicated as f2 in Fig. 3.
response, then there is a one-to-one relationship between

rgy t
5833 Shao, Yao, and Ma: A novel method to calibrate the DOI function 5833
DOI position z and the signal ratio R, and so will be theprobabilities of P�z� and PDF�R�. If there is signal dispersionfrom the detector response, this one-to-one relationship willbe between DOI position z and the mean of correspondingsignal ratios. Therefore, we have a general formula
�0
Z
P�z�dz = �0
R
PDF�R�dR . �4�
In general, Eq. �4� is valid for any distribution of interactionpositions. For a uniform distribution of interaction positionswith P�z�=1 /D, the left hand side of Eq. �4� equals to z /D.If we define z�=z /D as a normalized depth �ranging from 0.0to 1.0�, we have
z = D*�0
R
PDF�R�dR , �5�
or
0
0.005
0.01
0.015
0.02
0.025
0 0.2 0.4 0.6 0.8 1
K=0.5K=1.0K=2.0
Ratio S1/(S1+S2)
FIG. 7. Calculated PDFs without signal dispersion, with ene
0 5 10 15 200
0.2
0.4
0.6
0.8
1
DOI (mm)
K=0.5
K=1.0
K=2.0
0 50
0.2
0.4
0.6
0.8
1
FIG. 8. Calculated DOI functions without signal dispersion, with energy thr
were superimposed together with the original DOI functions �right�.Medical Physics, Vol. 35, No. 12, December 2008
z� = �0
R
PDF�R�dR . �6�
The left hand side of Eq. �5� and �6� is the exact DOI func-tion to be determined, and the right hand side is a function ofR that can be easily calculated from the measurement. Thisnew method immediately provides several important advan-tages over the current method:
�1� A single non-coincident data acquisition is good enoughto complete the measurement, which will vastly simplifycomplicated setup of the first method and eliminate theneed of multiple measurements at different locations thatis associated with lengthy acquisition time and source oferrors.
�2� The new method can be straightforwardly applied to allcrystals inside a detector array, since the distribution ofinteraction positions with intercrystal scatters is in prin-
0
0.005
0.01
0.015
0.02
0.025
0 0.2 0.4 0.6 0.8 1
K=0.5K=1.0K=2.0
Ratio S1/(S1+S2)
hresholds at 200–650 keV �left� and 350–650 keV �right�.
10 15 20
(mm)
K=0.5
K=1.0
2.0
0
0.2
0.4
0.6
0.8
1
0 5 10 15 20
DOI (mm)
K=0.5
K=1.0
K=2.0
ds at 200–650 keV �left� and 350–650 keV �middle�. Both DOI functions
DOI
K=
eshol

5834 Shao, Yao, and Ma: A novel method to calibrate the DOI function 5834
ciple also uniform if the detector is irradiated with auniform source and the effect of gamma ray escaping atcrystal edge is small.
�3� There is no assumption or approximation of any particu-lar relationship between the detector response and DOIpositions since Eq. �5� and �6� is valid for any PDF�R�.Therefore, the new method significantly simplifies thedata processing and consequently improves the accuracyin determining DOI function by avoiding any approxi-mation or assumption of detector response functions,and can be in theory applied as a general method to anydetector performance under different operating condi-tions.
�4� DOI function is measured continuously from one crystalend to the other, which accelerates the data processingwith a simple integration. More importantly, a continu-ous DOI function will permit DOI to be calculatedstraightforwardly for any values of signal ratios, an ad-vantage to avoid any potential error from binningeffects.
0
0.2
0.4
0.6
0.8
1
0 5 10 15 20
DOI (mm)
0
0.2
0.4
0.6
0.8
1
0 5 10 15 20
DOI (mm)
0
0.2
0.4
0.6
0.8
1
0 5 10 15 20
DOI (mm)
K=0.5
K=1.0
K=2.0
DOI (mm)0 5 10 15 20
0
0.2
0.4
0.6
0.8
1
FIG. 9. Similar signal ratio as a function of DOI position as shown in Fig. 6,but the signals were further dispersed with an 18% energy resolution basedon the algorithm defined in Eq. �10�.
0
0.005
0.01
0.015
0.02
0.025
0 0.2 0.4 0.6 0.8 1
K = 0.5K = 1.0K = 2.0
Ratio S1/(S1+S2)
FIG. 10. Calculated PDFs with signal dispersion, with energy th
Medical Physics, Vol. 35, No. 12, December 2008
To quantitatively understand the accuracy of the newmethod under various conditions that can significantly affectDOI measurement, such as impact of gamma ray scatters andenergy depositions, different gamma interactions for crystalsat the surface or inside the array, and limited energy resolu-tions of a realistic detector, etc., Monte Carlo simulationsand experimental measurements have been conducted andare illustrated in the following.
II.C. Monte Carlo simulation studies
GATE �GEANT4 application for tomographic emission�simulation software was used to simulate gamma interactionswith a practical detector configuration.24 As shown in Fig. 3,the detector consists of an 8�8 array of 2�2�20 mm3
LSO crystals. Each crystal is optically isolated from the oth-ers, and measured by photon sensors from its two ends.Since a point source at a distance is usually used in practiceto mimic a uniform irradiation source, a point source wasplaced 30 cm away in the simulation from the side of thecrystal array and at the line that is perpendicular to the sideand across the center of the crystal array. With this setup, anapproximate parallel beam of gamma rays was simulated as auniform irradiation source to the array, with a �2° maximumspreading angle from the ideal parallel beam. All interactionpositions and deposited energies were recorded, includingintercrystal scatters among different crystals.
For the sake of simplicity, the crystals that were exposeddirectly to the gamma ray beam are defined as the front crys-tals; the rest of the crystals are defined as the back crystals.In general, the front crystals were irradiated with mostly511 keV gamma rays and a small fraction of backscatters,while the back crystals could have significantly more inter-crystal scatters with less than 511 keV energies. As an ex-ample, the distributions of simulated DOI positions for thefront and back crystals with different energy thresholds areshown in Fig. 4. The results indicate that DOI positions witha 350–650 keV energy window are uniformly distributedacross the crystal length for all crystals, except drops at the
0
0.005
0.01
0.015
0.02
0.025
0 0.2 0.4 0.6 0.8 1
K=0.5K=1.0K=2.0
Ratio S1/(S1+S2)
resholds at 200–650 keV �left� and 350–650 keV �right�.

5835 Shao, Yao, and Ma: A novel method to calibrate the DOI function 5835
very ends due to the gamma ray escaping at the scintillatoredges. DOI positions with a 200–650 keV energy windoware slightly less uniformly distributed with the back crystals.This is because lower-energy scatters tend to spread to alarger region and consequently there are more gamma rayescaping at the crystal edges. Simulations with both energywindows were carried out for the calculation of DOIfunctions.
The signals of each crystal were processed individually,assuming that there was no signal crosstalk or multiplexingamong different crystals. For two photon sensors, their lightcollections are defined as f1�z�� and f2�z��, where z� is thenormalized DOI. In general, these light functions are mono-tonic functions of z�. The amplification gains �usually com-bined with their readout electronics� of the photon sensorsare defined as g1 and g2, with k=g1 /g2. According to Eq. �2�,the ratio of signals will be
R =g1 � f1�z��
g1 � f1�z�� + g2 � f2�z��=
k � f1�z��k � f1�z�� + f2�z��
. �7�
Instead of using a photon propagation simulation that de-pends on the specific crystal surface conditions,25 which de-mands complex processing and long calculation time, thesine functions were modeled as the scintillation light collec-tion functions of the photon sensors, which in general pro-vides a basis to study the relationship between DOI functionmeasurement and the realistic signal detection andprocessing.20,22,23 These functions are defined as
f1�z�� = sin��
2z� + b , �8�
f2�z�� = sin��
2�1 − z�� + b , �9�
where b is a constant baseline value to model the nonzerovalue of light collection at the crystal edges. For this simu-lation, b is chosen to be 0.2. The k values are chosen to be0.5, 1.0, and 2.0 respectively to represent reasonable range of
0 5 10 15 200
0.2
0.4
0.6
0.8
1
DOI (mm)
K=0.5
K=1.0
K=2.0
0 50
0.2
0.4
0.6
0.8
1
FIG. 11. Calculated DOI functions with signal dispersion, with energy threshsuperimposed together with dispersed original DOI function �right�.
different gain ratios between the two photon sensors under
Medical Physics, Vol. 35, No. 12, December 2008
normal operating conditions, and there should be an inverserelationship between the calculations with k=0.5 or 2.0.
The signal dispersion related to the detector energy reso-lution was also modeled: The signal amplitude S0, which wasoriginally calculated from Eqs. �8� and �9�, was blurred ac-cording to a Gaussian function, with S0 as the mean and thefollowing as the standard deviation:
� =S0
2.355��E
E , �10�
where ��E /E� is the detector energy resolution, which isusually a complicated function of DOI positions and signalamplitudes. To simplify the problem, a constant value of en-ergy resolution �18%� over different DOI positions was usedas a first-order approximation to blur the signals.
10 15 20
I (mm)
K=0.5
K=1.0
=2.0
0
0.2
0.4
0.6
0.8
1
0 5 10 15 20
DOI (mm)
0
0.2
0.4
0.6
0.8
1
0 5 10 15 20
DOI (mm)
0
0.2
0.4
0.6
0.8
1
0 5 10 15 20
DOI (mm)
K=0.5
K=1.0
K=2.0
DOI (mm)0 5 10 15 20
0
0.4
0.2
0.6
0.8
1
t 200–650 keV �left� and 350–650 keV �middle�. Both DOI functions were
0 5 10 15 200
0.2
0.4
0.6
0.8
1
DOI (mm)
K=0.5
K=1.0
K=2.0
FIG. 12. Total 36 DOI functions calculated from combinations of energythresholds �200–650 and 350–650 keV�, signal dispersions �with and with-out�, K values �0.5, 1.0, and 2.0�, and crystal locations �one front and twoback crystals, or f2, m2, and r2 defined in Fig. 3�. The differences among the
DO
K
olds a
functions with the same K value are negligibly small.

5836 Shao, Yao, and Ma: A novel method to calibrate the DOI function 5836
II.D. Experiment validation
The setup for DOI function measurement is very similarto the one shown in Fig. 1, which has been used previouslyby several groups.8,14,18,19 A 1.8�2�20 mm3 LSO crystalwas connected to two single-channel PMTs �HamamatsuR7400-02� at its two ends. Since the purpose of this experi-mental study is to evaluate the new method for DOI functionmeasurement and its accuracy, PMTs were used to take ad-vantage of their simple setup and good performance stabilitycompared to semiconductor photon sensors. The signal am-plitudes, S1 and S2, from these two PMTs were measured,and the ratio of the signals, R=S1 / �S1+S2�, was recorded asa function of DOI position.
DOI function was first measured with the primary currentmethod: A second detector, which consisted of a 2�2�10 mm3 LSO crystal coupled to a single-channel photonsensor �Photonique SSPM-0409�, was used to determineDOI positions with an electronic collimation. A Na-22 pointsource ��1.0 mm diameter� and the second detector werestepped over the first detector along its long crystal axialdirection. The step size was 2.0 mm. Signals from bothPMTs at each DOI position were acquired and summed withequal signal gains. A 300 keV low energy threshold forsummed signal was used during acquisitions. The ratio of thesignals R was calculated and DOI function was measured asR�z�. The accuracy of DOI localization in the first detectorby the electronic collimation method can be estimated fromthe geometry of the source and detector positions. With asource diameter �1.0 mm and the distances between thesource and the first and second detectors being equal to�60.0 mm, the uncertainty of DOI localization was esti-mated to be �1.4 mm.
DOI function was also measured with the new methodwithout the use of the second detector. The Na-22 pointsource was placed �21.3 cm away from the crystal, whichprovided gamma rays that irradiated the first detector with a�2.7° maximum angle deviating from the parallel beams. Tomeasure DOI functions of the back crystals, a simple setupwas used to mimic the similar impact of intercrystal scatters:
0
0.2
0.4
0.6
0.8
1
-4 -3 -2 -1 0 1 2 3 4
∆DOI (mm)
K=0.5
0
0.2
0.4
0.6
0.8
1
-4 -3 -2
K=1.0
FIG. 13. Distributions of DOI calculation errors with different K values basederrors are less than 1.0 mm.
A bulk of LSO scintillator with 30.0 mm thickness was
Medical Physics, Vol. 35, No. 12, December 2008
placed between the first LSO crystal and the point source�Fig. 5�, while all measurement conditions were kept thesame. Therefore, without or with the use of this bulky crys-tal, DOI functions can be easily measured and compared inthe situation with the front or back crystals in a crystal array.It is expected that DOI functions measured from both experi-ments should be the same, since the operating conditions ofthe first detector had been kept the same during the twomeasurements.
III. RESULTS
III.A. The results of Monte Carlo simulation studies
To quantitatively understand the effectiveness and accu-racy of the new method, signals from some exemplified frontand back crystals were calculated from the raw data of simu-lated gamma interactions and were used to calculate variousdistributions and DOI functions, either without or with signaldispersions.
The relationship between the original DOI positions withrespect to the corresponding signal ratios without any signaldispersion is shown in Fig. 6, which was calculated from a
0 1 2 3 4
I (mm)
0
0.2
0.4
0.6
0.8
1
-4 -3 -2 -1 0 1 2 3 4
∆DOI (mm)
K=2.0
e calculation of a back crystal. From left to right, K=0.5, 1.0, and 2.0. Most
0
50
100
150
200
250
300
350
-2 -1.5 -1 -0.5 0 0.5 1 1.5 2
∆DOI (mm)
FIG. 14. A profile that corresponds to the projection horizontally across DOIerror distribution shown in Fig. 13 with K=1.0 and signal ratios
-1
∆DO
on th
=0.5�0.01.

t DO
5837 Shao, Yao, and Ma: A novel method to calibrate the DOI function 5837
typical front crystal with different K values equal to 0.5, 1.0,and 2.0. It is clear that there is a unique one-to-one corre-spondence between a DOI position and a signal ratio. Distri-butions of PDF functions with different energy thresholdswere calculated and shown in Fig. 7, and the calculated DOIfunctions with the new method are shown in Fig. 8. Thedifferences between these functions with the same K valuesare small, indicating that the overall distribution of signalratios is not sensitive to slightly nonuniformity of distribu-tion of original DOI positions.
When the energy resolution is not perfect, the relation-ships between the original DOI positions and the signal ra-tios are no longer unique, and interactions at the same DOIposition will have different signal ratios due to the signaldispersion. The same data shown in Fig. 6 were reprocessedwith signal dispersion corresponding to an 18% energy res-olution and shown in Fig. 9. Distributions of typical PDFfunctions at different energy thresholds were recalculatedand shown in Fig. 10. DOI functions were recalculated aswell and shown in Fig. 11. The differences between the func-tions with the same K values are also small, indicating thatthe overall distribution of signal ratios may not be sensitiveto different energy thresholds, although this remains to befurther studied with more realistic simulation based on lightphoton tracking.
However, as shown in Fig. 11, the differences among DOIfunctions with different K values are distinctively large, in-dicating that DOI function is sensitive to the gain variationsbetween the two photon sensors in the DES readout, and it isnecessary to recalibrate DOI function when the detector gainchanges.
Similar calculations were applied to the back crystals aswell. In Fig. 12, DOI functions calculated with different en-ergy thresholds and resolutions from two different back crys-tals that were selected from the middle and faraway rear sideof the detector array were superimposed with the ones cal-culated from the front crystal. They were calculated with andwithout energy dispersions. The differences among the 12different DOI functions with the same K values are verysmall so that they can be practically considered to be identi-
0
50
100
150
200
250
300
350
0 1 2 3 4 5
Signal amplitude (Volts)
0
50
100
150
200
250
300
350
0 1
Sign
FIG. 15. Energy spectra measured from both PMTs at differen
cal, which indicates that the new method provides a robust
Medical Physics, Vol. 35, No. 12, December 2008
DOI function measurement for different energy resolutions,thresholds, and crystal locations inside the detector array.This is mainly attributed from the fact that the new method isstrongly correlated to the average detector response to DOI,which is calculated from the integration of different interac-tion positions over the crystal, as shown in Eq. �5�. There-fore, this “long-range” property of signal contribution allevi-ates the variations from various factors.
The error between the calculated and original DOI posi-tions was also studied. DOI positions were calculated with asecond dataset generated with a new simulation in order toavoid using the same dataset that was used for generatingDOI functions. From an original DOI position zo, the signalswere dispersed, the signal ratio Ro was calculated and used toobtain the calculated DOI position with the calibrated DOIfunction, zc=z�Ro�. The error of DOI determination was cal-culated as �DOI=zc-zo. The typical distributions of theseerrors with different K values are shown in Fig. 13, based onthe calculation from a back crystal. A typical profile of DOIerror distribution is shown in Fig. 14. Most DOI calculationerrors �more than 99%� are less than 1.0 mm.
3 4 5
plitude (Volts)
0
50
100
150
200
250
300
350
0 1 2 3 4 5
Signal amplitude (Volts)
I positions. From left to right, DOI=0.0, 10.0, and 20.0 mm.
0
20
40
60
80
100
120
0 0.2 0.4 0.6 0.8 1
Ratio S1/(S1+S2)
FIG. 16. Distributions of signal ratios calculated from data acquired at dif-ferent DOI positions, ranging from 0.0 to 20.0 mm and with a 2.0 mm step
2
al am
size. Different line legends were used only for better readability.
5838 Shao, Yao, and Ma: A novel method to calibrate the DOI function 5838
III.B. The results of experimental measurements
DOI function was initially measured with the primary cur-rent method as the basis to compare with the new method.Some typical signal spectra acquired from both PMTs areshown in Fig. 15. Note the substantial shift of signal ampli-tudes with respect to different DOI positions, which reflectsthe capability to measure DOI. The distribution of the signalratios, S1 / �S1+S2�, calculated on an event-by-event basis,is shown in Fig. 16 for 11 different DOI positions, rangingfrom 0.0 to 20.0 mm �from right to the left crystal end�.The symmetric characteristic of this distribution over therange of signal ratios also suggests that the gains of photonsensors at both crystal ends were about the same for thesemeasurements.
In order to quantitatively calculate DOI function, themean and FWHM �full-width at half-maximum� of each ratiodistribution were calculated with a Gaussian curve fit.14 Theresults are shown in Fig. 17, which is DOI function R�z� thatprovides the quantitative relationship between the signal ra-tio R and DOI position z. The error bars associated with each
0
0.2
0.4
0.6
0.8
1
0 5 10 15 20
DOI (mm)
FIG. 17. DOI function measured from the primary current method.
0
5
10
15
20
25
30
0 5 10 15 20
DOI position (mm)
FIG. 18. Energy resolutions measured from the summed signals of two
PMT’s at different DOI positions.Medical Physics, Vol. 35, No. 12, December 2008
DOI position were calculated as the uncertainty of DOI lo-calization ��1.4 mm� and the FWHM of the fitted signalratio distribution �Fig. 16�.
The energy resolutions measured from summed signalsare quite uniformly distributed for different DOI positions, asshown in Fig. 18, with an average value of 16.5%, rangingfrom 15.0% to 19.6%. These results are consistent with theother measurements.18,19,23,25
With the same detector operating conditions, DOI func-tion was measured again with the new method. The detectorwas roughly uniformly irradiated by the point source whichwas placed �213.0 mm away from the side of the scintilla-tor array. The spectrum of summed signals is shown in Fig.19. Since there was no DOI localization and the valid eventswere acquired from different DOI positions, the energy res-olution was relatively poor ��47% �. A low signal thresholdat 1.0 V was applied to get rid of those spurious events atvery low signal levels due to the mistriggering of the dataacquisition at the high count rate. The PDF was calculated asa normalized distribution of signal ratios and is shown in Fig.20, which is also quite symmetric over the range of signalratios.
0
1000
2000
3000
0 2 4 6 8 10
Summed signal (S1+S2, Volt)
FIG. 19. Energy spectrum measured from the summed signals of two PMTswith accumulated interactions from all different DOI positions.
0
0.005
0.01
0.015
0.02
0.025
0 0.2 0.4 0.6 0.8 1
Ratio S1/(S1+S2)
FIG. 20. PDF function calculated from the same measured data shown in
Fig. 19, with a minimum threshold at 1.0 V.
5839 Shao, Yao, and Ma: A novel method to calibrate the DOI function 5839
DOI function was calculated with a simple integration ofthe PDF according to Eq. �6�. For comparison, DOI func-tions measured with the current and new methods are shownin Fig. 21. The two functions are basically overlapped withinthe error bars; the maximum difference between the two DOIfunctions is �1.4 mm. These results show that DOI func-tions measured from the first current method and the newmethod are overall in a good agreement, while the latter doesnot rely on the requirements of complicated DOI localizationand the accurate detector-source alignment that can poten-tially make the measurement significantly difficult anderroneous.
In a separate study, DOI functions were measured with orwithout intercrystal scatters by placing or removing the bulkLSO crystal between the source and the detector but keepingthe same detector operating conditions for the both measure-ments. Signal spectra of summed signals from both measure-ments are shown in Fig. 22. Although total acquired countswere different for the two measurements, the corresponding
0
0.2
0.4
0.6
0.8
1
0 5 10 15 20
DOI (mm)
FIG. 21. DOI functions measured with the new method �solid line�, super-imposed with the results from the current method �dots with error bars�which is the same data as shown in Fig. 17.
0
1000
2000
3000
0 2 4 6 8 10
with inter-crystal scatterwithout inter-crystal scatter
Summed signal (S1+S2, Volt)
FIG. 22. Energy spectra measured from the summed signals of two PMTswith accumulated interactions from all different DOI positions. The solidand dashed curves correspond to the measurement without and with theintercrystal scatters and attenuation caused by the bulk of LSO scintillator
being placed between the source and the detector.Medical Physics, Vol. 35, No. 12, December 2008
PDF functions are about the same as expected, as shown inFig. 23, which indicates that the detector had the same signalresponses for the measurements either with or without theintercrystal scatter and attenuation. DOI functions calculatedfrom both measurements are shown in Fig. 24. The differ-ence between the two functions is negligibly small; the maxi-mum difference between the two DOI functions is �0.6 mm.It should be pointed out that although the detector operatingconditions were kept the same during these two measure-ments, they were different from those in the previous studiesassociated with Figs. 19–21. Therefore, it is expected that themeasured PDF and DOI functions are different from the pre-vious ones.
IV. DISCUSSION AND SUMMARY
Although the validations of the new method were basedon the use of uniform distribution of gamma interactions�DOI�, which is similar to one of the current methods,22 the
0
0.01
0.02
0.03
0.04
0.05
0 0.2 0.4 0.6 0.8 1
with inter-crystal scatterswithout inter-crystal scatters
Ratio S1/(S1+S2)
FIG. 23. PDF functions measured from the same acquired data as shown inFig. 22, with a minimum threshold at 1.0 V. The solid and dashed curvescorrespond to the measurements without and with intercrystal scatters andattenuation. The two functions are about the same but not symmetric overthe range of signal ratios, because the gains of photon sensors at the crystalends were not the same during these two measurements.
0
0.2
0.4
0.6
0.8
1
0 5 10 15 20
without inter-crystal scatters
DOI (mm)
0
0.2
0.4
0.6
0.8
1
0 5 10 15 20
with inter-crystal scatters
DOI (mm)
FIG. 24. DOI functions measured with the new method, either without orwith intercrystal scatters and attenuation, corresponding to the solid and
dashed curves, respectively.
5840 Shao, Yao, and Ma: A novel method to calibrate the DOI function 5840
principle and data processing of the two methods are com-pletely different, as illustrated in Sec. II. In addition, intheory, any known distribution of DOI positions can be usedto calculate DOI function with the new method �Eq. �4��.Nevertheless, in practice, a uniform DOI distribution willlead to a much simpler acquisition setup and data processing.
One technical challenge for the new method is that whenthe detectors are assembled inside a PET system, it is diffi-cult to implement radiation sources with parallel beams toachieve uniform DOI distributions for all detectors. Thereare two possible solutions to this problem:
�1� As part of the detector evaluation, all detectors will befirst calibrated with DOI functions, z1�R�, with the newmethod described above before they will be assembled.Once all detectors are inside the system, projection datafrom an external source or phantom that is being placedinside the system gantry will be acquired and processedwith the same method as before to have another DOIfunction, z2�R�. Since the distribution of DOI positionsin the second measurement is not uniform anymore,there will be expected discrepancies between the twoDOI functions, but with a unique corresponding rela-tionship between the first and second measurements.Therefore, z1�R� and z2�R� can be transformed from oneto another, and these two are different versions of DOIfunctions under different source conditions, and bothcan be used to calculate DOI position of an event fromeither source with a proper transformation. The futurerecalibration of DOI function can be based on the z2�R�with the same principle, once the same setup of externalsource that was used in measuring the z2�R� will be kept.
�2� For some scintillator materials with their natural radia-tion background, such as LSO, the new method can pro-vide a very straightforward DOI function measurementwithout the use of any external source, if the distributionof internal interaction position is known. The approachwill require longer acquisition time and deal with inter-actions that may have different spectrum characteristicsfrom those induced by external radiations. This studywill be reported separately.
In practice, there are other challenges that may complicatethe conditions for implementing the new method, such as thecross-talk �optically or electrically� among different crystals,Compton scatter over different crystals, and the change ofcrystal map with different DOI positions. These effects needto be further investigated as part of the overall detector de-sign, calibration, and optimization.
In summary, a new calibration method to measure DOIfunction has been developed and validated with Monte Carlosimulations and experimental studies. Compared to the cur-rent methods, the new method significantly simplifies thesetup and procedure, provides consistent DOI function forvery different detector configurations and operating condi-tions without the need of knowing or assuming detector re-sponses, and enables the calibration of DOI function for allcrystals inside a detector array by a single data acquisition.
Medical Physics, Vol. 35, No. 12, December 2008
This new method is expected to provide an adequate solutionto measure and recalibrate DOI functions of a PET detectorthat is capable of independent crystal readout and uses thedesign of DES readout.
a�Address for correspondence: Department of Imaging Physics, Universityof Texas M.D. Anderson Cancer Center, 8014A El Rio, Houston, Texas77054. Electronic mail: [email protected]
1S. R. Cherry, J. A. Sorenson, and M. E. Phelps, Physics in NuclearMedicine, 3rd ed. �Saunders, Philadelphia, 2003�.
2Y. C. Tai and R. Laforest, “Instrumentation aspects of animal PET,”Annu. Rev. Biomed. Eng. 7, 255–285 �2005�.
3C. S. Levin and H. Zaidi, “Current trends in preclinical PET systemdesign,” PET Clin. 2, 125–160 �2007�.
4A. F. Chatziioannou et al., “Performance evaluation of microPET: A high-resolution lutetium oxyorthosilicate PET scanner for animal imaging,” J.Nucl. Med. 40, 1164–1175 �1999�.
5W.-H. Wong, “Designing a stratified detection system for PET cameras,”IEEE Trans. Nucl. Sci. 33�1�, 591–596 �1986�.
6K. Shimizu et al., “Development of 3-D detector system for positron CT,”IEEE Trans. Nucl. Sci. 35�1�, 717–720 �1988�.
7C. Carrier et al., “Design of a high resolution positron emission tomo-graph using solid state scintillation detectors,” IEEE Trans. Nucl. Sci.35�1�, 685–690 �1988�.
8W. W. Moses, and S. E. Derenzo, “Design studies for a PET detectormodule using a PIN photodiode to measure depth of interaction,” IEEETrans. Nucl. Sci. 41�4�, 1441–1445 �1994�.
9P. Bartzakos and C. J. Thompson, “A depth-encoded PET detector,” IEEETrans. Nucl. Sci. 38�2�, 732–738 �1991�.
10R. S. Miyaoka et al., “Design of a depth of interaction �DOI� PET detec-tor module,” IEEE Trans. Nucl. Sci. 45�3�, 1069–1073 �1998�.
11S. Yamamoto, and H. Ishibashi, “A GSO depth of interaction detector forPET,” IEEE Trans. Nucl. Sci. 45�3�, 1078–1082 �1998�.
12L. R. MacDonald and M. Dahlbom, “Depth of interaction for PET usingsegmented crystals,” IEEE Trans. Nucl. Sci. 45�4�, 2144–2148 �1998�.
13H. Murayama et al., “Depth encoding multicrystal detectors for PET,”IEEE Trans. Nucl. Sci. 45�3�, 1152–1157 �1998�.
14Y. Shao et al., “Design studies of a high resolution PET detector usingAPD arrays,” IEEE Trans. Nucl. Sci. 47�3�, 1051–1057 �2000�.
15P. Bruyndonckx et al., “Neural network-based position estimators for PETdetectors using monolithic LSO blocks,” IEEE Trans. Nucl. Sci. 51�5�,2520–2525 �2004�.
16N. Inadama et al., “Performance of 256ch flat panel PS-PMT with smallcrystals for a DOI PET detector,” IEEE Trans. Nucl. Sci. 52�1�, 15–20�2005�.
17J. Seidel, J. J. Vaquero, and M. V. Green, “Resolution uniformity andsensitivity of the NIH ATLAS small animal PET scanner: Comparison tosimulated LSO scanners without depth-of-interaction capability,” IEEETrans. Nucl. Sci. 50�5�, 1347–1350 �2003�.
18K. C. Burr et al., “Evaluation of a prototype small-animal PET detectorwith depth-of-interaction encoding,” IEEE Trans. Nucl. Sci. 51�4�, 1791–1798 �2004�.
19Y. Yang et al., “Depth of interaction resolution measurements for a highresolution PET detector using position sensitive avalanche photodiodes,”Phys. Med. Biol. 51, 2131–2142 �2006�.
20W. W. Moses et al., “A room temperature LSO/PIN photodiode PETdetector module that measures depth of interaction,” IEEE Trans. Nucl.Sci. 42�4�, 1085–1089 �1995�.
21J. S. Huber, W. W. Moses, and P. R. G. Virador, “Calibration of a PETdetector module that measures depth of interaction,” IEEE Trans. Nucl.Sci. 45�3�, 1268–1272 �1998�.
22G. C. Wang et al., “Calibration of a PEM detector with depth of interac-tion measurement,” IEEE Trans. Nucl. Sci. 51�3�, 775–781 �2004�.
23Y. Shao, H. Li, and K. Gao, “Initial experimental studies of using solid-state photomultiplier for PET applications,” Nucl. Instrum. MethodsPhys. Res. A 580, 944–950 �2007�.
24S. Jan et al., “GATE: A simulation toolkit for PET and SPECT,” Phys.Med. Biol. 49, 4543–4561 �2004�.
25Y. Shao et al., “Dual APD array readout of LSO crystals: Optimization ofcrystal surface treatment,” IEEE Trans. Nucl. Sci. 49�3�, 649–654 �2002�.