Embed Size (px)
Citation preview
This document is downloaded from DR‑NTU (https://dr.ntu.edu.sg)Nanyang Technological University, Singapore.
A parsimonious framework of evaluating WSUDfeatures in urban flood mitigation
Lu, W.; Jun, Changhyun; Qin, Xiao Sheng
2017
Lu, W., Qin, X. S., & Jun, C. (2019). A parsimonious framework of evaluating WSUD featuresin urban flood mitigation. Journal of Environmental Informatics, 33(1), 17‑27.doi:10.3808/jei.201700373
https://hdl.handle.net/10356/86097
https://doi.org/10.3808/jei.201700373
© 2017 ISEIS. All rights reserved. This paper was published in Journal of EnvironmentalInformatics and is made available with permission of ISEIS.
Downloaded on 02 Apr 2022 23:52:32 SGT
17
ISEIS Journal of
Environmental Informatics
Journal of Environmental Informatics 33 (1) 17-27 (2019)
www.iseis.org/jei
A Parsimonious Framework of Evaluating WSUD Features in Urban Flood Mitigation
W. Lu1, X. S. Qin1,2 *, and C. Jun1
1 School of Civil and Environmental Engineering, Nanyang Technological University, 50 Nanyang Avenue, Singapore 639798
2 Environmental Process Modelling Centre (EPMC), Nanyang Environment and Water Research Institute (NEWRI), Nanyang Technological University, 1 Cleantech Loop, Singapore 637141
Received 26 December 2016; revised 19 April 2017; accepted 21 April 2017; published online 30 September 2017
ABSTRACT. In this study, a parsimonious framework for supporting Water Sensitive Urban Design (WSUD) was proposed to seek a tradeoff between investment of WSUD features and mitigation of urban flood damage. A two-dimensional (2D) hydrological-hydraulic simulation model, PCSWMM, was adopted to simulate the rainfall-runoff process and inundation scenarios, and the flood damages was evaluated based on inundated water depths and damage curves. The sensitivity of deploying various design features to flood control effects was also tested, which provided useful information for identifying potential design parameters (like conduit sizes and pond locations). The proposed framework was applied to a hypothetical case adapted from an urban district in the tropical region considering various WSUD features (i.e. rainwater storage pond, rain garden, and conduit upgrading). The results showed that when the gross investment of WSUD features increased from 0 to 1.19 million $, the damage cost would decrease from 4.61 to 3.41 million $; a linear relationship (with a R-square fit at 0.9) was found suitable to represent the relationship between the investment and the damage. The proposed framework is effective in helping assess the balance between mitigation of urban flood damage and adoption of WSUD features, and could be used to support urban water managers for a more science-based decision making towards flood risk management. Keywords: water sensitivity urban design (WSUD), urban flood damage, linear regression, tradeoff, PCSWMM
1. Introduction
As a consequence of global warming and increasing number and severity of extreme storms, urban floods are ob-served more frequently all over the world (Huang and Loucks, 2000; Li et al., 2008; De Moel and Aerts, 2011). Recently, flood damages are responsible for nearly one-third of the economic loss from natural disasters (Re, 2005; Huang et al., 2006; Li et al., 2009; Li et al., 2010). For instance, the 2013 North India floods resulted in a death toll over 5,000; the 2011 South Asian floods, which affected several countries like Thailand, Cambodia and Vietnam, killed over 500 people and brought a total damage of $45 billion USD (The world bank, 2012). In order to mitigate the threat of flooding to industry, traffic, transportation, and human lives, it is crucial to inte- grate storm water management into long-term urban planning and infrastructure development.
As one of the control strategies for urban floods, the concept of Water Sensitive Urban Design (WSUD) became popular in Australia from 1990s. It involves a series of design features (e.g. pervious pavements, rainwater tanks, green ro-
* Corresponding author. Tel.: +65-67905288; fax: +65-67921650.
E-mail address: [email protected] (X. S. Qin).
ISSN: 1726-2135 print/1684-8799 online
© 2017 ISEIS All rights reserved. doi: 10.3808/jei.201700373
ofs, etc.) and is also synonymous with other stormwater ma- nagement approaches like low impact development (LID), low impact urban design and development (LIUDD), best management practices (BMPs) and sustainable drainage sys-tems (SuDS) (Ward et al., 2012). WSUD involves techno- logies and approaches which aim to retain water in the urban landscape through rainwater harvesting and fit-for-purpose reuse and infiltration into soils to meet social, ecological and financial goals (Coutts et al., 2012). WSUD features mainly include rainwater tanks, rain gardens, green roofs, pervious pavements, rainwater storage ponds, and constructed wetlands (Government of South Australia, 2013), with various focuses on water quality and quantity. Over the past decades, many studies have been conducted regarding the effects of WSUD features in retaining rainfall, reducing runoff and improving quality of infiltrated water. Wong (2006) found that the bio- retention systems and constructed wetlands only need to take up 2 to 5% of the roof area to effectively treat roof runoff. Chapman and Horner (2010) observed a bio-retention tank near the street and found that it could achieve 26 ~ 52% of runoff retention as well as most of the incoming pollutants in real-weather conditions of Washington. Yang et al. (2013) evaluated the ability of a biphasic rain garden for runoff ma- nagement and pollutant treatment, and found that during a 180 mm/24 h rainfall event, the peak flow and runoff volume were reduced by 67 and 28%, respectively; meanwhile, the rain garden was very effective in removing various pollutant such
W. Lu et al. / Journal of Environmental Informatics 33(1) 17-27 (2019)
18
as nitrate and phosphate. Kok et al. (2016) evaluated both quantitative and qualitative effects of an extensive green roof system under tropical climate, and found that the peak discharge of runoff was reduced effectively (up to 26%) com- pared to a concrete tile roof. Generally, it is recognized that WSUD plays an important role in improving drainage capa- city and mitigating urban flood damage, and is applicable to various catchment scales from building levels to urban areas.
It is also a challenging issue when governments face ur-gent needs to improve the capacity of their urban drainage systems, and seek tradeoffs between investment of adopting WSUD features and achievement of flood control goals. To tackle such a problem, many studies on flood risk assessment and tradeoff design of urban drainage systems have been re-ported. Khastagir and Jayasuriya (2010) presented relation-ships between size of rainwater tanks with multiple factors (e.g., rainfall, catchment area and water demand). Yazdi et al. (2014) developed a surrogate model, which combined adap-tive neural network and Genetic Algorithm (GA) together, for the design of detention dams for flood control, and achieved superiority in terms of accuracy and efficiency compared with previous simulation model. Li et al. (2015) developed a multi- objective optimization framework to design the size of rain- water detention ponds, and acquired relatively robust solution to minimize both the engineering cost and flooding risks. Yu et al. (2015) used GA to search the most cost-effective size of drainage conduits, taking into consideration several realistic constrains (i.e., acceptable level of flood risk and dimensions of conduits). Huang et al. (2015) established models for seek- ing solution of spatial quantity and capacity arrangements of rain barrels in an urban area, and also considering economic net benefit (i.e., subtraction of the investment from the decreased inundation loss). Yazdi et al. (2015) carried out a risk-based optimal design for flood risk mitigation where the uncertainties of flood discharge were considered. These studies generally integrate optimization (e.g. GA and ant co- lony optimization) and simulation models to search for opti- mal solutions to the design of drainage systems or WSUD layouts under certain constraints. But there are still some research gaps. First, in evaluating the flood damage, the flood volume or the number of overloaded junctions was normally used; such indirect loss information may not be representative of the actual damage in monetary values. Second, very limited studies attempted to integrate multiple WSUD features into a general study framework to mitigate flood risk. One example work was recently reported by Noordhoek (2014), who tried to examine two kinds of WSUD features (rainwater tanks and bio-retention basins) in reducing runoff volumes and peak flows. Lu et al. (2016) also made a preliminary test on app- lying rain gardens and rainwater storage ponds to mitigate urban flood damage under different design rainfall scenarios. Third, most of the previous studies focused on coupled simu- lation-optimization algorithms, which normally required huge computational burdens (particularly for flood inundation mo- deling); it is desired to have more efficient ways of carrying out evaluation and future designs.
Thus, this study aims to propose a parsimonious frame-
work to evaluate WSUD features for mitigating urban flood damage. The flood damages will be simulated and assessed by a 2D inundation model under various design scenarios. Multi-ple WSUD features will be integrated into a single modeling framework for easy assessment of their performance in flood mitigation. The relationship between the investment and flood damage, which could be used by local authorities in their decision-making process towards cost-effective flood risk management, is fitted by a linear regression model.
2. Methodology
2.1. The Proposed Design Framework
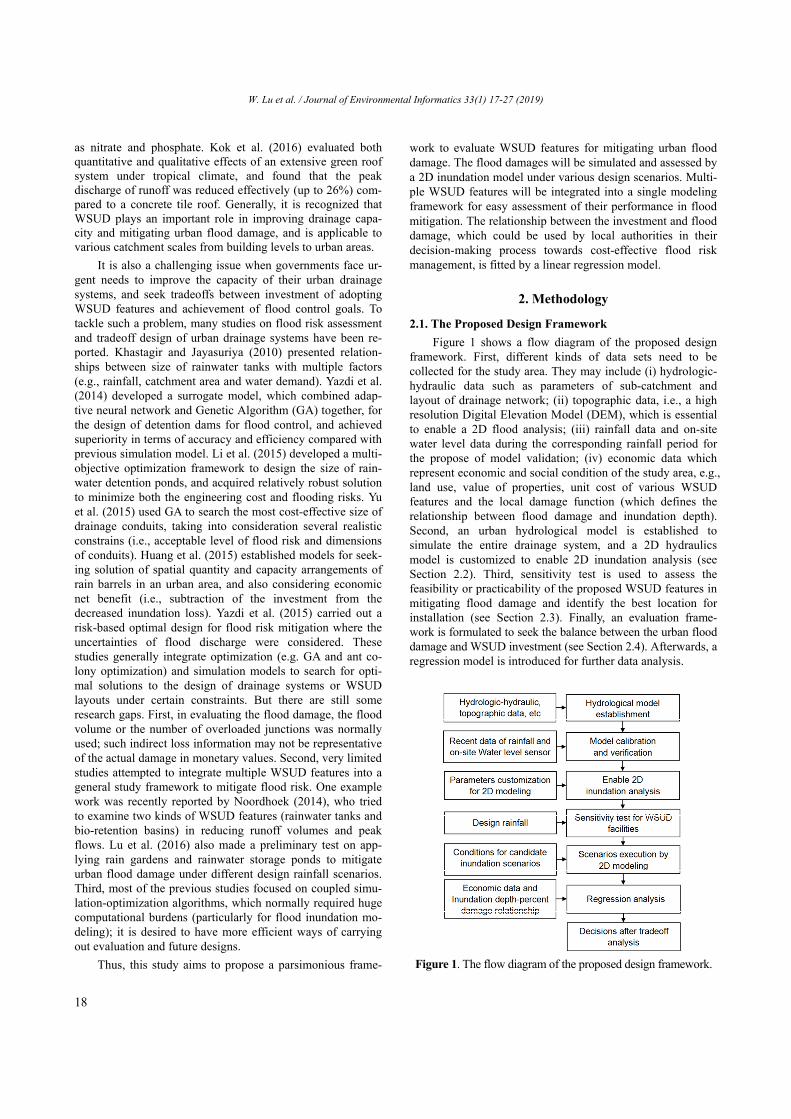
Figure 1 shows a flow diagram of the proposed design framework. First, different kinds of data sets need to be collected for the study area. They may include (i) hydrologic- hydraulic data such as parameters of sub-catchment and layout of drainage network; (ii) topographic data, i.e., a high resolution Digital Elevation Model (DEM), which is essential to enable a 2D flood analysis; (iii) rainfall data and on-site water level data during the corresponding rainfall period for the propose of model validation; (iv) economic data which represent economic and social condition of the study area, e.g., land use, value of properties, unit cost of various WSUD features and the local damage function (which defines the relationship between flood damage and inundation depth). Second, an urban hydrological model is established to simulate the entire drainage system, and a 2D hydraulics model is customized to enable 2D inundation analysis (see Section 2.2). Third, sensitivity test is used to assess the feasibility or practicability of the proposed WSUD features in mitigating flood damage and identify the best location for installation (see Section 2.3). Finally, an evaluation frame- work is formulated to seek the balance between the urban flood damage and WSUD investment (see Section 2.4). Afterwards, a regression model is introduced for further data analysis.
Figure 1. The flow diagram of the proposed design framework.
W. Lu et al. / Journal of Environmental Informatics 33(1) 17-27 (2019)
19
2.2. Urban Inundation Model
SWMM is a dynamic urban hydrological model for link-ing rainfall to runoff in the drainage networks and tracking the water quality of runoff generated within each sub-catchment (Aad et al., 2009). SWMM has been used worldwide for planning, design and analysis related to urban drainage systems (US EPA, 2016). This study adopts PCSWMM to simulate both drainage flows and flood inundation. The model fully integrates hydrologic and hydraulics functions and is specialized in modeling multifarious flow regimes and 2D flood routing, which can be useful for a reliable assessment of urban flood damage (James, 2015). After model establishment, PCSWMM model should be calibrated by using historical rainfall, runoff, and hydrometric records. Normally, overland 2D meshes will be generated at a given resolution. Inundation condition is assessed by evaluating the maximum water depth of 2D meshes during a rainfall event (Lu et al., 2016).
2.3. WSUD Features
Many WSUD features could be applied to the proposed framework for flood mitigation. In this study, the rainwater storage pond, rain garden, and conduit upgrading are selected as concerned features. In order to determine the locations of these measures in the drainage system, sensitivity test is con-ducted in consideration of the conduits and junctions that are relatively sensitive for reducing urban flood damage in the drainage system. When the 2D inundation model is esta- blished and calibrated, the local IDF curve (PUB, 2011) and Huff distribution (Huff, 1967) are used to design rainfall events for testing the model sensitivity. As multiple drainage units may be reported to suffer from flooding, a set of scaling factors are introduced to evaluate the effect of increasing the rainfall intensity on the flooding extent of the drainage units. The total flood volume and surcharge time are selected as in- dicators in selecting junctions and conduits that are nominated
to be equipped with WSUD features. A conduit is considered surcharge if its upstream end is full and the Hydraulic Grade Line (HGL) slope is greater than the conduit slope (Rossman, 2010). Storage ponds will be constructed at the site of the selected junctions and the size upgrading will be conducted for the selected conduits.
2.4. Formulation of Objective Function for Scenario Analysis
The problem under consideration is to find the relation- ship between investment of WSUD features and flood damage. The evaluation model can be written as:
Investment:
cn
ii
o
iC
m
iC clAAI1
bgAdHA Rj
n
jS
s
j
1
(1a)
Damage cost: ij ijDC x A p (1b)
subject to:
i i
m oCi C CA F A (2a)
0jSA (2b)
0 R OSA A (2c)
On the investment part (Equation 1a), I refers to the gross investment of the whole WSUD project. Aci, li, nc, and c refer to the ith cross section area of conduits, length of conduits, number of conduits, and unit cost of excavation (which in-cludes the cost yielded from evacuation, transportation, dis-posal and labor for each cubic meter of cut volume), re-spectively. Superscripts m and o denote the candidate and original variables, respectively. Asj, Hj, ns, and d refer to the jth area of storage pond, depth of its original manhole, number of ponds and the unit cost of excavation of ponds by volume, respectively. AR and g refer to constructed area of rain gardens and unit cost of building garden by area, respectively. b refers to the management cost for operating the whole project. On the flood damage part (Equation 1b), DC is the total urban flood damage and x is the average property value per unit area, which can be estimated by the total value of properties X di-vided by surface area A (Oliveri and Santoro, 2000). Based on the simulated water depth of each 2D mesh from PCSWMM, we can draw a risk map which uses contour lines to separate the study area into several portions (with each portion area denoted as Aij); each portion contains a group of meshes with maximum water depth falling within the range of (hi, hj). The percentage damage pij of the portion Aij is related to the range (hi, hj) by using a local relative damage function. In addition, a threshold depth is introduced. If the maximum water depth of a 2D mesh is below this threshold, the damage is assumed
100 m
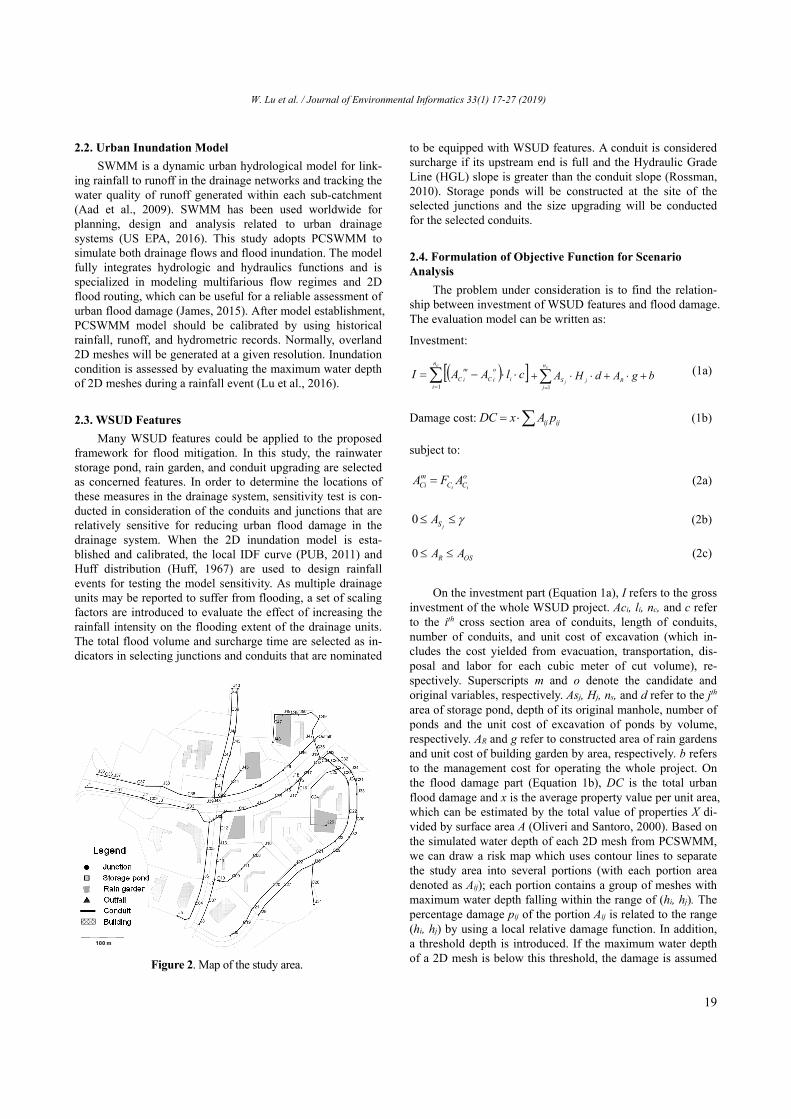
Figure 2. Map of the study area.
W. Lu et al. / Journal of Environmental Informatics 33(1) 17-27 (2019)
20
to be negligible. Equation 2a to 2c are the constraints for Equation 1a. FCi is scaling factors for the ith conduit to in-crease its cross-section area from Ac
o to Acm. The size of ponds
As is limited by γ which needs to be determined by local re-quirement. AOS is the total area of open spaces.
3. Case Study
3.1. Case Background and Setup
Description of the study site
A hypothetical urban catchment adapted from a tropical urban area was selected for demonstrating the proposed design framework. Some preliminary studies using the similar catchment were recently reported by Le et al. (2014) and Lu et al. (2016). Figure 2 shows the general map and layout of the drainage network of the study site. The site is cha- racterized by urban residential area with a typically tropical climate (e.g. sufficient rainfall, high humidity, and hot temperatures throughout the year). The mean annual rain days is 178 and mean annual rainfall total is over 2,300 mm; the mean daily maximum temperature ranges from 30 to 32 oC and the minimum one ranges from 23 to 25 oC (Meteorological Service Singapore, 2015). More detailed information about the catchment can be referred to Le et al. (2014).
Model setup
An urban hydrological model based on PCSWMM is es-tablished for the study area. The model is calibrated and veri-fied by number of storm events occurred in 2012 and 2013. For detailed information, readers are referred to Le (2014) and Le et al. (2014). When the hydrological portion of the model is validated, the parameters of 2D inundation modeling are customized for this study case. The spatial resolution used in generating mesh points is 5 m, considering the relative small area of the catchment. Finally, a 2D overland mesh network with elevation embedded is established for inundation risk analysis. The related damage computation and data analysis are carried out in the MATLAB platform (Valipour et al., 2013; Valipour, 2016; Rezaei et al., 2016; Valipour et al., 2017).
Design rainfall
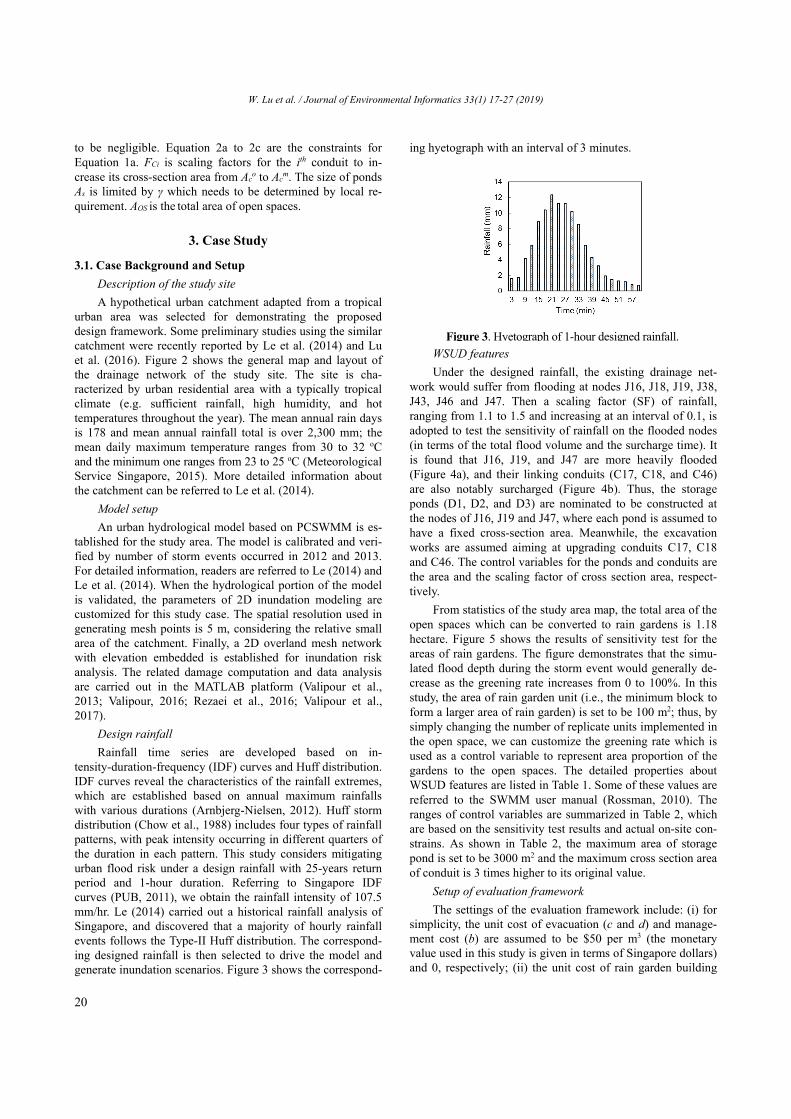
Rainfall time series are developed based on in-tensity-duration-frequency (IDF) curves and Huff distribution. IDF curves reveal the characteristics of the rainfall extremes, which are established based on annual maximum rainfalls with various durations (Arnbjerg-Nielsen, 2012). Huff storm distribution (Chow et al., 1988) includes four types of rainfall patterns, with peak intensity occurring in different quarters of the duration in each pattern. This study considers mitigating urban flood risk under a design rainfall with 25-years return period and 1-hour duration. Referring to Singapore IDF curves (PUB, 2011), we obtain the rainfall intensity of 107.5 mm/hr. Le (2014) carried out a historical rainfall analysis of Singapore, and discovered that a majority of hourly rainfall events follows the Type-II Huff distribution. The correspond- ing designed rainfall is then selected to drive the model and generate inundation scenarios. Figure 3 shows the correspond-
ing hyetograph with an interval of 3 minutes.
WSUD features
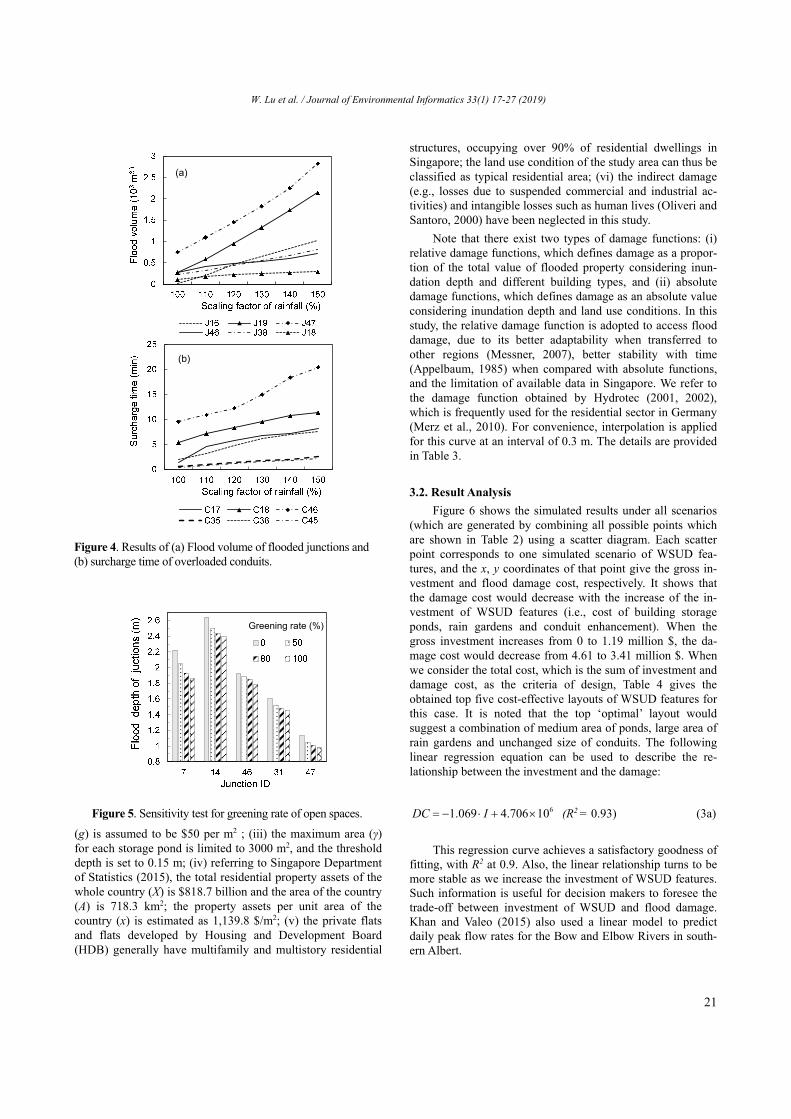
Under the designed rainfall, the existing drainage net-work would suffer from flooding at nodes J16, J18, J19, J38, J43, J46 and J47. Then a scaling factor (SF) of rainfall, ranging from 1.1 to 1.5 and increasing at an interval of 0.1, is adopted to test the sensitivity of rainfall on the flooded nodes (in terms of the total flood volume and the surcharge time). It is found that J16, J19, and J47 are more heavily flooded (Figure 4a), and their linking conduits (C17, C18, and C46) are also notably surcharged (Figure 4b). Thus, the storage ponds (D1, D2, and D3) are nominated to be constructed at the nodes of J16, J19 and J47, where each pond is assumed to have a fixed cross-section area. Meanwhile, the excavation works are assumed aiming at upgrading conduits C17, C18 and C46. The control variables for the ponds and conduits are the area and the scaling factor of cross section area, respect- tively.
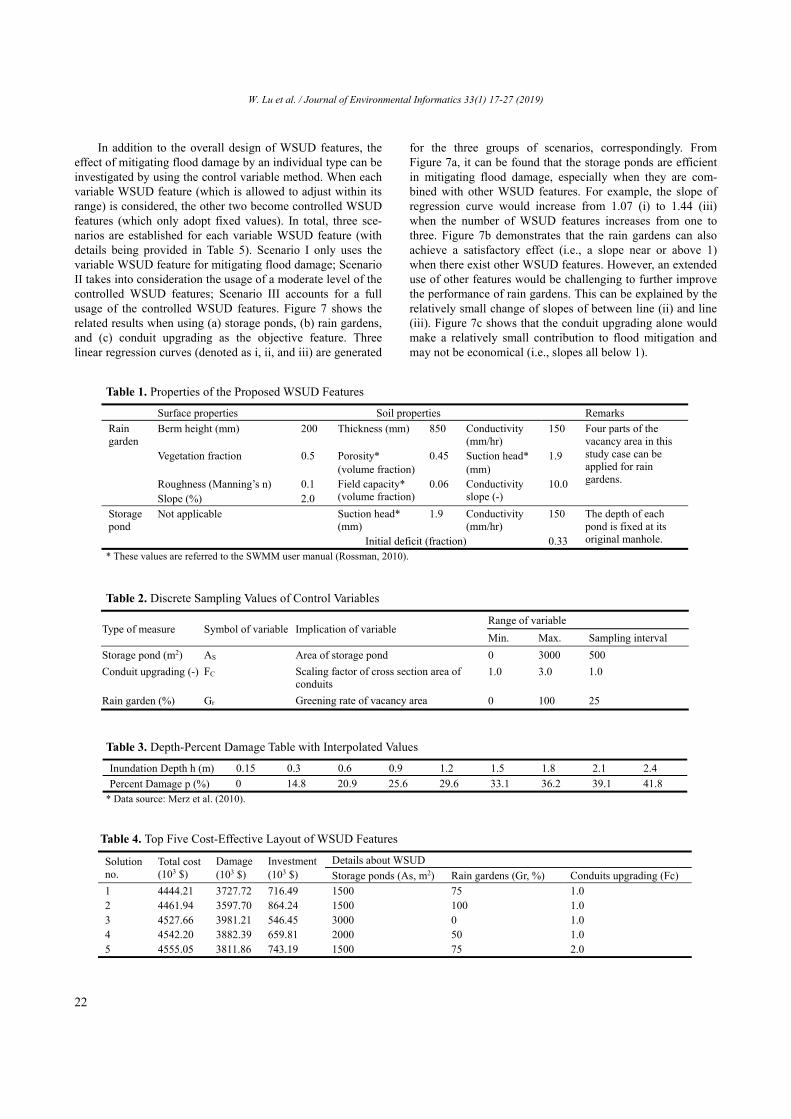
From statistics of the study area map, the total area of the open spaces which can be converted to rain gardens is 1.18 hectare. Figure 5 shows the results of sensitivity test for the areas of rain gardens. The figure demonstrates that the simu-lated flood depth during the storm event would generally de-crease as the greening rate increases from 0 to 100%. In this study, the area of rain garden unit (i.e., the minimum block to form a larger area of rain garden) is set to be 100 m2; thus, by simply changing the number of replicate units implemented in the open space, we can customize the greening rate which is used as a control variable to represent area proportion of the gardens to the open spaces. The detailed properties about WSUD features are listed in Table 1. Some of these values are referred to the SWMM user manual (Rossman, 2010). The ranges of control variables are summarized in Table 2, which are based on the sensitivity test results and actual on-site con-strains. As shown in Table 2, the maximum area of storage pond is set to be 3000 m2 and the maximum cross section area of conduit is 3 times higher to its original value.
Setup of evaluation framework
The settings of the evaluation framework include: (i) for simplicity, the unit cost of evacuation (c and d) and manage-ment cost (b) are assumed to be $50 per m3 (the monetary value used in this study is given in terms of Singapore dollars) and 0, respectively; (ii) the unit cost of rain garden building
Figure 3. Hyetograph of 1-hour designed rainfall.
W. Lu et al. / Journal of Environmental Informatics 33(1) 17-27 (2019)
21
(g) is assumed to be $50 per m2 ; (iii) the maximum area (γ) for each storage pond is limited to 3000 m2, and the threshold depth is set to 0.15 m; (iv) referring to Singapore Department of Statistics (2015), the total residential property assets of the whole country (X) is $818.7 billion and the area of the country (A) is 718.3 km2; the property assets per unit area of the country (x) is estimated as 1,139.8 $/m2; (v) the private flats and flats developed by Housing and Development Board (HDB) generally have multifamily and multistory residential
structures, occupying over 90% of residential dwellings in Singapore; the land use condition of the study area can thus be classified as typical residential area; (vi) the indirect damage (e.g., losses due to suspended commercial and industrial ac-tivities) and intangible losses such as human lives (Oliveri and Santoro, 2000) have been neglected in this study.
Note that there exist two types of damage functions: (i) relative damage functions, which defines damage as a propor-tion of the total value of flooded property considering inun- dation depth and different building types, and (ii) absolute damage functions, which defines damage as an absolute value considering inundation depth and land use conditions. In this study, the relative damage function is adopted to access flood damage, due to its better adaptability when transferred to other regions (Messner, 2007), better stability with time (Appelbaum, 1985) when compared with absolute functions, and the limitation of available data in Singapore. We refer to the damage function obtained by Hydrotec (2001, 2002), which is frequently used for the residential sector in Germany (Merz et al., 2010). For convenience, interpolation is applied for this curve at an interval of 0.3 m. The details are provided in Table 3.
3.2. Result Analysis
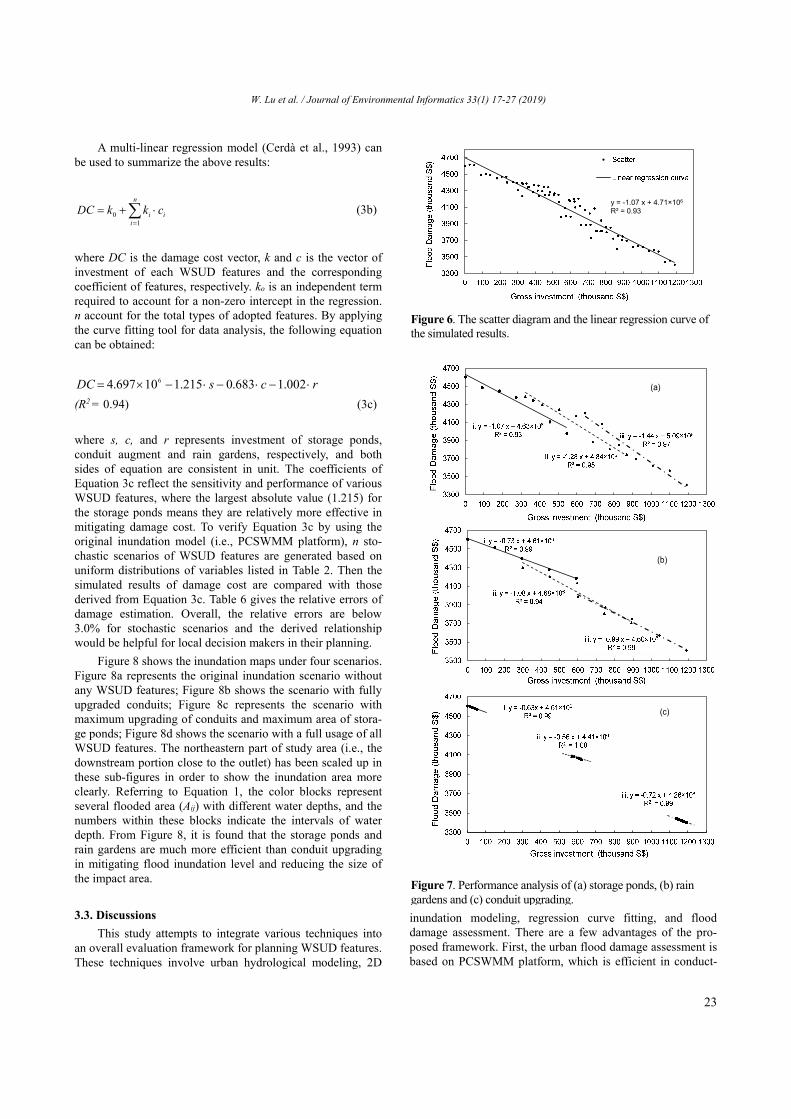
Figure 6 shows the simulated results under all scenarios (which are generated by combining all possible points which are shown in Table 2) using a scatter diagram. Each scatter point corresponds to one simulated scenario of WSUD fea-tures, and the x, y coordinates of that point give the gross in-vestment and flood damage cost, respectively. It shows that the damage cost would decrease with the increase of the in-vestment of WSUD features (i.e., cost of building storage ponds, rain gardens and conduit enhancement). When the gross investment increases from 0 to 1.19 million $, the da- mage cost would decrease from 4.61 to 3.41 million $. When we consider the total cost, which is the sum of investment and damage cost, as the criteria of design, Table 4 gives the obtained top five cost-effective layouts of WSUD features for this case. It is noted that the top ‘optimal’ layout would suggest a combination of medium area of ponds, large area of rain gardens and unchanged size of conduits. The following linear regression equation can be used to describe the re-lationship between the investment and the damage:
61.069 4.706 10DC I (R2 = 0.93) (3a)
This regression curve achieves a satisfactory goodness of fitting, with R2 at 0.9. Also, the linear relationship turns to be more stable as we increase the investment of WSUD features. Such information is useful for decision makers to foresee the trade-off between investment of WSUD and flood damage. Khan and Valeo (2015) also used a linear model to predict daily peak flow rates for the Bow and Elbow Rivers in south-ern Albert.
(b)
(a)
Figure 4. Results of (a) Flood volume of flooded junctions and (b) surcharge time of overloaded conduits.
Greening rate (%)
Figure 5. Sensitivity test for greening rate of open spaces.
W. Lu et al. / Journal of Environmental Informatics 33(1) 17-27 (2019)
22
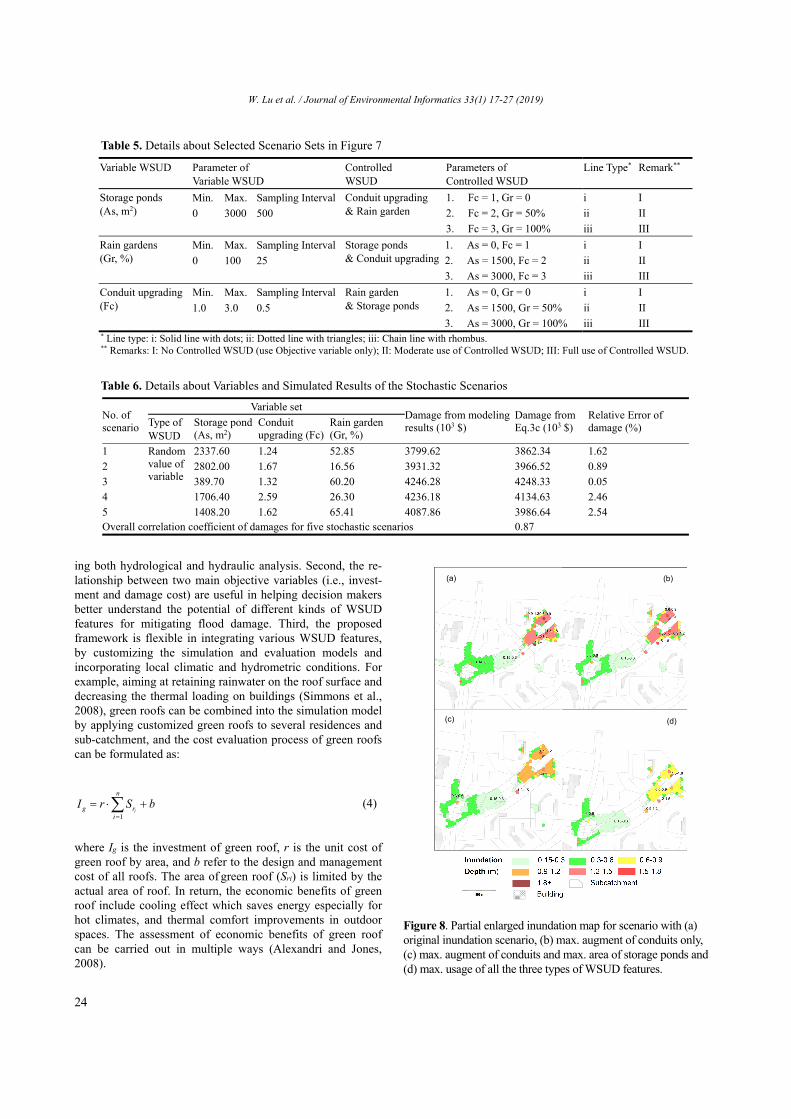
In addition to the overall design of WSUD features, the effect of mitigating flood damage by an individual type can be investigated by using the control variable method. When each variable WSUD feature (which is allowed to adjust within its range) is considered, the other two become controlled WSUD features (which only adopt fixed values). In total, three sce-narios are established for each variable WSUD feature (with details being provided in Table 5). Scenario I only uses the variable WSUD feature for mitigating flood damage; Scenario II takes into consideration the usage of a moderate level of the controlled WSUD features; Scenario III accounts for a full usage of the controlled WSUD features. Figure 7 shows the related results when using (a) storage ponds, (b) rain gardens, and (c) conduit upgrading as the objective feature. Three linear regression curves (denoted as i, ii, and iii) are generated
for the three groups of scenarios, correspondingly. From Figure 7a, it can be found that the storage ponds are efficient in mitigating flood damage, especially when they are com-bined with other WSUD features. For example, the slope of regression curve would increase from 1.07 (i) to 1.44 (iii) when the number of WSUD features increases from one to three. Figure 7b demonstrates that the rain gardens can also achieve a satisfactory effect (i.e., a slope near or above 1) when there exist other WSUD features. However, an extended use of other features would be challenging to further improve the performance of rain gardens. This can be explained by the relatively small change of slopes of between line (ii) and line (iii). Figure 7c shows that the conduit upgrading alone would make a relatively small contribution to flood mitigation and may not be economical (i.e., slopes all below 1).
Table 1. Properties of the Proposed WSUD Features
Surface properties Soil properties Remarks
Rain garden
Berm height (mm) 200 Thickness (mm) 850 Conductivity (mm/hr)
150 Four parts of the vacancy area in this study case can be applied for rain gardens.
Vegetation fraction 0.5 Porosity* (volume fraction)
0.45 Suction head* (mm)
1.9
Roughness (Manning’s n) 0.1 Field capacity* (volume fraction)
0.06 Conductivity slope (-)
10.0 Slope (%) 2.0
Storage pond
Not applicable Suction head* (mm)
1.9 Conductivity (mm/hr)
150 The depth of each pond is fixed at its original manhole. Initial deficit (fraction) 0.33
* These values are referred to the SWMM user manual (Rossman, 2010).
Table 2. Discrete Sampling Values of Control Variables
Type of measure Symbol of variable Implication of variable Range of variable
Min. Max. Sampling interval
Storage pond (m2) AS Area of storage pond 0 3000 500
Conduit upgrading (-) FC Scaling factor of cross section area of conduits
1.0 3.0 1.0
Rain garden (%) Gr Greening rate of vacancy area 0 100 25
Table 3. Depth-Percent Damage Table with Interpolated Values
Inundation Depth h (m) 0.15 0.3 0.6 0.9 1.2 1.5 1.8 2.1 2.4
Percent Damage p (%) 0 14.8 20.9 25.6 29.6 33.1 36.2 39.1 41.8 * Data source: Merz et al. (2010).
Table 4. Top Five Cost-Effective Layout of WSUD Features
Solution no.
Total cost (103 $)
Damage (103 $)
Investment (103 $)
Details about WSUD
Storage ponds (As, m2) Rain gardens (Gr, %) Conduits upgrading (Fc)
1 4444.21 3727.72 716.49 1500 75 1.0 2 4461.94 3597.70 864.24 1500 100 1.0 3 4527.66 3981.21 546.45 3000 0 1.0 4 4542.20 3882.39 659.81 2000 50 1.0 5 4555.05 3811.86 743.19 1500 75 2.0
W. Lu et al. / Journal of Environmental Informatics 33(1) 17-27 (2019)
23
A multi-linear regression model (Cerdà et al., 1993) can be used to summarize the above results:
01
n
i ii
DC k k c
(3b)
where DC is the damage cost vector, k and c is the vector of investment of each WSUD features and the corresponding coefficient of features, respectively. ko is an independent term required to account for a non-zero intercept in the regression. n account for the total types of adopted features. By applying the curve fitting tool for data analysis, the following equation can be obtained:
rcsDC 002.1683.0215.110697.4 6
(R2 = 0.94) (3c)
where s, c, and r represents investment of storage ponds, conduit augment and rain gardens, respectively, and both sides of equation are consistent in unit. The coefficients of Equation 3c reflect the sensitivity and performance of various WSUD features, where the largest absolute value (1.215) for the storage ponds means they are relatively more effective in mitigating damage cost. To verify Equation 3c by using the original inundation model (i.e., PCSWMM platform), n sto-chastic scenarios of WSUD features are generated based on uniform distributions of variables listed in Table 2. Then the simulated results of damage cost are compared with those derived from Equation 3c. Table 6 gives the relative errors of damage estimation. Overall, the relative errors are below 3.0% for stochastic scenarios and the derived relationship would be helpful for local decision makers in their planning.
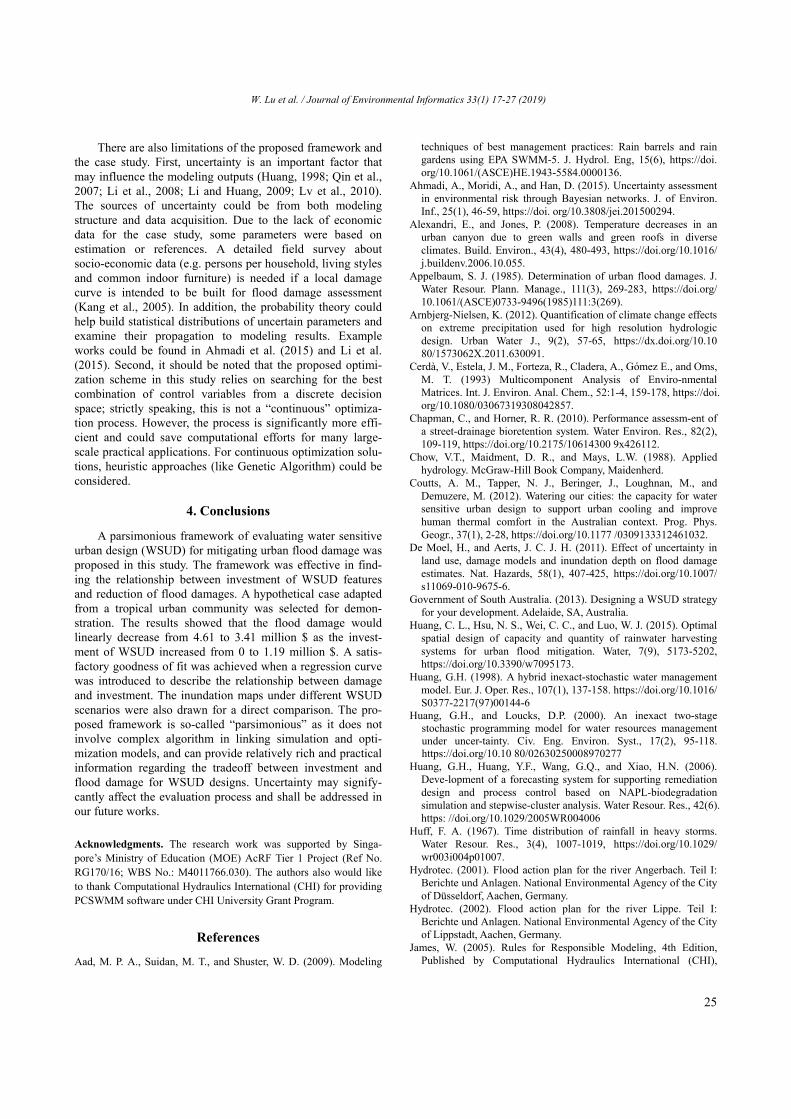
Figure 8 shows the inundation maps under four scenarios. Figure 8a represents the original inundation scenario without any WSUD features; Figure 8b shows the scenario with fully upgraded conduits; Figure 8c represents the scenario with maximum upgrading of conduits and maximum area of stora- ge ponds; Figure 8d shows the scenario with a full usage of all WSUD features. The northeastern part of study area (i.e., the downstream portion close to the outlet) has been scaled up in these sub-figures in order to show the inundation area more clearly. Referring to Equation 1, the color blocks represent several flooded area (Aij) with different water depths, and the numbers within these blocks indicate the intervals of water depth. From Figure 8, it is found that the storage ponds and rain gardens are much more efficient than conduit upgrading in mitigating flood inundation level and reducing the size of the impact area.
3.3. Discussions
This study attempts to integrate various techniques into an overall evaluation framework for planning WSUD features. These techniques involve urban hydrological modeling, 2D
inundation modeling, regression curve fitting, and flood damage assessment. There are a few advantages of the pro-posed framework. First, the urban flood damage assessment is based on PCSWMM platform, which is efficient in conduct-
y = -1.07 x + 4.71×10⁶ R² = 0.93
Figure 6. The scatter diagram and the linear regression curve of the simulated results.
(a)
(b)
(c)
Figure 7. Performance analysis of (a) storage ponds, (b) rain gardens and (c) conduit upgrading.
W. Lu et al. / Journal of Environmental Informatics 33(1) 17-27 (2019)
24
ing both hydrological and hydraulic analysis. Second, the re- lationship between two main objective variables (i.e., invest- ment and damage cost) are useful in helping decision makers better understand the potential of different kinds of WSUD features for mitigating flood damage. Third, the proposed framework is flexible in integrating various WSUD features, by customizing the simulation and evaluation models and incorporating local climatic and hydrometric conditions. For example, aiming at retaining rainwater on the roof surface and decreasing the thermal loading on buildings (Simmons et al., 2008), green roofs can be combined into the simulation model by applying customized green roofs to several residences and sub-catchment, and the cost evaluation process of green roofs can be formulated as:
1i
n
g ri
I r S b
(4)
where Ig is the investment of green roof, r is the unit cost of green roof by area, and b refer to the design and management cost of all roofs. The area of green roof (Sri) is limited by the actual area of roof. In return, the economic benefits of green roof include cooling effect which saves energy especially for hot climates, and thermal comfort improvements in outdoor spaces. The assessment of economic benefits of green roof can be carried out in multiple ways (Alexandri and Jones, 2008).
Table 5. Details about Selected Scenario Sets in Figure 7
Variable WSUD Parameter of Variable WSUD
Controlled WSUD
Parameters of Controlled WSUD
Line Type* Remark**
Storage ponds (As, m2)
Min. Max. Sampling Interval Conduit upgrading & Rain garden
1. Fc = 1, Gr = 0 i I
0 3000 500 2. Fc = 2, Gr = 50% ii II
3. Fc = 3, Gr = 100% iii III
Rain gardens (Gr, %)
Min. Max. Sampling Interval Storage ponds & Conduit upgrading
1. As = 0, Fc = 1 i I
0 100 25 2. As = 1500, Fc = 2 ii II
3. As = 3000, Fc = 3 iii III
Conduit upgrading (Fc)
Min. Max. Sampling Interval Rain garden & Storage ponds
1. As = 0, Gr = 0 i I
1.0 3.0 0.5 2. As = 1500, Gr = 50% ii II
3. As = 3000, Gr = 100% iii III * Line type: i: Solid line with dots; ii: Dotted line with triangles; iii: Chain line with rhombus. ** Remarks: I: No Controlled WSUD (use Objective variable only); II: Moderate use of Controlled WSUD; III: Full use of Controlled WSUD.
Table 6. Details about Variables and Simulated Results of the Stochastic Scenarios
No. of scenario
Variable set Damage from modeling results (103 $)
Damage from Eq.3c (103 $)
Relative Error of damage (%) Type of
WSUD Storage pond (As, m2)
Conduit upgrading (Fc)
Rain garden (Gr, %)
1 Random value of variable
2337.60 1.24 52.85 3799.62 3862.34 1.62
2 2802.00 1.67 16.56 3931.32 3966.52 0.89 3 389.70 1.32 60.20 4246.28 4248.33 0.05 4 1706.40 2.59 26.30 4236.18 4134.63 2.46 5 1408.20 1.62 65.41 4087.86 3986.64 2.54 Overall correlation coefficient of damages for five stochastic scenarios 0.87
(a) (b)
(c) (d)
Figure 8. Partial enlarged inundation map for scenario with (a) original inundation scenario, (b) max. augment of conduits only, (c) max. augment of conduits and max. area of storage ponds and (d) max. usage of all the three types of WSUD features.
W. Lu et al. / Journal of Environmental Informatics 33(1) 17-27 (2019)
25
There are also limitations of the proposed framework and the case study. First, uncertainty is an important factor that may influence the modeling outputs (Huang, 1998; Qin et al., 2007; Li et al., 2008; Li and Huang, 2009; Lv et al., 2010). The sources of uncertainty could be from both modeling structure and data acquisition. Due to the lack of economic data for the case study, some parameters were based on estimation or references. A detailed field survey about socio-economic data (e.g. persons per household, living styles and common indoor furniture) is needed if a local damage curve is intended to be built for flood damage assessment (Kang et al., 2005). In addition, the probability theory could help build statistical distributions of uncertain parameters and examine their propagation to modeling results. Example works could be found in Ahmadi et al. (2015) and Li et al. (2015). Second, it should be noted that the proposed optimi- zation scheme in this study relies on searching for the best combination of control variables from a discrete decision space; strictly speaking, this is not a “continuous” optimiza- tion process. However, the process is significantly more effi- cient and could save computational efforts for many large- scale practical applications. For continuous optimization solu- tions, heuristic approaches (like Genetic Algorithm) could be considered.
4. Conclusions
A parsimonious framework of evaluating water sensitive urban design (WSUD) for mitigating urban flood damage was proposed in this study. The framework was effective in find-ing the relationship between investment of WSUD features and reduction of flood damages. A hypothetical case adapted from a tropical urban community was selected for demon-stration. The results showed that the flood damage would linearly decrease from 4.61 to 3.41 million $ as the invest-ment of WSUD increased from 0 to 1.19 million $. A satis- factory goodness of fit was achieved when a regression curve was introduced to describe the relationship between damage and investment. The inundation maps under different WSUD scenarios were also drawn for a direct comparison. The pro- posed framework is so-called “parsimonious” as it does not involve complex algorithm in linking simulation and opti- mization models, and can provide relatively rich and practical information regarding the tradeoff between investment and flood damage for WSUD designs. Uncertainty may signify- cantly affect the evaluation process and shall be addressed in our future works.
Acknowledgments. The research work was supported by Singa-pore’s Ministry of Education (MOE) AcRF Tier 1 Project (Ref No. RG170/16; WBS No.: M4011766.030). The authors also would like to thank Computational Hydraulics International (CHI) for providing PCSWMM software under CHI University Grant Program.
References
Aad, M. P. A., Suidan, M. T., and Shuster, W. D. (2009). Modeling
techniques of best management practices: Rain barrels and rain gardens using EPA SWMM-5. J. Hydrol. Eng, 15(6), https://doi. org/10.1061/(ASCE)HE.1943-5584.0000136.
Ahmadi, A., Moridi, A., and Han, D. (2015). Uncertainty assessment in environmental risk through Bayesian networks. J. of Environ. Inf., 25(1), 46-59, https://doi. org/10.3808/jei.201500294.
Alexandri, E., and Jones, P. (2008). Temperature decreases in an urban canyon due to green walls and green roofs in diverse climates. Build. Environ., 43(4), 480-493, https://doi.org/10.1016/ j.buildenv.2006.10.055.
Appelbaum, S. J. (1985). Determination of urban flood damages. J. Water Resour. Plann. Manage., 111(3), 269-283, https://doi.org/ 10.1061/(ASCE)0733-9496(1985)111:3(269).
Arnbjerg-Nielsen, K. (2012). Quantification of climate change effects on extreme precipitation used for high resolution hydrologic design. Urban Water J., 9(2), 57-65, https://dx.doi.org/10.10 80/1573062X.2011.630091.
Cerdà, V., Estela, J. M., Forteza, R., Cladera, A., Gómez E., and Oms, M. T. (1993) Multicomponent Analysis of Enviro-nmental Matrices. Int. J. Environ. Anal. Chem., 52:1-4, 159-178, https://doi. org/10.1080/03067319308042857.
Chapman, C., and Horner, R. R. (2010). Performance assessm-ent of a street-drainage bioretention system. Water Environ. Res., 82(2), 109-119, https://doi.org/10.2175/10614300 9x426112.
Chow, V.T., Maidment, D. R., and Mays, L.W. (1988). Applied hydrology. McGraw-Hill Book Company, Maidenherd.
Coutts, A. M., Tapper, N. J., Beringer, J., Loughnan, M., and Demuzere, M. (2012). Watering our cities: the capacity for water sensitive urban design to support urban cooling and improve human thermal comfort in the Australian context. Prog. Phys. Geogr., 37(1), 2-28, https://doi.org/10.1177 /0309133312461032.
De Moel, H., and Aerts, J. C. J. H. (2011). Effect of uncertainty in land use, damage models and inundation depth on flood damage estimates. Nat. Hazards, 58(1), 407-425, https://doi.org/10.1007/ s11069-010-9675-6.
Government of South Australia. (2013). Designing a WSUD strategy for your development. Adelaide, SA, Australia.
Huang, C. L., Hsu, N. S., Wei, C. C., and Luo, W. J. (2015). Optimal spatial design of capacity and quantity of rainwater harvesting systems for urban flood mitigation. Water, 7(9), 5173-5202, https://doi.org/10.3390/w7095173.
Huang, G.H. (1998). A hybrid inexact-stochastic water management model. Eur. J. Oper. Res., 107(1), 137-158. https://doi.org/10.1016/ S0377-2217(97)00144-6
Huang, G.H., and Loucks, D.P. (2000). An inexact two-stage stochastic programming model for water resources management under uncer-tainty. Civ. Eng. Environ. Syst., 17(2), 95-118. https://doi.org/10.10 80/02630250008970277
Huang, G.H., Huang, Y.F., Wang, G.Q., and Xiao, H.N. (2006). Deve-lopment of a forecasting system for supporting remediation design and process control based on NAPL-biodegradation simulation and stepwise-cluster analysis. Water Resour. Res., 42(6). https: //doi.org/10.1029/2005WR004006
Huff, F. A. (1967). Time distribution of rainfall in heavy storms. Water Resour. Res., 3(4), 1007-1019, https://doi.org/10.1029/ wr003i004p01007.
Hydrotec. (2001). Flood action plan for the river Angerbach. Teil I: Berichte und Anlagen. National Environmental Agency of the City of Düsseldorf, Aachen, Germany.
Hydrotec. (2002). Flood action plan for the river Lippe. Teil I: Berichte und Anlagen. National Environmental Agency of the City of Lippstadt, Aachen, Germany.
James, W. (2005). Rules for Responsible Modeling, 4th Edition, Published by Computational Hydraulics International (CHI),
W. Lu et al. / Journal of Environmental Informatics 33(1) 17-27 (2019)
26
Guelph, Ontario. Kang, J. L., Su, M. D., and Chang, L. F. (2005). Loss functions and
framework for regional flood damage estimation in residential area. J. Mar. Sci. Technol., 13(3), 193-199.
Khan, U. T., and Valeo, C. (2015). Short-term peak flow rate prediction and flood risk assessment using fuzzy linear regression. J. Environ. Inf., 28(2), 71-89, https://doi.org/10.3808/jei.201600 345.
Khastagir, A., and Jayasuriya, N. (2010). Optimal sizing of rain water tanks for domestic water conservation. J. Hydrol. (Amst.), 381(3), 181-188, https://doi.org/10.1016/j.jhydrol. 2009.11.040.
Kok, K. H., Mohd Sidek, L., Chow, M. F., Zainal Abidin, M. R., Basri, H., and Hayder, G. (2016). Evaluation of green roof perfor- mances for urban stormwater quantity and quality controls. Int J of River Basin Management, 14(1), 1-7, https://doi.org/10.1080/15 715124.2015.10484 56.
Le, Q.T.; Lu, Y.; Qin, X.S.; and Min, R. (2014). Assessing climate change impact on urban drainage flow: A case study of Singapore. Proc. of the 13th International Conference on Urban Drainage (ICUD2014), Sarawak, Malaysia, 1-9.
Le, Q.T. (2014). Evaluation of urban drainage flow impacts under climate change using an integrated modeling framework. Qualification Exam Report submitted to Nanyang Technological University, Singapore.
Li F., Duan H.F., Yan H.X., Tao T. (2015). Multi-Objective Optimal Design of Detention Tanks in the Urban Stormwater Drainage System: Framework Development and Case Study. Water Resour. Manage., 29(7), 2125–2137, https://doi.org/10.1007/s11269-015- 0931-0.
Li, Y.P., and Huang, G.H. (2009). Fuzzy-stochastic-based violation analysis method for planning water resources management systems with uncertain information. Inf. Sci., 179(24), 4261-4276. https:// doi.org/10.1016/j.ins.2009.09.001
Li, Y.P., Huang, G.H., Huang, Y.F., and Zhou, H.D. (2009). A multi-stage fuzzy-stochastic programming model for supporting sustain-nable water-resources allocation and management. Environ. Model. Soft-ware, 24(7), 786-797. https://doi.org/10.1016/j.envsoft.2008.11.008
Li, Y.P., Huang, G.H., Nie, S.L., and Liu, L. (2008). Inexact multistage stochastic integer programming for water resources management under uncertainty. J. Environ. Manage., 88(1). 93-107. https://doi. org/10.1016/j.jenvman.2007.01.056
Li, Y.P., Huang, G.H., Yang, Z.F., and Nie, S.L. (2008). IFMP: interval-fuzzy multistage programming for water resources management under uncertainty. Resour. Conserv. Recycling, 52(5), 800-812. https://doi.org/10.1016/j.resconrec.2007.11.007
Li, Y.P., Huang, G.H., and Nie, S.L. (2010). Planning water resources management systems using a fuzzy-boundary interval-stochastic programming method. Adv. Water Resour., 33(9), 1105-1117. https://doi.org/10.1016/j.advwatres.2010.06.015
Li, Z., Huang, G. H., Fan, Y. R., and Xu, J. L. (2015). Hydrologic risk analysis for nonstationary streamflow records under uncertainty. J. Environ. Inf., 26(1), 41-51, https//doi.reg/ 10.3808/jei.201500321.
Lu, W.; Qin, X.S.; Jun, C. (2016). Urban flood damage assessment for water sensitive urban design. Proc. of the 2nd Urban Planning and Property Development (UPPD 2016). 90-93, https://doi.org/ 10.5176/0000-0000_uppd.32.
Lv, Y., Huang, G.H., Li, Y.P., Yang, Z.F., Liu, Y., and Cheng, G.H. (2010). Planning regional water resources system using an interval fuzzy bi-level programming method. J. Environ. Inf., 16(2), 43-56. https://doi.org/10.3808/jei.201000177
Merz, B., Kreibich, H., Schwarze, R., and Thieken, A. (2010). Review article “Assessment of economic flood damage”. Nat. Hazards Earth Syst. Sci., 10(8), 1697-1724, https://doi.org/10.519
4/nhess-10-1697-2010. Messner, F. (2007). Evaluating flood damages: guidance and
recommendations on principles and methods. Helmholz Unweltf- orschungszentrum (UFZ), 52-57.
Meteorological Service Singapore. (2015). Climate of Singapore. http://www.weather.gov.sg/climate-climate-of-singapore/.
Noordhoek, R. (2014). Using Water-Sensitive Urban Design to improve drainage capacity: Examination of the impact of distributed and catchment scale Water-Sensitive Urban Design systems on flow frequency. Bachelor Theses, University of South Australia, Adelaide, Australia.
Oliveri, E., and Santoro, M. (2000). Estimation of urban structural flood damages: the case study of Palermo. Urban Water, 2(3), 223-234, https://doi.org/10.1016/s1462-0758(00)0006 2-5.
Public Utility Board (PUB). (2011). Code of Practice on Surface Water Drainage. (Sixth Edition) https://www.pub.gov.sg/Docu ments/COP_Final.pdf.
Qin, X.S., Huang, G.H., Zeng, G.M., Chakma, A., and Huang, Y.F. (2007). An interval-parameter fuzzy nonlinear optimization model for stream water quality management under uncertainty. Eur. J. Oper. Res., 180(3), 1331-1357. https://doi.org/10.1016/j.ejor.2006. 03.053
Re, M. (2005). Weather catastrophes and climate change. Münchener Rückversicherungs-Gesellschaft, München.
Rezaei, M., Valipour, M., & Valipour, M. (2016). Modelling evapotranspiration to increase the accuracy of the estimations based on the climatic parameters. Water Conserv. Sci. Eng., 1(3), 197-207, https://doi.org/10.1007/s41101-016-0013-z.
Rossman, L. A. (2010). Storm Water Management Model–User manual Version 5.0. Revised July 2010. US Environmental Protection Agency (US EPA), Cincinnati, USA.
Simmons, M. T., Gardiner, B., Windhager, S., and Tinsley, J. (2008). Green roofs are not created equal: the hydrologic and thermal performance of six different extensive green roofs and reflective and non-reflective roofs in a sub-tropical climate. Urban Ecosystems, 11(4), 339-348, https://doi.org/10.1007/s11252-008- 0069-4.
Singapore Department of Statistics. (2015). Singapore in figures- 2015. https://www.singstat.gov.sg/publications/singapore-in-figures.
The World Bank. (2012). The World Bank on Climate Risks and Adaptation in Asian Coastal Megacities. Population and Deve- lopment Review, 38: 751–755.
US Environmental Protection Agency (US EPA). (2016). “Storm Water Management Model (SWMM) - Version 5.1.010 with Low Impact Development (LID) Controls.” https://www.epa.gov/water- research/storm-water-management-model-swmm.
Valipour, M., Banihabib, M. E., & Behbahani, S. M. R. (2013). Comparison of the ARMA, ARIMA, and the autoregressive artificial neural network models in forecasting the monthly inflow of Dez dam reservoir. J. Hydrol. (Amst.), 476, 433-441, https://doi.org/10.1016/j.jhydrol.2012.11.017.
Valipour, M. (2016). How Much Meteorological Information Is Necessary to Achieve Reliable Accuracy for Rainfall Estimations? Agriculture, 6(4), 53, https://doi.org/10.3390/ agriculture6040053.
Valipour, M., Sefidkouhi, M. A. G., & Raeini, M. (2017). Selecting the best model to estimate potential evapo-transpiration with res- pect to climate change and magnitudes of extreme events. Agric. Water Manage., 180, 50-60, https://doi.org/10.1016/j.agwat.2016. 08.025
Ward, S., Lundy, L., Shaffer, P., Wong, T., Ashley, R., Arthur, S., ... and Butler, D. (2012). Water sensitive urban design in the city of the future. 7th International Conference on Water Sensitive Urban Design, Melbourne, Australia, 21-23 February 2012
Wong, T. H. (2006). An overview of water sensitive urban design

W. Lu et al. / Journal of Environmental Informatics 33(1) 17-27 (2019)
27
practices in Australia. Water Pract. Technol., 1(1), https:// doi.org/10.2166/wpt.2006018.
Yang, H., Dick, W. A., McCoy, E. L., Phelan, P. L., and Grewal, P. S. (2013). Field evaluation of a new biphasic rain garden for storm- water flow management and pollutant removal. Ecol. Eng., 54, 22-31, https://doi.org/10.1016/j.ecoleng. 2013.01.005.
Yazdi, J., and Neyshabouri, S. S. (2014). Adaptive surrogate mo- deling for optimization of flood control detention dams. Environ. Model. Software, 61, 106-120, https://doi.org/10.1016/j.envsoft. 2014.07.007.
Yazdi, J., Torshizi, A. D., and Zahraie, B. (2015). Risk based optimal design of detention dams considering uncertain inflows. Stochastic Environ. Res. Risk Assess., 30(5), 1457-1471, https://doi.org/10. 1007/s00477-015-1171-9.
Yu, J. J., Qin, X. S., and Min, R. (2015). Optimal sizing of urban drainage systems using heuristic optimization. Resources, Envi- ronment and Engineering II: Proceedings of the 2nd Technical Congress on Resources, Environment and Engineering (CREE 2015, Hong Kong, 25-26 September 2015), Hong Kong, pp.111-116, 2016, https://doi.org /10.1201/b19136-18.