Embed Size (px)
Citation preview
Wen et al. BMC Med Imaging (2021) 21:33 https://doi.org/10.1186/s12880-021-00547-x
RESEARCH ARTICLE
A PET imaging study of the brain changes of glucose metabolism in patients with temporal lobe epilepsy and depressive disorderJin‑Feng Wen1,2†, Xin‑Wen Guo1,2†, Xiang‑Yi Cao2, Ji‑Wu Liao1, Ping Ma1, Xiang‑Shu Hu3 and Ji‑Yang Pan1*
Abstract
Background: This study aims to compare the difference of the brain changes of glucose metabolism between tem‑poral lobe epilepsy patients (TLE) with major depressive disorder and temporal TLE without major depressive disorder.
Methods: A total of 24 TLE patients, who met the inclusion criteria of our hospital, were enrolled in this study. They were divided into a TLE with depression group (n = 11) and a TLE without depression group (n = 13), according to the results of the HAMD‑24 Scale. Two groups patients were examined using 18F‑FDG PET brain imaging.
Results: The low metabolic regions of the TLE with depression group were mainly found in the left frontal lobe, tem‑poral lobe and fusiform gyrus, while the high metabolic regions of the TLE with depression group were mainly located in the right frontal lobe, visual joint cortex and superior posterior cingulate cortex. Both of the TLE groups had high metabolic compensation in the non‑epileptic area during the interictal period.
Conclusions: There is an uptake difference of 18F‑FDG between TLE patients with depression and TLE patients with‑out depression in multiple encephalic regions.
Keywords: Epilepsy, Temporal lobe, Depressive disorder, PET imaging, Glucose metabolism
© The Author(s) 2021. Open Access This article is licensed under a Creative Commons Attribution 4.0 International License, which permits use, sharing, adaptation, distribution and reproduction in any medium or format, as long as you give appropriate credit to the original author(s) and the source, provide a link to the Creative Commons licence, and indicate if changes were made. The images or other third party material in this article are included in the article’s Creative Commons licence, unless indicated otherwise in a credit line to the material. If material is not included in the article’s Creative Commons licence and your intended use is not permitted by statutory regulation or exceeds the permitted use, you will need to obtain permission directly from the copyright holder. To view a copy of this licence, visit http://creat iveco mmons .org/licen ses/by/4.0/. The Creative Commons Public Domain Dedication waiver (http://creat iveco mmons .org/publi cdoma in/zero/1.0/) applies to the data made available in this article, unless otherwise stated in a credit line to the data.
BackgroundTemporal lobe epilepsy (TLE) originates from the hip-pocampus, the amygdala, the parahippocampal gyrus and the neocortex of the lateral temporal lobe [1]. The char-acteristics of TLE go far beyond seizures. Many patients develop special forms of cognitive impairment and psy-chiatric comorbidity [2]. Depressive disorder is the most common complication of TLE. However, comorbid depressive disorder in epileptic patients is often ignored,
and only a few patients receive antidepressant treatment [3]. Hence, it is of great clinical significance to study the diagnosis, treatment and pathogenesis of TLE with depressive disorder.
Previous studies have shown that the difference in important structures of the limbic system in TLE patients with depression is significant when com-pared to non-depressive patients [4–6]. Meanwhile, significant changes in glucose metabolism in their brain regions have been observed in TLE patients with depression. Bromfield et al. [7] did a comparative study of the glucose metabolism of the brain in patients with depression, using 18F-2-fluorodeoxyglucose positron emission tomography (FDG-PET), twenty years ago. They found a decrease in glucose metabolism in the frontal region. Gilliam et al. found that the depression
Open Access
*Correspondence: [email protected]†Jin‑Feng Wen and Xin‑Wen Guo contributed equally to this study1 Department of Psychiatry, Guangdong, The First Affiliated Hospital of Jinan University, No.613, West Huangpu Avenue, Tianhe District, Guangzhou 510630, ChinaFull list of author information is available at the end of the article
Page 2 of 9Wen et al. BMC Med Imaging (2021) 21:33
was also associated [8] with temporal lobe metabolic decline in temporal lobe epilepsy. Salzberg et al. found that orbital low metabolism was associated [9] with depression using statistical parametric mapping to analyze the FDG-PET images. However, the specific location and significance of abnormal glucose metabo-lism in the brain regions of TLE patients with depres-sion need more clinical empirical data demonstration. Therefore, this study has included TLE patients with depression and compared them with TLE patients without depression in order to investigate the differ-ences in glucose uptake in the brain regions.
Materials and methodsGeneral informationA total of 24 TLE patients treated at the Epilepsy Center of Guangdong 999 Brain Hospital from January 2014 to December 2016, who met the inclusion crite-ria, were enrolled in this study. The inclusion criteria were as follows: (1) patients who met the diagnostic criteria of the International League Against Epilepsy (ILAE) for TLE; (2) the symptoms of seizure accorded with TLE clinical features, and the video electroen-cephalogram (VEEG) indicated that the abnormal discharge was confined to the temporal lobe at the interictal stage, and the epileptic discharge at the interictal stage originated from the temporal lobe; (3) patient age ≥ 18 years old; (4) Mini-mental State Examination (MMSE) scores ≥ 24 points; (5) a PET examination showed that the depression was dur-ing the interictal period of epileptic seizures, and the HAMD-24 scored ≥ 8 points. The exclusion criteria were as follows: (1) MRI brain tests suggested struc-tural damage outside the temporal lobe; (2) patients with a previous history of mental illness or familial mental illness; and (3) patients with a history of other brain diseases, such as trauma, tumors, intracranial infection, cerebral infarction and cerebral hemorrhage.
All the patients were positive on MRI T1 or T2 imag-ing. 22 of them showed hippocampal sclerosis and / or amygdala lesions, and 2 patients showed focal malacia, and all patients showed focal cortical dysplasia after operation. The basic clinical data of patients with tem-poral lobe epilepsy are shown in Additional file 1. There are 11 patients in epilepsy with depression group (7/11 male, 5/11 right TLE), and epilepsy without depres-sion group (9/13 male, 2/13 right TLE). chi-squared test showed that there was no significant difference in gender and lateral distribution of epileptogenic focus between the two groups. Independent sample t test there was no significant difference in age, course of
disease and the time of taking anticonvulsant drugs between the two groups.
MethodsScale examination and groupingThe patients were divided into a TLE with depression group (≥ 8) and a TLE without depression group (< 8), according to the HAMD-24 Scale score results. There were 11 patients in the TLE with depression group and 13 patients in the TLE without depression group.
MMSE examination scores > 24 points were recorded for both groups, and they both completed the SCL-90 and MMPI psychometric self-assessment questionnaire and HAMA-21 scale evaluation to make sure they have no other psychotic disorders other than depression.
EEG examinationVEEG monitoring: A scalp circular electrode was placed in accordance with the international 10/20 system. The EEG was recorded by single, bipolar lead and sphenoid electrodes. The test time of the EEG was between 8 and 24 h. EEG records included wakefulness, eye opening and closing, flash stimulation, hyperventilation, and sleep induction. The results were read by a neurological elec-trophysiologist and a neurologist. The spike wave, sharp wave, and spike (sharp)-slow complex wave were all read along with the burst high amplitude slow wave rhythm, spike rhythm, and fast rhythm wave, all of which are associated with epilepsy.
18F‑FDG PET Brain imagingAll patients underwent 18F-FDG PET brain imaging scans at the interictal stage of seizure. The 18F-FDG PET developer was provided by Guangzhou High Tech Atom Isotope Medicine Co., Ltd., with a radiochemi-cal purity > 95%. The patients had been fasting for 4–6 h before the examination. Blood glucose was controlled at 4.0–11.1 mmol/L. After being injected with the imaging agent and having lain still for 45–70 min, the patients were given a craniocerebral PET scan at a dose of 3.70–5.55 MBq/kg body weight. The PET/CT imaging sys-tem used was the systemic PET/CT (GE Discovery Elite 690, USA). The acquisition conditions were as follows: voltage 140 kV, current 180 mA, scanning layer thick-ness 2.5 mm, scanning axial field 50 mm, and matrix 512 × 512. The attenuation correction of PET was con-ducted through CT. The PET images were obtained using an adaptive statistical iterative recombination algorithm.
Image processing and analysisThe 18F-FDG PET brain images of all patients were ana-lyzed and processed using AW 4.6 processing workstation
Page 3 of 9Wen et al. BMC Med Imaging (2021) 21:33
built-in Cortex ID brain functional metabolism software. Its main procedures are the 3D-SSP method developed by the University of Washington MINOSHIMA et al. [10] as well as correction and conversion techniques that automatically match the standardized brain. These were used to extract a series of predefined surface pixels from the peak metabolic activity in the brain regions. Taking the pontine metabolic activity as a reference baseline, the standardized metabolic activity of the cerebral cor-tex peak of the patient was fed into the built-in normal group software database so the metabolic activity of the cerebral cortex peak could be compared with that of the normal healthy control group [11, 12]. The Z scores of different parts of the whole brain was obtained, and the Z scores chart of metabolism was shown in the Additional file 1 and Table 1. All the above processes were automati-cally processed and displayed by the Cortex ID software.
The analysis of uptake difference in the brain regions: Statistical parametric mapping 8 (SPM8) was used to analyze and process the PET/MRI data. (1) MRIcron was used to transform PET image DICOM data into the Ana-lyze7 NIFTI format. (2) The display module in SPM was used to correct the origins of all the patients’ images and rotation direction; (3) A coregister module in SPM was used to register each patient’s PET images as 3.0 MRI T1 structural images. (4) A sement module in SPM was used to match each patient’s 3.0 MRI T1 structural images with the SPM built-in standard MRI T1 template. (5) A normalised module in SPM was used to integrate the results obtained in steps 3 and 4 with the patients’ indi-vidual standard space PET images. (6) A smooth module in SPM was used for the smoothing of two-fold height and width (FWHM 8 × 8 × 8) for standard space PET images to obtain target images with matrix 79 × 95 × 68
Table 1 The basic clinical data of patients with temporal lobe epilepsy
Patient number Average association SUV Z scores Averaged cerebral SUV Z scores
Global average SUV Z scores HAMD-24total scores
TLE with depression Zright Zleft Zright-Zleft Zaveraged cerebral
Zglobal average
1 − 0.93 − 0.76 − 0.17 − 1.12 − 1.03 11
2 − 0.23 1.2 − 1.43 − 0.24 − 0.27 13
3 − 1.49 − 0.8 − 0.69 − 1.21 − 0.87 16
4 0.8 1.49 − 0.69 0.63 0.57 18
5 0.63 1.91 − 1.28 0.58 0.45 26
6 − 0.47 0.08 − 0.55 − 0.45 − 0.36 19
7 0.83 0.18 0.65 0.2 0.12 13
8 0.8 0.37 0.43 0.12 0.05 9
9 − 0.51 − 1.29 0.78 − 1.22 − 1.22 9
10 0.16 − 0.01 0.17 − 0.18 − 0.35 12
11 0.92 0.4 0.52 0.53 0.56 17
Mean 0.05 0.25 − 0.21 − 0.21 − 0.21 14.82
TLE without depression
12 − 0.75 − 0.44 − 0.31 − 0.59 − 0.45 7
13 0.43 1.39 − 0.96 0.47 0.28 3
14 − 0.66 − 0.87 0.21 − 1.14 − 1.09 6
15 − 0.02 1.08 − 1.1 0.29 0.35 1
16 1.79 3.24 − 1.45 1.99 1.65 7
17 0.74 1.37 − 0.63 0.83 0.68 3
18 − 0.21 − 0.06 − 0.15 − 0.22 − 0.15 5
19 0.66 1.91 − 1.25 0.9 0.68 3
20 − 0.1 0.99 − 1.09 0.23 0.12 1
21 0.51 1.28 − 0.77 0.73 0.61 7
22 0.36 0.67 − 0.31 0.35 0.19 6
23 1.07 − 0.04 1.11 0.25 0.39 6
24 1.28 1.12 0.16 0.94 0.83 6
Mean 0.49 0.97 − 0.48 0.47 0.39 4.64
Page 4 of 9Wen et al. BMC Med Imaging (2021) 21:33
and voxel 2 × 2 × 2. (7) Two groups of images were exam-ined with a voxel-to-voxel independent sample t test (P < 0.01, uncorrected, no less than 30 voxel blocks) to obtain a local brain uptake difference distribution map. (8) Mni2tal tool software was used to locate the different voxels in the naming area of the Brodmann anatomical brain map.
Statistical analysisSPSS 21.0 software was used for the statistical analysis of the data results. Measurement data were expressed by M ± SD. The standard uptake value (SUV) Z scores of the same brain regions on the same side of the two groups were tested by independent sample t test. A dif-ferential analysis of glucose uptake in the left and right brain regions of each group was performed using a paired t test. P < 0.05 was considered to be a statistically significant difference. In addition, Asymmetry Indices based on 14 specify regional were statistically compared between the two groups. The 14 specify regional includ-ing: parietal, temporal, frontal, occipital, posterior, ante-rior, medial frontal, medial parietal, sensorimotor, visual, caudate nucleus, cerebellum, vermis, lateral average asso-ciation, which is divided by Brodmann Brain Atlas with Cortex ID workstation software [8–12]. Formula calcula-tion as ZAI = ZRight-ZLeft. So if regional ZAI ≥ 1.64, corre-sponding to P < 0.05 were considered to have significantly different SUV (Right > Left). If regional ZAI ≤ − 1.64, It means Right < Left. For more details, please refer to the statistical method of Galazzo et al. [13]. The 14 ZAI of each specify regional of the two groups were tested by independent sample t test.
ResultsThe analysis of differential glucose uptake in the brain regions of the two groupsThe uptake difference of the brain regions of the TLE with depression group and the TLE without depression group were as follows: left parietal lobe (P = 0.023), right parietal lobe (P = 0.041), left occipital lobe (P = 0.008), right occipital lobe, (P = 0.009), left medial parietal lobe (P = 0.016), right sensorimotor area (P = 0.045), left visual area (P = 0.006), right visual area (P = 0.006), left caudate nucleus (P = 0.039), right caudate nucleus (P = 0.031) and right vermis cerebelli (P = 0.022). The brain regions with a significant margin difference were as follows: the left medial frontal lobe (P = 0.054), the left medial pari-etal lobe (P = 0.062), the total cerebral cortical mean (P = 0.057) and the total cerebral cortical and subcorti-cal mean (P = 0.051). All the brain regions showed uptake values that were lower in the TLE with depression group
than in the TLE without depression group, see Table 2 for details. The ZAI (Asymmetry Indices of Z scores compare to healthy subjects) independent sample t test were no significant difference, see Additional file 1 for details.
An analysis of the left–right pairing of glucose uptake in the brain regions of the two groupsThe TLE with depression group: The uptake values of the left posterior cingulate cortex, medial parietal lobe and sensorimotor area were significantly higher than those of the right posterior cingulate gyrus, medial parietal lobe and sensorimotor area (P < 0.05). See Table 3 for details.
The TLE without depression group: the mean uptake values of the left parietal lobe, temporal lobe, frontal lobe, occipital lobe, posterior cingulate gyrus, and medial frontal lobe and the joint mean were significantly higher than those of the right parietal lobe, temporal lobe, fron-tal lobe, occipital lobe, posterior cingulate gyrus, medial frontal lobe and joint mean (P < 0.05). The uptake values of the left cerebellum were significantly lower than those of the right cerebellum (P = 0.038). See Table 4 for details.
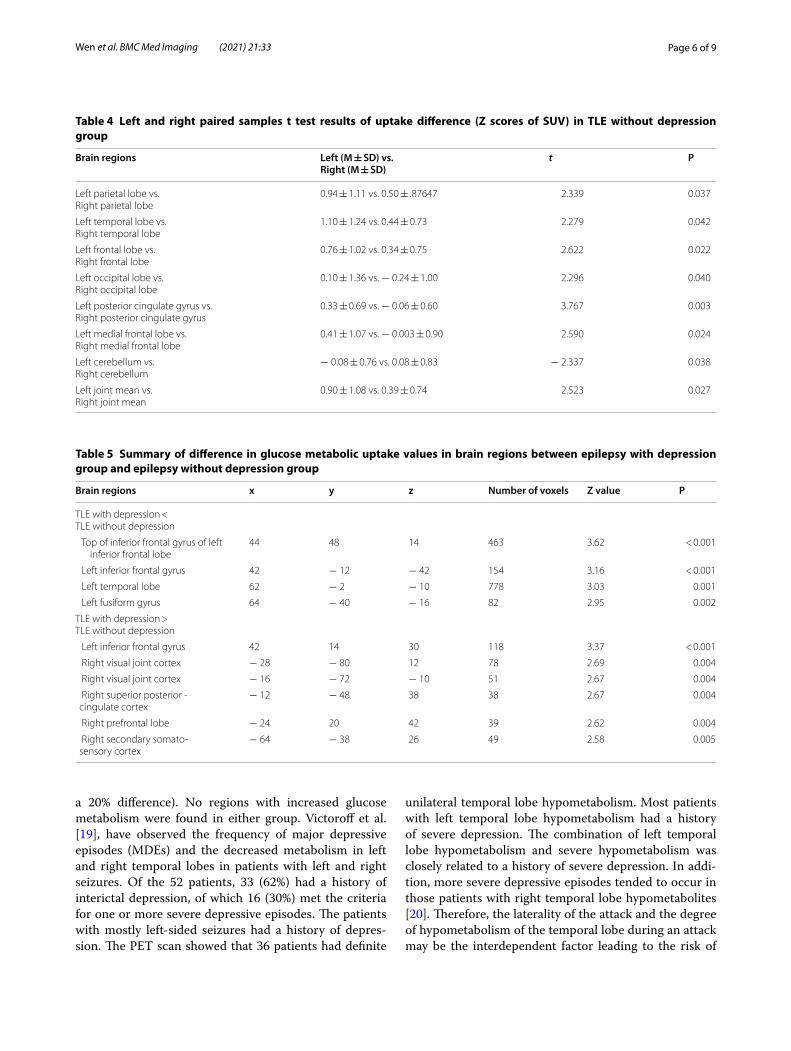
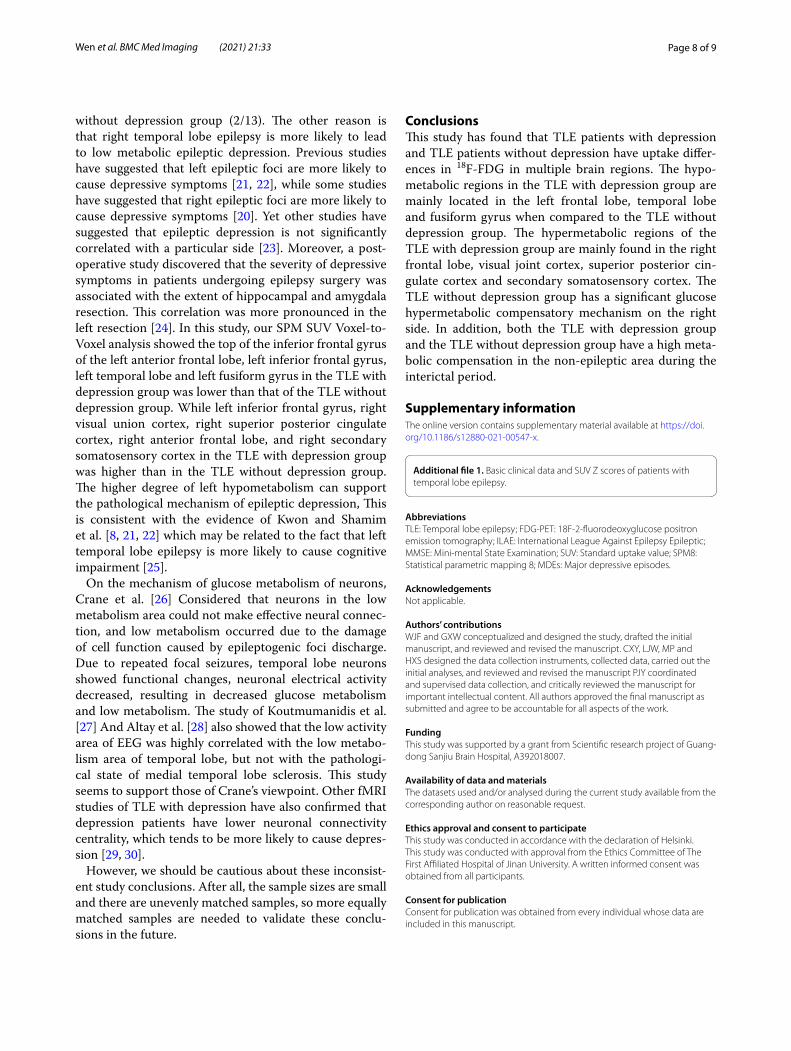
The extraction results of glucose metabolism uptake values in the brain regions of the TLE with depression group and the TLE without depression groupAn SPM8 Result module was used to compare the TLE with depression group and the TLE without depression group with respect to voxel-based glucose metabolic uptake values extracted in the brain regions. The thresh-old standard was uncorrected (P < 0.01). The voxel mass was not less than 30. The results showed that the SUV in the brain regions of the top of the inferior frontal gyrus of the left anterior frontal lobe, left inferior frontal gyrus, left temporal lobe and left fusiform gyrus in the TLE with depression group was lower than that of the TLE with-out depression group. The SUV in the brain regions of the left inferior frontal gyrus, right visual union cortex, right superior posterior cingulate cortex, right anterior frontal lobe, and right secondary somatosensory cortex in the TLE with depression group was higher than in the TLE without depression group. See Table 5 and Fig. 1 for details.
DiscussionHenry et al. [14], studied 18F FDG-PET and found that most patients with complex partial seizures originating from a unilateral temporal lobe had temporal lobe hypo-metabolism at the interictal stage. This could extend to the ipsilateral external temporal region. The metabolism of the ipsilateral frontal lobe, parietal lobe and basal gan-glia also decreased, but not as significantly as that of the temporal lobe and thalamus. An FDG-PET SPM analysis
Page 5 of 9Wen et al. BMC Med Imaging (2021) 21:33
showed that 79% of the TLE patients (27/34) had hypo-metabolism [15, 16] in the ipsilateral temporal lobe. A paired t test confirmed that the metabolic activity of the ipsilateral hemisphere decreased when compared to the activity of the contralateral hemisphere. A Voxel-based analysis supported a decrease in the glucose metabolism rate along with prolonged duration of epilepsy in the temporal cortex and other adjacent cortical regions. The relative increase in glucose metabolism in the contralat-eral temporal lobe suggested that there may have been compensatory changes in the hemisphere [17]. In addi-tion, Wunderlich et al. [18], differentiated between and
compared the brain glucose metabolism and depression symptoms of lateral temporal lobe epilepsy and medial temporal lobe epilepsy. They found that the glucose metabolism patterns of the two groups decreased signifi-cantly when compared to the control group. By compar-ing and analyzing glucose metabolism in the homologous anatomical regions of each side, 35% of epileptic patients with an attack originating in the lateral temporal lobe had the largest regional depression, while 56% of epileptic patients with the attack originating in the medial tem-poral lobe had a moderate decrease in glucose metabo-lism in the ipsilateral medial temporal region (up to
Table 2 Comparison of difference in glucose uptake (Z scores of SUV) of brain regions between TLE with depression group and TLE without depression group
Brain regions TLE with depression group (M ± SD) TLE without depression group (M ± SD) P
Left parietal lobe 0.001 ± 1.02 0.94 ± 1.11 0.023Right parietal lobe − 0.31 ± 0.97 0.50 ± 0.88 0.041Left temporal lobe 0.76 ± 1.42 1.10 ± 1.24 0.332
Left frontal lobe 0.10 ± 0.89 0.76 ± 1.02 0.094
Right frontal lobe − 0.12 ± 0.70 0.34 ± 0.75 0.175
Left occipital lobe − 1.18 ± 1.08 0.10 ± 1.36 0.008Right occipital lobe − 1.24 ± 0.83 − 0.24 ± 1.00 0.009Left posterior cingulate gyrus − 0.12 ± 0.67 0.33 ± 0.69 0.119
Right posterior cingulate gyrus − 0.39 ± 0.65 − 0.06 ± 0.60 0.231
Left medial frontal lobe − 0.40 ± 0.80 0.41 ± 1.07 0.054
Right medial frontal lobe − 0.55 ± 0.75 − 0.003 ± 0.90 0.148
Left medial parietal lobe 0.19 ± 0.90 0.90 ± 1.10 0.062
Right medial parietal lobe − 0.30 ± 0.90 0.76 ± 0.91 0.016Left sensorimotor area − 0.005 ± 0.79 0.59 ± 0.82 0.106
Right sensorimotor area − 0.37 ± 0.86 0.38 ± 0.70 0.045Left visual area − 1.97 ± 1.40 − 0.43 ± 1.31 0.006Right visual area − 1.98 ± 1.28 − 0.60 ± 1.23 0.006Left caudate nucleus − 1.35 ± 1.10 − 0.39 ± 1.12 0.039Right caudate nucleus − 1.18 ± 1.54 − 0.11 ± 0.75 0.031Right cerebellar vermis − 0.78 ± 0.71 − 0.08 ± 0.66 0.022Left joint mean 0.30 ± 1.01 0.90 ± 1.08 0.117
Right joint mean − 0.001 ± 0.79 0.39 ± 0.74 0.289
Total cerebral cortex mean − 0.21 ± 0.71 0.39 ± 0.77 0.057
Total cortical and subcortical mean − 0.21 ± 0.63 0.31 ± 0.66 0.051
Table 3 Left and right paired samples t test results of uptake difference (Z scores of SUV) in TLE with depression group
Brain regions Left (M ± SD) vs. right (M ± SD) t P
Left posterior cingulate gyrus vs.Right posterior cingulate gyrus
− 0.12 ± 0.67 vs. − 0.39 ± 0.65 4.363 0.001
Left medial parietal lobe vs.Right medial parietal lobe
0.19 ± 0.90 vs.− 0.26 ± 0.90 2.741 0.021
Left sensorimotor area vs.Right sensorimotor area
− 0.01 ± 0.79 vs. − 0.37 ± 0.86 2.975 0.014
Page 6 of 9Wen et al. BMC Med Imaging (2021) 21:33
a 20% difference). No regions with increased glucose metabolism were found in either group. Victoroff et al. [19], have observed the frequency of major depressive episodes (MDEs) and the decreased metabolism in left and right temporal lobes in patients with left and right seizures. Of the 52 patients, 33 (62%) had a history of interictal depression, of which 16 (30%) met the criteria for one or more severe depressive episodes. The patients with mostly left-sided seizures had a history of depres-sion. The PET scan showed that 36 patients had definite
unilateral temporal lobe hypometabolism. Most patients with left temporal lobe hypometabolism had a history of severe depression. The combination of left temporal lobe hypometabolism and severe hypometabolism was closely related to a history of severe depression. In addi-tion, more severe depressive episodes tended to occur in those patients with right temporal lobe hypometabolites [20]. Therefore, the laterality of the attack and the degree of hypometabolism of the temporal lobe during an attack may be the interdependent factor leading to the risk of
Table 4 Left and right paired samples t test results of uptake difference (Z scores of SUV) in TLE without depression group
Brain regions Left (M ± SD) vs.Right (M ± SD)
t P
Left parietal lobe vs.Right parietal lobe
0.94 ± 1.11 vs. 0.50 ± .87647 2.339 0.037
Left temporal lobe vs.Right temporal lobe
1.10 ± 1.24 vs. 0.44 ± 0.73 2.279 0.042
Left frontal lobe vs.Right frontal lobe
0.76 ± 1.02 vs. 0.34 ± 0.75 2.622 0.022
Left occipital lobe vs.Right occipital lobe
0.10 ± 1.36 vs. − 0.24 ± 1.00 2.296 0.040
Left posterior cingulate gyrus vs.Right posterior cingulate gyrus
0.33 ± 0.69 vs. − 0.06 ± 0.60 3.767 0.003
Left medial frontal lobe vs.Right medial frontal lobe
0.41 ± 1.07 vs. − 0.003 ± 0.90 2.590 0.024
Left cerebellum vs.Right cerebellum
− 0.08 ± 0.76 vs. 0.08 ± 0.83 − 2.337 0.038
Left joint mean vs.Right joint mean
0.90 ± 1.08 vs. 0.39 ± 0.74 2.523 0.027
Table 5 Summary of difference in glucose metabolic uptake values in brain regions between epilepsy with depression group and epilepsy without depression group
Brain regions x y z Number of voxels Z value P
TLE with depression < TLE without depression
Top of inferior frontal gyrus of left inferior frontal lobe
44 48 14 463 3.62 < 0.001
Left inferior frontal gyrus 42 − 12 − 42 154 3.16 < 0.001
Left temporal lobe 62 − 2 − 10 778 3.03 0.001
Left fusiform gyrus 64 − 40 − 16 82 2.95 0.002
TLE with depression > TLE without depression
Left inferior frontal gyrus 42 14 30 118 3.37 < 0.001
Right visual joint cortex − 28 − 80 12 78 2.69 0.004
Right visual joint cortex − 16 − 72 − 10 51 2.67 0.004
Right superior posterior ‑cingulate cortex
− 12 − 48 38 38 2.67 0.004
Right prefrontal lobe − 24 20 42 39 2.62 0.004
Right secondary somato‑sensory cortex
− 64 − 38 26 49 2.58 0.005
Page 7 of 9Wen et al. BMC Med Imaging (2021) 21:33
depressive disorder in patients with complex partial epilepsy.
This present study found that the hypometabolic regions of the TLE with depression group are mainly located in the right frontal lobe, temporal lobe and fusi-form gyrus compared with the TLE without depression group, while the hypermetabolic regions of the TLE
with depression group are mainly found in the left fron-tal lobe, visual joint cortex, superior posterior cingulate cortex and secondary somatosensory cortex compared with the TLE without depression group. A possible rea-son for this is that the proportion (5/11) of epileptic regions originating in the right brain region in the TLE with depression group is higher than that in the TLE
Fig. 1 Difference in glucose metabolism uptake values of cerebral regions between the TLE with depression group and TLE without depression group. Blue block: Metabolic regions of TLE with depression group < TLE without depression group; Red block: Metabolic regions of TLE with depression group > TLE without depression group
Page 8 of 9Wen et al. BMC Med Imaging (2021) 21:33
without depression group (2/13). The other reason is that right temporal lobe epilepsy is more likely to lead to low metabolic epileptic depression. Previous studies have suggested that left epileptic foci are more likely to cause depressive symptoms [21, 22], while some studies have suggested that right epileptic foci are more likely to cause depressive symptoms [20]. Yet other studies have suggested that epileptic depression is not significantly correlated with a particular side [23]. Moreover, a post-operative study discovered that the severity of depressive symptoms in patients undergoing epilepsy surgery was associated with the extent of hippocampal and amygdala resection. This correlation was more pronounced in the left resection [24]. In this study, our SPM SUV Voxel-to-Voxel analysis showed the top of the inferior frontal gyrus of the left anterior frontal lobe, left inferior frontal gyrus, left temporal lobe and left fusiform gyrus in the TLE with depression group was lower than that of the TLE without depression group. While left inferior frontal gyrus, right visual union cortex, right superior posterior cingulate cortex, right anterior frontal lobe, and right secondary somatosensory cortex in the TLE with depression group was higher than in the TLE without depression group. The higher degree of left hypometabolism can support the pathological mechanism of epileptic depression, This is consistent with the evidence of Kwon and Shamim et al. [8, 21, 22] which may be related to the fact that left temporal lobe epilepsy is more likely to cause cognitive impairment [25].
On the mechanism of glucose metabolism of neurons, Crane et al. [26] Considered that neurons in the low metabolism area could not make effective neural connec-tion, and low metabolism occurred due to the damage of cell function caused by epileptogenic foci discharge. Due to repeated focal seizures, temporal lobe neurons showed functional changes, neuronal electrical activity decreased, resulting in decreased glucose metabolism and low metabolism. The study of Koutmumanidis et al. [27] And Altay et al. [28] also showed that the low activity area of EEG was highly correlated with the low metabo-lism area of temporal lobe, but not with the pathologi-cal state of medial temporal lobe sclerosis. This study seems to support those of Crane’s viewpoint. Other fMRI studies of TLE with depression have also confirmed that depression patients have lower neuronal connectivity centrality, which tends to be more likely to cause depres-sion [29, 30].
However, we should be cautious about these inconsist-ent study conclusions. After all, the sample sizes are small and there are unevenly matched samples, so more equally matched samples are needed to validate these conclu-sions in the future.
ConclusionsThis study has found that TLE patients with depression and TLE patients without depression have uptake differ-ences in 18F-FDG in multiple brain regions. The hypo-metabolic regions in the TLE with depression group are mainly located in the left frontal lobe, temporal lobe and fusiform gyrus when compared to the TLE without depression group. The hypermetabolic regions of the TLE with depression group are mainly found in the right frontal lobe, visual joint cortex, superior posterior cin-gulate cortex and secondary somatosensory cortex. The TLE without depression group has a significant glucose hypermetabolic compensatory mechanism on the right side. In addition, both the TLE with depression group and the TLE without depression group have a high meta-bolic compensation in the non-epileptic area during the interictal period.
Supplementary informationThe online version contains supplementary material available at https ://doi.org/10.1186/s1288 0‑021‑00547 ‑x.
Additional file 1. Basic clinical data and SUV Z scores of patients with temporal lobe epilepsy.
AbbreviationsTLE: Temporal lobe epilepsy; FDG‑PET: 18F‑2‑fluorodeoxyglucose positron emission tomography; ILAE: International League Against Epilepsy Epileptic; MMSE: Mini‑mental State Examination; SUV: Standard uptake value; SPM8: Statistical parametric mapping 8; MDEs: Major depressive episodes.
AcknowledgementsNot applicable.
Authors’ contributionsWJF and GXW conceptualized and designed the study, drafted the initial manuscript, and reviewed and revised the manuscript. CXY, LJW, MP and HXS designed the data collection instruments, collected data, carried out the initial analyses, and reviewed and revised the manuscript PJY coordinated and supervised data collection, and critically reviewed the manuscript for important intellectual content. All authors approved the final manuscript as submitted and agree to be accountable for all aspects of the work.
FundingThis study was supported by a grant from Scientific research project of Guang‑dong Sanjiu Brain Hospital, A392018007.
Availability of data and materialsThe datasets used and/or analysed during the current study available from the corresponding author on reasonable request.
Ethics approval and consent to participateThis study was conducted in accordance with the declaration of Helsinki. This study was conducted with approval from the Ethics Committee of The First Affiliated Hospital of Jinan University. A written informed consent was obtained from all participants.
Consent for publicationConsent for publication was obtained from every individual whose data are included in this manuscript.
Page 9 of 9Wen et al. BMC Med Imaging (2021) 21:33
Competing interestsThe authors declare that they have no competing interests.
Author details1 Department of Psychiatry, Guangdong, The First Affiliated Hospital of Jinan University, No.613, West Huangpu Avenue, Tianhe District, Guangzhou 510630, China. 2 Department of Psychology and Behavior, Guangdong Sanjiu Brain Hospital, Guangzhou 510510, China. 3 Epilepsy Center, Guangdong Sanjiu Brain Hospital, Guangzhou 510510, China.
Received: 7 September 2020 Accepted: 6 January 2021
References 1. Zhang Y, Liu Y, Jia Y, Zhao Y, Ma C, Bao X, et al. Proteomic profiling of scle‑
rotic hippocampus revealed dysregulated packaging of vesicular neuro‑transmitters in temporal lobe epilepsy. Epilepsy Res. 2020;166:106412.
2. Krishnan V. Depression and anxiety in the epilepsies: from bench to bedside. Curr Neurol Neurosci Rep. 2020;20(9):41.
3. Ko PW, Hwang J, Lim HW, Park SP. Reliability and validity of the Korean version of the Neurological Disorders Depression Inventory for Epilepsy (K‑NDDI‑E). Epilepsy Behav. 2012;25(4):539–42.
4. Ho PH, Leung WCY, Leung IYH, Chang RSK. Factors associated with depression in people with epilepsy: a retrospective case‑control analysis. Hong Kong Med J. 2020. https ://doi.org/10.12809 /hkmj1 98310 .
5. Zhu X, Chen L, Luo C, Zhu X, He Z, Luo C. A study of resting functional magnetic resonance imaging (FMRI) in patients with drug‑resistant temporal lobe epilepsy complicated with depression. Epilepsia. 2018;4(03):277.
6. Pope RA, Centeno M, Flügel D, Symms MR, Koepp M, Thompson PJ, et al. Neural correlates of de novo depression following left temporal lobe epilepsy surgery: a voxel based morphometry study of pre‑surgical structural MRI. J Neurol Neurosurg Psychiatry. 2014;108(3):517–25.
7. Bromfield EB, Altshuler L, Leiderman DB, Balish M, Ketter TA, Devinsky O, et al. Cerebral metabolism and depression in patients with complex partial seizures. Arch Neurol. 1992;49(6):617–23.
8. Gilliam FG, Santos J, Vahle V, Carter J, Brown K, Hecimovic H. Depression in epilepsy: ignoring clinical expression of neuronal network dysfunction? Epilepsia. 2004;45(2):28–33.
9. Salzberg M, Taher T, Davie M, Carne R, Hicks RJ, Cook M, et al. Depression in temporal lobe epilepsy surgery patients: an FDG‑PET study. Epilepsia. 2006;47(12):2125–30.
10. Minoshima S, Berger KL, Lee KS, Mintun MA. An automated method for rotational correction and centering of three‑dimensional functional brain images. J Nucl Med. 1992;33(8):1579–85.
11. Minoshima S, Koeppe RA, Mintun MA, Berger KL, Taylor SF, Frey KA, et al. Automated detection of the intercommissural line for stereotactic locali‑zation of functional brain images. J Nucl Med. 1993;34(2):322–9.
12. Minoshima S, Koeppe RA, Frey KA, Kuhl DE. Anatomic standardization: linear scaling and nonlinear warping of functional brain images. J Nucl Med. 1994;35(9):1528–37.
13. Galazzo IB, Mattoli MV, Pizzini FB, De Vita E, Barnes A, Duncan JS, et al. Cer‑ebral metabolism and perfusion in MR‑negative individuals with refrac‑tory focal epilepsy assessed by simultaneous acquisition of 18F‑FDG PET and arterial spin labeling. NeuroImage Clin. 2016;11:648–57.
14. Henry TR, Mazziotta JC, Engel J Jr, Christenson PD, Zhang JX, Phelps ME, et al. Quantifying interictal metabolic activity in human temporal lobe epilepsy. J Cereb Blood Flow Metab. 1990;10(5):748–57.
15. Theodore WH. Distinguishing lateral temporal neocortical and mesial temporal lobe epilepsy. Epilepsy Curr. 2004;4(2):55–6.
16. Akman CI, Ichise M, Olsavsky A, Tikofsky RS, Van Heertum RL, Gilliam F. Epilepsy duration impacts on brain glucose metabolism in tem‑poral lobe epilepsy: results of voxel‑based mapping. Epilepsy Behav. 2010;17(3):373–80.
17. Lüders H, Lesser RP, Dinner DS, Hahn JF, Salanga V, Morris HH. The second sensory area in man: evoked potential and electrical stimulation studies. Neurology. 1985;33(2):177–84.
18. Wunderlich G, Schüller MF, Ebner A, Holthausen H, Tuxhorn I, Witte OW, et al. Temporal lobe epilepsy with sensory aura: interictal glucose hypo‑metabolism. Epilepsy Res. 2000;38(2–3):139–49.
19. Victoroff JI, Benson F, Grafton ST, Engel J Jr, Mazziotta JC. Depression in complex partial seizures. Electroencephalography and cerebral metabolic correlates. Arch Neurol. 1994;51(2):155–63.
20. Berg D, Supprian T, Thomae J, Warmuth‑Metz M, Horowski A, Zeiler B, et al. Lesion pattern in patients with multiple sclerosis and depression. Multiple Sclerosis. 2000;6(3):156–62.
21. Kwon OY, Park SP. Depression and anxiety in people with epilepsy. J Clin Neurol. 2016;10(1):375–375.
22. Shamim S, Hasler G, Liew C, Sato S, Theodore WH. Temporal lobe epilepsy, depression, and hippocampal volume. Epilepsia. 2009;50(5):1067–71.
23. Arnold S, Schlaug G, Niemann H, Ebner A, Lüders H, Witte OW, et al. Topography of interictal glucose hypometabolism in unilateral mesi‑otemporal epilepsy. Neurology. 1996;46(5):1422–1422.
24. Paparrigopoulos T, Ferentinos P, Brierley B, Shaw P, David AS. Relation‑ship between post‑operative depression/anxiety and hippocampal/amygdala volumes in temporal lobectomy for epilepsy. Epilepsy Res. 2008;81(1):30–5.
25. Demin K, Berger J, Holtkamp M, Bengner T. Are mental distress and cognitive impairment related in temporal lobe epilepsy? Epilepsy Res. 2018;146:126–31.
26. Carne RP, O’Brien TJ, Kilpatrick CJ, MacGregor LR, Hicks RJ, Murphy MA, et al. MRI‑negative PET‑positive temporal lobe epilepsy: a distinct surgi‑cally remediable syndrome. Brain. 2004;10:2276–85.
27. Koutroumanidis M, Binnie CD, Elwes RD, Polkey CE, Seed P, et al. Interictal regional slow activity in temporal lobe epilepsy correlates with lateral temporal hypometabolism as imaged with 18FDG PET: neurophysi‑ological and metabolic implications. J Neurol Neurosurg Psychiatry. 1998;65(2):170–6.
28. Altay EE, Fessler AJ, Gallagher M, Attarian HP, Dehdashti F, Vahle VJ, et al. Correlation of severity of FDG‑PET hypometabolism and inter‑ictal regional delta slowing in temporal lobe epilepsy. Epilepsia. 2010;46(4):573–6.
29. Chen S, Wu X, Lui S, Wu Q, Yao Z, Li Q, et al. Resting‑state fMRI study of treatment‑nave temporal lobe epilepsy patients with depressive symp‑toms. Neuroimage. 2012;60(1):299–304.
30. Gudayol‑Ferré E, Peró‑Cebollero M, González‑Garrido AA, Guàrdia‑Olmos J. Changes in brain connectivity related to the treatment of depres‑sion measured through fMRI: a systematic review. Front Hum Neurosci. 2015;9(10):582.
Publisher’s NoteSpringer Nature remains neutral with regard to jurisdictional claims in pub‑lished maps and institutional affiliations.
![ORIGINAL RESEARCH Open Access F]FDG-PET imaging is an ... · Background: Positron emission tomography (PET) with [2-18 F]-2-fluoro-2-deoxy-D-glucose ([18 F]FDG-PET) was acquired at](https://img.pdfslide.net/doc/110x75/5fffd04346622d24ad6dffc9/original-research-open-access-ffdg-pet-imaging-is-an-background-positron-emission.jpg)


![PET/CT: FUNDAMENTAL PRINCIPLES · recurrence. PET imaging can be performed with differ-ent radiotracers. The most commonly used radiophar-maceutical is a glucose analogue, 2-[fluorine-18]-fluo-ro-2-deoxy-D-glucose](https://img.pdfslide.net/doc/110x75/5ea78ca90dcaec79e2683d25/petct-fundamental-principles-recurrence-pet-imaging-can-be-performed-with-differ-ent.jpg)


![Pharmaceutical Care in PET Imaging: Emphasis on [ F]FDG Imaging](https://img.pdfslide.net/doc/110x75/61fb38182e268c58cd5b924a/pharmaceutical-care-in-pet-imaging-emphasis-on-ffdg-imaging.jpg)