Embed Size (px)
Citation preview
A Postreconstruction Harmonization Method for MulticenterRadiomic Studies in PET
Fanny Orlhac1, Sarah Boughdad1,2, Cathy Philippe3, Hugo Stalla-Bourdillon3, Christophe Nioche1, Laurence Champion2,Michael Soussan1,4, Frederique Frouin1, Vincent Frouin3, and Irene Buvat1
1Imagerie Moleculaire In Vivo, CEA-SHFJ, INSERM, CNRS, Universite Paris-Sud, Universite Paris-Saclay, Orsay, France;2Department of Nuclear Medicine, Institut Curie–Rene Huguenin, Saint-Cloud, France; 3NeuroSpin/UNATI, CEA, UniversiteParis-Saclay, Gif-sur-Yvette, France; and 4Department of Nuclear Medicine, AP-HP, Hopital Avicenne, Bobigny, France
Several reports have shown that radiomic features are affected byacquisition and reconstruction parameters, thus hampering multicenter
studies. We propose a method that, by removing the center effect while
preserving patient-specific effects, standardizes features measured
from PET images obtained using different imaging protocols. Methods:Pretreatment 18F-FDG PET images of patients with breast cancer were
included. In one nuclear medicine department (department A), 63 pa-
tients were scanned on a time-of-flight PET/CT scanner, and 16 lesionswere triple-negative (TN). In another nuclear medicine department (de-
partment B), 74 patients underwent PET/CT on a different brand of
scanner and a different reconstruction protocol, and 15 lesions were
TN. The images from department A were smoothed using a gaussianfilter to mimic data from a third department (department A-S). The pri-
mary lesion was segmented to obtain a lesion volume of interest (VOI),
and a spheric VOI was set in healthy liver tissue. Three SUVs and 6
textural features were computed in all VOIs. A harmonization methodinitially described for genomic data was used to estimate the depart-
ment effect based on the observed feature values. Feature distributions
in each department were compared before and after harmonization.Results: In healthy liver tissue, the distributions significantly differed
for 4 of 9 features between departments A and B and for 6 of 9 between
departments A and A-S (P , 0.05, Wilcoxon test). After harmonization,
none of the 9 feature distributions significantly differed between 2 de-partments (P . 0.1). The same trend was observed in lesions, with a
realignment of feature distributions between the departments after har-
monization. Identification of TN lesions was largely enhanced after har-
monization when the cutoffs were determined on data from onedepartment and applied to data from the other department.Conclusion:The proposed harmonization method is efficient at removing the multi-
center effect for textural features and SUVs. The method is easy to use,retains biologic variations not related to a center effect, and does not
require any feature recalculation. Such harmonization allows for multi-
center studies and for external validation of radiomic models or cutoffs
and should facilitate the use of radiomic models in clinical practice.
Key Words: texture analysis; tumor heterogeneity; PET; radiomics;
harmonization
J Nucl Med 2018; 59:1321–1328DOI: 10.2967/jnumed.117.199935
The number of publications involving texture analysis or radio-mic studies in medical imaging in general, and in PET in particular,
is growing rapidly (1,2). Several authors have published promising
PET results suggesting that quantification of lesion heterogeneity
using radiomic features can predict patient outcome or treatment
response (3–6). Yet, in a recent study, Chalkidou et al. (7) pointed
out an inappropriate control of type I error in many radiomic
studies that involved the calculation of a large number of imaging
features in a small number of patients. These authors underlined
the need to confirm observations and validate models using in-
dependent patient cohorts in multicenter settings. Since the first
publication including texture analysis in PET images in 2009 (8),
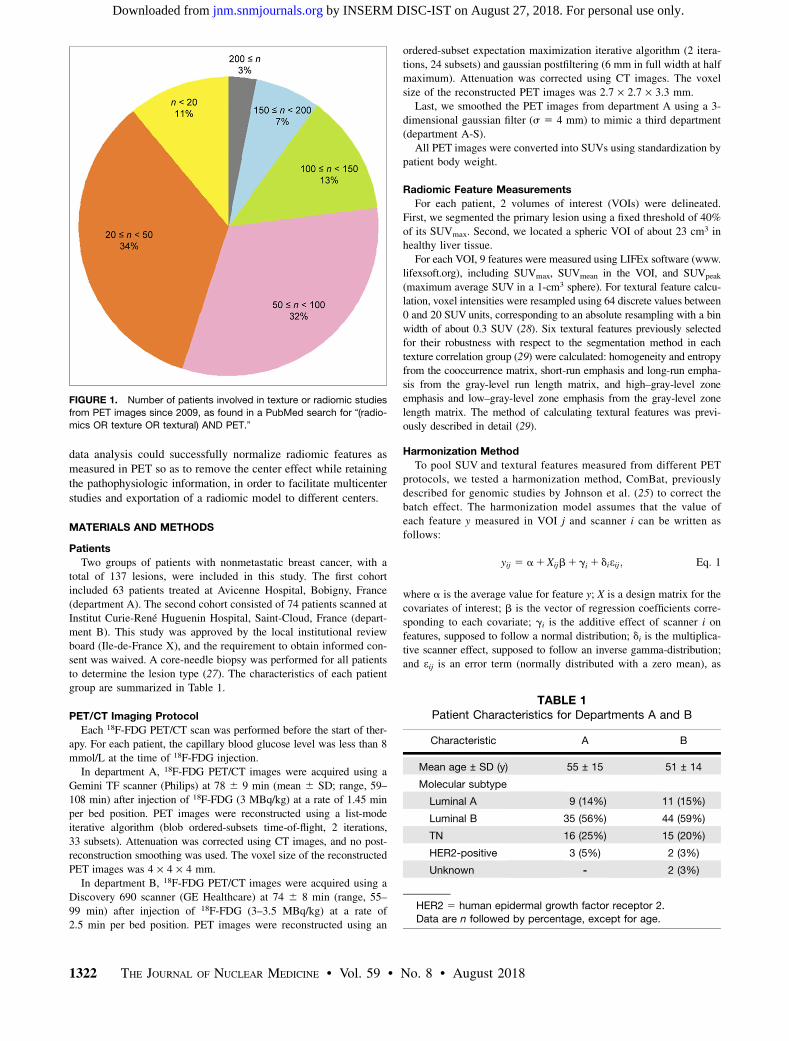
77% of the radiomic or texture studies in PET have included fewer
than 100 patients (Fig. 1), and only 3 studies involved more than
200 patients (9–11). The difficulty in including a large number of
patients lies mostly in the need for a clinically homogeneous co-
hort with respect to lesion types, stages, treatments, and imaging
protocols. Indeed, it has been shown that radiomic features are
sensitive to acquisition and reconstruction parameters (12,13),
thus hindering the pooling of data acquired using different scan-
ners or protocols. More precisely, radiomic features are sensitive
to the reconstruction algorithm, number of iterations or subsets,
scan duration per bed position, postreconstruction filter, and voxel
size (12–22). This variability of radiomic features implies that a
radiomic model established using data from a given PET scanner
might not be directly applicable to data from another PET scanner,
as recently demonstrated in cervical cancer by Reuze et al. (23).
This is obviously a severe limitation for the dissemination of radiomic
models and their transfer to clinical practice.About 10 years ago, the genomics field faced a similar problem
called the batch effect, with batch referring to the settings used to
acquire the data, hence being identical to the scanner effect or
imaging-protocol effect in radiomics. In genomics, the batch effect
is a technical source of variations caused by the handling of samples
(e.g., different laboratories, different technicians, different days),
potentially masking individual variations, whereas the identification
of robust gene signatures to predict disease outcome requires thou-
sands of samples (24). Among the methods developed to deal with
the batch effect, ComBat harmonization was described in 2007 (25).
This method is now widely used in genomics and has an advantage
over other methods in that it provides satisfactory results even for
small datasets with a limited number of features (26).In this context, the purpose of this study was to determine
whether the harmonization method initially described for genomic
Received Aug. 2, 2017; revision accepted Dec. 3, 2017.For correspondence or reprints contact: Fanny Orlhac, IMIV, CEA-SHFJ,
INSERM, CNRS, Universite Paris-Sud, Universite Paris Saclay, 4, Place duGeneral Leclerc, 91400 Orsay, France.E-mail: [email protected] online Jan. 4, 2018.COPYRIGHT© 2018 by the Society of Nuclear Medicine and Molecular Imaging.
HARMONIZATION FOR MULTICENTER STUDIES • Orlhac et al. 1321
by INSERM DISC-IST on August 27, 2018. For personal use only. jnm.snmjournals.org Downloaded from
data analysis could successfully normalize radiomic features asmeasured in PET so as to remove the center effect while retainingthe pathophysiologic information, in order to facilitate multicenterstudies and exportation of a radiomic model to different centers.
MATERIALS AND METHODS
Patients
Two groups of patients with nonmetastatic breast cancer, with atotal of 137 lesions, were included in this study. The first cohort
included 63 patients treated at Avicenne Hospital, Bobigny, France(department A). The second cohort consisted of 74 patients scanned at
Institut Curie-Rene Huguenin Hospital, Saint-Cloud, France (depart-ment B). This study was approved by the local institutional review
board (Ile-de-France X), and the requirement to obtain informed con-sent was waived. A core-needle biopsy was performed for all patients
to determine the lesion type (27). The characteristics of each patient
group are summarized in Table 1.
PET/CT Imaging Protocol
Each 18F-FDG PET/CT scan was performed before the start of ther-apy. For each patient, the capillary blood glucose level was less than 8
mmol/L at the time of 18F-FDG injection.In department A, 18F-FDG PET/CT images were acquired using a
Gemini TF scanner (Philips) at 78 6 9 min (mean 6 SD; range, 59–108 min) after injection of 18F-FDG (3 MBq/kg) at a rate of 1.45 min
per bed position. PET images were reconstructed using a list-modeiterative algorithm (blob ordered-subsets time-of-flight, 2 iterations,
33 subsets). Attenuation was corrected using CT images, and no post-reconstruction smoothing was used. The voxel size of the reconstructed
PET images was 4 · 4 · 4 mm.
In department B, 18F-FDG PET/CT images were acquired using aDiscovery 690 scanner (GE Healthcare) at 74 6 8 min (range, 55–
99 min) after injection of 18F-FDG (3–3.5 MBq/kg) at a rate of2.5 min per bed position. PET images were reconstructed using an
ordered-subset expectation maximization iterative algorithm (2 itera-
tions, 24 subsets) and gaussian postfiltering (6 mm in full width at halfmaximum). Attenuation was corrected using CT images. The voxel
size of the reconstructed PET images was 2.7 · 2.7 · 3.3 mm.Last, we smoothed the PET images from department A using a 3-
dimensional gaussian filter (s 5 4 mm) to mimic a third department(department A-S).
All PET images were converted into SUVs using standardization bypatient body weight.
Radiomic Feature Measurements
For each patient, 2 volumes of interest (VOIs) were delineated.First, we segmented the primary lesion using a fixed threshold of 40%
of its SUVmax. Second, we located a spheric VOI of about 23 cm3 inhealthy liver tissue.
For each VOI, 9 features were measured using LIFEx software (www.lifexsoft.org), including SUVmax, SUVmean in the VOI, and SUVpeak
(maximum average SUV in a 1-cm3 sphere). For textural feature calcu-lation, voxel intensities were resampled using 64 discrete values between
0 and 20 SUV units, corresponding to an absolute resampling with a bin
width of about 0.3 SUV (28). Six textural features previously selectedfor their robustness with respect to the segmentation method in each
texture correlation group (29) were calculated: homogeneity and entropyfrom the cooccurrence matrix, short-run emphasis and long-run empha-
sis from the gray-level run length matrix, and high–gray-level zoneemphasis and low–gray-level zone emphasis from the gray-level zone
length matrix. The method of calculating textural features was previ-ously described in detail (29).
Harmonization Method
To pool SUV and textural features measured from different PETprotocols, we tested a harmonization method, ComBat, previously
described for genomic studies by Johnson et al. (25) to correct thebatch effect. The harmonization model assumes that the value of
each feature y measured in VOI j and scanner i can be written asfollows:
yij 5 a1Xijb1 gi 1 dieij; Eq. 1
where a is the average value for feature y; X is a design matrix for the
covariates of interest; b is the vector of regression coefficients corre-sponding to each covariate; gi is the additive effect of scanner i on
features, supposed to follow a normal distribution; di is the multiplica-tive scanner effect, supposed to follow an inverse gamma-distribution;
and eij is an error term (normally distributed with a zero mean), as
TABLE 1Patient Characteristics for Departments A and B
Characteristic A B
Mean age ± SD (y) 55 ± 15 51 ± 14
Molecular subtype
Luminal A 9 (14%) 11 (15%)
Luminal B 35 (56%) 44 (59%)
TN 16 (25%) 15 (20%)
HER2-positive 3 (5%) 2 (3%)
Unknown - 2 (3%)
HER2 5 human epidermal growth factor receptor 2.
Data are n followed by percentage, except for age.
FIGURE 1. Number of patients involved in texture or radiomic studies
from PET images since 2009, as found in a PubMed search for “(radio-
mics OR texture OR textural) AND PET.”
1322 THE JOURNAL OF NUCLEAR MEDICINE • Vol. 59 • No. 8 • August 2018
by INSERM DISC-IST on August 27, 2018. For personal use only. jnm.snmjournals.org Downloaded from

explained by Fortin et al. (30). Harmonization consists of estimating
gi and di using empiric Bayes estimates (denoted as gi* and di*) asdescribed previously (25). The same model can be used in its non-
parametric form in which no assumptions are made regarding the lawsfollowed by gi, di, and eij. The normalized value of feature y for VOI j
and scanner i is then obtained as follows:
yComBatij 5
yij 2 a 2 Xijb 2 g�id�i
1 a1Xijb;
Eq. 2
where a and b are estimators of parameters
a and b, respectively. The harmonization de-termines a transformation for each feature
separately, based on the batch (here, depart-ment) effect observed on feature values. In
the first part of this study, we used harmoni-zation without accounting for any biologic
covariate (i.e., X 5 0), and in the secondpart, we used TN status as the covariate of
interest.For each tissue separately (lesion and liver
tissues), we applied harmonization on allfeatures using the R function called ComBat,
available at https://github.com/Jfortin1/Com-BatHarmonization/, using the non-parametric
settings.
Statistical Analysis
To test the ability of the harmonization
method to remove the center effect from thefeature values, we plotted the probability
density function of all features in the liverVOI as a function of the department, before
and after harmonization. We used Wilcoxontests to determine whether the features dif-
fered significantly between departments, withP values of less than 0.05 considered statisti-
cally significant.For the lesion VOI, we displayed the box
plots of all features as a function of lesiontype—TN or non-TN—for each department separately, before and
after harmonization. Wilcoxon tests were used to investigate the im-pact of harmonization on the features in the TN and non-TN groups in
each department.To study the usefulness of harmonization in multicenter studies, we
determined the cutoff for each feature as that maximizing the Youden
TABLE 2P Values of Wilcoxon Tests Between Feature Values in Departments A and B and in Departments A and A-S Before
and After Harmonization
A vs. B A vs. A-S
Feature Before harmonization After harmonization Before harmonization After harmonization
Homogeneity ,0.0001* 0.7592 ,0.0001* 0.9300
Entropy ,0.0001* 0.7828 ,0.0001* 0.9611
Short-run emphasis ,0.0001* 0.8930 ,0.0001* 0.7922
Long-run emphasis ,0.0001* 0.4708 ,0.0001* 0.8491
Low–gray-level zone emphasis 0.5961 0.1319 0.9397 0.9650
High–gray-level zone emphasis 0.2328 0.8100 0.0233* 0.8759
SUVmax 0.0522 0.7424 ,0.0001* 1.0000
SUVmean 0.4042 0.8409 0.9980 1.0000
SUVpeak 0.3407 0.9666 0.0614 0.9766
*P , 0.05.
FIGURE 2. Probability density function (%) of homogeneity (A and B) and SUVmax (C and D) in
liver tissue as observed in departments A (pink), B (green), and A-S (blue), before (left) and after
(right) harmonization.
HARMONIZATION FOR MULTICENTER STUDIES • Orlhac et al. 1323
by INSERM DISC-IST on August 27, 2018. For personal use only. jnm.snmjournals.org Downloaded from

index, defined as (sensitivity 1 specificity – 1), in separating TN fromnon-TN groups using data from department A. We then used these
cutoffs to determine whether lesions from department B were TN ornon-TN, and we assessed the accuracy of this classification without
and with harmonization. The accuracy of the TN classification wasalso measured using the Youden index.
Finally, we investigated the impact of setting a covariate of interestby removing the TN lesions from department A to obtain 2 datasets
with different biologic compositions: depart-
ment A without TN and department B in-cluding 20% of TN. We studied how TN
lesions in department B were distinguishedfrom non-TN lesions in department A using
Wilcoxon tests before and after harmonization,without and with TN status as a covariate of
interest.
RESULTS
Liver Tissue
The plots of features in liver tissue showa shift in distribution among the 3 depart-ments (Fig. 2; Supplemental Fig. 1 [sup-plemental materials are available at http://jnm.snmjournals.org]). For instance, ho-mogeneity in the liver VOI was lower indepartment A than in department B or A-S(Fig. 2A). Conversely, SUVmax was higherin department A than in B, which washigher than in A-S (Fig. 2C). Homogene-ity, entropy, short-run emphasis, and long-run emphasis differed significantly betweendepartments A and B and between depart-ments A and A-S (P , 0.05; Table 2) whenthe features were not harmonized. High–gray-level zone emphasis and SUVmax alsodiffered significantly between departmentsA and A-S.
After harmonization, the distributions overlapped better for allfeatures (Fig. 2; Supplemental Fig. 1), and no feature differedsignificantly between 2 departments (P . 0.1; Table 2).
Lesion Tissue
In our cohorts, 16 of 63 lesions (25%) were TN in departmentsA and A-S, and 15 of 74 lesions (20%) were TN in departmentB (Table 1). The mean lesion volume was 28.1 6 39.1 cm3
TABLE 3P Values of Wilcoxon Tests Between Feature Values in TN and Non-TN Lesions in Departments A and B Before and
After Harmonization
Before harmonization After harmonization
Feature
TN(A) vs.
non-TN(A)
TN(B) vs.
non-TN(B)
TN(A) vs.
TN(B)
Non-TN(A) vs.
non-TN(B)
TN(A1B) vs.
non-TN(A1B)
TN(B) vs.
non-TN(A)
TN(A) vs.
TN(B)
Non-TN(A) vs.
non-TN(B)
TN(A1B) vs.
non-TN(A1B)
TN(B) vs.
non-TN(A)
Homogeneity 0.0810 0.0078* 0.4232 0.0074* 0.0014* 0.4635 0.5986 0.8737 0.0015* 0.0093*
Entropy 0.0205* 0.0410* 0.5196 0.3906 0.0031* 0.0875 0.7405 0.9139 0.0027* 0.0254*
Short-run emphasis 0.2175 0.0091* 0.2995 0.0004* 0.0063* 0.9481 0.1294 0.8338 0.0062* 0.0061*
Long-run emphasis 0.2618 0.0072* 0.2814 0.0004* 0.0072* 0.9352 0.0055* 0.3871 0.0162* 0.0004*
Low–gray-level
zone emphasis
0.0005* 0.0119* 0.0405* 0.0244* 5.69e-05* 0.3786 0.1102 0.3059 0.0002* 0.0003*
High–gray-level
zone emphasis
0.0002* 0.0119* 0.0494* 0.0282* 3.20e-05* 0.2886 0.2814 0.3337 2.27e-05* 0.0058*
SUVmax 0.0006* 0.0111* 0.0544 0.0278* 7.54e-05* 0.4058 0.5717 0.7943 4.47e-05* 0.0072*
SUVmean 0.0003* 0.0139* 0.0448* 0.0359* 3.20e-05* 0.2394 0.4463 0.7747 3.05e-05* 0.0052*
SUVpeak 0.0004* 0.0167* 0.0267* 0.0306* 9.75e-05* 0.4736 0.3581 0.7894 4.99e-05* 0.0061*
*P , 0.05.
FIGURE 3. Box plots of homogeneity (A) and SUVmax (B) for TN and non-TN lesions before and
after harmonization in 3 departments separately.
1324 THE JOURNAL OF NUCLEAR MEDICINE • Vol. 59 • No. 8 • August 2018
by INSERM DISC-IST on August 27, 2018. For personal use only. jnm.snmjournals.org Downloaded from
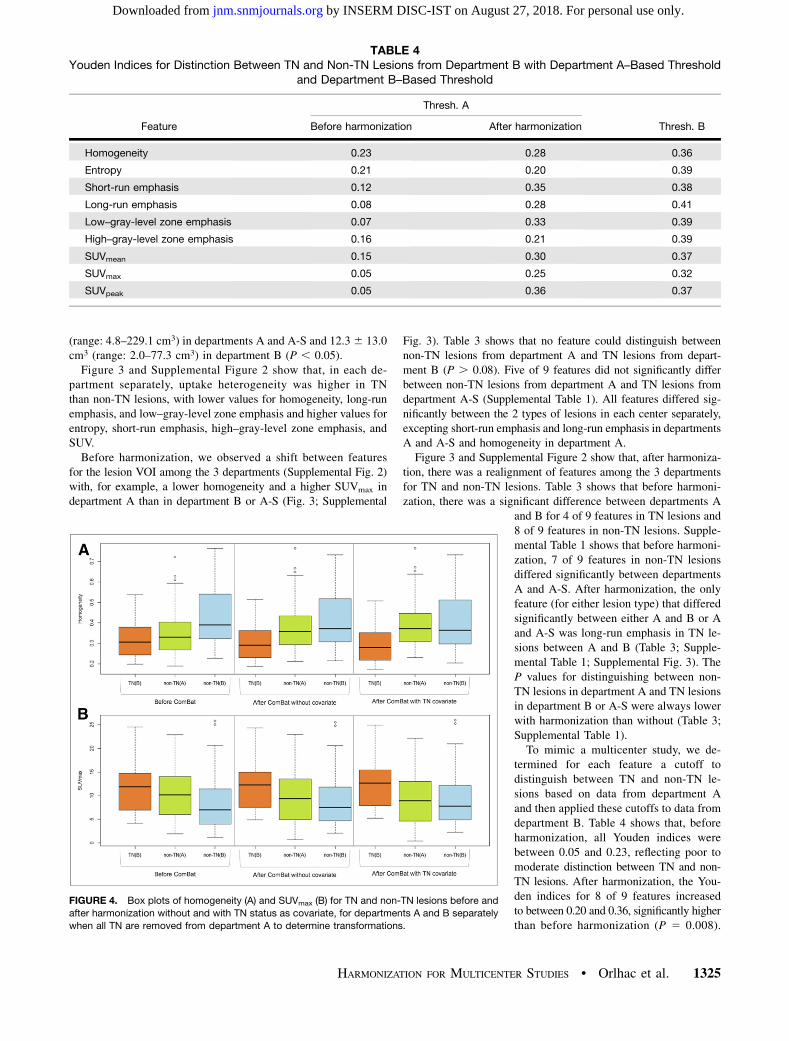
(range: 4.8–229.1 cm3) in departments A and A-S and 12.36 13.0cm3 (range: 2.0–77.3 cm3) in department B (P , 0.05).Figure 3 and Supplemental Figure 2 show that, in each de-
partment separately, uptake heterogeneity was higher in TNthan non-TN lesions, with lower values for homogeneity, long-runemphasis, and low–gray-level zone emphasis and higher values forentropy, short-run emphasis, high–gray-level zone emphasis, andSUV.Before harmonization, we observed a shift between features
for the lesion VOI among the 3 departments (Supplemental Fig. 2)with, for example, a lower homogeneity and a higher SUVmax indepartment A than in department B or A-S (Fig. 3; Supplemental
Fig. 3). Table 3 shows that no feature could distinguish betweennon-TN lesions from department A and TN lesions from depart-ment B (P . 0.08). Five of 9 features did not significantly differbetween non-TN lesions from department A and TN lesions fromdepartment A-S (Supplemental Table 1). All features differed sig-nificantly between the 2 types of lesions in each center separately,excepting short-run emphasis and long-run emphasis in departmentsA and A-S and homogeneity in department A.Figure 3 and Supplemental Figure 2 show that, after harmoniza-
tion, there was a realignment of features among the 3 departmentsfor TN and non-TN lesions. Table 3 shows that before harmoni-zation, there was a significant difference between departments A
and B for 4 of 9 features in TN lesions and8 of 9 features in non-TN lesions. Supple-mental Table 1 shows that before harmoni-zation, 7 of 9 features in non-TN lesionsdiffered significantly between departmentsA and A-S. After harmonization, the onlyfeature (for either lesion type) that differedsignificantly between either A and B or Aand A-S was long-run emphasis in TN le-sions between A and B (Table 3; Supple-mental Table 1; Supplemental Fig. 3). TheP values for distinguishing between non-TN lesions in department A and TN lesionsin department B or A-S were always lowerwith harmonization than without (Table 3;Supplemental Table 1).To mimic a multicenter study, we de-
termined for each feature a cutoff todistinguish between TN and non-TN le-sions based on data from department Aand then applied these cutoffs to data fromdepartment B. Table 4 shows that, beforeharmonization, all Youden indices werebetween 0.05 and 0.23, reflecting poor tomoderate distinction between TN and non-TN lesions. After harmonization, the You-den indices for 8 of 9 features increasedto between 0.20 and 0.36, significantly higherthan before harmonization (P 5 0.008).
TABLE 4Youden Indices for Distinction Between TN and Non-TN Lesions from Department B with Department A–Based Threshold
and Department B–Based Threshold
Thresh. A
Feature Before harmonization After harmonization Thresh. B
Homogeneity 0.23 0.28 0.36
Entropy 0.21 0.20 0.39
Short-run emphasis 0.12 0.35 0.38
Long-run emphasis 0.08 0.28 0.41
Low–gray-level zone emphasis 0.07 0.33 0.39
High–gray-level zone emphasis 0.16 0.21 0.39
SUVmean 0.15 0.30 0.37
SUVmax 0.05 0.25 0.32
SUVpeak 0.05 0.36 0.37
FIGURE 4. Box plots of homogeneity (A) and SUVmax (B) for TN and non-TN lesions before and
after harmonization without and with TN status as covariate, for departments A and B separately
when all TN are removed from department A to determine transformations.
HARMONIZATION FOR MULTICENTER STUDIES • Orlhac et al. 1325
by INSERM DISC-IST on August 27, 2018. For personal use only. jnm.snmjournals.org Downloaded from
These Youden indices after harmonization were close to thoseobtained when the cutoff was directly based on data from depart-ment B (Table 4). For instance, with a department A–based cutoff,the Youden index for SUVpeak for department B was 0.05 beforeharmonization and increased to 0.36 after harmonization—similarto that (0.37) obtained with a department B–based cutoff.
Setting a Covariate of Interest
When we removed the TN lesions from department A andapplied harmonization for departments A and B, the P values fordistinguishing between TN lesions in department B and non-TNlesions in department A decreased for 8 of 9 features comparedwith P values obtained before harmonization (Fig. 4; Supplemen-tal Fig. 4; Supplemental Table 2). The P values further decreased
when the TN status was set as a covariate of interest in the har-monization; all features were then statistically significant for dis-
tinguishing between TN lesions in department B and non-TNlesions in department A (Supplemental Table 2).
DISCUSSION
In this study, we demonstrated that it is possible to pool radiomicfeatures and SUV measurements from different PET imagingprotocols by applying a harmonization method, ComBat, initiallyused in genomics. The efficiency of the method was illustrated usingmeasurements of healthy liver tissue and breast lesions on 18F-FDGPET images acquired in 2 different departments and with signifi-cantly different spatial resolutions (i.e., the same images acquired
with and without gaussian smoothing of9.4 mm in full width at half maximum). Inaddition, we found that with this method, alesion-subtype–distinguishing cutoff estab-lished using data from one PET scanner isapplicable to data from another PET scanner.Among the methods developed to deal
with the batch effect, the ComBat harmo-
nization has already been used to normalizehistopathologic images for cancer diagnosis(31) and cortical-thickness measurementsfrom MR images (32). The method has sev-eral advantages. It is easily accessible, prac-tical (thanks to an R function available forfree), and fast. It is a department-specificharmonization that is based only on patientdata acquired in the different departments,
and it does not require any phantom exper-iment, making it suitable for retrospectivedata analysis. An additional advantage isthat it applies directly to the radiomic fea-tures and not to the PET images from whichthose features are calculated. Therefore, itdoes not reduce the quality of an image setto match the lower quality of other sets. With-out covariates of interest, affine transforma-
tions are used to harmonize the features.The transformations are different for each fea-ture, each VOI type, and each department, sothat the transformed data lie in a commonspace in which the department effects havebeen removed or at least reduced. Becausethe transformations are estimated and appliedto the measured data themselves, the trans-formed data can be pooled afterward without
the need for learning sets. The only constraintis that data from the different departmentsmust be available so that the transforma-tions can be identified. In the context ofradiomic modeling, this implies that whena published predictive radiomic model isbased on data from a certain department,that department must make available the
radiomic feature values used to establishthe model, as well as the model equationsand coefficients, if the model is to be appli-cable to data from a different department.
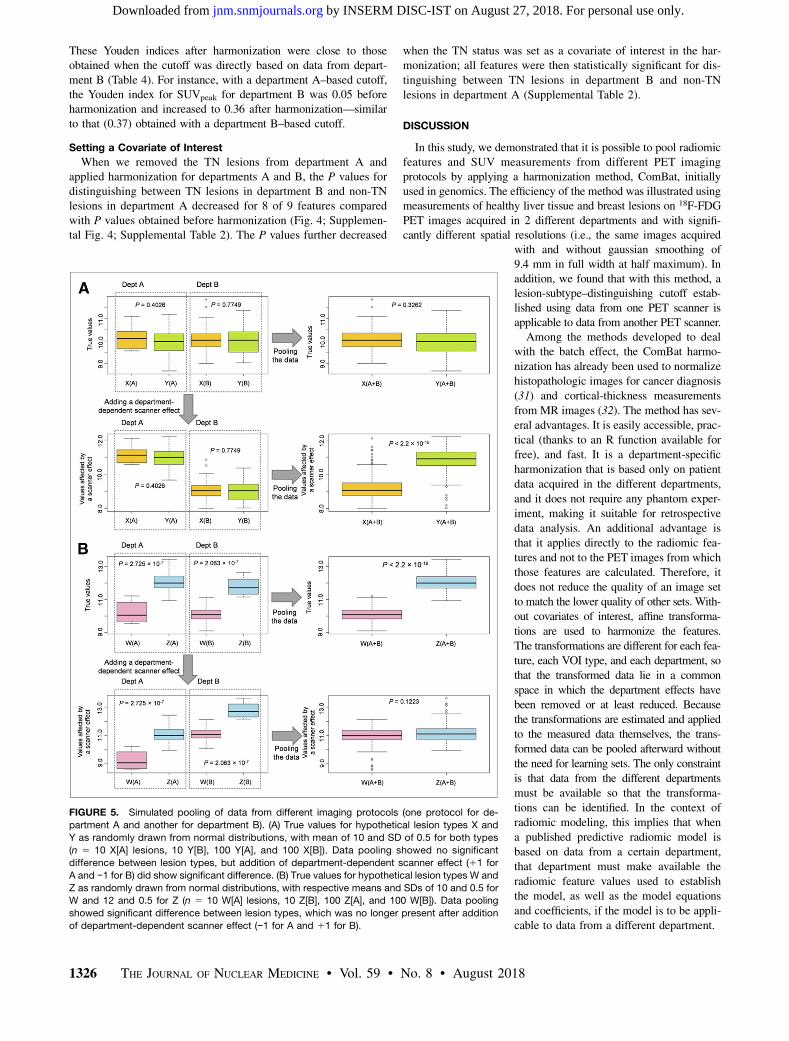
FIGURE 5. Simulated pooling of data from different imaging protocols (one protocol for de-
partment A and another for department B). (A) True values for hypothetical lesion types X and
Y as randomly drawn from normal distributions, with mean of 10 and SD of 0.5 for both types
(n 5 10 X[A] lesions, 10 Y[B], 100 Y[A], and 100 X[B]). Data pooling showed no significant
difference between lesion types, but addition of department-dependent scanner effect (11 for
A and −1 for B) did show significant difference. (B) True values for hypothetical lesion types W and
Z as randomly drawn from normal distributions, with respective means and SDs of 10 and 0.5 for
W and 12 and 0.5 for Z (n 5 10 W[A] lesions, 10 Z[B], 100 Z[A], and 100 W[B]). Data pooling
showed significant difference between lesion types, which was no longer present after addition
of department-dependent scanner effect (−1 for A and 11 for B).
1326 THE JOURNAL OF NUCLEAR MEDICINE • Vol. 59 • No. 8 • August 2018
by INSERM DISC-IST on August 27, 2018. For personal use only. jnm.snmjournals.org Downloaded from

Despite continuous and commendable efforts by the internationalcommunity and societies to produce guidelines for harmonizedimaging procedures (33–35), the acquisition and reconstructionprotocols for PET images are not yet standardized. The methodwe propose offers a solution to performing multicenter studies evenwhen data have been acquired under different conditions. ComBatharmonization is usable not only for radiomic textural features butalso for SUV measurements. In our data, we observed that SUVmax
distributions in the liver differed between departments A and B(P 5 0.05) before harmonization but overlapped better after har-monization (Table 2; Fig. 2). Similarly, all SUV P values weregreater than 0.2 between non-TN lesions from department A andTN lesions from department B (Table 3), meaning that SUV mea-surements failed to distinguish TN from non-TN lesions. Afterharmonization, SUV P values were less than 0.007 between non-TN lesions from department A and TN lesions from department B,close to the P values observed when distinguishing between TNand non-TN lesions in department A (P# 0.006) and in departmentB (P # 0.02). This harmonization method is therefore useful forSUVs in a multicenter investigation or for retrospective analysis ofPET images acquired on different scanners at the same institutionor on one scanner but with different acquisition and reconstructionparameters. Supplemental Figure 3 demonstrates how harmoniza-tion greatly reduced the differences in SUVs or feature valuesbetween departments A-S and A, although some differences remainedfor individual lesions. Residual differences after harmonizationare also due to the strong smoothing in A-S data, which inducessome information loss that obviously cannot be recovered usingharmonization.In each of the 3 PET image–based radiomic studies that in-
cluded more than 200 patients (Fig. 1)—one to evaluate somaticmutations (9), another to predict prognosis in non–small cell lungcancer (10), and a third to predict treatment response in esopha-geal cancer (11)—the PET images came from different PET scan-ners but the scanner effect was not explicitly accounted for. Manystudies have reported the impact of acquisition and reconstructionparameters on radiomic features. Ignoring the scanner effect whenpooling data from different centers can affect the results in twoways: either making the results more significant than they are orhiding significant differences (Fig. 5).Although entropy was the most robust feature in previous
publications (Supplemental Table 4 of Orlhac et al. (22)), weobserved a shift in entropy in liver tissue among the 3 departments(Supplemental Fig. 1A), with higher entropy in department A thanin department B or A-S (P , 0.0001; Table 2). The shift was nolonger present after harmonization (P . 0.7), suggesting that evenwhen a feature is robust with respect to different imaging proto-cols, a scanner effect can still be present and require compensationin multicenter studies.If covariates of interest are properly set (Eq. 1), ComBat har-
monization may be used even if the patient groups have differentcharacteristics, as explained by Fortin et al. (32). ComBat harmo-nization therefore removes the center effect without altering thebiologic information conveyed by the radiomic features. Whenpatient characteristics are very different between departments,the ComBat harmonization procedure should define any covariatesthat are to be protected—that is, are not to enter the harmonizationprocess. For example, when removing the TN lesions from de-partment A, we observed better discrimination between TN le-sions from department B and non-TN lesions from departmentA (Supplemental Table 2) if TN status was defined as a covariate
(using the X design matrix (Eq. 1)) than when no covariate wasdefined. Yet, with ComBat harmonization being a data-driven tech-nique, it is preferable to use clinically and biologically similar data-sets whenever possible.ComBat has been described in a parametric version, with as-
sumptions about the statistical distribution of the model param-eters, and in a non-parametric version (25). Because our data didnot closely fulfil these assumptions, we used the nonparametricversion instead.Differences between images from different PET systems could
also be due to calibration differences. We performed a test (data notshown) to ensure that the image differences removed by ComBatharmonization could not have been sufficiently removed by simple cor-rections involving a rescaling or offset factor estimated from healthyliver.A limitation of our study was the small number of patients in
each department, although the number was consistent with mostPET radiomic studies (Fig. 1). Studies of other imaging protocolsand other cancer types are needed to more extensively validate theradiomic use of ComBat harmonization. The minimum number ofpatients required per department should also be further explored,especially in the nonparametric setting. ComBat has been specif-ically designed to be robust to small samples (25,32) and has beenused in genomics with as few as 25 samples in each batch (25).
CONCLUSION
Using ComBat harmonization, a procedure initially described forgenomic analysis, we showed that radiomic feature values andSUVs from images acquired in different departments or underdifferent conditions could be pooled for further analysis. Harmoni-zation preserved the individual variations in healthy liver tissue andbreast lesions while removing the imaging-protocol effect. Thismethod is easily available and does not require any featurerecalculation since it applies directly to the radiomic featurevalues as opposed to the images. The ComBat harmonization ap-proach appears to be a promising way to build radiomic modelsusing data pooled from different departments. This harmonizationmethod is also useful to apply a radiomic model derived fromimages acquired in one department to images acquired in anotherdepartment.
DISCLOSURE
This work was supported by the ‘‘Lidex-PIM’’ project fundedby the IDEX Paris-Saclay, ANR-11-IDEX-0003-02. No other po-tential conflict of interest relevant to this article was reported.
REFERENCES
1. Alic L, Niessen WJ, Veenland JF. Quantification of heterogeneity as a biomarker
in tumor imaging: a systematic review. PLoS One. 2014;9:e110300.
2. Gillies RJ, Kinahan PE, Hricak H. Radiomics: images are more than pictures,
they are data. Radiology. 2016;278:563–577.
3. Ha S, Park S, Bang J-I, Kim E-K, Lee H-Y. Metabolic radiomics for pretreatment18F-FDG PET/CT to characterize locally advanced breast cancer: histopathologic
characteristics, response to neoadjuvant chemotherapy, and prognosis. Sci Rep.
2017;7:1556.
4. Ben Bouallegue F, Al Tabaa Y, Kafrouni M, Cartron G, Vauchot F, Mariano-
Goulart D. Association between textural and morphological tumor indices on
baseline PET-CT and early metabolic response on interim PET-CT in bulky
malignant lymphomas. Med Phys. 2017;44:4608–4619.
5. Desbordes P, Ruan S, Modzelewski R, et al. Predictive value of initial FDG-PET
features for treatment response and survival in esophageal cancer patients treated with
chemo-radiation therapy using a random forest classifier. PLoS One. 2017;12:e0173208.
HARMONIZATION FOR MULTICENTER STUDIES • Orlhac et al. 1327
by INSERM DISC-IST on August 27, 2018. For personal use only. jnm.snmjournals.org Downloaded from

6. Beukinga RJ, Hulshoff JB, van Dijk LV, et al. Predicting response to neoadjuvant
chemoradiotherapy in esophageal cancer with textural features derived from
pretreatment 18F-FDG PET/CT imaging. J Nucl Med. 2017;58:723–729.
7. Chalkidou A, O’Doherty MJ, Marsden PK. False discovery rates in PET and
CT studies with texture features: a systematic review. PLoS One. 2015;10:
e0124165.
8. El Naqa I, Grigsby P, Apte A, et al. Exploring feature-based approaches in PET
images for predicting cancer treatment outcomes. Pattern Recognit. 2009;42:1162–
1171.
9. Yip SSF, Kim J, Coroller TP, et al. Associations between somatic mutations and
metabolic imaging phenotypes in non-small cell lung cancer. J Nucl Med. 2017;
58:569–576.
10. Ohri N, Duan F, Snyder BS, et al. Pretreatment 18F-FDG PET textural features in
locally advanced non-small cell lung cancer: secondary analysis of ACRIN 6668/
RTOG 0235. J Nucl Med. 2016;57:842–848.
11. van Rossum PSN, Fried DV, Zhang L, et al. The incremental value of subjective
and quantitative assessment of 18F-FDG PET for the prediction of pathologic
complete response to preoperative chemoradiotherapy in esophageal cancer.
J Nucl Med. 2016;57:691–700.
12. Galavis PE, Hollensen C, Jallow N, Paliwal B, Jeraj R. Variability of textural
features in FDG PET images due to different acquisition modes and reconstruc-
tion parameters. Acta Oncol. 2010;49:1012–1016.
13. Yan J, Chu-Shern JL, Loi HY, et al. Impact of image reconstruction settings on
texture features in 18F-FDG PET. J Nucl Med. 2015;56:1667–1673.
14. Doumou G, Siddique M, Tsoumpas C, Goh V, Cook GJ. The precision of textural
analysis in 18F-FDG-PET scans of oesophageal cancer. Eur Radiol. 2015;25:2805–
2812.
15. Nyflot MJ, Yang F, Byrd D, Bowen SR, Sandison GA, Kinahan PE. Quantitative
radiomics: impact of stochastic effects on textural feature analysis implies the
need for standards. J Med Imaging (Bellingham). 2015;2:041002.
16. van Velden FHP, Kramer GM, Frings V, et al. Repeatability of radiomic features
in non-small-cell lung cancer [18F]FDG-PET/CT studies: impact of reconstruc-
tion and delineation. Mol Imaging Biol. 2016;18:788–795.
17. Bailly C, Bodet-Milin C, Couespel S, et al. Revisiting the robustness of PET-
based textural features in the context of multi-centric trials. PLoS One. 2016;11:
e0159984.
18. Forgacs A, Pall Jonsson H, Dahlbom M, et al. A study on the basic criteria for
selecting heterogeneity parameters of F18-FDG PET images. PLoS One. 2016;
11:e0164113.
19. Lasnon C, Majdoub M, Lavigne B, et al. 18F-FDG PET/CT heterogeneity quan-
tification through textural features in the era of harmonisation programs: a focus
on lung cancer. Eur J Nucl Med Mol Imaging. 2016;43:2324–2335.
20. Orlhac F, Theze B, Soussan M, Boisgard R, Buvat I. Multi-scale texture analysis:
from 18F-FDG PET images to pathological slides. J Nucl Med. 2016;57:1823–
1828.
21. Shiri I, Rahmim A, Ghaffarian P, Geramifar P, Abdollahi H, Bitarafan-Rajabi A.
The impact of image reconstruction settings on 18F-FDG PET radiomic features:
multi-scanner phantom and patient studies. Eur Radiol. 2017;27:4498–4509.
22. Orlhac F, Nioche C, Soussan M, Buvat I. Understanding changes in tumor texture
indices in PET: a comparison between visual assessment and index values in
simulated and patient data. J Nucl Med. 2017;58:387–392.
23. Reuze S, Orlhac F, Chargari C, et al. Prediction of cervical cancer recurrence
using textural features extracted from 18F-FDG PET images acquired with dif-
ferent scanners. Oncotarget. 2017;8:43169–43179.
24. Lazar C, Meganck S, Taminau J, et al. Batch effect removal methods for microarray
gene expression data integration: a survey. Brief Bioinform. 2013;14:469–490.
25. Johnson WE, Li C, Rabinovic A. Adjusting batch effects in microarray expres-
sion data using empirical Bayes methods. Biostatistics. 2007;8:118–127.
26. Goh WWB, Wang W, Wong L. Why batch effects matter in omics data, and how
to avoid them. Trends Biotechnol. 2017;35:498–507.
27. Soussan M, Orlhac F, Boubaya M, et al. Relationship between tumor heteroge-
neity measured on FDG-PET/CT and pathological prognostic factors in invasive
breast cancer. PLoS One. 2014;9:e94017.
28. Orlhac F, Soussan M, Chouahnia K, Martinod E, Buvat I. 18F-FDG PET-derived
textural indices reflect tissue-specific uptake pattern in non-small cell lung can-
cer. PLoS One. 2015;10:e0145063.
29. Orlhac F, Soussan M, Maisonobe J-A, Garcia CA, Vanderlinden B, Buvat I.
Tumor texture analysis in 18F-FDG PET: relationships between texture parame-
ters, histogram indices, standardized uptake values, metabolic volumes, and total
lesion glycolysis. J Nucl Med. 2014;55:414–422.
30. Fortin J-P, Parker D, Tunc B, et al. Harmonization of multi-site diffusion tensor
imaging data. Neuroimage. 2017;161:149–170.
31. Kothari S, Phan JH, Stokes TH, Osunkoya AO, Young AN, Wang MD. Remov-
ing batch effects from histopathological images for enhanced cancer diagnosis.
IEEE J Biomed Health Inform. 2014;18:765–772.
32. Fortin J-P, Cullen N, Sheline YI, et al. Harmonization of cortical thickness
measurements across scanners and sites. Neuroimage. 2017;167:104–120.
33. Delbeke D, Coleman RE, Guiberteau MJ, et al. Procedure guideline for tumor
imaging with 18F-FDG PET/CT 1.0. J Nucl Med. 2006;47:885–895.
34. Boellaard R, Delgado-Bolton R, Oyen WJG, et al. FDG PET/CT: EANM pro-
cedure guidelines for tumour imaging: version 2.0. Eur J Nucl Med Mol Imaging.
2015;42:328–354.
35. Clarke LP, Nordstrom RJ, Zhang H, et al. The quantitative imaging network:
NCI’s historical perspective and planned goals. Transl Oncol. 2014;7:1–4.
1328 THE JOURNAL OF NUCLEAR MEDICINE • Vol. 59 • No. 8 • August 2018
by INSERM DISC-IST on August 27, 2018. For personal use only. jnm.snmjournals.org Downloaded from

Doi: 10.2967/jnumed.117.199935Published online: January 4, 2018.
2018;59:1321-1328.J Nucl Med. Michaël Soussan, Frédérique Frouin, Vincent Frouin and Irène BuvatFanny Orlhac, Sarah Boughdad, Cathy Philippe, Hugo Stalla-Bourdillon, Christophe Nioche, Laurence Champion, PETA Postreconstruction Harmonization Method for Multicenter Radiomic Studies in
http://jnm.snmjournals.org/content/59/8/1321This article and updated information are available at:
http://jnm.snmjournals.org/site/subscriptions/online.xhtml
Information about subscriptions to JNM can be found at:
http://jnm.snmjournals.org/site/misc/permission.xhtmlInformation about reproducing figures, tables, or other portions of this article can be found online at:
(Print ISSN: 0161-5505, Online ISSN: 2159-662X)1850 Samuel Morse Drive, Reston, VA 20190.SNMMI | Society of Nuclear Medicine and Molecular Imaging
is published monthly.The Journal of Nuclear Medicine
© Copyright 2018 SNMMI; all rights reserved.
by INSERM DISC-IST on August 27, 2018. For personal use only. jnm.snmjournals.org Downloaded from