Embed Size (px)
Citation preview
i
A REVIEW OF
TRANSPORTATION RELATED
BENEFIT / COST ANALYSES:
THEORY &
BEST PRACTICES
AN ASSESSMENT OF
RECENT STUDIES
K. Eric Wolfe Chief Economist
National Ocean Service National Oceanic and Atmospheric Administration
July 1, 2011
ii
EXECUTIVE SUMMARY
On two occasions, I have been asked [by members of Parliament], "Pray, Mr. Babbage, if you put into the machine wrong figures, will the right answers come out?" I am not able rightly to apprehend the kind of confusion of ideas that could provoke such a question.
- Charles Babbage (1791-1871), mathematician and inventor of the Difference Engine
President Obama, beginning with his inaugural address, has stressed transparency and the
need to develop and display of “report cards” to assess progress and identify areas for
improvement in addition to calling for a government-wide effort to double exports in the next
five years. Through proactive maintenance of channels and harbors accomplished by
development of timely, accurate and complete quantification and qualification of benefits and
associated costs, these goals can be attained.
In an attempt to estimate global benefits derived from nautical hardcopy and electronic
versions of nautical charting, studies have often focused on a microeconomic issue or series of
events and in turn expanded those findings to estimate nationwide savings. The results of these
studies have sometimes fallen short of their goals owing to questionable assumptions which
could not be generalized to the population as a whole.
Before existing studies could be evaluated in this analysis, a literature review was
undertaken in order to identify what can be considered “best practices” in developing
transportation benefit-cost evaluations for both market and non-market based benefits. From this
research, a group of transportation-related benefit-cost studies were reviewed and summarized
with respect to these best practices and a check-list was developed which identifies those
considerations which should be considered in performing such analyses. In addition, these
studies are evaluated as to their relative importance in an overall transportation system.
iii
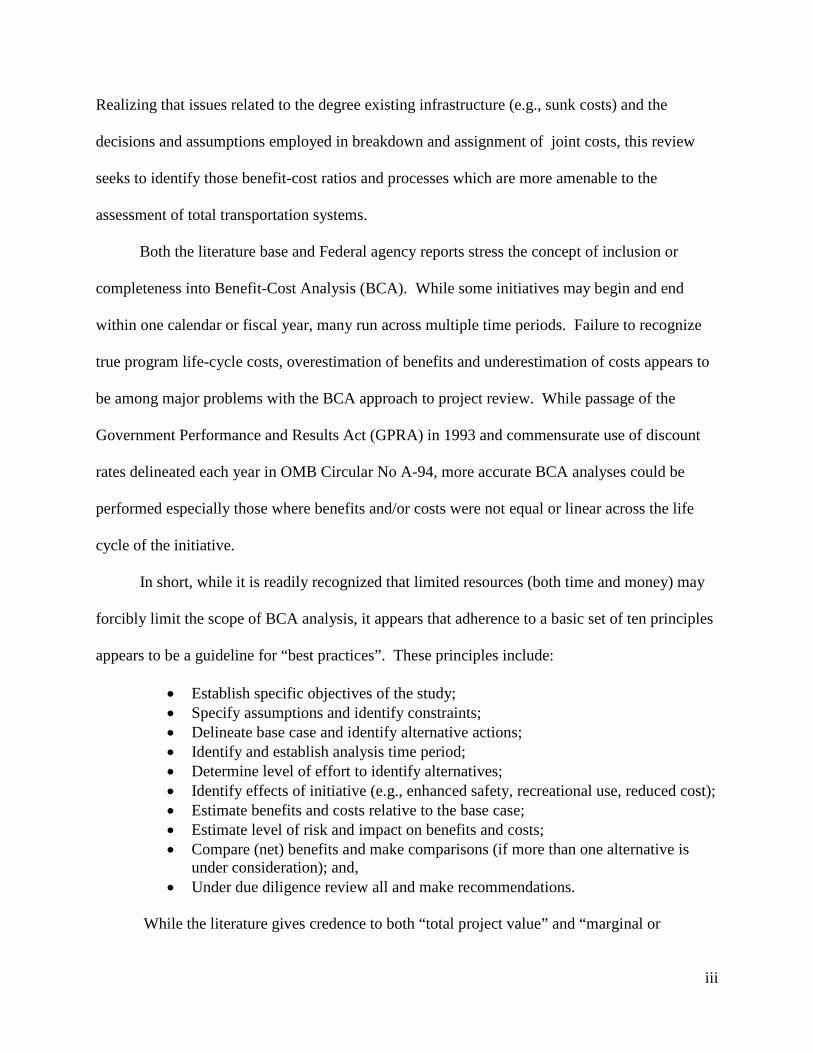
Realizing that issues related to the degree existing infrastructure (e.g., sunk costs) and the
decisions and assumptions employed in breakdown and assignment of joint costs, this review
seeks to identify those benefit-cost ratios and processes which are more amenable to the
assessment of total transportation systems.
Both the literature base and Federal agency reports stress the concept of inclusion or
completeness into Benefit-Cost Analysis (BCA). While some initiatives may begin and end
within one calendar or fiscal year, many run across multiple time periods. Failure to recognize
true program life-cycle costs, overestimation of benefits and underestimation of costs appears to
be among major problems with the BCA approach to project review. While passage of the
Government Performance and Results Act (GPRA) in 1993 and commensurate use of discount
rates delineated each year in OMB Circular No A-94, more accurate BCA analyses could be
performed especially those where benefits and/or costs were not equal or linear across the life
cycle of the initiative.
In short, while it is readily recognized that limited resources (both time and money) may
forcibly limit the scope of BCA analysis, it appears that adherence to a basic set of ten principles
appears to be a guideline for “best practices”. These principles include:
• Establish specific objectives of the study; • Specify assumptions and identify constraints; • Delineate base case and identify alternative actions; • Identify and establish analysis time period; • Determine level of effort to identify alternatives; • Identify effects of initiative (e.g., enhanced safety, recreational use, reduced cost); • Estimate benefits and costs relative to the base case; • Estimate level of risk and impact on benefits and costs; • Compare (net) benefits and make comparisons (if more than one alternative is
under consideration); and, • Under due diligence review all and make recommendations.
While the literature gives credence to both “total project value” and “marginal or

iv
incremental value analysis”, the more costs and benefits (both market and non-market) that can
be identified along with secondary “multiplier” effects across the life cycle of the initiative, the
greater the chance is for the work to accurately estimate BCAs. Critical to this, whatever method
is chosen, is application of due diligence in assessing benefits and costs.
v
TABLE OF CONTENTS
Page
Executive Summary ........................................................................................................... ii
Table of Contents ................................................................................................................v
List of Tables ................................................................................................................... viii
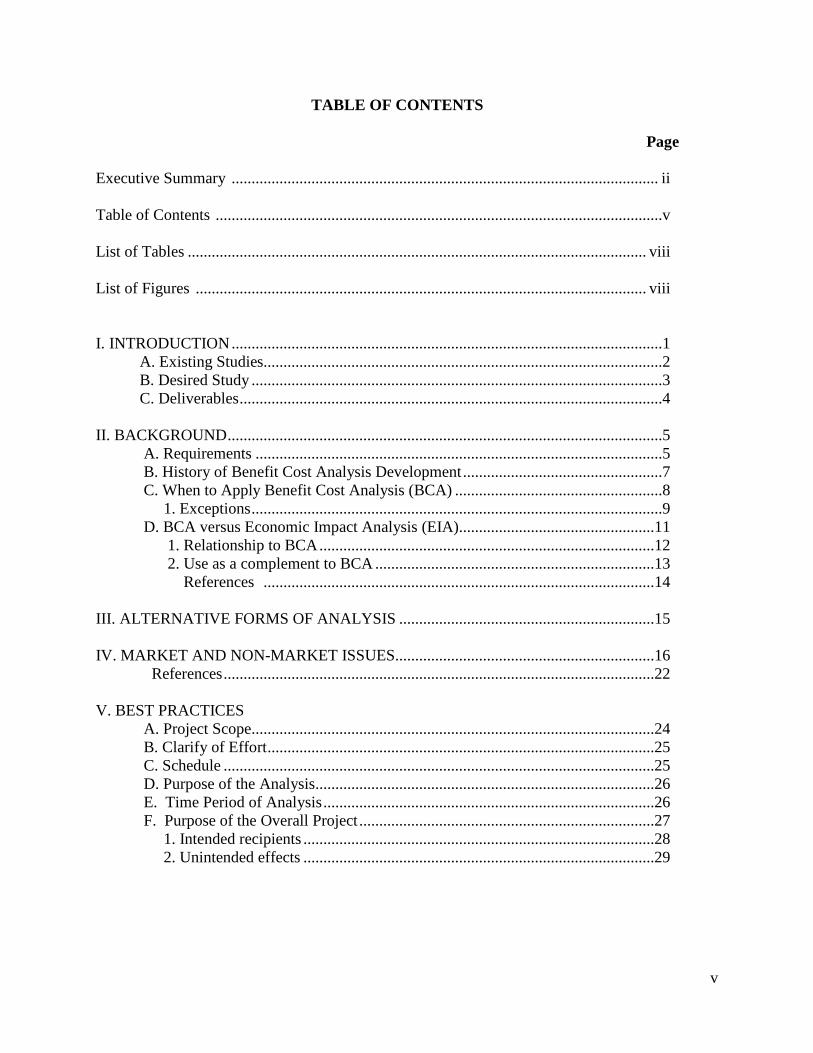
List of Figures ................................................................................................................. viii I. INTRODUCTION ............................................................................................................1 A. Existing Studies....................................................................................................2 B. Desired Study .......................................................................................................3 C. Deliverables ..........................................................................................................4 II. BACKGROUND .............................................................................................................5 A. Requirements ......................................................................................................5 B. History of Benefit Cost Analysis Development ..................................................7 C. When to Apply Benefit Cost Analysis (BCA) ....................................................8 1. Exceptions .......................................................................................................9 D. BCA versus Economic Impact Analysis (EIA).................................................11 1. Relationship to BCA ....................................................................................12 2. Use as a complement to BCA ......................................................................13 References ..................................................................................................14 III. ALTERNATIVE FORMS OF ANALYSIS ................................................................15 IV. MARKET AND NON-MARKET ISSUES.................................................................16 References ............................................................................................................22 V. BEST PRACTICES A. Project Scope.....................................................................................................24 B. Clarify of Effort .................................................................................................25 C. Schedule ............................................................................................................25 D. Purpose of the Analysis.....................................................................................26
E. Time Period of Analysis ...................................................................................26 F. Purpose of the Overall Project ..........................................................................27 1. Intended recipients ........................................................................................28 2. Unintended effects ........................................................................................29
vi
TABLE OF CONTENTS
Page
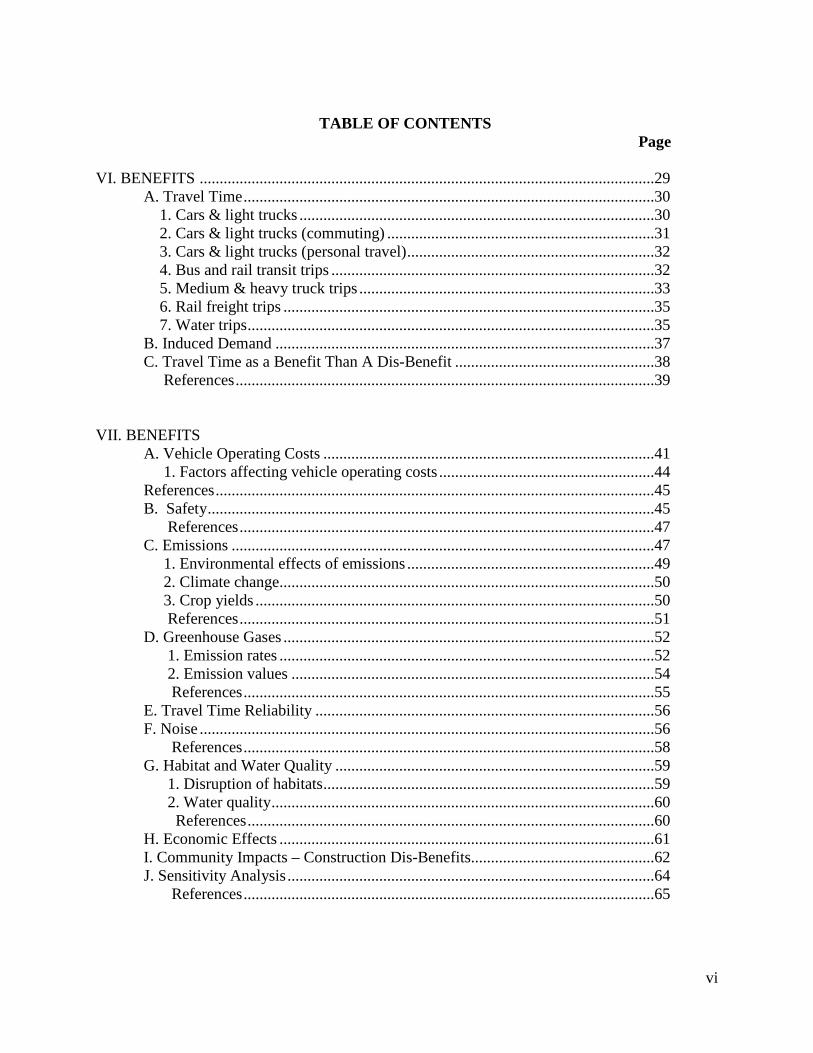
VI. BENEFITS ..................................................................................................................29 A. Travel Time .......................................................................................................30 1. Cars & light trucks .........................................................................................30 2. Cars & light trucks (commuting) ...................................................................31 3. Cars & light trucks (personal travel) ..............................................................32 4. Bus and rail transit trips .................................................................................32 5. Medium & heavy truck trips ..........................................................................33 6. Rail freight trips .............................................................................................35 7. Water trips ......................................................................................................35 B. Induced Demand ...............................................................................................37 C. Travel Time as a Benefit Than A Dis-Benefit ..................................................38 References .........................................................................................................39
VII. BENEFITS A. Vehicle Operating Costs ...................................................................................41 1. Factors affecting vehicle operating costs ......................................................44 References ..............................................................................................................45 B. Safety ................................................................................................................45 References ........................................................................................................47 C. Emissions ..........................................................................................................47 1. Environmental effects of emissions ..............................................................49 2. Climate change..............................................................................................50 3. Crop yields ....................................................................................................50 References ........................................................................................................51 D. Greenhouse Gases .............................................................................................52 1. Emission rates ..............................................................................................52 2. Emission values ...........................................................................................54 References .......................................................................................................55 E. Travel Time Reliability .....................................................................................56 F. Noise ..................................................................................................................56 References .......................................................................................................58 G. Habitat and Water Quality ................................................................................59 1. Disruption of habitats ...................................................................................59 2. Water quality ................................................................................................60 References ......................................................................................................60 H. Economic Effects ..............................................................................................61 I. Community Impacts – Construction Dis-Benefits..............................................62 J. Sensitivity Analysis ............................................................................................64 References .......................................................................................................65
vii
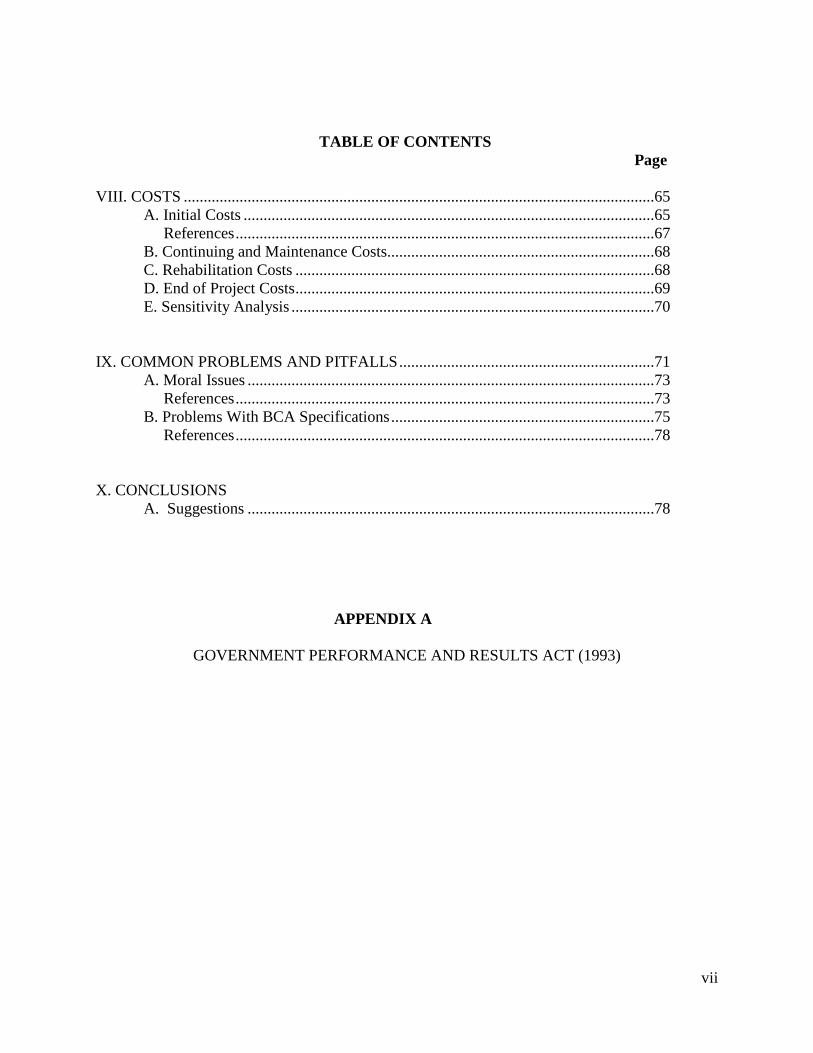
TABLE OF CONTENTS Page
VIII. COSTS ......................................................................................................................65 A. Initial Costs .......................................................................................................65 References .........................................................................................................67 B. Continuing and Maintenance Costs...................................................................68 C. Rehabilitation Costs ..........................................................................................68 D. End of Project Costs ..........................................................................................69 E. Sensitivity Analysis ...........................................................................................70
IX. COMMON PROBLEMS AND PITFALLS ................................................................71 A. Moral Issues ......................................................................................................73 References .........................................................................................................73 B. Problems With BCA Specifications ..................................................................75 References .........................................................................................................78
X. CONCLUSIONS A. Suggestions ......................................................................................................78
APPENDIX A
GOVERNMENT PERFORMANCE AND RESULTS ACT (1993)
viii
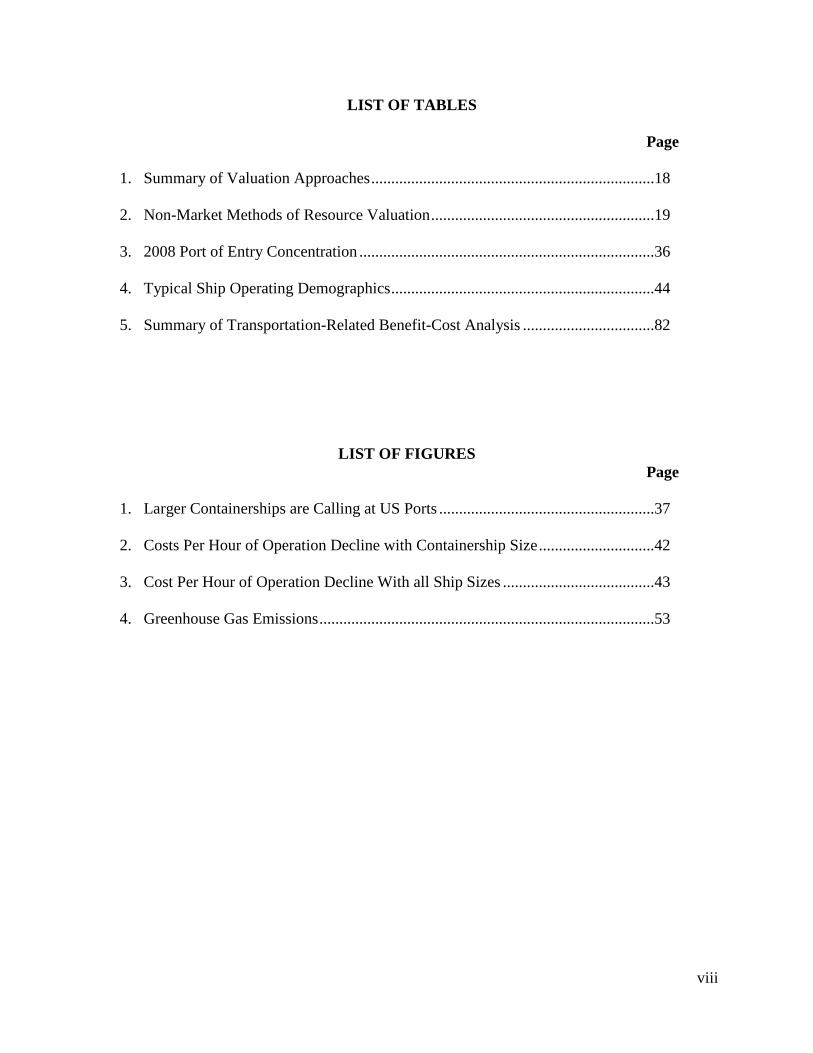
LIST OF TABLES
Page
1. Summary of Valuation Approaches .......................................................................18
2. Non-Market Methods of Resource Valuation ........................................................19
3. 2008 Port of Entry Concentration ..........................................................................36
4. Typical Ship Operating Demographics ..................................................................44
5. Summary of Transportation-Related Benefit-Cost Analysis .................................82
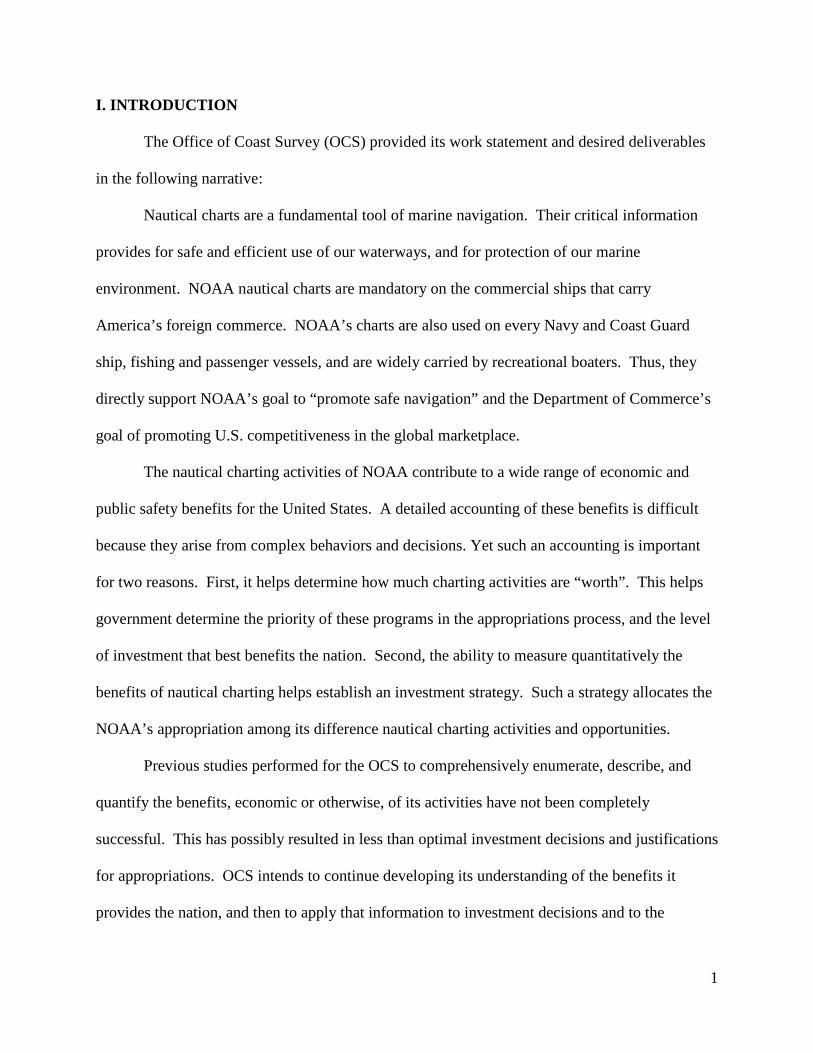
LIST OF FIGURES Page
1. Larger Containerships are Calling at US Ports ......................................................37
2. Costs Per Hour of Operation Decline with Containership Size .............................42
3. Cost Per Hour of Operation Decline With all Ship Sizes ......................................43
4. Greenhouse Gas Emissions ....................................................................................53
1
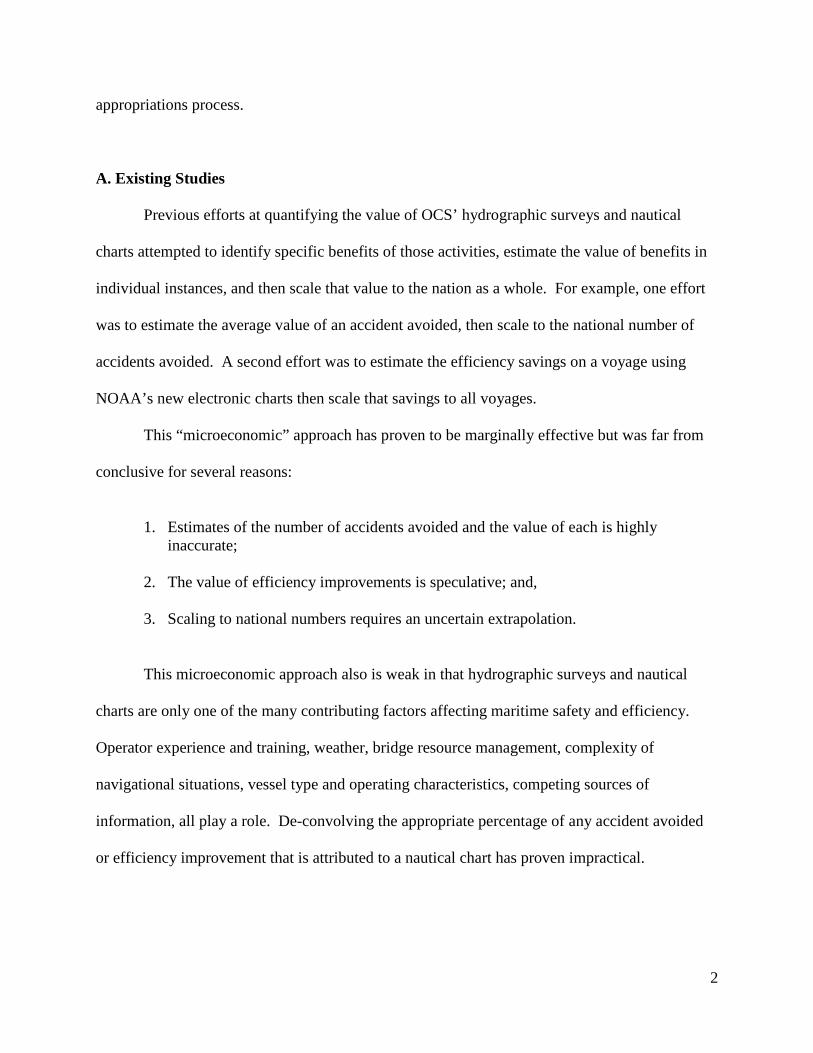
I. INTRODUCTION
The Office of Coast Survey (OCS) provided its work statement and desired deliverables
in the following narrative:
Nautical charts are a fundamental tool of marine navigation. Their critical information
provides for safe and efficient use of our waterways, and for protection of our marine
environment. NOAA nautical charts are mandatory on the commercial ships that carry
America’s foreign commerce. NOAA’s charts are also used on every Navy and Coast Guard
ship, fishing and passenger vessels, and are widely carried by recreational boaters. Thus, they
directly support NOAA’s goal to “promote safe navigation” and the Department of Commerce’s
goal of promoting U.S. competitiveness in the global marketplace.
The nautical charting activities of NOAA contribute to a wide range of economic and
public safety benefits for the United States. A detailed accounting of these benefits is difficult
because they arise from complex behaviors and decisions. Yet such an accounting is important
for two reasons. First, it helps determine how much charting activities are “worth”. This helps
government determine the priority of these programs in the appropriations process, and the level
of investment that best benefits the nation. Second, the ability to measure quantitatively the
benefits of nautical charting helps establish an investment strategy. Such a strategy allocates the
NOAA’s appropriation among its difference nautical charting activities and opportunities.
Previous studies performed for the OCS to comprehensively enumerate, describe, and
quantify the benefits, economic or otherwise, of its activities have not been completely
successful. This has possibly resulted in less than optimal investment decisions and justifications
for appropriations. OCS intends to continue developing its understanding of the benefits it
provides the nation, and then to apply that information to investment decisions and to the
2
appropriations process.
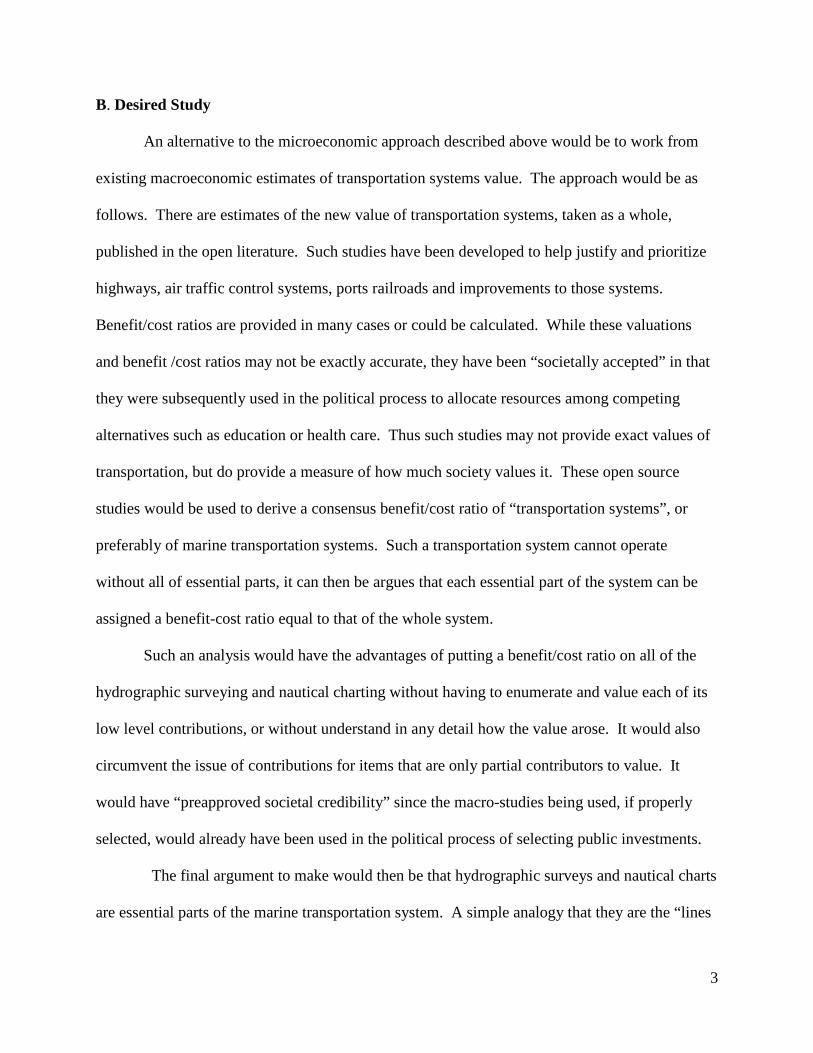
A. Existing Studies
Previous efforts at quantifying the value of OCS’ hydrographic surveys and nautical
charts attempted to identify specific benefits of those activities, estimate the value of benefits in
individual instances, and then scale that value to the nation as a whole. For example, one effort
was to estimate the average value of an accident avoided, then scale to the national number of
accidents avoided. A second effort was to estimate the efficiency savings on a voyage using
NOAA’s new electronic charts then scale that savings to all voyages.
This “microeconomic” approach has proven to be marginally effective but was far from
conclusive for several reasons:
1. Estimates of the number of accidents avoided and the value of each is highly inaccurate;
2. The value of efficiency improvements is speculative; and,
3. Scaling to national numbers requires an uncertain extrapolation.
This microeconomic approach also is weak in that hydrographic surveys and nautical
charts are only one of the many contributing factors affecting maritime safety and efficiency.
Operator experience and training, weather, bridge resource management, complexity of
navigational situations, vessel type and operating characteristics, competing sources of
information, all play a role. De-convolving the appropriate percentage of any accident avoided
or efficiency improvement that is attributed to a nautical chart has proven impractical.
3
B. Desired Study
An alternative to the microeconomic approach described above would be to work from
existing macroeconomic estimates of transportation systems value. The approach would be as
follows. There are estimates of the new value of transportation systems, taken as a whole,
published in the open literature. Such studies have been developed to help justify and prioritize
highways, air traffic control systems, ports railroads and improvements to those systems.
Benefit/cost ratios are provided in many cases or could be calculated. While these valuations
and benefit /cost ratios may not be exactly accurate, they have been “societally accepted” in that
they were subsequently used in the political process to allocate resources among competing
alternatives such as education or health care. Thus such studies may not provide exact values of
transportation, but do provide a measure of how much society values it. These open source
studies would be used to derive a consensus benefit/cost ratio of “transportation systems”, or
preferably of marine transportation systems. Such a transportation system cannot operate
without all of essential parts, it can then be argues that each essential part of the system can be
assigned a benefit-cost ratio equal to that of the whole system.
Such an analysis would have the advantages of putting a benefit/cost ratio on all of the
hydrographic surveying and nautical charting without having to enumerate and value each of its
low level contributions, or without understand in any detail how the value arose. It would also
circumvent the issue of contributions for items that are only partial contributors to value. It
would have “preapproved societal credibility” since the macro-studies being used, if properly
selected, would already have been used in the political process of selecting public investments.
The final argument to make would then be that hydrographic surveys and nautical charts
are essential parts of the marine transportation system. A simple analogy that they are the “lines
4
and signs” of the marine highway, or provide the same critical contribution as air transport
control could be sufficient.
C. Deliverables
A study which includes the following is desired:
1. Perform a literature search of macro-valuations of U.S Transportation systems including both textbook and peer-reviewed literature. Identify credible studies that would be applicable to valuing transportation systems and would be applicable to the macroeconomic valuation approach defined herein. 2. Analyze each study as to why it applies to the problem here, what caveats need to be applied in order to include their results, the credibility of each study.
3. Enumerate the cost/benefit ratios, or other appropriate measures of value, for each study. Analyze the different estimates and consolidate them into a single statement of benefit or benefit/cost that may be applied to any transportation system, or at least to the marine transportation system. 4. Consolidate form the studies what can be counted as “essential” to a system or what criteria to apply to ascertain essentiality. For example, a piece of a system that is represented in every instance of a system could be declared as “essential”. Likewise, the fore part of the system, such as the paced roads in a land transportation system would be considered essential. Apply the criteria to hydrographic surveying and nautical charting as a component of the marine transportation system and determine its essentiality. 5. Accumulate from each study any lessons learned that could be applied to the marine transportation system or to surveys and charts. For example, some highway valuation studies have concluded that highways selected for investment at a local level produce higher benefit/cost rations that those selected by higher levels of government. A second lesson learned might be how to set the saturation point of an investment, (e.g., when more “lines and signs” would produce no further value. 6. Conclude with statements on the validity of the analysis, its strengths and weaknesses of the method, and suggestions for future work.
5
II. BACKGROUND In order to respond to these desired requests, and to provide an improved commonality of understanding, that brief review of Benefit/Cost Analysis (BCA) is in order. A. Requirements
“The question we ask today is not whether our government is too big or too small, but whether it works - whether it helps families find jobs at a decent wage, care they can afford, a retirement that is dignified. Where the answer is yes, we intend to move forward. Where the answer is no, programs will end. And those of us who manage the public's dollars will be held to account - to spend wisely, reform bad habits, and do our business in the light of day - because only then can we restore the vital trust between a people and their government.”
President Barack Obama Inaugural Address January 20, 2009
Every administration since President Kennedy's (if not before) has sought to oversee and
assess the economic consequences of its (regulatory) actions. Sometimes this oversight has taken
the form of special commissions or review groups. More recently, such responsibilities have
been lodged on a continuing basis in the Office of Information and Regulatory Affairs (OIRA) of
the Office of Management and Budget (OMB).
To help the agencies to consider economic consequences and to guide OMB in its
reviews, presidents from Jimmy Carter on have issued executive orders on this topic. Executive
Order 12291, signed by President Reagan in 1981, was the first to codify requirements for
agencies to evaluate the benefits and costs of regulations under OMB oversight and to show that
6
the benefits of a proposed regulation outweigh its costs.1 In response, OMB issued guidelines
that detail how the provisions of the executive order are to be carried out.
President Clinton's Executive Order (E.O.) 12866 superseded the Reagan executive order,
replacing the "outweigh" criterion with a more complex set of decision criteria. Nevertheless, the
Clinton order still endorsed CBA as a tool for helping to choose among alternative regulatory
(and non-regulatory) options. Under Section 1(a) of E.O. 12866, agencies are to:
"include both quantifiable measures (to the fullest extent that these can be usefully estimated) and qualitative measures of costs and benefits that are difficult to quantify, but nevertheless essential to consider. Agencies should select those approaches that maximize net benefits (including potential economic, environmental, public health, and safety, and other advantages; distributive impacts; and equity), unless a statute requires another regulatory approach." Section 1(b) (6) of the order directs agencies, to the extent permitted by law and where applicable, to choose regulations whose benefits "justify" their costs, recognizing the difficulty of quantifying important benefits and costs. Section 1(b) (5) requires agencies to seek cost- effective policies. Section 1(b) (7) requires decisions to reflect the best reasonably obtainable information. In the wake of E.O. 12866, OMB has revised its guidelines on regulatory analysis to reflect both the modification of the decision criteria in the Clinton order and advances in
economic analysis since the Reagan guidance was established. The guidelines identify the key
basic steps that agencies must take in assessing regulatory actions.
The Government Performance and Results Act (GPRA) of 1993 was developed to shift the
focus of government decision making and accountability away from a preoccupation with the
process or activities that are undertaken, (e.g., grants dispensed or inspections made), to a focus
1 Past administrations have instituted processes and issued Executive Orders related to the costs and benefits of rules In particular, the Carter Administration issued Executive Order 12044 requiring agencies to perform regulatory impact analyses to analyze the “economic consequences” of alternative rules costing the economy more than $100 million per year (or causing major price increases) and to choose the least burdensome option.
7
on the results of those activities, such as real gains in employability, safety, responsiveness, or
program quality. Under GPRA, agencies are to develop multiyear strategic plans, annual
performance plans, and annual performance reports.2 A complete version of GPRA is provided
in Appendix A.
B. History of Benefit Cost Analysis Development
The idea of this economic accounting originated with Jules Dupuit, a French engineer
whose 1848 article is still applicable.3 The British economist, Alfred Marshall, formulated some
of the formal concepts that are at the foundation of BCA. Domestically, BCA has its origins
with the French engineers hired by George Washington and later in the water development
projects of the U.S. Army Corps of Engineers (USACE). For years the only school of
engineering in the United States was the Military Academy at West Point, New York. In 1879,
Congress created the Mississippi River Commission (Commission) to "prevent destructive
floods." The Commission included civilians but the president had to be an Army engineer and
the Corps of Engineers always had veto power over any decision by the Commission.
In 1936 Congress passed the Flood Control Act which contained the wording, "the
Federal Government should improve or participate in the improvement of navigable waters or
2 See: http://www.gao.gov/new.items/gpra/gpra.htm. One Hundred Third Congress of the United States of America AT THE FIRST SESSION Begun and held at the City of Washington on Tuesday, the fifth day of January, one thousand nine hundred and ninety-three. An Act To provide for the establishment of strategic planning and performance measurement in the Federal Government, and for other purposes. Be it enacted by the Senate and House.
3 Dupuit, Arsène Jules Étienne Juvénal (1844): De la mesure de l’utilité des travaux publics, Annales des ponts et chaussées, Second series, 8. (Translated by R.H. Barback as On the measurement of the utility of public works, International Economic Papers, 1952, 2, 83-110; reprinted in: Kenneth J. Arrow and Tibor Scitovsky, eds., Readings in welfare economics (Richard D. Irwin, Homewood, IL, 1969), 255-283.
8
their tributaries, including watersheds thereof, for flood-control purposes if the benefits to
whomsoever they may accrue are in excess of the estimated costs." Initially the USACE
developed ad hoc methods for estimating benefits and costs. It wasn't until the 1950s that
academic economists discovered that the USACE had developed a system for the economic
analysis of public investments. Economists have influenced and improved the USACE's methods
since then and cost-benefit analysis has been adapted to most areas of public decision-making.
C. When To Apply Benefit Cost Analysis
The United States Department of Transportation (DOT) provides a series of guidelines for when and where benefit-cost analysis should be employed.4 BCA Analysis is most
applicable for evaluating proposed projects that meet the following criteria: (1) The potential project expenditure is significant enough to justify spending resources on forecasting, measuring and evaluating the expected benefits and impacts. (2) The project motivation is to improve the transportation system's efficiency at serving travel and access-related needs, rather than to meet some legal requirement or social goal. (3) Environmental or social impacts that are outside of the transportation system efficiency measurement are either: (a) negligible in magnitude, (b) measurable in ways that can be used within the benefit-cost framework, or (c) to be considered by some other form of project appraisal outside of the benefit-cost analysis. BCA is neither necessary nor desirable to justify all transportation projects. It may not always be appropriate in the following cases:
• Projects motivated by a need to meet legal requirements (e.g., such as safety standards, handicapped access standards or environmental impact standards). Changes in population growth, urban development, travel patterns or legal regulations may necessitate new projects to upgrade existing transportation facilities and services, build new facilities or provide new services to meet those current legally required standards.
• Projects motivated primarily by a need to address distributional equity concerns (i.e., legal, political or moral desires for fairness). This includes the provision of some minimum level of basic (road, transit, air or sea) access for isolated or ill-served
4 Refer to http://bca.transportationeconomics.org
9
regions, communities or neighborhoods. It can also include some projects motivated by economic development,(i.e., enabling the attraction and creation of new jobs particularly in economically depressed areas.) Finally, some decisions are based on the desire (and in some cases, the legal need) to avoid selection of projects and project designs that focus undue negative impact on socially vulnerable groups (such as low income, elderly, or minority groups)
• Projects that are merely maintaining, renovating or rehabilitating already-built transportation facilities, which are necessary to avoid losing the already-demonstrated benefits of those existing facilities (unless there are viable alternatives present)
It is also inappropriate to rely solely on BCA in situations where there are special
concerns that must also be considered outside of that analysis. Since benefit-cost analysis focuses
on the comparison of total benefits and total costs in dollar terms, some particular concerns
affecting a given project may be either hidden or missed within the calculation of total benefits
and total costs. In some cases, the desirability of projects needs to be considered in terms of their
effectiveness at reducing certain key objectives — such as air pollution reduction, creation of
new jobs, or providing access for low-income households who do not own a car. In such cases,
cost-effectiveness analysis (which measures environmental or social benefits per dollar of
transportation project spending) may be appropriate, either in addition to or instead of BCA.
1. Exceptions
Benefit-Cost Analysis is most applicable for evaluating proposed projects that meet the
following criteria:5
• The potential project expenditure is significant enough to justify spending resources on forecasting, measuring and evaluating the expected benefits and impacts.
5 See: http://bca.transportationeconomics.org/home/when-to-use-benefit-cost-analysis
10
• The project motivation is to improve the transportation system's efficiency at serving
travel, commerce and access-related needs, rather than to meet some legal requirement or social goal.
At the same time BCA is neither necessary nor desirable to justify all transportation or commerce-related projects. It may not always be appropriate in the following cases:
• Projects motivated by a need to meet legal requirements (e.g., such as safety standards, handicapped access standards or environmental impact standards). Changes in population growth, urban development, travel patterns or legal regulations may necessitate new projects to upgrade existing transportation facilities and services, build new facilities or provide new services to meet those current legally required standards.
• Projects motivated primarily by a need to address distributional equity concerns (e.g., i.e., legal, political or moral desires for fairness). This includes the provision of some minimum level of basic (road, transit, air or sea) access for isolated or ill-served regions, communities or neighborhoods. It can also include some projects motivated by economic development, i.e., enabling the attraction and creation of new jobs particularly in economically depressed areas. Some decisions are based on the desire (and in some cases, the legal need) to avoid selection of projects and project designs that focus undue negative impact on socially vulnerable groups (such as low income, elderly, or minority groups). The concept of “captive shippers” with limited access to transportation alternatives also falls here.
• Projects that are merely maintaining, renovating or rehabilitating already-built transportation or commerce facilities, which are necessary to avoid losing the already-demonstrated benefits of those existing facilities (unless there are viable alternatives present)
It is also inappropriate to rely solely on BCA in situations where there are special
concerns that must also be considered outside of that analysis. Since benefit-cost analysis focuses
on the comparison of total benefits and total costs in dollar terms, some particular concerns
affecting a given project may be either hidden or missed within the calculation of total benefits
and total costs. In some cases, the desirability of projects needs to be considered in terms of their
effectiveness at reducing certain key objectives (e.g., air pollution reduction, creation of new
11
jobs, or providing access for low-income households who do not own a car). In such cases, cost-
effectiveness analysis (which measures environmental or social benefits per dollar of
transportation project spending) may be appropriate, either in addition to or instead of benefit-
cost analysis.
D. BCA Versus Economic Impact Analysis (EIA) Economic impacts are the effects that an initiative has on the economy of a designated physicality or assessment area, which are measured in terms of the change in local business output, jobs, income, or tax revenue. These effects are sometimes referred to as "economic development benefits" or "dis-benefits" if the effects are negative. Examples include:
• A new highway connection makes it possible for a rural region to attract new industry, creating jobs and tax revenue.
• Eliminating size or weight restrictions for a river crossing, airport, or marine port allows local business to expand shipping facilities, creating new jobs and tax revenue.
• Expanded transit service to a low-income residential area increases residents' access to jobs, reducing unemployment, increasing income levels, and creating tax revenue.
• A new highway interchange makes a decrepit, abandoned industrial area more accessible and hence more attractive for office or industrial park redevelopment, leading to higher tax revenues.
• Additional water-depth sensors which facilitate deeper draft ships than nominal channel depths would indicate fosters additional warehouse construction and hence the need for additional construction jobs, associated building permits, inspections, etc.
The "economic impact" of a project is usually viewed in terms of how the project affects
an area's economic development — which means how it affects jobs and income for the area's
residents. The primary means of economic development are business startup, expansion,
attraction, and retention. A related concept is the "fiscal impact" of a project, which refers to how
it affects local government revenues.
12
1. Relationship to BCA
Economic impacts are not included in benefit-cost analysis. Economic development
impacts occur as the end result of direct impacts of a transportation or commerce project on
shippers, travelers, non-travelers. A transportation project may improve local business
competitiveness (and hence economic growth) by reducing existing transportation costs (for
employees and freight), expanding markets for business sales and services (providing more
revenue with economies of scale in operations), and expanding labor market access (providing
access to a broader job base). A transportation project may also affect economic growth by
saving money for area residents (increasing available income to spend elsewhere in the
economy) or by improving the attractiveness of the area as a place for people to live and locate
their business activities.
EIA differs from transportation or commerce system benefit-cost analysis in the following
ways:
• Economic impact analysis focuses on income benefits to residents and businesses located in a given study area, while transportation or commerce system benefits are measured in terms of savings for all users of certain transportation facilities. The extent of economic development effects can be radically different depending on whether the study area is a neighborhood, city, metropolitan area, state, or nation.
• Economic impact analysis is a broader measure of benefit because it recognizes not only economic growth benefits associated with direct cost savings and income generation benefits for transportation or commerce system users, but also economic growth associated with expanding accessibility to markets. It also reflects additional economic growth associated with indirect benefits for an area (such as benefits to business suppliers and re-spending income generated as a result of the project), even though some of that growth may be shifted from elsewhere.
13
Another form of economic impact, economies of agglomeration was detailed by Shefer
and Aviram (2005).6 This concept, often used in urban economics to describe the benefits that
firms or other infrastructures obtain when locating near each other ('agglomerating'), can be
especially applicable to transportation-related projects. This concept relates to the idea of
economies of scale and network effects. Simply put, as more firms in related industries cluster
together, costs of production may decline significantly (firms have competing multiple suppliers,
greater specialization and division of labor result). Even when multiple firms in the same sector
(competitors) cluster, there may be advantages because that cluster attracts more suppliers and
customers than a single firm could alone. Cities form and grow to exploit economies of
agglomeration.
2. Use as a complement to BCA
Transportation planning agencies are often interested in assessing economic impacts (in
addition to conducting benefit/cost analysis), because they can indicate how well a project
addresses three types of societal goals:
• Economic impacts reflect how transportation improvements lead to tangible benefits for constituents of a government agency, who are generally residents of a particular city, metro area, county or state. This helps avoid the situation where residents of one area pay the full cost for a project that benefits only residents of another area.
• Economic impacts reflect productivity benefits; not only those associated with reducing costs for existing travel patterns, but also those associated with expanding accessibility to broader product distribution, service, and labor markets. Increased market access can provide further productivity benefits related to "economies of scale" in business operations. It is sometimes erroneously stated that shifts in business location and growth
6 Shefer, Daniel and Aviram, Haim,” Incorporating agglomeration economies in transport cost-benefit analysis: The case of the proposed light-rail transit in the Tel-Aviv metropolitan area”, Papers in Regional Science, Volume 84, Number 3, August 2005 , pp. 487-508(22)
14
patterns are a "zero sum game." Actually, business activity shifts would not usually occur unless there were at least some productivity benefits to justify the costs of relocating economic activity.
• Economic impacts can also show movement towards addressing social equity goals --insofar as improved accessibility and redistribution of future business growth can also help to reduce disparities in job access and income levels and quality of life issues (e.g., less pollution, noise, etc.) between rich and poor areas, or between urban and rural areas.
Since economic impacts are a consequence of travel time and cost savings, it would be "double counting" to add economic impacts to transportation user benefits for the same trips. So while a transportation agency may be interested in both measures of a project's impact, due diligence must exercised to avoid double counting when reporting overall project benefits. References: Chapman, P. and J. Stephens (2003), The Economic Impacts of Transport Projects: Developing Guidence in the UK. UK Dept. of the Environment, Transport and the Regions. See:http://www.marshall.edu/ati/tech/PortlandConference/updatedPDFs/Portland_Chapman.pdf.
Economic Development Research Group. "Transportation and Economic Development." See: http://www.edrgroup.com/edr1/library/lib_trans.
Forkenbrock, D., and G. Weisbrod , (2001). Guidebook for Assessing the Social and Economic Effects of Transportation Projects. Transportation Research Board NCHRP Report 456, Washington, D.C., National Academy Press, See: http://gulliver.trb.org/publications/nchrp/nchrp_rpt_456-a.pdf and http://gulliver.trb.org/publications/nchrp/nchrp_rpt_456-b.pdf
Simmonds, D. (1999) Analysis of Transport Schemes: Economic Impact Studies. UK Dept. of the Environment, Transport and the Regions. Standing Advisory Committee on Trunk Road Assessment. See: http://www.dft.gov.uk/stellent/groups/dft_transstrat/documents/page/dft_ transstrat_504939. pdf
Weisbrod, G. (2000), Current Practice for Assessing Economic Development Impacts from Transportation Projects. Transportation Research Board NCHRP Synthesis Report 290, National Academy Press, Washington, DC. See: http://www.edrgroup.com/edr1/library/ lib_trans_general/P038-synthesis-highway-econ.shtml
15
Weisbrod, G. and M. Grovak (1998 and 2001), "Comparing Approaches for Valuing Economic Development Benefits of Transportation Projects," Transportation Research Record 1649 Journal of the Transportation Research Board. (Updated version presented at Transport Association of Canada Benefit-Cost Symposium) See:http://www.edrgroup.com/pages/pdf/Comparing-Approaches.pdf
Wornum, C. et al. (1998), Economic Impact Analysis of Transit Investments: Guidebook for Practitioners. Transportation Research Board TCRP Report 35, National Academy Press, Washington D.C. See: http://gulliver.trb.org/publications/tcrp/tcrp_rpt_35.pdf
III. ALTERNATIVE FORMS OF ANALYSIS Besides BCA, there are a number of alternative methods of initiative valuation and prioritization. These include: (1) Net Present Value; (2) Cost Effectiveness; (3) Internal Rate of Return; and, (4) Payback Period. As the focus of this analysis is BCA and GRPA requirements, a brief mention of these methods while appropriate, was not as deeply developed. Net Present Value - The sum of discounted costs are subtracted from the sum of discounted benefits. Projects with positive net present value should be considered; the greater the net present value, the more justifiable the project. Cost Effectiveness - If a given budget is available, the optimal discounted benefits that can be achieved with that budget can be compared for alternative projects. On the other hand, if a given benefit is desired, the discounted costs required to achieve that benefit can be compared for alternative projects. This approach can be used even if the benefits cannot be monetized; an example would be cost per new transit rider or the cost to improve “beach quality”. Internal Rate of Return - The internal rate of return (IRR) is the discount rate for which the net present value of a project is zero. In other words, the sum of discounted costs is equal to the sum of discounted benefits when discounted by the IRR. This method is appropriate when there is only one alternative to the status quo. If the IRR is higher than the rate of return on alternative investments, then the project is a good investment. In some cases a minimum rate of return (called a hurdle rate) is used to determine which projects should be implemented. Payback Period – Simply, the period of time it would take for the cumulative discounted benefits to become equal to the cumulative discounted costs.
16
IV. MARKET AND NON-MARKET VALUATION
When benefits and costs associated with items that can be exchanged in the marketplace,
their value may be derived from the price which results in the willingness to exchange goods or
services for some monetary amount. While these valuations can change owing to a variety of
market conditions, they are relatively easy to identify. (Refer to Table 1)
On the other hand, non-market issues are those items that are not publically traded in a
traditional economic market. As they can be of extreme importance in BCA or other initiative
review and prioritization projects, it is important to review how they are commonly “valued”.
Although Willingness To Pay (WTP) is often seen as the optimum method to value non-
market assets, problems can arise regarding the ability to obtain highly accurate and specific
responses from customers as well as the time and costs associated with such data collection. In
place of a WTP methodology, use of a weighted proxy process suggested by King (1998) might
be considered. While situational differences may exist when comparing separate properties with
similar demographics, proxy and benefits transfer methodologies may be more efficient
measures to assess societal value. For example, the value of reduced accidents related to
recreational boating in one area might be transferred to another physical area on a per-use or
exposure basis.
Environment Canada (2005) provides a good summary of how valuation on wetlands can
be determined.7 Overall they review direct, indirect and proxy methods on non-market
valuation.8 (Refer to Table 2) Direct and indirect methods can provide more exact measurements
7 Although the overarching term wetlands is listed in the article, it also includes: aquatic bed, freshwater mixes, freshwater forested, freshwater emergent, freshwater tidal, salt marshes, mangroves, etc. 8 As most environmental goods and services are not traded in markets, traditional market forces of supply and demand are not present to identify value. Instead, economic value is determined by the customer’s WTP for these items. Without such WTP surveys, many environmental products and services could be undervalued and
17
while proxy methods can provide orders-of-magnitude or “ballpark” estimates. Benefits transfer
is often employed as a hybrid of the first three methods. Tradeoffs among the methods place
time and cost to perform the survey and the ability of the customer to comprehend and
appropriately value the item at hand against the overall granularity of the response.
Given sufficient amounts of time and money, detailed non-market estimations of value
may be calculated in a number of ways. As accuracy of customer/beneficiary responses is
critically linked to specific presentation of the survey questions, researchers have expressed
concerns regarding the overall accuracy of such methods (Refer to Arrow et. al 1993 and Carson
et. al 1996). Moreover, others (such as King 1998) have questioned if such surveys can be
successful owing to respondent limitations. For example in the valuation of wetlands, he states:
“Extremely convincing arguments can be made that it does not sense to try to assign economic values to wetlands using any of the three generally acceptable methods9 because: a) most important wetland services are not traded in markets so people cannot reveal the dollar value they place upon them; b) people do not know about or appreciate the many functions and services that wetlands provide and therefore not express that they are “willing to pay” as much as they should for wetlands; and c) wetlands generate so many diverse functions, services and products that the cost of tracing and measuring all of them to impute their economic value is prohibitive”10
King proposes that if an economic figure needs to be developed, costs to mitigate and
restore wetlands (for example), is the preferred method of valuation. He references two studies
(King 1994 and Berger 1997) which estimate the cost per acre to attempt wetland restoration.
stewardship decisions could be suboptimal for lack of such knowledge. 9 King refers to market forces (i.e., revealed willingness to pay) survey results (i.e., expressed willingness to pay) and derived willingness to pay (i.e., circumstantial evidence). . 10 Refer to King (page 8)
18
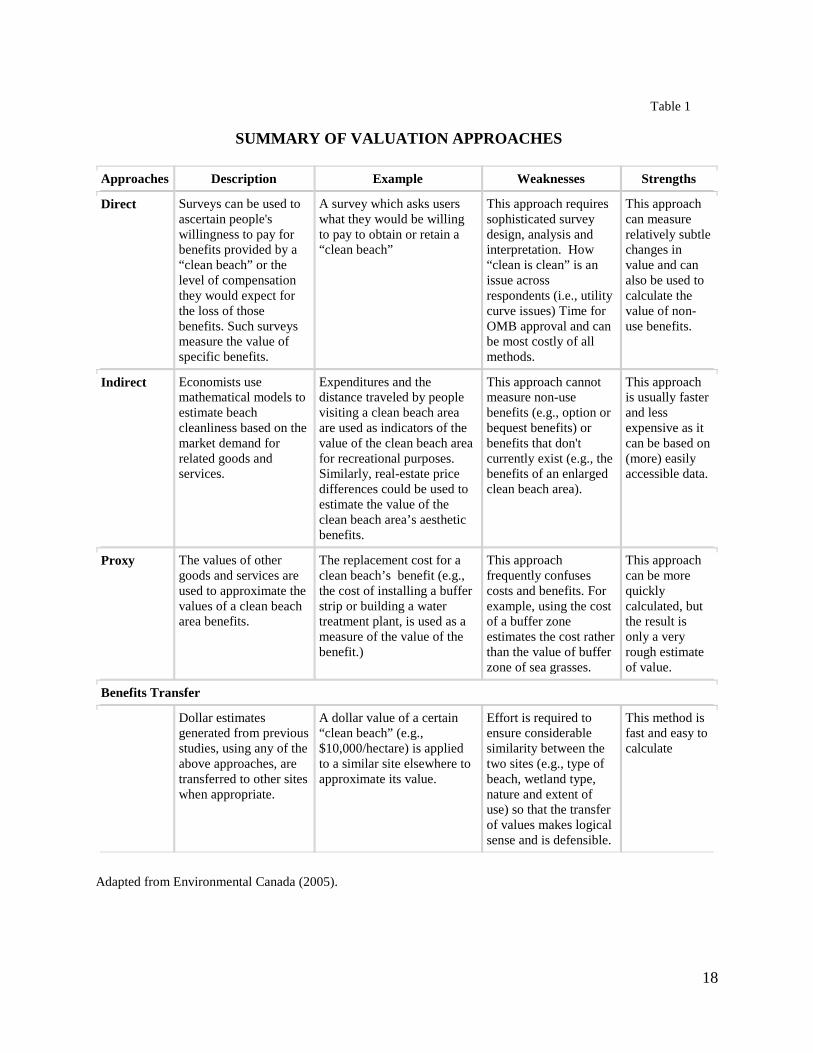
Table 1
SUMMARY OF VALUATION APPROACHES
Approaches Description Example Weaknesses Strengths
Direct Surveys can be used to ascertain people's willingness to pay for benefits provided by a “clean beach” or the level of compensation they would expect for the loss of those benefits. Such surveys measure the value of specific benefits.
A survey which asks users what they would be willing to pay to obtain or retain a “clean beach”
This approach requires sophisticated survey design, analysis and interpretation. How “clean is clean” is an issue across respondents (i.e., utility curve issues) Time for OMB approval and can be most costly of all methods.
This approach can measure relatively subtle changes in value and can also be used to calculate the value of non-use benefits.
Indirect Economists use mathematical models to estimate beach cleanliness based on the market demand for related goods and services.
Expenditures and the distance traveled by people visiting a clean beach area are used as indicators of the value of the clean beach area for recreational purposes. Similarly, real-estate price differences could be used to estimate the value of the clean beach area’s aesthetic benefits.
This approach cannot measure non-use benefits (e.g., option or bequest benefits) or benefits that don't currently exist (e.g., the benefits of an enlarged clean beach area).
This approach is usually faster and less expensive as it can be based on (more) easily accessible data.
Proxy The values of other goods and services are used to approximate the values of a clean beach area benefits.
The replacement cost for a clean beach’s benefit (e.g., the cost of installing a buffer strip or building a water treatment plant, is used as a measure of the value of the benefit.)
This approach frequently confuses costs and benefits. For example, using the cost of a buffer zone estimates the cost rather than the value of buffer zone of sea grasses.
This approach can be more quickly calculated, but the result is only a very rough estimate of value.
Benefits Transfer
Dollar estimates generated from previous studies, using any of the above approaches, are transferred to other sites when appropriate.
A dollar value of a certain “clean beach” (e.g., $10,000/hectare) is applied to a similar site elsewhere to approximate its value.
Effort is required to ensure considerable similarity between the two sites (e.g., type of beach, wetland type, nature and extent of use) so that the transfer of values makes logical sense and is defensible.
This method is fast and easy to calculate
Adapted from Environmental Canada (2005).
19
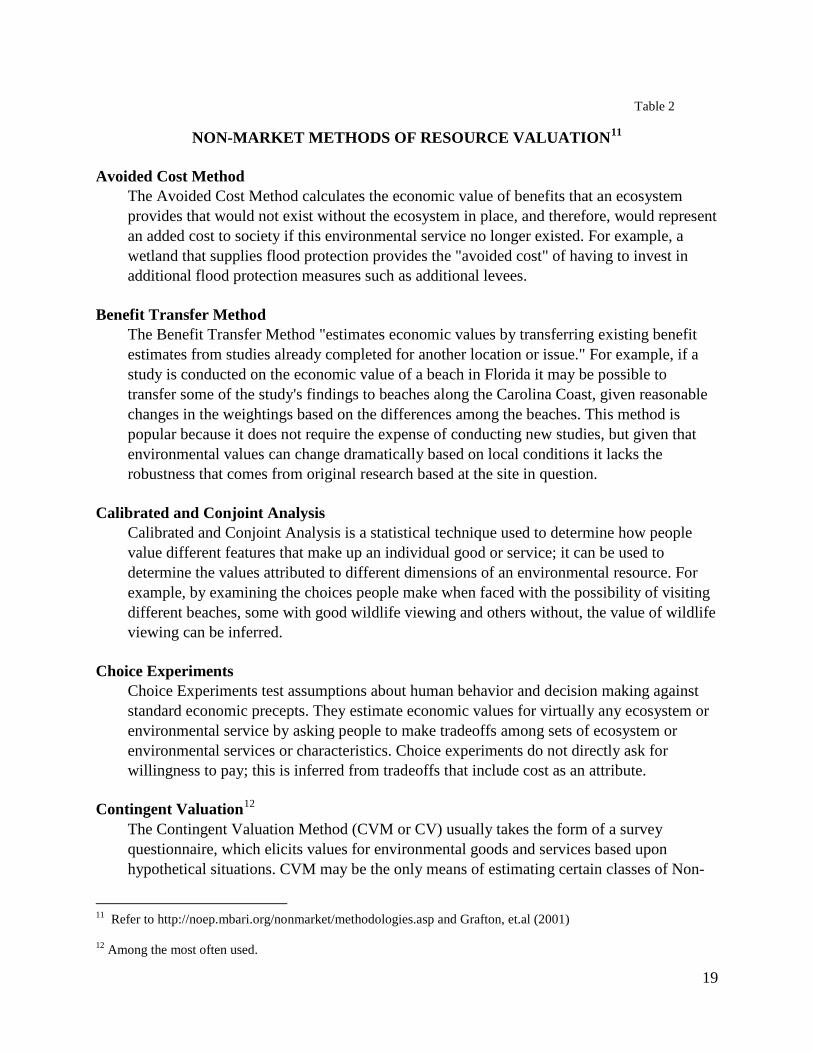
Table 2
NON-MARKET METHODS OF RESOURCE VALUATION11
Avoided Cost Method The Avoided Cost Method calculates the economic value of benefits that an ecosystem provides that would not exist without the ecosystem in place, and therefore, would represent an added cost to society if this environmental service no longer existed. For example, a wetland that supplies flood protection provides the "avoided cost" of having to invest in additional flood protection measures such as additional levees.
Benefit Transfer Method The Benefit Transfer Method "estimates economic values by transferring existing benefit estimates from studies already completed for another location or issue." For example, if a study is conducted on the economic value of a beach in Florida it may be possible to transfer some of the study's findings to beaches along the Carolina Coast, given reasonable changes in the weightings based on the differences among the beaches. This method is popular because it does not require the expense of conducting new studies, but given that environmental values can change dramatically based on local conditions it lacks the robustness that comes from original research based at the site in question.
Calibrated and Conjoint Analysis Calibrated and Conjoint Analysis is a statistical technique used to determine how people value different features that make up an individual good or service; it can be used to determine the values attributed to different dimensions of an environmental resource. For example, by examining the choices people make when faced with the possibility of visiting different beaches, some with good wildlife viewing and others without, the value of wildlife viewing can be inferred.
Choice Experiments Choice Experiments test assumptions about human behavior and decision making against standard economic precepts. They estimate economic values for virtually any ecosystem or environmental service by asking people to make tradeoffs among sets of ecosystem or environmental services or characteristics. Choice experiments do not directly ask for willingness to pay; this is inferred from tradeoffs that include cost as an attribute.
Contingent Valuation12 The Contingent Valuation Method (CVM or CV) usually takes the form of a survey questionnaire, which elicits values for environmental goods and services based upon hypothetical situations. CVM may be the only means of estimating certain classes of Non-
11 Refer to http://noep.mbari.org/nonmarket/methodologies.asp and Grafton, et.al (2001) 12 Among the most often used.
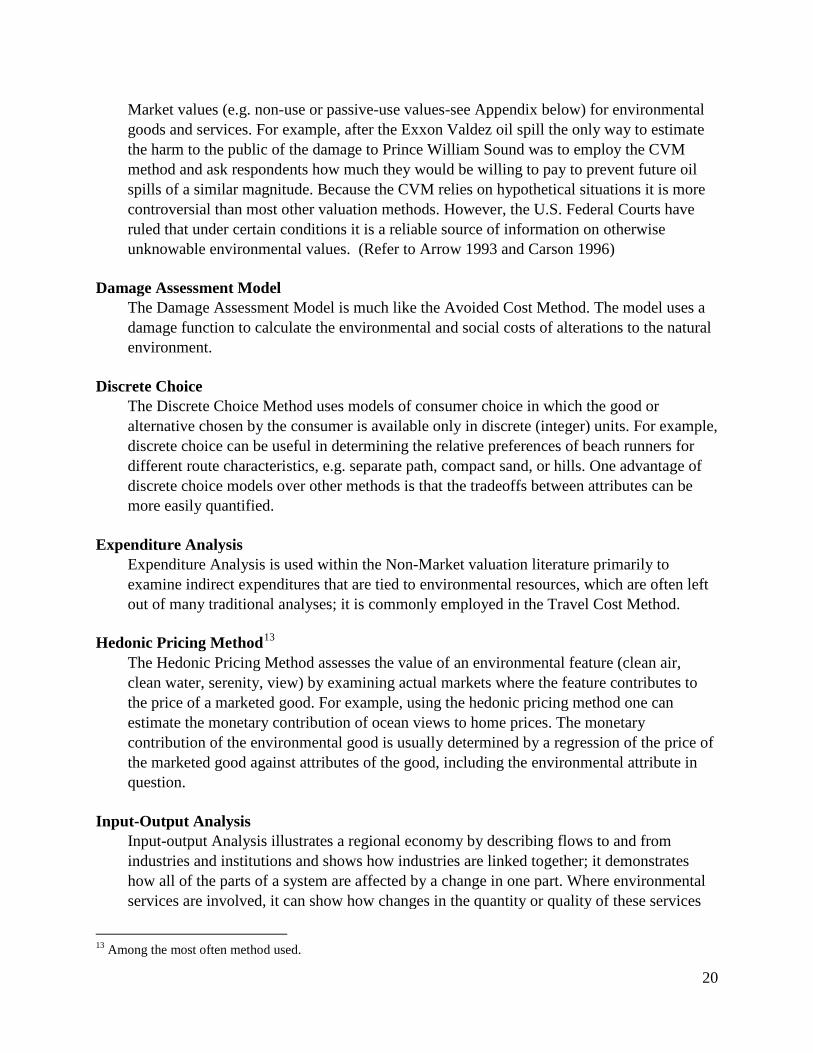
20
Market values (e.g. non-use or passive-use values-see Appendix below) for environmental goods and services. For example, after the Exxon Valdez oil spill the only way to estimate the harm to the public of the damage to Prince William Sound was to employ the CVM method and ask respondents how much they would be willing to pay to prevent future oil spills of a similar magnitude. Because the CVM relies on hypothetical situations it is more controversial than most other valuation methods. However, the U.S. Federal Courts have ruled that under certain conditions it is a reliable source of information on otherwise unknowable environmental values. (Refer to Arrow 1993 and Carson 1996)
Damage Assessment Model The Damage Assessment Model is much like the Avoided Cost Method. The model uses a damage function to calculate the environmental and social costs of alterations to the natural environment.
Discrete Choice The Discrete Choice Method uses models of consumer choice in which the good or alternative chosen by the consumer is available only in discrete (integer) units. For example, discrete choice can be useful in determining the relative preferences of beach runners for different route characteristics, e.g. separate path, compact sand, or hills. One advantage of discrete choice models over other methods is that the tradeoffs between attributes can be more easily quantified.
Expenditure Analysis Expenditure Analysis is used within the Non-Market valuation literature primarily to examine indirect expenditures that are tied to environmental resources, which are often left out of many traditional analyses; it is commonly employed in the Travel Cost Method.
Hedonic Pricing Method13 The Hedonic Pricing Method assesses the value of an environmental feature (clean air, clean water, serenity, view) by examining actual markets where the feature contributes to the price of a marketed good. For example, using the hedonic pricing method one can estimate the monetary contribution of ocean views to home prices. The monetary contribution of the environmental good is usually determined by a regression of the price of the marketed good against attributes of the good, including the environmental attribute in question.
Input-Output Analysis Input-output Analysis illustrates a regional economy by describing flows to and from industries and institutions and shows how industries are linked together; it demonstrates how all of the parts of a system are affected by a change in one part. Where environmental services are involved, it can show how changes in the quantity or quality of these services
13 Among the most often method used.
21
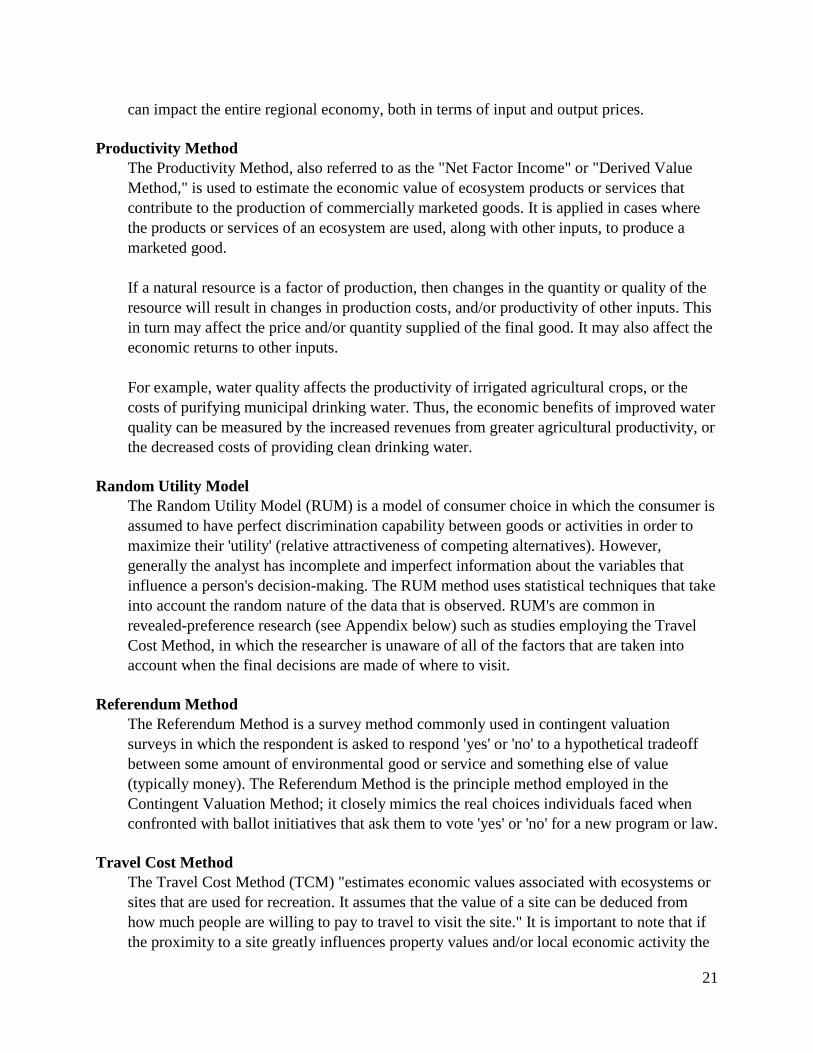
can impact the entire regional economy, both in terms of input and output prices.
Productivity Method The Productivity Method, also referred to as the "Net Factor Income" or "Derived Value Method," is used to estimate the economic value of ecosystem products or services that contribute to the production of commercially marketed goods. It is applied in cases where the products or services of an ecosystem are used, along with other inputs, to produce a marketed good. If a natural resource is a factor of production, then changes in the quantity or quality of the resource will result in changes in production costs, and/or productivity of other inputs. This in turn may affect the price and/or quantity supplied of the final good. It may also affect the economic returns to other inputs. For example, water quality affects the productivity of irrigated agricultural crops, or the costs of purifying municipal drinking water. Thus, the economic benefits of improved water quality can be measured by the increased revenues from greater agricultural productivity, or the decreased costs of providing clean drinking water.
Random Utility Model The Random Utility Model (RUM) is a model of consumer choice in which the consumer is assumed to have perfect discrimination capability between goods or activities in order to maximize their 'utility' (relative attractiveness of competing alternatives). However, generally the analyst has incomplete and imperfect information about the variables that influence a person's decision-making. The RUM method uses statistical techniques that take into account the random nature of the data that is observed. RUM's are common in revealed-preference research (see Appendix below) such as studies employing the Travel Cost Method, in which the researcher is unaware of all of the factors that are taken into account when the final decisions are made of where to visit.
Referendum Method The Referendum Method is a survey method commonly used in contingent valuation surveys in which the respondent is asked to respond 'yes' or 'no' to a hypothetical tradeoff between some amount of environmental good or service and something else of value (typically money). The Referendum Method is the principle method employed in the Contingent Valuation Method; it closely mimics the real choices individuals faced when confronted with ballot initiatives that ask them to vote 'yes' or 'no' for a new program or law.
Travel Cost Method The Travel Cost Method (TCM) "estimates economic values associated with ecosystems or sites that are used for recreation. It assumes that the value of a site can be deduced from how much people are willing to pay to travel to visit the site." It is important to note that if the proximity to a site greatly influences property values and/or local economic activity the
22
TCM may not be sufficient to capture the full Non-Market value of the resource in question. For example, the best surf spots in California greatly increase the value of adjacent property; yet most of the users of the sites do not travel very far to get to them, but they value the resources very much (which is reflected in the high costs of housing in these areas).
References: Amacher, G.S., R.J. Brazee, J.W. Bulkley and R.W. Moll (1988), “An Interdisciplinary Approach to Valuation of Michigan's Coastal Wetlands”, Ann Arbor: School of Natural Resources, University of Michigan.
Arrow, Kenneth, Robert Solow, Paul R. Portney, Edward E. Leamer, Roy Radner and Howard Schuman, (1993), “Report on the NOAA Panel on Contingent Valuation”, National Oceanic and Atmospheric Administration, January 11.
Barbier, E.B., M. Acreman, and D. Knowler, (1997) “Economic Valuation of Wetlands, A Guide for Policy Makers and Planners”, Ramsar Convention Bureau, Gland, Switzerland.
Bardecki, M.J., “Wetlands and Economics: An Annotated Review of the Literature, 1988-1998”, (1998) with special reference to the wetlands of the Great Lakes. Ryerson Polytechnic University, Toronto, Ontario. Prepared for Environment Canada - Ontario Region, May.
Bardecki, M.J., “The Application of Willingness-to-Pay, Opportunity Cost and Cumulative Impact Methods to Greenock Swamp, Ontario”, (1988), Wetlands Are Not Wastelands Project Report 3 Ottawa: Wildlife Habitat Canada and Environment Canada.
Berger, Louis and Associates, Inc., (1997) “Costs for Wetland Creation and Restoration Projects in the Glaciated Northeast”, A Report to EPA, July.
Carson, Richard T., W. Michael Hanemann, Raymond J. Kopp, Jon A. Krosnick, Robert C. Mitchell, Stanley Presser, Paul A. Rudd and V. Kerry Smith, (1996) “Was the NOAA Panel Correct about Contingent Valuation?”, Resources for the Future, Discussion Paper 96-20, May.
Costanza, Robert, Ralph d’Arge, Rudolf de Groot, Stephen Farber, Monica Grasso, Bruce Hannon, Karin Limburg, Shahid Naeem, Robert V. O’Neill, Jose Paruelo, Rovert G. Raskin, Paul Sutton and Marjan van den Belt, (1997) “The Value of the World’s Ecosystem Services and Natural Capital”, Nature, Volume 387, May.
Elliot, M.L. and G. Mulamoottil. 1992. "Agricultural and Marsh Land Uses on Walpole Island: Profit Comparisons". Canadian Water Resources Journal Volume 17, 1992, Pages 111-119. Environment Canada – Canadian Wildlife Service, (2001) “Putting an Economic Value on Wetlands: Concepts, Methods and Considerations”, Ministry of Public Works and Government Services Canada.
23
Frisch, Ragnar (1934) “Statistical Confluence Analysis by Means of Complete Regression Systems”, University Institute of Economics, Oslo, Publication 5.
Grafton, R.Q., Pendleton L.H., and Nelson H.W. (2001), “A Dictionary of Environmental Economics, Science, and Policy”, Edward Elgar, Northampton, MA.
Hair JF, Anderson R, Tatham RL, Black WC, (2006), "Multivariate Data Analysis". Prentice Hall: Upper Saddle River, N.J.
Hvenegaard, G.T., J.H. Butler and D.K. Krystofiak, (1989) “Economic values of bird watching at Point Pelee National Park, Canada”. Wildlife Society Bulletin Volume 17, Pages, 526-531.
King, Dennis, and Curtis Bohlen, (1994), “Making Sense of Wetland Restoration Costs”, University of Maryland Center for Environmental Science, January.
King, Dennis, “The Dollar Value of Wetland: Trap Set, Bait Taken, Don’t Swallow” (1998), National Wetlands Newsletter, July-August, pages 7-11.
Kreutzwiser, R.D., (1981), “The economic significance of the Long Point marsh, Lake Erie, as a recreational resource”, Journal of Great Lakes Research, Volume 7, Pages 105-110.
NOAA,( 2007) “Coastal Management Act Performance Measurement System: Contextual Indicators Manual”, U.S. Department of Commerce, National Oceanic and Atmospheric Administration, National Ocean Service, Office of Ocean and Coastal Resource Management, Working Draft, March 2007 and June 2009.
Outdoor Industry Foundation, (2006) “The Active Outdoor Recreation Economy – a $730 Billion Annual Contribution to the U.S. Economy”, Fall. Raphael, C.N. and E. Jaworski (1979), “Economic value of fish, wildlife and recreation in Michigan's coastal wetlands”. Coastal Zone Management Journal, Volume 5, Pages 181-194.
Schaefer, K., E. Snell and D. Hayman (1996), "Valuing wetland nutrient buffers in the Eramosa River watershed" in C.E. Deslisle and M.S. Bouchard eds. Dévelopement durable et rationnel des resources hydriques: Compte rendu de la 49e Conférence annuelle de l'Association candienne des ressources hydriques, vol. II. Collection Environnement de l'Université de Montréal (Montréal: l'Université de Montréal), pages 629-638.
Scodari, P.F., (1994) “Wetlands Protection: The Role of Economics”, Environmental Law Institute, Washington, D.C. Studenmund, A.H, (2006), "Using Econometrics: A practical guide", 5th Edition, Pearson International Edition, pages 258-259.
USDA, (2005)“Conceptualizing and Measuring Demand for Recreation on National Forests: A Review and Synthesis”, United States Department of Agriculture, Forest Service, Pacific
24
Northwest Research Station, General technical Report PNW-GTR-645, November. Van den Poel Dirk, Larivière Bart, (2004), “Attrition Analysis for Financial Services Using Proportional Hazard Models”, European Journal of Operational Research, 157, volume 1, pages 196-217
Van Vuuren, W. and P. Roy, (1993) “Private and social returns from wetland preservation versus those from wetland conversion to agriculture.”, Ecological Economics. Volume 8, Number 3, pages 289-305.
V. BEST PRACTICES
A. Project scope
Once it has been determined that BCA is the proper analysis method, a series of
considerations should be reviewed. These considerations, as suggested by the Transportation
Research Board (TRB) and other in the literature base, represent a group of “best practices”.14
While not all aspects delineated below may be fully developed in a particular BSA owing to the
nature and size of the project as well as the amount of resources (human and monetary)
available to make such determinations, their review would promote a more complete due
diligence process. The appropriate level of effort to be invested in the analysis depends on its
expected payoff. Resources needed to perform the benefit-cost analysis should be weighed
against the value of the analysis in determining the most cost-effective project. If the proposed
project has very high costs, it is clearly worth considerable effort to determine whether benefits
exceed costs and to identify the most economically advantageous alternative. Conversely, the
analytical effort should not be greater than what would be lost by pursuing a project that was not
cost-beneficial or selecting the less cost-effective of two projects. In most situations, the
incremental payoff from choosing the right alternative far exceeds the resources consumed in
doing the benefit-cost analysis. In any analysis, efforts should be concentrated on estimating and 14 See http://bca.transportationeconomics.org
25
valuing the benefits and costs that are of the greatest magnitude as well as those that differ the
most between projects.15
B. Clarity of Effort
The project must be described in sufficient detail for its benefits and costs to be estimated.
The description may change during the course of the analysis if it is seen that a more extensive
(or less extensive) project or a different way of doing it may be more cost-effective. Sometimes
the optimum timing for a project and its alternatives can only be established after costs and
benefits have been estimated. At that stage the timing of an option can be tested through
sensitivity analysis, using different dates, to reveal the impact of project timing on the outcome.
C. Schedule
Because benefits and costs will be summed over future years, a project's schedule can
affect the outcome of the benefit-cost analysis. Schedules for both the proposed project and its
alternatives should maximize benefits relative to costs. In some situations, project schedules can
be very complex, such as where project alternatives involve stage construction or major
rehabilitation during the period of the analysis. The optimum timing for each can be established
after costs and benefits have been estimated. Then the timing of each option can be tested
through sensitivity analysis, using different dates. This reveals the impact of project timing on
15 Absolute values are not the only determinate as concentration of value may be a significant determinate in the attractiveness of an initiative. For example, political pressures may alter the manner in which a benefit is viewed. A total benefit of $20 million spread across a large geographic area may not appear as positive as the same $20 million benefit concentrated in one location.
26
outcome. Less than optimal timing can distort results. For example, a comparison of
refurbishment vs. replacement might be distorted if a premature replacement date is assumed. 16
D. Purpose of the Analysis How will the analysis be used?
• to determine if the project should be undertaken • to establish priorities for approved projects • to determine how a project should be undertaken
or for some other purpose? A response to a court order, executive directive or “vote of the people” are also compelling rationale for performing such analysis.
E. Time Period of Analysis Defining the purpose will help determine what benefits and costs should be included, as well as other aspects of the analysis. Examples include:
• Which highway widening projects should be undertaken with the funds available this year? The benefits and costs of each widening project should be summed and compared. The projects with the most favorable benefit-cost measure (such as net-present value, benefit-cost ratio, or internal rate of return) would be selected.
• Should a new road be built? The base case would be no new road. The benefits and costs of the new road should be summed and compared to the base case.
• Should concrete or asphalt paving be used for a resurfacing project? The only benefits and costs that need be considered are those that differ between alternatives. Is one type of pavement significantly smoother or safer? What aspects of the construction are different? What is the replacement cycle for each? What is the replacement cost?
16 Transport Canada. Guide to Benefit-Cost Analysis in Transport Canada. Transport Canada Report TP 11875E, September 1994. Available at: http://www.tc.gc.ca/finance/BCA/en/TOC_e.htm
27
• Should a light rail system be built? The light rail system would probably be compared to both the existing base case and to a bus system that would provide service similar to the light rail. The intended benefits are likely two-fold: to increase mobility for transit-dependent people and reduce congestion by reducing automobile travel. The project would be expensive; alternatives would be quite different in terms of capital and operating costs and service characteristics. More extensive analysis would be required than for the other projects above.
• Should port X be deepened to 45 feet to accommodate Post-Panamax container shipping? The potential volume of new traffic would have to be compared with current limitations on the size of carriers currently handled. Offsetting this marginal gain would have to be assessment if any ports “lost” traffic as a result of this investment. Determining the inclusion of any dis-benefits would be the scope (item A above) of the BCA. A national survey would include such dis-benefits while a state based review might not. The current attempts to enhance the Port of Charleston versus the Port of Savannah illustrate this issue.
F. Purpose of the Overall Project What problem(s) does the project or initiative seek to mitigate? What goal(s) does it address? What are its intended or forecast benefits?
The nature of the problem or goal will determine its intended benefits and intended
recipients. But significant unintended effects, whether negative or positive, must also be included
in the analysis. Effects on other people may or may not be included in the benefit-cost measure,
but they should be identified, because they will be potential sources of support for, or opposition
to, the project. Examples include:
• Project: Straightening a curve in a road Purpose: To reduce accidents Unintended effects: Reduced travel time Benefits: Reduced accidents and travel time
• Project: New bus route Purpose: To provide mobility for transit-dependent people Unintended effects: Reduced automobile trips, bus noise on new route, people waiting at new bus stops Benefits: Increased person-trips, reduced automobile congestion and noise, noise from
28
buses (a negative benefit), effects on property adjacent to bus stops (these effects may or may not be significant and may be negative or positive -- people trampling a lawn and dropping trash or people patronizing an adjacent neighborhood store).
• Project: Changeable message signs on a congested freeway providing travel time via an alternate route Purposes: To reduce overall delay by encouraging alternate routes, to reduce travel time uncertainty Unintended effects: Increased delay on alternate routes and connecting streets Benefits: Reduced overall travel time on freeway, increased overall travel time on alternate routes and connecting streets (negative benefits).
• Project: Expanding the buffer zone surrounding a marine sanctuary Purposes: Reduce potential for coral reef damage, enhance opportunities for academic research, expand recreational diving opportunities (for experienced divers) Unintended effects: Increased cost for oil and gas exploration; reduced domestic supply potential Benefits: Cleaner and more robust coral reefs
1. Intended recipients
These will depend on the perspective of the sponsoring entity. A city may wish to
consider only the benefits and costs that accrue to city residents. A federal agency, allocating
funds for new transit starts, is likely to consider the costs and benefits to all involved. A large
state, such as California, with significant manufacturing and trade, may consider benefits and
costs to all parties in prioritizing highway projects, while a small state, with substantial through
traffic that does not substantially benefit its economy, may desire to focus only on the costs and
benefits to the state's residents and businesses. This tendency to take a parochial view is a
potential pitfall in that, when applied properly, benefit-cost analysis should be broad enough to
consider all persons who incur significant costs or benefits.
29
2. Unintended effects or impacts
The term "unintended effects" is used to focus attention on a project's foreseeable side
effects that may be either good or bad. These are important in evaluating and gaining support for
projects. For example, a project that is effective in reducing automobile congestion may make
pedestrian or bicycle travel more dangerous, while an alternative that is somewhat less effective
in reducing automobile congestion may not reduce pedestrian safety and may thus have greater
overall benefits. In the bus route example above, awareness that bus stops affect adjacent
property may result in locating stops so as to minimize damage. Similarly, a plan to dredge
deeper channels may result in endangerment of a species or contribute to erosion at other
locations.
VI. BENEFITS
The benefits of transportation and commerce projects are commonly defined as reductions
in transportation costs as well as human mortality and morbidity. Benefits are also often defined
as all of the effects of the project/program on its users or the society at large, even those impacts
that are negative (sometimes referred to as dis-benefits). Benefits and dis-benefits are measurable
and have economic value. In addition, other benefits that may be equally tangible may be harder
to quantify as they are not exchanged via formal market processes. As detailed in tables 1 and 2,
individual valuations, e.g., clean beaches) cannot be directly compared across individuals,
indirect measures such as “willingness to pay” may be a proxy to measure the level of perceived
benefits.
Travel time, transportation platform (car, bus, truck, rail, inland waterway, deep sea water
or air) operating costs, accident reductions and emissions and greenhouse gas reductions are
30
among the most common direct benefits mentioned in transportation-related studies. Other
effects that may be more difficult to measure but still may be considered critical to making
prudent choices among alternatives include: induced travel, travel time reliability, noise, habitat
and water quality, economic effects, community impacts and construction dis-benefits.
A. Travel Time
In a typical benefit-cost analysis, the value of travel time is calculated separately for
various transportation modes (car, truck, bus, airplane, waterway or deep sea), and trip purposes
(e.g., general commerce, business travel, commuting to work, or personal travel). Light trucks
(vans, SUVs, and small pickup trucks) are generally classified with cars. Regardless of the mode
or trip purpose, the total value of time for vehicle occupants (driver and passengers) or freight is
calculated as the average value per person, or per cargo ton, times the average vehicle occupancy
(persons per vehicle or cargo tons per vehicle).17 Differences in these values are summarized
below.
1. Cars & light trucks
"On the clock" travel refers to trips conducted by workers during the work day, as part of
their jobs. Many on-the-clock trips are made by truck drivers, but some are also taken in cars,
vans, or light trucks used to deliver packages, provide repair services, or travel to and from
meetings. Since the costs of excess worker time are borne by businesses, there is a consensus that
the value of travel time includes the value of workers' wage and fringe/overhead costs. The US
Dept. of Transportation recommends using $21.20/hour for on-the-clock business travel (values
in year 2000 dollars) (US DOT 1997).
17 Waterborne commerce is often referred to as “purchased by the hour and sold by the ton.”
31
In some cases, the business traveler can be a passenger rather than the driver, and can
sometimes still perform productive work while traveling. In such cases, excess travel time may
not be entirely wasted. Transport Canada has adopted the practice of reducing the value of time
savings for business travel by 25% if productive work can be performed during travel times. In
the US, this adjustment is generally not made, as a worker's ability to do work while riding in a
car is limited.18
2. Cars & light trucks (commuting)
In most regional travel demand forecasting and simulation models, "commute trips" refer
to peak-period commuting and is distinguished from non-work (personal) travel. The value of
time for commuting trips is usually defined as a fraction of the wage rate. The US Dept. of
Transportation currently recommends using a value of 50% of the average wage rate of
$21.20/hour, which comes to $10.60/hour (values in year 2000 dollars) for commuting travel
time (US DOT 1997). Commuting trips also tend to be more schedule-sensitive than personal
travel, and hence there is a need to consider the costs of travel time variability under congested
road conditions. Based on a survey in California, Small (1997) found that commuters have a
strong aversion to unpredictable travel times under congested conditions, so that a minute of time
savings under congested conditions is valued at 2.5 times that of an uncongested minute of travel
time savings. A study by Cohen and Southworth (1999) refined this multiplier down to the range
of 1.4 to 2.3. An earlier study by Waters (1992) concluded that a 1.3 to 2.0 mark-up factor is
appropriate, depending on the level of congestion. In addition, separate studies of toll roads also
show that peak period commuters make trade-offs between time and cost, in which they value
their time at 1.4 to 1.8 times the normal value of time (Sullivan, 2000).
18 This has been especially true with legal restrictions now placed on the use on hands-held devices while driving.
32
3. Cars & light trucks (personal travel)
Non-work trips include travel for shopping, personal business, social, and recreational
purposes. Various regional transportation studies commonly assign a value for personal trips
ranging from one-third to one-half of the average wage rate, though a higher fraction can be
justified for long-distance trips. (For instance, the San Francisco Bay Area Metropolitan
Transportation Commission model assumes 32% of the wage rate for shopping trips as compared
to 46% of the wage rate for commuting trips.). Studies in the UK also show evidence that
shopping trips can have a lower time value than commuting trips (Mackie 2003). However, the
US Dept. of Transportation currently recommends using $10.60/hour (50% of the wage rate,
valued in year 2000 dollars) for local personal travel, the same value as for commuting trips (US
DOT 1997). The higher recommended value for intercity personal travel is $14.80/hour (70% of
the wage rate).
4. Bus and rail transit trips
Travel time for public transportation vehicles is valued as the sum of (1) the value of time
for the professional driver (and conductors or other staff, if applicable), and (2) the value of time
for passengers. Driver and staff time is calculated as the value of "on-the-clock" travel times the
number of staff persons per vehicle. Passenger time may be calculated as any blend of the work-
trip value of time and the non-work value of time, multiplied by the number of passengers per
vehicle. (More conservative studies merely use 50% of the average wage rate, or $10.60/hour).
Sometimes, a separate time value is set for out-of-vehicle time, which includes time spent
walking to and waiting at the transit stop. Since this may include some time spent standing
around and being exposed to warm, cold, or rainy weather, the value of out-of-vehicle time may
33
be set at a rate higher than the value of in-vehicle time (Small 1992). The US DOT (1997)
recommends using 100% of the wage rate for time spent walking and waiting and 50% of the
wage rate for time spent in transit vehicles. The UK Dept. for Transport (2001) also adopts a
value for out-of-vehicle time that is double the in-vehicle time value.
5. Medium & heavy truck trips
It is generally assumed that medium and heavy truck trips are "on-the-clock" business
travel. If the truck is empty or carrying cargo that is not time-sensitive, then the value of time is
essentially the average labor cost for professional truck drivers and any accompanying loading
staff (including wage and fringe costs). The US Dept. of Transportation recommends using
$18.10 as the wage rate for truck drivers (year 2000). However, some urban toll and congestion
studies indicate that heavy-duty truck drivers value their time closer to $20-25 per hour. The
Bureau of Labor Statistics found the US average hourly wage for heavy truck drivers as of year
2000 was $15.78. Adding 25% fringe costs raises the total cost of truck driver time to
$19.73/hour (year 2000 dollars). FHWA's Highway Economic Requirements System (HERS, a
benefit/cost system for highways) adopts a value of $21.95/hour for truck drivers.
Cargo can also have a time value. In the aggregate it is based on the interest costs of the
value of the cargo, though in reality this tends to be trivial. More important is the potentially
substantial value of time for the portion of goods considered time sensitive. This is defined as the
portion of truck deliveries in which the cargo user (i.e., the shipper or recipient) bears excess
costs of late pickup or delivery. These excess costs apply largely to construction and technology-
based manufacturing and include the following categories:
34
• User product spoilage — e.g., concrete/cement arriving outside of its useful life
• Missed delivery window — pickup or delivery trips that arrive after the gate or loading dock is closed for the day (extending delivery time by a day or requiring re-delivery costs)
• Late delivery — causing recipients to incur additional cargo-related costs associated with overtime pay at the loading dock and/or additional just-in-time processing cost penalties.
Research on the time value for cargo varies in its conclusions, depending on the nature of
the cargo and industry, though there is a consensus that the value is not trivial. Updates to
FHWA's HERS adds a value of inventory carrying cost alone, at $1.78/hour. A Montana
benefit/cost analysis system developed by Cambridge Systematics and Economic Development
Research Group (2004) adds an additional $2 to $28/hour for user costs of additional cargo
delay. A 1997 study by the Texas Transportation Institute uses a truck time value of $45/hour,
representing $25/hour on top of the standard USDOT value of driver time alone. A study by
Levinson (2003) found a value of $49.42/hour for commercial vehicle operators in Minnesota. A
study by DeJong (2000) found a range of values from $36-48/hour. A similar range of values
was found by Waters (1995). At the high end, a survey of freight carriers by Small et al (1999)
found values of freight transit time in the range of $144-$193/ hour, and costs of schedule delays
of $371/hour. Additional case studies of the large value of "just-in-time" processing and
scheduling benefits (sometimes exceeding $100/hour) are shown in reports of NCHRP 2-18.
It is interesting to note that while most Department of Transportation guidelines permit
assessment of secondary and tertiary beneficiaries and costs in formal BCAs, the Federal
Highway Administration’s guidelines specifically forbid inclusion of such “multiplier” effects.
(US Federal Highway Administration 2003). Working with the American Trucking
35
Associations, (Wolfe 2011) determined that current (2009) line haul trucking costs ran $2.32 per
mile while drayage ran $3.81 per mile.19
6. Rail freight trips
Rail freight trips are valued similarly to truck trips: the value of "on-the-clock" time for all
train staff plus the value of cargo time. However, the majority of cargo of freight trains is much
less likely to be time-sensitive.20 In addition, many rail freight trips involve loading and
unloading time associated with intermodal transfers between trucks and rail cars. Thus train
arrival and departure delays commonly also trigger accompanying truck time delays, which
should be added to the total cost of delay.
7. Water trips
As over 77 percent of import and export activities are deep-water based, in addition to a
sizeable portion of domestic, shallow-draft movements, change to any of their supporting
infrastructures can lead to significant changes in benefits as well as dis-benefits.21 Among
ports, traffic is highly concentrated. (Table 3)
As ships of all kinds grow larger, the need for timely, accurate and complete information
is needed involving, winds, currents, salinity, channel depth, air gaps, tides, etc. Container
traffic has increased over 250 percent in the last 20 years with larger ships calling on US ports.
(Refer to Figure 1). This trend is not limited to container (liner) vessels.
19 Refer to Table 22. 20 The majority of rail freight involves the movement of grain, metallic and nonmetallic ore and coal. 21 Deep-water draft is defined by the United States Army Corps of Engineers as channels with 15 or more feet of draft. More than 150 ports in the United States meet this criteria. Shallow-draft (usually 8 to 12 feet in depth) are the norm for the 12,000 mile inland river system and gulf/atlantic intercoastal waterway system.
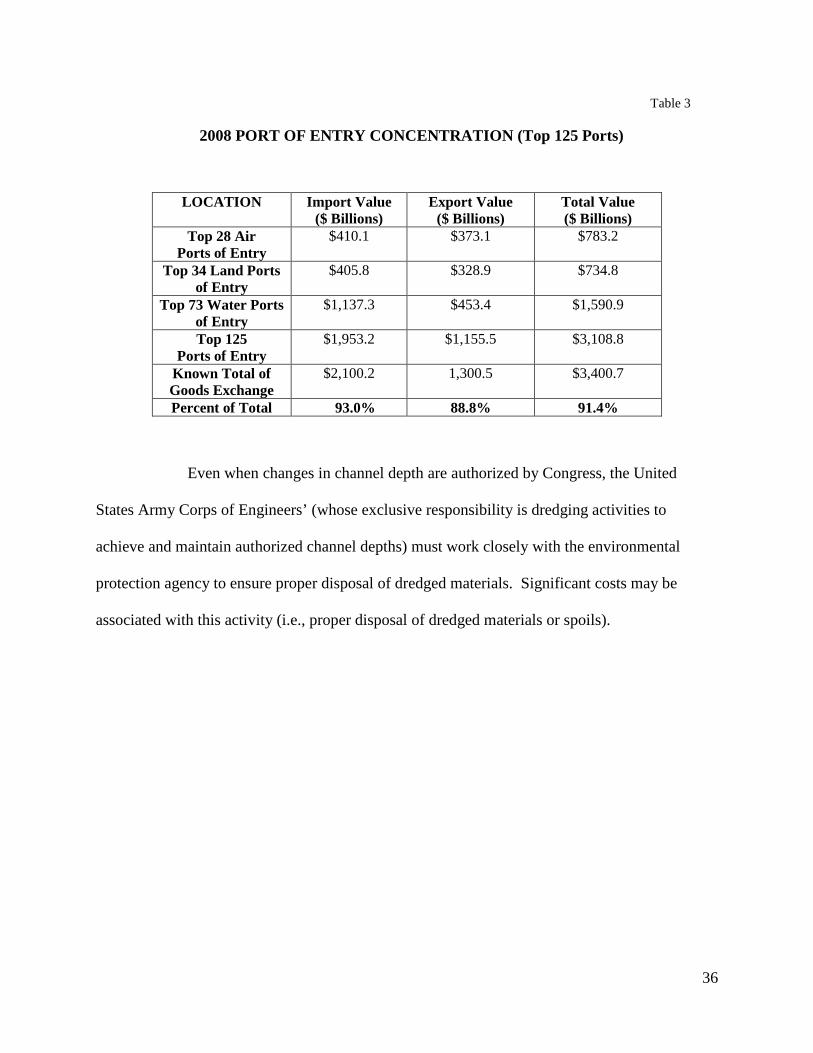
36
Table 3
2008 PORT OF ENTRY CONCENTRATION (Top 125 Ports)
Even when changes in channel depth are authorized by Congress, the United
States Army Corps of Engineers’ (whose exclusive responsibility is dredging activities to
achieve and maintain authorized channel depths) must work closely with the environmental
protection agency to ensure proper disposal of dredged materials. Significant costs may be
associated with this activity (i.e., proper disposal of dredged materials or spoils).
LOCATION Import Value ($ Billions)
Export Value ($ Billions)
Total Value ($ Billions)
Top 28 Air Ports of Entry
$410.1 $373.1 $783.2
Top 34 Land Ports of Entry
$405.8 $328.9 $734.8
Top 73 Water Ports of Entry
$1,137.3 $453.4 $1,590.9
Top 125 Ports of Entry
$1,953.2 $1,155.5 $3,108.8
Known Total of Goods Exchange
$2,100.2 1,300.5 $3,400.7
Percent of Total 93.0% 88.8% 91.4%
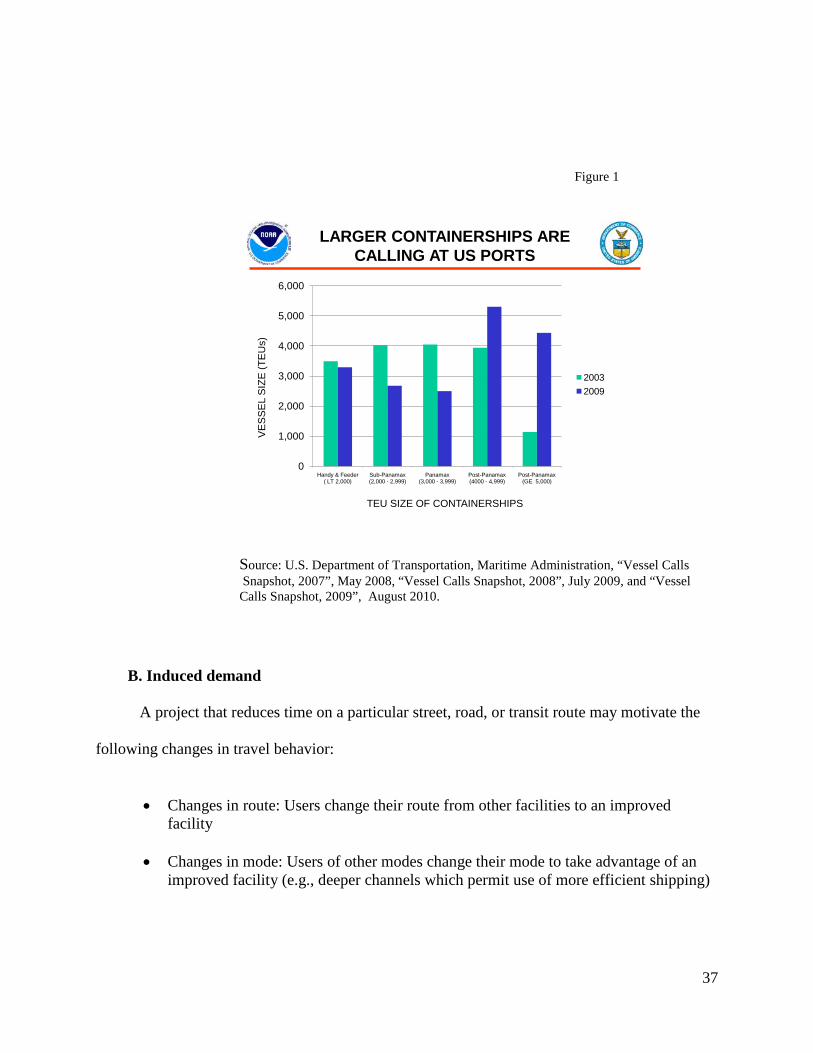
37
Figure 1
LARGER CONTAINERSHIPS ARE CALLING AT US PORTS
VE
SS
EL
SIZ
E (T
EU
s)
0
1,000
2,000
3,000
4,000
5,000
6,000
Handy & Feeder ( LT 2,000)
Sub-Panamax (2,000 - 2,999)
Panamax (3,000 - 3,999)
Post-Panamax (4000 - 4,999)
Post-Panamax (GE 5,000)
20032009
TEU SIZE OF CONTAINERSHIPS
Source: U.S. Department of Transportation, Maritime Administration, “Vessel Calls Snapshot, 2007”, May 2008, “Vessel Calls Snapshot, 2008”, July 2009, and “Vessel Calls Snapshot, 2009”, August 2010.
B. Induced demand
A project that reduces time on a particular street, road, or transit route may motivate the
following changes in travel behavior:
• Changes in route: Users change their route from other facilities to an improved facility
• Changes in mode: Users of other modes change their mode to take advantage of an improved facility (e.g., deeper channels which permit use of more efficient shipping)
38
• Changes in time of travel: Users change their time of travel to a more desired time due to the decrease in congestion
• Generation of new trips: Users choose to make trips they previously would not have made, because travel costs are lower
These changes in traveler behavior are often referred to as "induced demand”. When an
improvement to a transportation facility increases capacity and reduces the cost of using the
facility (primarily travel time), traffic along that facility tends to increase. In other words, a
transportation improvement project intended to reduce travel times for existing users also
"induces" new travel on the facility. The degree to which this happens is a function of the
elasticity of demand for travel on the facility, (i.e., how much demand falls or rises in response to
price.) Highly elastic demand is very responsive to price.
Although the magnitude of induced travel and the sources of these "new trips" are actively
debated in the literature, most empirical studies suggest that travel demand is elastic, and that
projects that lower the cost of travel will lead to an increase in the quantity of travel demanded.
Induced travel can have a significant effect on the benefits of a transportation project. For
example, if new users, and the congestion they contribute to the improved facility, are not taken
into account, the evaluation of a highway expansion will overstate the travel time benefits of the
existing users.
C. Travel time as a benefit rather than a dis-benefit
When calculating the value of travel time savings, researchers and practitioners
commonly assume that travel is a derived demand (based on given origin and destination
patterns) and that travel time is what economists refer to as a "disutility" (something that people
desire to minimize). However, there may be times when a person would rather be traveling than
39
engaged in other activities (for example, a pleasant drive on a country road). In this case, travel
time may be treated as a utility by the traveler. Travel time also becomes a benefit when
transportation improvements improve mobility (i.e., ability of more residents to use
transportation to access more destinations) or expand accessibility (i.e., ability to reach more job
opportunities, have access to a larger workforce, or go to shopping, social, or recreational
destinations within a given travel time). In such cases, people may gladly make use of
transportation improvements to travel to more distant destinations that are attractive to them.
Even a typical commute trip may have an intrinsic component and a derived component of
utility. In one study of more than 1900 residents of the San Francisco Bay Area, the average one-
way ideal commute time was found to be 16 minutes (Mokhtarian and Salomon 2001). Three-
quarters of this sample reported that they sometimes or often travel "just for the fun of it." This
implies that given the opportunity, travelers may not wish to minimize their travel time to zero.
Studies such as this raise important questions about our assumptions regarding individuals and
their travel behavior. Understanding of this subject is still very limited, but a better
understanding of travel time may have important implications for evaluating the benefits of
travel time savings.
Another form of such a benefit is “Just-In-Time” delivery management methods. Here,
individual shipments form a “continuous pipeline” of supply to the firm. This is often less
expensive than traditional warehousing of materials not needed for immediate processing.
References:
Booz-Allen & Hamilton Inc. (1999) California Life-Cycle Benefit/Cost Analysis Model (Cal-B/C)-Technical Supplement to User's Guide. California Department of Transportation. September. See: http://www.dot.ca.gov/hq/tpp/offices/ote/benefit_files/tech_supp.pdf
40
Cohen, H. and F. Southworth (1999), "On the Measurement and Valuation of Travel Time Variability Due to Incidents on Freeways," Journal of Transportation and Statistics, Volume 2 Number 2, December. See: http://www.bts.gov/publications/journal_of_transportation_and_statistics/ volume_02_number_02/
Federal Aviation Administration (1998), "Economic Values for Evaluation of Federal Aviation Administration Investment and Regulatory Programs," FAA-APO-98-8, June.
Federal Highway Administration (2003), “Economic Analysis Primer: Benefit-Cost Analysis”, See: http://fhwa.dot.gov/infastructure/asstmfmt/primer05.cfm. Federal Highway Administration (2002). HERS-ST v20: Highway Economic Requirements System - State Version Technical Report. Federal Highway Administration, FHWA-IF-02-060,.
de Jong, Gerard, (2002), "Value of Freight Travel-Time Savings", in Hensher, D.A. and K.J. Button (eds.): Handbook of Transport Modelling, Elsevier.
Levinson, D. and B. Smalkoski (2003) "Value of Time for Commercial Vehicle Operators in Minnesota", University of Minnesota, TRB International Symposium on Road Pricing.
Mackie, PJ et al. Value of Travel Time Savings in the UK - Summary Report. Institute for Transport Studies, University of Leeds, for the UK Department for Transport, 2003. See: http://www.dft.gov.uk/stellent/groups/dft_transstrat/documents/pdf/dft_transstrat_pdf_022708. pdf
Mokhtarian, P., and I. Salomon, (2001) "How Derived is the Demand for Travel? Some Conceptual and Measurement Considerations" Transportation Research A, Vol. 35, No. 8, September, pp. 695-719. See: http://repositories.cdlib.org/itsdavis/UCD-ITS-REP-01-15/
Small, K. A (1992). Urban Transportation Economics. Hardwood Academic Publishers, Chur, Switzerland.
Small, K. A., R. Noland, X. Chu, D. Lewis (1999), "Valuation of Travel-Time Savings and Predictability in Congested Conditions for Highway User-Cost Estimation." NCHRP Report 431, Transportation Research Board.
Sullivan, E. (2002) “Continuation Study to Evaluate the Impacts of the SR 91 Value-Priced Express Lanes”. Final Report. State of California Department of Transportation. December. See: http://ceenve.calpoly.edu/sullivan/SR91/final_rpt/execsumm.pdf
Transport Canada (1994), “Guide to Benefit-Cost Analysis in Transport Canada”,. Economic Evaluation Branch, Transport Canada, Ottawa, 1994. See: http://www.tc.gc.ca/finance/BCA/en/TOC_e.htm
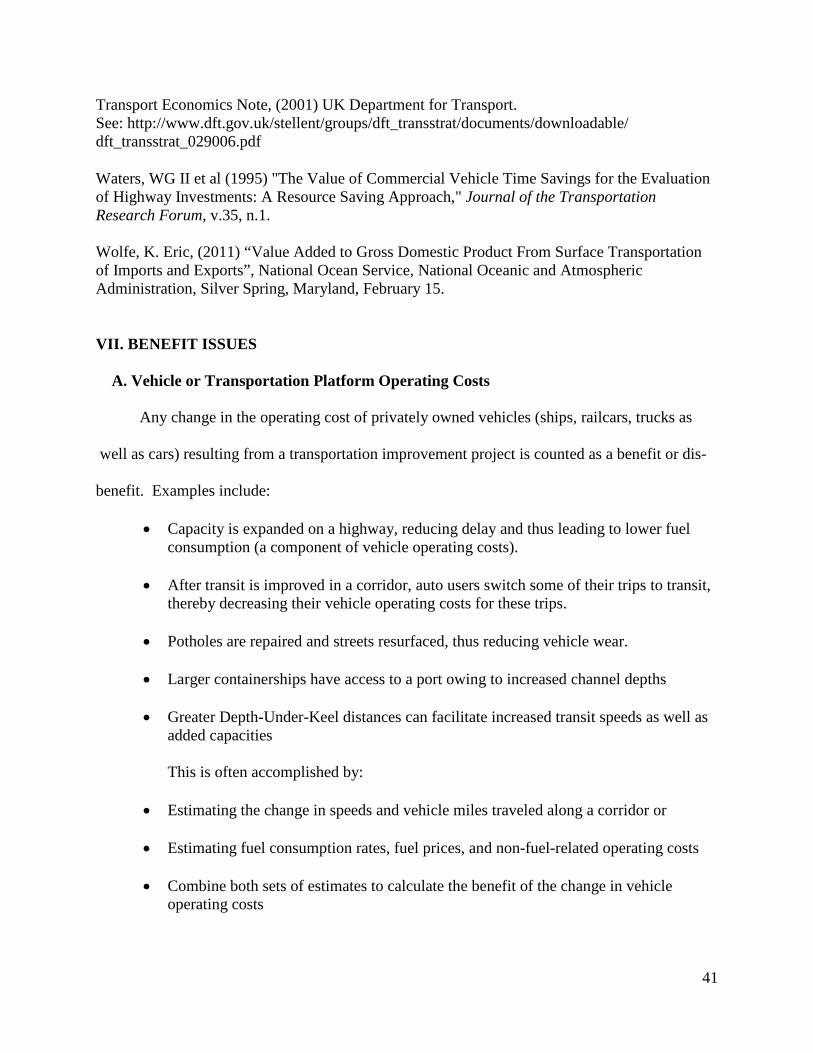
41
Transport Economics Note, (2001) UK Department for Transport. See: http://www.dft.gov.uk/stellent/groups/dft_transstrat/documents/downloadable/ dft_transstrat_029006.pdf
Waters, WG II et al (1995) "The Value of Commercial Vehicle Time Savings for the Evaluation of Highway Investments: A Resource Saving Approach," Journal of the Transportation Research Forum, v.35, n.1. Wolfe, K. Eric, (2011) “Value Added to Gross Domestic Product From Surface Transportation of Imports and Exports”, National Ocean Service, National Oceanic and Atmospheric Administration, Silver Spring, Maryland, February 15.
VII. BENEFIT ISSUES A. Vehicle or Transportation Platform Operating Costs Any change in the operating cost of privately owned vehicles (ships, railcars, trucks as well as cars) resulting from a transportation improvement project is counted as a benefit or dis- benefit. Examples include:
• Capacity is expanded on a highway, reducing delay and thus leading to lower fuel consumption (a component of vehicle operating costs).
• After transit is improved in a corridor, auto users switch some of their trips to transit, thereby decreasing their vehicle operating costs for these trips.
• Potholes are repaired and streets resurfaced, thus reducing vehicle wear.
• Larger containerships have access to a port owing to increased channel depths
• Greater Depth-Under-Keel distances can facilitate increased transit speeds as well as added capacities This is often accomplished by:
• Estimating the change in speeds and vehicle miles traveled along a corridor or
• Estimating fuel consumption rates, fuel prices, and non-fuel-related operating costs
• Combine both sets of estimates to calculate the benefit of the change in vehicle operating costs
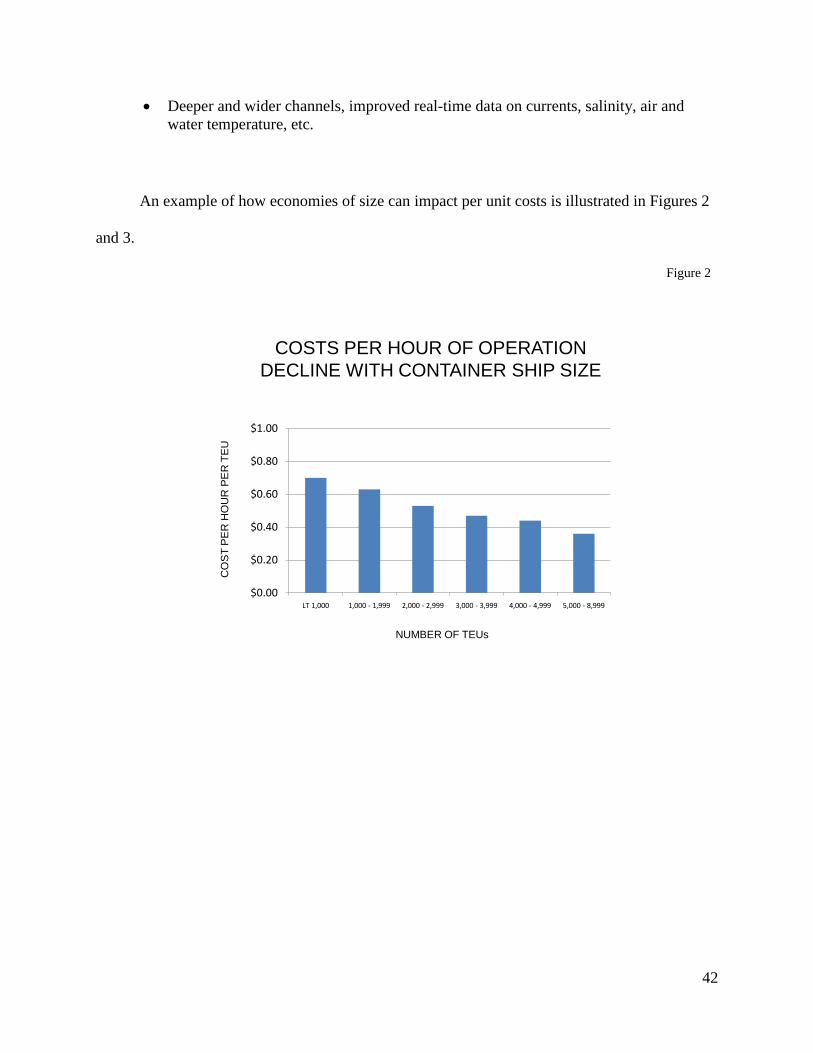
42
• Deeper and wider channels, improved real-time data on currents, salinity, air and water temperature, etc.
An example of how economies of size can impact per unit costs is illustrated in Figures 2
and 3.
Figure 2
COSTS PER HOUR OF OPERATION DECLINE WITH CONTAINER SHIP SIZE
$0.00
$0.20
$0.40
$0.60
$0.80
$1.00
LT 1,000 1,000 - 1,999 2,000 - 2,999 3,000 - 3,999 4,000 - 4,999 5,000 - 8,999
CO
ST
PE
R H
OU
R P
ER
TE
U
NUMBER OF TEUs
43
Figure 3
COSTS PER HOUR OF OPERATION DECLINE WITH ALL SHIP SIZES
$0.00
$0.01
$0.02
$0.03
$0.04
$0.05
DRY BULK 10-35K
DRY BULK 35-60K
DRY BULK 100-180K
TANK 10-60K
TANK 60-80K
TANK 120-200K
RO-RO 25K RO-RO 50K
CO
ST
PE
R H
OU
R P
ER
DW
T
TYPE OF SHIP AND NUMBER OF DWTs
Vehicle operating costs refer to travel costs that vary with vehicle usage and are based on
vehicle-miles traveled. These costs include fuel, tires, maintenance, repairs, and mileage-
dependent depreciation (Booz Allen & Hamilton, 1999). Costs that are not dependent on usage
(often called vehicle ownership costs) are ignored when estimating vehicle operating costs.
These may include insurance costs, time-dependent depreciation, financing, and storage. A
project that alters vehicle speeds, vehicle miles traveled, roadway surfaces, or roadway geometry
may affect travelers' vehicle operating costs and should thus be evaluated in a benefit-cost
analysis. On the other hand, water-borne transportation is often “costed by the hour” and sold
“by the ton”. It is not uncommon for a large ocean going vessel, operating at 22 knots may cost
several thousands of dollars per hour at sea. While these costs will be reduced when the ship is
at rest, it is not uncommon for costs in the hundreds of dollars per hour to be accrued. A recent
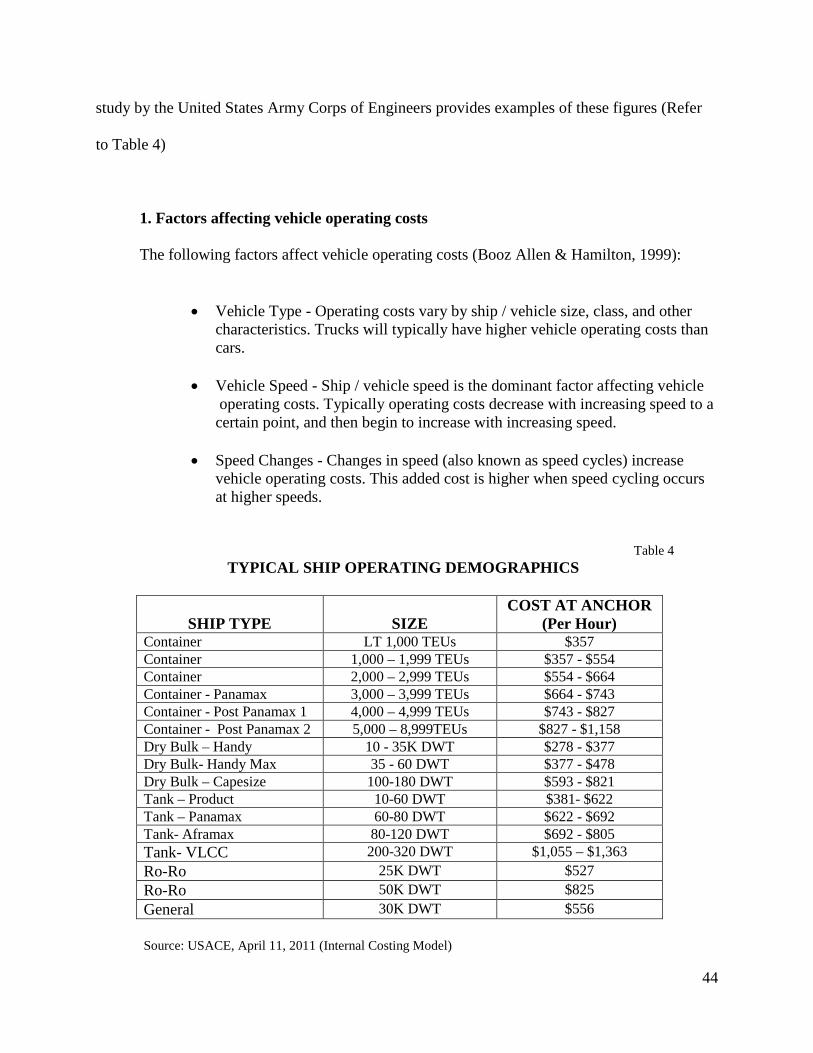
44
study by the United States Army Corps of Engineers provides examples of these figures (Refer
to Table 4)
1. Factors affecting vehicle operating costs
The following factors affect vehicle operating costs (Booz Allen & Hamilton, 1999):
• Vehicle Type - Operating costs vary by ship / vehicle size, class, and other characteristics. Trucks will typically have higher vehicle operating costs than cars.
• Vehicle Speed - Ship / vehicle speed is the dominant factor affecting vehicle operating costs. Typically operating costs decrease with increasing speed to a certain point, and then begin to increase with increasing speed.
• Speed Changes - Changes in speed (also known as speed cycles) increase vehicle operating costs. This added cost is higher when speed cycling occurs at higher speeds.
Table 4 TYPICAL SHIP OPERATING DEMOGRAPHICS
SHIP TYPE
SIZE
COST AT ANCHOR (Per Hour)
Container LT 1,000 TEUs $357 Container 1,000 – 1,999 TEUs $357 - $554 Container 2,000 – 2,999 TEUs $554 - $664 Container - Panamax 3,000 – 3,999 TEUs $664 - $743 Container - Post Panamax 1 4,000 – 4,999 TEUs $743 - $827 Container - Post Panamax 2 5,000 – 8,999TEUs $827 - $1,158 Dry Bulk – Handy 10 - 35K DWT $278 - $377 Dry Bulk- Handy Max 35 - 60 DWT $377 - $478 Dry Bulk – Capesize 100-180 DWT $593 - $821 Tank – Product 10-60 DWT $381- $622 Tank – Panamax 60-80 DWT $622 - $692 Tank- Aframax 80-120 DWT $692 - $805 Tank- VLCC 200-320 DWT $1,055 – $1,363 Ro-Ro 25K DWT $527 Ro-Ro 50K DWT $825 General 30K DWT $556
Source: USACE, April 11, 2011 (Internal Costing Model)
45
• Gradient - Grades can be either positive (uphill) or negative (downhill). Positive grades are more demanding on vehicle engines and require greater fuel consumption. This leads to an increase in operating costs. Negative grades may reduce operating costs, but may also increase wear on brakes. Water currents, weather and wave height are equivalent factors for water-born commerce.
• Curvature - A highway curve requires a greater output of energy from a vehicle to counter the centrifugal force. This, combined with additional wear on the vehicle's tires, leads to an increase in operating costs.
• Road Surface - The roughness of the road surface can affect vehicle operating costs by affecting rolling resistance. Rough surfaces can reduce speed, require greater fuel consumption, increase wear on tires, and increase maintenance costs.
Reference:
Booz-Allen & Hamilton Inc., (1999), California Life-Cycle Benefit/Cost Analysis Model (Cal-B/C)—Technical Supplement to User's Guide. California Department of Transportation. September.. See: http://www.dot.ca.gov/hq/tpp/offices/ote/benefit_files/tech_supp.pdf.
B. SAFETY
A change in accident rates (and associated morbidity and/or mortality) that results from a
transportation project has an economic value. Examples include:
• A pedestrian/bicycle bridge is built, eliminating a dangerous intersection crossing for pedestrians and bicyclists.
• Rumble strips are added to a freeway, reducing the number of drivers who veer off the road.
• A railroad crossing is moved above grade, eliminating conflicts between trains and pedestrian and vehicle traffic on the street.
• A sharp curve in a road is eliminated.
• Improved notification of impending storms for boaters
46
• Nautical charts which more accurately depict submerged hazards
This could be accomplished by choosing an appropriate estimate for the economic value of the losses, such as deaths, injury, and property damage; determining how the project would change the rate of such accidents; and, finally estimating the total economic value of the changes in accident rates. All transportation systems incur accidents that cause property damage, injury and death, both for users and non-users. Designers of transportation projects strive to reduce accidents, but because safety measures often cost money, not every safety measure can be used on every project. Benefit-cost analysis helps identify the most cost-effective safety improvement projects. Finding a project's safety benefits requires a dollar value to be assigned to human life and safety. This is perhaps the most controversial aspect of benefit-cost analysis. Many people find it offensive; others argue that any dollar value assigned to a human life would be too low. However, agencies have limits on the amount of money they can spend on safety improvements. Without a way to estimate the value of those improvements, they would not be able to prioritize projects. Agreeing on a value also helps make decisions about safety more consistent with one another. Federal and state agencies have developed their own estimates for the economic value of preventing accidents, so the first step in an analysis is to choose which estimates are appropriate. Next, estimate the change in accident rates that the project is expected to create. Finally, use these data to estimate the economic value of the project's safety benefits.
47
References: Bureau of Transportation Statistics. National Transportation Statistics 2003. U.S. Department of Transportation, See: http://www.bts.gov/publications/national_transportation_statistics/ de Blaeij, Raymond J.G.M., Florax, Piet Rietveld, and Erik Verhoef, (2003). "The Value of Statistical Life in Road Safety: A Meta-Analysis." Accident Analysis and Prevention 35, pp. 973-986.
Elvik, R, (2000). "How Much Do Road Accidents Cost the National Economy?" Accident Analysis and Prevention 32, pp. 849-851.
Federal Highway Administration (1991), "The Costs of Highway Crashes." Publication No. FHWA-RD-91-055. U.S. Department of Transportation, October.
Forkenbrock, D. J., and N. S.J. Foster (1997). "Accident Cost Saving and Highway Attributes." Transportation 24, pp. 79-100.
Forkenbrock, D. J., and G. E. Weisbrod (2001). Guidebook for Assessing the Social and Economic Effects of Transportation Projects. Transportation Research Board NCHRP Report 456. Washington, D.C. National Academy Press.. See: http://gulliver.trb.org/publications/nchrp/nchrp_rpt_456-a.pdf and http://gulliver.trb.org/publications/nchrp/nchrp_rpt_456-b.pdf.
Federal Highway Administration. Highway Statistics (2002). Federal Highway Administration Office of Highway Policy Information, See: http://www.fhwa.dot.gov/policy/ohim/hs02/index.htm.
Swerdloff, C., (2004), "Revision of Departmental Guidance on Treatment of the Value of Life and Injuries." , U.S. Department of Transportation, Office of Economic and Strategic Analysis, January. See: http://ostpxweb.dot.gov/policy/EconStrat/treatmentoflife.htm.
Trawén, A., P. Maraste, and U. Persson, (2002). "International Comparison of Costs of a Fatal Casualty of Road Accidents in 1990 and 1999." Accident Analysis and Prevention 34 pp. 323-332.
U.S. Department of Transportation (2002), "Revision of Departmental Guidance on Treatment of the Value of Life and Injuries." U.S. Department of Transportation Office of Economic and Strategic Analysis.. See: http://ostpxweb.dot.gov/VSL_background.htm. C. Emissions Vehicle and ship emissions created or removed by a project are counted as benefits or
48
dis-benefits. Examples include:
• A traffic artery is widened, increasing the vehicle miles traveled (VMT) for the street, but decreasing vehicle-hours on this and other streets.
• A transit system converts from diesel buses to compressed natural gas buses, reducing emissions.
• A vanpool program is created, reducing the number of vehicle trips.
• Requiring use of low-sulfur diesel oil in ships within 200 miles of California
• Barring use of drayage motor carriers in Long Beach unless that can pass 2010 emission standards.
To assign a dollar value to the benefits of a project:
• Choose an appropriate dollar value per unit of emissions.
• Estimate the changes in vehicle-miles, vehicle-hours and vehicle-trips for different classes of vehicles. Use a model to estimate the change in emissions that will result from the project.
• Based on the estimate, calculate the project's benefits.
The final step is to prioritize projects that would reduce emissions:
• Determine the cost of each alternative.
• Estimate the change in vehicle miles traveled (VMT), vehicle-trips, and vehicle/ship hours that will result from each project.
• Calculate the cost of the project per unit of emissions.
Emissions from vehicles and ships cause significant damage to the environment and to
human health. People who are exposed to high levels of emissions may suffer from respiratory
disease, lung damage, or even cancer. Emissions can also reduce visibility, and cause lower crop
yields in agricultural areas. They contribute to global climate change as well—a more remote but
49
perhaps more serious threat.
All motor vehicles in use today, whether they run on diesel fuel, gasoline, or an
alternative fuel like compressed natural gas, create emissions. Even electric cars, trains, and
buses are responsible for emissions, since the electricity they use is often generated by burning
coal or other fossil fuels. Using electric vehicles merely changes the location affected by the
emissions. Because the emissions are located at a power plant rather than distributed across
many different roads, some argue that emissions control can be more easily affected.
Most benefit-cost analysis of emissions focus on the effects of air pollution on human
health, since these are better understood and therefore easier to quantify. An analysis typically
considers the following types of emissions:
• Carbon monoxide (CO): A gas that reduces the ability of blood to carry oxygen
• Nitrogen oxides (NOx): Compounds, some of which are toxic, that combine with VOC in sunlight, causing ozone to form Sulfur oxides (SOX): Lung irritants that contribute to acid rain
• Volatile organic compounds (VOC): Compounds, some of which are toxic, that combine with NOx in sunlight, causing ozone to form
• Fine particulates (PM10): Very small particles that can be inhaled and damage the lungs
Regardless of whether a project will increase or reduce emissions, a benefit-cost model
can be used to estimate any change in emissions and calculate its positive or negative benefit.
For projects that reduce emissions, the cost-effectiveness of several projects can be compared by
finding the cost of each unit of pollution reduction.
1. Environmental effects of emissions
Emissions also have other environmental effects that are more difficult to quantify. These
50
should be acknowledged in the project analysis even though they cannot be included easily in a
benefit-cost ratio. If there are negative benefits that require mitigation, the cost of mitigation
should be included in the project's overall cost.
2. Climate
Perhaps the most serious long-term threat posed by vehicle emissions is global climate
change, which threatens to alter many natural systems in unpredictable ways. Carbon dioxide
(CO2), which is produced during the combustion of gasoline, natural gas, and most other fuels, is
one of the largest contributors to climate change. Unlike other environmental impacts from
transportation projects, climate change affects everyone, no matter how distant they are from the
project. Because climate change has so many unknown implications, it is very difficult to
calculate the climate change benefits that will result from a single project. However, some
models such as STEAM 2.0 and Cal-B/C attempt to do so.22
3. Crop yields
Hydrocarbons and nitrogen oxides combine with sunlight to create ozone, which reduces
the efficiency of photosynthesis in plants. This effect reduces crop yields on farmlands with high
concentrations of ambient ozone. For this reason, a project that improves air quality in an
agricultural area is likely to make farm land more productive, and a project that makes air quality
worse will probably reduce crop yields. A 1996 study by UC Davis's Institute of Transportation
22 U.S. Department of Transportation, Federal Highway Administration, “Surface transportation Efficiency Analysis Model” (STEAM) STEAM 2.0 is based on the principles of economic analysis, and allows development of monetized impact estimates for a wide range of transportation investments and policies, including major capital projects, pricing and travel demand management (TDM). Impact measures are monetized to the extent feasible, but quantitative estimates of natural resource usage (i.e., energy consumption) and environmental impacts (i.e., emissions) are also provided. Net monetary benefits (or costs) of alternatives can then be used to evaluate trade-offs against non-monetizable benefits, including sustainability and community livability. Cal/B/C was developed by the California Department of Transportation and is used to conduct life-cycle benefit/cost analysis for proposed state highway and public transit projects.
51
Studies estimated that pollution from motor vehicles causes $2 billion-$4 billion in agricultural
damages per year.
There is no widely accepted way to estimate the dollar value of the changes in crop yields
that result from changes in emissions. Be aware, though, that transportation projects around
farmland can have effects on crop yields.
References:
Booz-Allen & Hamilton Inc. (1999) California Life-Cycle Benefit/Cost Analysis Model (Cal-B/C) Technical Supplement to User's Guide. California Department of Transportation (Caltrans), See: http://www.dot.ca.gov/hq/tpp/tools_files/tech_supp.pdf.
Burmich, P. (2003), "Methods to Find the Cost-Effectiveness of Funding Air Quality Projects." California Environmental Protection Agency Air Resources Board and California Department of Transportation (Caltrans). See: http://www.arb.ca.gov/planning/tsaq/eval/hc03v2.pdf
Delucchi, M., J. Murphy, J. Kim, and D. McCubbin (1996). "The Cost of Crop Damage Caused By Ozone Air Pollution From Motor Vehicles." Institute of Transportation Studies, University of California, Davis, report UCD-ITS-RR-96-3 (12).
Forkenbrock, D. J., and L. A. Schweitzer (1999). "Environmental Justice in Transportation Planning." Journal of the American Planning Association 65(1), pp. 96-111.
McCubbin, D. R., and M. A. Delucchi (1996) The Social Cost of the Health Effects of Motor-Vehicle Air Pollution." Institute of Transportation Studies, University of California, Davis, report UCD-ITS-RR-96-3 (11).
Murphy, J., and M. Delucchi (1998). "A Review of the Literature on the Social Cost of Motor Vehicle Use in the United States." Journal of Transportation and Statistics. January, pp. 15-42.
Small, K. A., and C. Kazimi (1995),"On the Costs of Air Pollution from Motor Vehicles." Journal of Transport Economics and Policy XXIX(1), pp. 7-32.
Zhou, H., and D. Sperling (2001), "Traffic Emission Pollution Sampling and Analysis on Urban Streets with High-Rising Buildings." Transportation Research Part D 6, pp. 269-281.
52
D. Greenhouse Gases Perhaps the most serious long-term threat posed by vehicle emissions is global climate
change, which threatens to alter many natural systems in unpredictable ways. Carbon dioxide
(CO2), which is produced during the combustion of gasoline, natural gas, and most other fuels, is
one of the largest contributors to climate change. Unlike other environmental impacts from
transportation projects, climate change affects everyone, no matter how distant they are from the
project.
The US Department of Energy releases an annual greenhouse gas emissions report. The
2007 report shows that the majority of greenhouse emissions produced by vehicles are in the
form of CO2. Non-CO2 emissions include methane and nitrous oxide emissions from mobile
source combustion and hydrofluorocarbon (HFC-134a) emissions from vehicle air-conditioning
units. The report notes that the transportation sector has led all sectors in the emission of CO2
since 1999. A general diagram of greenhouse gas emissions in the US economy are shown in
Figure 4.
1. Emission rates
The California Air Resources Board (CARB) is responsible for maintaining and updating
California's Greenhouse Gas (GHG) Inventory. The GHG Inventory provides estimates of GHGs
caused by human activities. CARB recently released a query tool for assessing the inventory
values. The current GHG Inventory covers the years 1990 to 2004, and includes estimates for
carbon dioxide (CO2), methane (CH4), nitrous oxide (N2O), sulfur hexafluoride (SF6),
hydrofluorocarbons (HFCs), and perfluorocarbons (PFCs) - the “six Kyoto gases.” The GHG
inventory provided the basis for developing a 1990 statewide emissions level and 2020 emissions
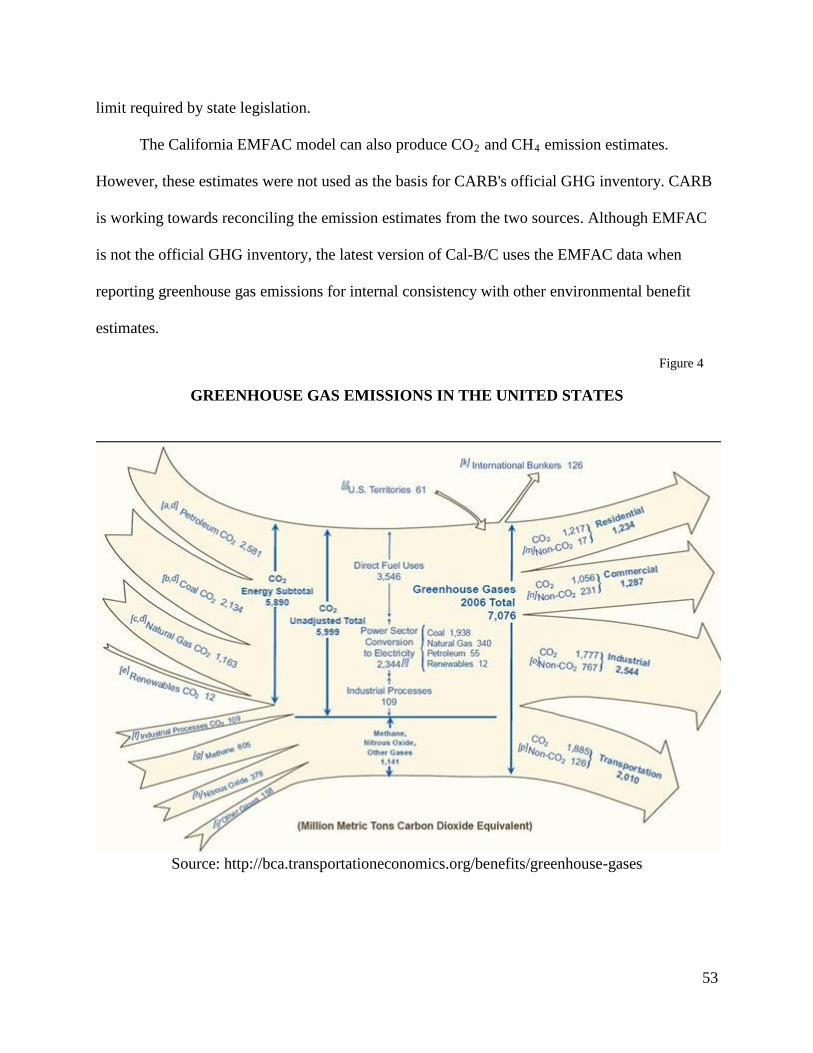
53
limit required by state legislation.
The California EMFAC model can also produce CO2 and CH4 emission estimates.
However, these estimates were not used as the basis for CARB's official GHG inventory. CARB
is working towards reconciling the emission estimates from the two sources. Although EMFAC
is not the official GHG inventory, the latest version of Cal-B/C uses the EMFAC data when
reporting greenhouse gas emissions for internal consistency with other environmental benefit
estimates.
Figure 4
GREENHOUSE GAS EMISSIONS IN THE UNITED STATES
Source: http://bca.transportationeconomics.org/benefits/greenhouse-gases
54
2. Emission values
Economists are still trying to price the social cost of greenhouse gases. One approach is to
examine the carbon trading markets. For example, the European Union has operated the
Emissions Trading Scheme (ETS) since 2005. Other countries, such as Canada and Australia,
have opened “cap-and-trade” schemes in anticipation of future regulation. The United States
already has a voluntary carbon market, but efforts to develop greenhouse gas regulations in the
United States have floundered to date. By allowing companies to exchange carbon emission
credits, these cap-and-trade schemes are intended to lower the cost of mitigation measures to the
most economically efficient levels. One could consider extracting a value of greenhouse
emissions from such trading schemes. However, the carbon values on the markets reflect the cost
of mitigation rather than the social costs of greenhouse gases. If greenhouse gas regulations are
set at a socially optimal level, the cost of mitigation should not exceed the social costs of the
pollution itself.
Perhaps the most comprehensive greenhouse gas emissions research has taken place in the
United Kingdom. The United Kingdom (UK) government has required a Carbon Impact
Assessment to be included in economic appraisals since 2003 as documented in the UK
Treasury’s Appraisal and Evaluation in Central Government (or “Green Book”). In 2005, the UK
Treasury sponsored an extensive review of the economics of climate change. The UK
Department for Environment Food and Rural Affairs (DEFRA) is tasked with valuing
greenhouse gas emissions. With the help of AEA Technology, DEFRA developed an interim
value using a social cost of carbon methodology. Since December 2007, DEFRA has adopted a
more expansive approach based on the shadow price of carbon. The valuation reflects the full
global cost of an incremental ton of CO2 equivalent (CO2e) emissions from the time of
55
production to the damage it imposes over the whole of its time in the atmosphere. DEFRA has
estimated future values, subjected the values to academic peer review, and published guidelines
on the differences in the social cost and shadow prices as well as how to use the shadow price of
carbon in policy appraisals (DEFRA 2007). DEFRA also maintains a website documenting all of
its efforts to value greenhouse gas emissions.
The DEFRA approach relies on a shadow price per metric ton of CO2e emitted in the
Year 2000 and valued in 2000 dollars. The Stern Review shows that this price is $30 per metric
ton
of CO2e.23 This value is increased by two percent per year to reflect the increasing cumulative
damage to the world environment each year. The value also increases due to inflation. Further
information on the DEFRA approach can be found in the publication “How to use the Shadow
Price of Carbon in policy appraisal,” which is available on the DEFRA website. The publication
also provides global warming potential factors for converting greenhouse gases into carbon
dioxide equivalents. These factors could be used if methane or other greenhouse gas emissions
need to be included in the benefit-cost analysis.
References:
Energy Information Administration (2007), Office of Integrated Analysis and Forecasting, US Department of Energy, Emissions of Greenhouse Gases in the United States 2006, November. National Commission on Energy Policy (2007), Allocating Allowances in a Greenhouse Gas Trading System, See: www.energycommision.org. 23 The Stern Review on the Economics of Climate Change is a 700-page report released for the British government on October 30, 2006 by economist Nicholas Stern, chair of the Grantham Research Institute on Climate Change and the Environment at the London School of Economics and also chair of the Centre for Climate Change Economics and Policy (CCCEP) at Leeds University and LSE. The report discusses the effect of global warming on the world economy. Although not the first economic report on climate change, it is significant as the largest and most widely known and discussed report of its kind.
56
United Kingdom Department for Environment, (2007) Food, and Rural Affairs, Economics Group, How to Use the Shadow Price of Carbon in Policy Appraisal, accessed December 23. United Kingdom Department for Environment (2007), Food, and Rural Affairs, Economics Group, The Social Cost of Carbon and the Shadow Price of Carbon: What They Are, and How to Use Them in Economic Appraisal in the UK, December.
E. Travel Time Reliability The economic benefits from improved travel time reliability are appearing more commonly in benefit-cost analyses. There are a number of different potential causes of travel time reliability, including demand, special events, weather, and incidents. To incorporate travel time reliability in benefit-cost analysis, the following are needed:
• A measure for travel time reliability
• A value for reliability
• A method for predicting future reliability
• A method for estimating changes in reliability due to an initiative (e.g., deeper channels).
With some exceptions, most researchers seem to agree that the standard deviation (or
coefficient of variation) of travel time is the measure of reliability most applicable to benefit-cost
analysis. However, there are compounding issues, such as the need for travelers to include a
buffer time that may have a lower value of reliability. From the commercial aspect, “just-in-
time” inventory management coupled with the high-fixed cost nature of surface transportation
operations (especially rail and water) place special emphasis on transit time reliability.
F. Noise
57
Any increase or decrease in noise caused by a transportation improvement project has an economic value. Examples include:
• A new onramp is added to a freeway, increasing noise around the onramp.
• An airport changes its flight paths, creating more flyovers in a residential neighborhood.
• A sound wall is built between a busy street and a residential neighborhood to reduce noise in the neighborhood.
• A new unit coal train which sounds its horn at all grade crossings regardless of the time of day.
This can be accomplished by estimating how much noise there will be at each affected
location for each project alternative compared to the base case. If the amount of noise is high,
consider whether noise abatement measures are needed. Determine the cost of noise abatement,
and include it in the cost of the corresponding alternatives. Determine the value of the net change
in noise levels for each project alternative (after any noise mitigation measures are taken). If
noise is significantly decreased or increased, its net value is included as a benefit (or dis-
benefit).
Traffic noise is more than a nuisance. Researchers have found that excessive noise can
impair people's hearing, disturb their sleep, and harm their overall sense of well-being. In
addition, increases in traffic noise can reduce the property value of nearby homes.
When a transportation project has the potential to add significant amounts of traffic to an
area, a traffic noise analysis may be required to determine the project's noise impact. If the
impact is significant, the costs of noise abatement measures, such as sound walls, may need to be
included as part of the cost-benefit analysis.
58
It is difficult to assign a dollar value to noise impacts, and the difference in noise between
project alternatives may be small. For most projects, it is sufficient to estimate how much noise
there will be when the project is complete, choose appropriate abatement methods, and include
the cost of abatement in the cost of the project. For very large projects that drastically increase
noise (such as a new freeway built in a residential neighborhood) or reduce noise (such as
construction of a sound wall), it may be appropriate to use a hedonic price model or a contingent
valuation study. (Refer to Table 2)
While not often a direct dis-benefit associated with marine transportation, land-based
infrastructure required to support water-based transport can be a source of noise pollution.
Drayage motor carrier activity at a container port or Federal Railroad Administration
requirements for trains to sound their whistles at grade crossings are examples.
References:
Becker, N. and D. Lavee (2003). "The Benefits and Costs of Noise Reduction." Journal of Environmental Planning and Management 46(1), pp. 97-111.
Berglund, B., T. Lindvall, and D. H. Schwela (ed.) (2002), Guidelines for Community Noise. World Health Organization.
California Department of Transportation (Caltrans). "Some Frequently Asked Questions About Highway Traffic Noise Analysis & Abatement." See: http://www.dot.ca.gov/hq/env/noise/pub/FAQ.pdf.
Hendriks, R. (1998) Technical Noise Supplement: A Technical Supplement to the Traffic Noise Analysis Protocol. California Department of Transportation (Caltrans), See: http://www.dot.ca.gov/hq/env/noise/pub/Technical%20Noise%20Supplement.pdf.
Federal Highway Administration (1995), Highway Traffic Noise Analysis and Abatement Policy and Guidance. Federal Highway Administration Office of Environment and Planning, Noise and Air Quality Branch, June. See: http://www.fhwa.dot.gov/environment/polguid.pdf
Navrud, Ståle (2003). "State-of-the-Art on Economic Valuation of Noise." Paper presented at the WCE/WHO Pan-European Program on Transport, Health, and Environment, Stockholm, June. See: http://www.fhi.se/pdf/navrud.pdf
59
Nijland, H.A., E.E.M.M. Van Kempen, G.P. Van Wee, and J. Jabben (2003). "Costs and Benefits of Noise Abatement Measures." Transport Policy 10, pp.131-140.
Schomer, Paul (2001),. "Assessment of Noise Annoyance." Schomer and Associates, April. See: http://www.nonoise.org/library/schomer/assessmentofnoiseannoyance.pdf. G. Habitat and Water Quality The effects that a project has on the environment, in addition to changes in noise levels
and emissions, should be considered. Disruption of habitats and reduced water quality are the
most significant environmental impacts. Additional impacts might include reductions in
recreational water use (e.g., diminished fishing, swimming, etc.), whale watching, etc. Examples
include:
• A bridge is built over a river, creating runoff from the roadbed during storms.
• A road is constructed through the middle of an animal habitat, impeding animal movement through the area.
• Placement of dredged spoils to deepen a channel.
Like noise and emissions, habitat and water quality projects can have many environmental
implication. Some of these impacts are simply difficult to quantify, even with methods like
hedonic price models or contingent valuation.
1. Disruption of habitats
Transportation corridors can divide animal habitats, making it difficult for animals to
move freely without being struck and killed by vehicles. Such disruption can divide an animal
60
population into smaller, less stable groups that may have difficulty surviving. Construction can
also disrupt habitats, even if the completed project is unlikely to do so. If a transportation project
is constructed near an animal habitat, it may be necessary to include features that help animals
cross the corridor, such as tunnels under or above a roadway. Also, animals may need to be
shielded from noise, runoff, and visual impacts of construction. Special care must be taken if the
habitat of a threatened or endangered species is involved.
2. Water quality
Transportation projects can have significant effects on water quality. Motor vehicles, for
example, deposit particles of rubber, oil, and other pollutants on roads; when it rains, these
pollutants are washed into the areas around the road. In some cases, the storm water may flow
through drains directly to a river, lake, or bay, or it may contaminate groundwater or the water in
a wetland area. Impacts can be lessened by diverting storm water away from sensitive habitats or
into sewer systems that treat the water before discharge into waterways. The land use impacts of
transportation projects can also affect water quality and availability by making the ground less
permeable, thus increasing runoff.
Marine services can have a more direct effect on water quality. Dredging is often
required before marine service can begin, which can increase chemical contamination as polluted
sediment is disturbed. Both international and local marine transport (e.g., cruise lines and
ferries) can also spill diesel fuel, one of the most toxic types of oil, directly into the water.
Disgorgement of ballast waters and ineffective sewage treatment have added to the problem.
References:
Booz-Allen & Hamilton Inc. (1999) California Life-Cycle Benefit/Cost Analysis Model (Cal-B/C) Technical Supplement to User's Guide. California Department of Transportation (Caltrans).
61
See: http://www.dot.ca.gov/hq/tpp/tools_files/tech_supp.pdf.
Federal Highway Administration (No Date). "Keeping It Simple: Easy Ways to Help Wildlife Along Roads." See: http://www.fhwa.dot.gov/environment/wildlifeprotection/index.cfm? fuseaction=home.viewTopics.
Finch, G, (2000). "Critter Crossings: Linking Habitats and Reducing Roadkill." Federal Highway Administration Publication No. FHWA-EP-004. See: http://www.fhwa.dot.gov/environment/wildlifecrossings/intro.htm.
Forkenbrock, D. J., and G. E. Weisbrod (2001). Guidebook for Assessing the Social and Economic Effects of Transportation Projects. Transportation Research Board NCHRP Report 456, Washington, D.C., National Academy Press. Available at: http://gulliver.trb.org/publications/nchrp/nchrp_rpt_456-a.pdf and http://gulliver.trb.org/publications/nchrp/nchrp_rpt_456-b.pdf.
McHarg, I., (1969), Design With Nature. Garden City, NY: Natural History Press, 1969.
Water Transit Authority (2003), "Final Program Environmental Impact Report: Expansion of Ferry Transit Service in the San Francisco Bay Area", See: http://www.watertransit.org/eir_download.shtml.
H. Economic Effects The effects that a project has on business operating cost are net profitability, and
household cost of living. Extreme due diligence must be exercised to avoid double counting of
economic cost savings that are already counted in travel time, travel cost, emission or safety
benefits. In general, these are additional economic effects that accrue to non-travelers who are
nonetheless dependent on transportation system performance. Examples include:
• A new highway increases the accessibility of a local community to outside communities and regions. For businesses, this can mean access to a greater selection of specialized workforce skills and specialized materials, and in some cases a greater range of customers for their specialized products. That may enable greater "economies of scale" in production processes, which means higher productivity through lower costs per unit of output.
• For workers, enhanced accessibility can also mean availability of broader job options that may be a better fit to their skills, while residents have access to broader choices of recreation and culture, as well as consumer goods and services. That may directly
62
increase net income, or indirectly increase wealth as a result of increased housing values.
• An upgrade to transportation facilities and services leads to greater reliability of travel time. For businesses, this can mean reduced need to pad delivery schedules to allow for delay uncertainty, leading to tighter scheduling that increases worker and vehicle productivity. It can also mean reduced need for keeping backup inventory. The end result may be a reduction in logistics and scheduling costs that is above-and-beyond the savings in average travel time costs.
• New transportation links between cities and ports, and new types of inter-modal facilities and services at those locations, make it possible for new patterns of international trade to develop. In some cases, the new links may improve the efficiency of business customer/client visits as well as product deliveries. The end result may be greater productivity for businesses at the affected sites.
In all of the above examples, the benefits flow to parties that depend on transportation
facilities and services for their activities. In some cases, the ultimate beneficiary is the business
operation that can achieve operating cost savings or greater productivity (output per unit of cost).
In the case of cargo deliveries, the beneficiaries may be senders and receivers rather than the
transportation company that actually does the traveling.
It is also possible to account for many business operations and scheduling benefits, as well
as logistics benefits and production economies of scale, as additions to the valuation of travel
time benefits for truck trips. Alternatively, they can be addressed separately as additional
economic benefits.
Finally, it is important to note that there are many broader forms of economic impacts on
communities, regions and states — in which transportation facilities lead to business expansion,
additional job creation and additional tax revenues. Those economic impacts reflect a
combination of the productivity benefits discussed here and broader business attraction impacts
that also affect local economies.
63
I. Community Impacts – Construction Dis-benefits Most transportation projects today are not new facilities but instead improvements on or
replacements of existing facilities. Any construction along a transportation corridor is likely to
impose negative benefits to the public in the form of an increase in travel times, a decrease in
travel time reliability, an increase in vehicle operating costs, an increase in air pollution, an
increase in traffic accidents, and/or an increase in noise. These effects are referred to here as dis-
benefits of Construction (Transport Canada (1994)) refers to these negative benefits as
"Transitional Effects" in their guide to benefit-cost analysis). If these negative benefits are
present in a transportation project, their effects should be included in a benefit-cost analysis.
The same methods used to evaluate the benefits of a transportation project can be used to
estimate the effects of construction. For example, if a project's construction slows vehicle speeds
along a freeway for one year, the change in speeds and the volume of traffic can be used to
calculate the value of the change in travel times, changes in vehicle emissions, and changes in
vehicle operating costs. If the project creates more hazardous road conditions, an increase in
accidents should be taken into account. The negative benefits associated with noise can also be
estimated. These benefits (most likely negative) should be added to the overall benefits of the
project.
The magnitude of the negative benefits associated with construction can be a significant
determinant in choosing transportation project alternatives, particularly if different construction
methods are considered. For example, in the case of widening an arterial, if construction is
performed at night, some of the negative effects on congestion could be avoided. However,
64
nighttime construction could be more costly (due to increased labor costs, etc.). A thorough
benefit-cost analysis would account for these differences and aid in selecting the most cost-
effective construction method.
J. Sensitivity Analysis
Running throughout all potential benefit estimates is the fact that these are “forecasts”
based on current optimum knowledge of historical relationships. One of the greatest pitfalls of
BCA is overstatement of benefits. This pitfall can be mitigated through use of sensitivity
analyses where a series or range of benefits attributable to the initiative’s implementation are
calculated. Nordhaus (1986) states that
“all of the studies I know of the value of perfect information find its value to be on the order of
one percent of the value of output. For example,... one study found that if you halve the standard
error of precipitation and temperature, say from one percent to half percent, or one degree to one-
half a degree, you get an improvement in the value of the output on the order of 2 percent of the
value of wheat production. A study of cotton gave the same order of magnitude. I have looked at
a number of studies in the area of nuclear power and energy, trying to determine the value of
knowing whether nuclear power is ever going to pan out. Again, perfect information is worth on
the order of one percent of the value of the output. From these kinds of studies, then, we find the
value of information is not zero, but it is not enormous either.” 24
Failure to identify alternative benefit scenarios along with their anticipated probability of
occurrence can result in significant differences between the “calculated” BC ratio and the actual
24 Page 130.
65
BC ratio. This is also where potential short and long-term changes in the system can be
identified and prudently evaluated as part of the overall due diligence process (e.g., variations in
the adoption or acceptance of a new or revised deliverable by recreational boaters). Assignment
of probabilities to alternative benefit scenarios can result in a more informed “expected value” of
total benefits.
References:
Nordhaus, William D (1986), "The Value of Information," in Richard Krasnow, ed., Policy Aspects of Climate Forecasting (Washington, DC, Resources for the Future), RFF Proceedings, March 4, 129-134.
Transport Canada (1994) Guide to Benefit-Cost Analysis in Transport Canada. Economic Evaluation Branch, Transport Canada, Ottawa. See: http://www.tc.gc.ca/finance/BCA/en/TOC_e.htm.
VIII. COSTS
Ideally, the literature suggests that total “life-cycle” costs be investigated in BCA
analysis. In this manner, the totality of costs including development, implementation, operation
and dismantling costs can be included. As costs are rarely perfectly linear (e.g., the same for
each year of the initiative’s useful economic life), failure to include other than “operational
costs” can significantly understate total costs.
A. Initial Costs
A project's initial costs are those that are incurred during the design and construction
process. They can include any of the following:
• Planning, preliminary engineering, and project design
66
• Environmental impact report
• Project-related staff training
• Final engineering
• Land acquisition
• Construction costs, including improvements to existing facilities
• Equipment and vehicle purchases
• Equipment required for project operation (for example, wireless transponders for electronic toll collection)
• Decommissioning costs for facilities that are no longer needed
For project alternatives that use new and relatively unproven technologies, special care is
needed to develop realistic estimates of the initial costs. It may be appropriate to perform a
sensitivity analysis to determine how higher costs for unanticipated changes to the design would
affect the project's cost efficiency.
Projects that are dependent on one another should be considered together if possible. The
same is true for projects that will be completed in several phases. When interdependent projects
cannot be analyzed as a single entity, care should be given to proper accounting of the relevant
joint costs. For example, if a project proposes to expand a wharf so that it can accommodate
larger ships, the analysis should include an appropriate share of the cost of any dredging needed
to allow the ships to reach the wharf, even though the dredged channel will also be used by
vessels destined to other nearby facilities.
For projects with optional additional phases, only the first phase of the project should be
analyzed, since there is no guarantee that the future phases will ever be implemented. However,
the first phase might be compared to an alternative that combines other phases. This will give
67
decision-makers an idea of the role of subsequent phases in the overall efficiency of the project.
If the project will use resources already owned by the agency, the opportunity costs of
these resources should be included. The opportunity cost is the value of the resource in its best
alternate use. For example, if the project uses land that could otherwise be sold, include as a cost
the net proceeds if the property were sold. Another example of opportunity costs would be staff
time that would otherwise be spent on other work. However, do not include the costs of
resources already owned by the agency that have no opportunity costs. An example might be
loop detectors installed in the roadway. Such costs are referred to as sunk costs.25 The treatment
of inflation should be consistent over all benefits and costs. If a legitimate case can be made for
increased benefits or costs that differ from one another, different inflation rates may be used.26
All costs and benefits should be either in constant/real dollars or in inflated/current dollars. For
public sector evaluation, standard practice is to exclude normal inflation and express all costs
(and benefits) in constant/real dollars.
References:
Transport Canada (1994). Guide to Benefit-Cost Analysis in Transport Canada. Transport Canada Report TP 11875E, September. See:: http://www.tc.gc.ca/finance/BCA/en/TOC_e.htm.
Weisbrod, G., and B. Weisbrod (1997). "Assessing the Economic Impact of Transportation Projects: How to Choose the Appropriate Technique for Your Project." Transportation Research Circular No. 477, October.
Zerbe, Jr., R. O., and D. D. Dively (1994). Benefit-Cost Analysis in Theory and Practice. New York, HarperCollins.
25 Interest costs should not be included in the initial costs. These costs are included implicitly in the discount rate.
26 For example, gross benefits may be inflated owing to predicted population growth patterns (e.g., 1 percent per year) while energy costs may be forecast at a different rate.
68
B. Continuing and Maintenance Costs
A project incurs continuing costs after the facility is completed and while it is in use. These can include costs for any of the following:
• Operations (Traffic management, toll taking, bus operations, and terminal operations).
• Maintenance (Routine servicing of equipment and facilities (sometimes referred to as preventive maintenance), repair and cleanup required by accidents or adverse weather)
• Rehabilitation (Infrequent major repairs of facilities, such as street resurfacing. Rehabilitation does not typically include reconstruction, which is treated as a project in its own right.)
Typically these costs include, but are not limited to the following: (1) Labor (including all benefit costs); (2) Materials and supplies; (3) Equipment; (4) Utilities; (5) Rent and lease payments; and, (6) Contract services.
Depreciation is not included in the costs; future expenditures (recapitalization) for
replacement should be used instead. Only the marginal cost incurred because of the project
should be included. For example, costs of an administration building to be used by people
managing a new rail line, but already used by an agency for other purposes, would not be
included. Any additional utilities or cleaning services required by the added people would be
included.
C. Rehabilitation Costs A project's rehabilitation costs include the future cost of repairs and improvements beyond
69
routine maintenance. Paving a road with asphalt is being compared with repaving with concrete.
The latter has higher initial costs but also has a longer life before it needs rehabilitation. The
decision must be made whether to include major rehabilitation within a project's scope or defer
to a future date and address major rehabilitation through a separate benefit-cost analysis. If the
cost of rehabilitation is generally predictable in advance and the nature of the rehabilitation is
fairly well known, rehabilitation should be included as part of the original project, and the
project life extended accordingly. Otherwise, the original project life should extend to the point
where rehabilitation will be required and a separate analysis performed at that time.
D. End of Project Costs Costs that are incurred at the end of a project or period of analysis can include residual
value (a negative cost) which is the estimated value of project assets at the end of the period of
analysis, representing their expected value in continuing use. Salvage value (a negative cost) is
the estimated value of an asset in cases where there exists a market for selling the asset while
close-out costs are incurred at the end of the project's operation to put the project "to bed,"
assuming the analysis period coincides with the project's operation period. These costs are
relevant to benefit-cost analysis if a project is analyzed over a limited length of time or if two
alternative projects have very different service periods or physical components with very
different life spans. Examples include:
• Comparing public ownership and operation of a transit or rail service to contracting with a private operator for service: In the first case, the public agency will have assets with residual and salvage values (rolling stock, rights-of-way and facilities) at the end of the analysis period. In the second case, it will have no such assets.
• An agency considering a new bus route: At the end of the analysis period, the agency will own the buses and any special facilities used for the route. These will have salvage value because they can be sold.
70
• Setting up a temporary container-storage center until a shipping terminal can be
expanded: Different storage centers may have different close-out costs, because the different parcels of land may require different treatments to put them into suitable shape for reuse or resale after the center is closed.
Most transportation projects, such as roads, transit systems, and terminal facilities, are in
service for a very long time. Equipment may wear out and be replaced, but the project does not
end. In such cases, "end of project" costs are not important because the project does not end and
therefore does not have salvage or close-out costs. The residual values of alternate investments
are closely related to their values during the period of analysis so that including them would not
affect the relative attractiveness of alternate proposals. However, if a project alternative has
substantial end of project value that is different from other alternatives or if the end of project
value is large relative to the total costs, then it may be appropriate to consider these components.
Note that an end of project cost is the net value of the assets. For example, buses may be sold,
but the cost of selling them should be deducted from the proceeds. Finally, end of project costs
should be discounted in the same manner as other costs.
E. Sensitivity Analysis
Equally import as benefit estimation, provision of a range of costs provides the researcher
with a more realistic basis upon which BCAs can be calculated. Cost over-runs and under-runs
are a potential feature of any program. Failure to identify alternative cost scenarios along with
their anticipated probability of occurrence can result in significant differences between the
“calculated” BC ratio and the actual BC ratio. This is where potential short and long-term
shocks to the system can be identified and prudently evaluated as part of the overall due
diligence process (e.g., impact of crude oil energy price spike, international crisis resulting from
71
a natural disaster). Assignment of probabilities to alternative cost scenarios can result in a more
informed “expected value” of total costs.
IX. COMMON PROBLEMS AND PITFALLS
The accuracy of the outcome of a cost–benefit analysis depends on how accurately costs
and benefits have been estimated. A study of the accuracy of cost estimates in transportation
infrastructure planning found that for rail projects actual costs turned out to be on average 44.7
percent higher than estimated costs, and for roads 20.4 percent higher (Flyvbjerg, Holm, and
Buhl, 2002). For benefits, another peer-reviewed study (Ackerman et.al 2005) found that actual
rail ridership was on average 51.4 percent lower than estimated ridership; for roads it was found
that for half of all projects estimated traffic was wrong by more than 20 percent (Flyvbjerg,
Holm, and Buhl, 2005). Comparative studies indicate that similar inaccuracies apply to fields
other than transportation. These studies indicate that the outcomes of cost–benefit analyses
should be treated with caution because they may be highly inaccurate. Inaccurate cost–benefit
analyses likely to lead to inefficient decisions, as defined by Pareto and Kaldor-Hicks efficiency
.These outcomes (almost always tending to underestimation unless significant new approaches
are overlooked) are to be expected because such estimates:
• Rely heavily on past like projects (often differing markedly in function or size and certainly in the skill levels of the team members)
• Rely heavily on the project's members to identify (remember from their collective past experiences) the significant cost drivers
• Rely on very crude heuristics to estimate the money cost of the intangible elements
• Are unable to completely dispel the usually unconscious biases of the team members (who often have a vested interest in a decision to go ahead) and the natural psychological tendency to "think positive" (whatever that involves)
72
Reference class forecasting was developed to increase accuracy in estimates of costs and
benefits. The process predicts the outcome of a planned action based on actual outcomes in a
reference class of similar actions to that being forecast.27 Reference class forecasting for a
specific project involves the following three steps:
• Identify a reference class of past, similar projects.
• Establish a probability distribution for the selected reference class for the parameter that is being forecast.
• Compare the specific project with the reference class distribution, in order to establish the most likely outcome for the specific project.
In 2005, the American Planning Association (APA) endorsed reference class forecasting and recommended that planners should never rely solely on conventional forecasting techniques:
"APA encourages planners to use reference class forecasting in addition to traditional methods as a way to improve accuracy. The reference class forecasting method is beneficial for non-routine projects ... Planners should never rely solely on civil engineering technology as a way to generate project forecasts" (the American Planning Association 2005).
Another challenge to cost–benefit analysis comes from determining which costs should be
included in an analysis (the significant cost drivers). This is often controversial because
organizations or interest groups may think that some costs should be included or excluded from a
study. In the case of the Ford Pinto (where, because of design flaws, the Pinto was liable to burst into flames in a rear-impact collision), the Ford company's decision was not to issue a recall.
Ford's cost–benefit analysis had estimated that based on the number of cars in use and the
probable accident rate, deaths due to the design flaw would run about $49.5 million (the amount
27 See: http://www.sbs.ox.ac.uk/centres/bt/Documents/Curbing Optimism Bias and Strategic Misrepresentation.pdf
73
Ford would pay out of court to settle wrongful death lawsuits). This was estimated to be less than the cost of issuing a recall ($137.5 million).28 In the event, Ford overlooked (or considered
insignificant) the costs of the negative publicity so engendered, which turned out to be quite significant (because it led to the recall anyway and to measurable losses in sales).
A. Moral Values
Zerbe (2005) states that the most widespread and trenchant criticism of BCA is that it
ignores important values (Anderson (1993), Fried (1978), Kelman (1981), and Smart and
Williams, 1973).29 He delineates these values include equity, fairness, integrity, altruism, and
concern for the welfare of future generations and that moral sentiments also include immoral
sentiments as might arise when one wishes harm to others. One may care about others as a result
of kinship, empathy, envy or hatred or as a matter of justice. Charity can be an expression of
moral sentiment. One may care about others from their perspective (one cares about their utility
function) and this is called non-paternalistic altruism. One may care about others from one's own
perspective, as when a parent requires a child to eat spinach when the child would rather not.
This is paternalistic altruism. One may have an existence value for goods unrelated to their use
or to goods based on their use or appreciation by others that can reflect either paternalistic or
non-paternalistic altruism or both. According to Johansson (1992), nonuse values such as
bequest values and benevolence toward friends and relatives are claimed to account for 50 to 75
percent of the total willingness to pay (WTP) for environmental projects.
Moral values can, however, be incorporated into BCA in a way that is consistent with the
treatment of values attached to ordinary goods. Zerbe’s suggestion (1998, 2001, 2004) is that all
goods should be included in economics analysis for which there is a willingness to pay (WTP).
References:
28 See: http://www.safetyforum.com/fordfuelfires/
29 Zerbe, Jr. Richard (2005) “Should Moral Sentiments Be Incorporated into Benefit-Cost Analysis? An Example
of Long-Term Discounting”, University of Washington white paper, June.
74
Anderson, E. (1993). Value in Ethics and Economics. Cambridge, MA: Cambridge: Harvard University Press, p 146. Ackerman et al. (2005). Applying Cost-Benefit to Past Decisions: Was environmental protection ever a good idea. Administrative Law Review. American Planning Association (2005), “JAPA Article Calls on Planners to Help End Inaccuracies in Public Project Revenue Forecasting”, News Release, April 7.
Bent Flyvbjerg, Mette K. Skamris Holm, and Søren L. Buhl, (2002) "Underestimating Costs in Public Works Projects: Error or Lie?" Journal of the American Planning Association, vol. 68, no. 3, Summer, pp. 279–295.
Bent Flyvbjerg, Mette K. Skamris Holm, and Søren L. Buhl, (2005) "How (In)accurate Are Demand Forecasts in Public Works Projects? The Case of Transportation." Journal of the American Planning Association, vol. 71, no. 2, Spring, pp. 131–146. Fried, C. (1978). Right and Wrong. Cambridge, MA: Harvard University Press, p 93.
Johansson, P. (1992). "Altruism in Cost-Benefit Analysis," Environmental and Resource Economics 2: pp. 605-613.
Kelman, S. (1981). "Cost-Benefit Analysis: An Ethical Critique," Regulations(1) pp- 33-40. Smart, J. C. and Williams, B. (1973). Utilitarianism- For and Against. Cambridge: Cambridge University Press. Zerbe, R. O., Jr. (1991). "Comment: Does Benefit-Cost Analysis Stand Alone? Rights and Standing," Journal of Policy Analysis and Management 10(1): pp. 96-105.
Zerbe, R. O., Jr. (1998a). "An Integration of Equity and Efficiency," Washington Law Review 73 (April): pp. 349-361.
Zerbe, R. O., Jr. (1998b). "Is Cost-Benefit Analysis Legal? Three Rules," Journal of Policy Analysis and Management 17(3): pp. 419-456. Zerbe, R. O., Jr. (2001). Economic Efficiency in Law and Economics. Aldershot England: Edward Elgar.
Zerbe, R. O., Jr. (2002). "Can Law and Economics Stand the Purchase of Moral Satisfaction?," Research in Law and Economics Volume 20, pp.135-172.
Zerbe, R. O., Jr. and Dively, D. (1994). Benefit-Cost Analysis in Theory and Practice. New York: Harper Collins.
Zerbe, R. O., Jr. and Knott, S., (2004). "Economic Efficiency and Equity in the Merger of
75
Superior Propane with ICG Propane: A Case Study," Research in Law and Economics, Vol. 20, pp.135-172.
B. Problems With BCA Specifications
Goldsmith and Hildyard (1984) cite numerous instances where the governing body made
use of unrealistic assumptions regarding costs and benefits. In a variety of examples, they show
how these misspecifications often advanced initiatives that could not have been economically
justified alone. Although it is understood that programs may be undertaken to remedy a variety
of social problems for political reasons, they stress the need to accurately understand the
implications of BCA assumptions.
President Jimmy Carter, he told a rally held to oppose plans to build a dam at New
Melones in California stating:
"In many of the Corps of Engineers' dam projects around the nation, the benefit / cost ratios have been grossly distorted. Data and promises on which project approvals are sought are erroneous and outdated. False justifications of projects are attempted.
A GAO analysis of the Sprewell Bluff dam project on the Flint River in Georgia
indicated vividly the fallacies in existing Corps of Engineers analysis procedures. Construction
costs were underestimated, extremely low interest rates were assumed, nearby lakes were
ignored, population projections were exaggerated, environmental damage was concealed, power
production estimates were based on overloaded generator ratings, no archaeological losses are
included, and major recreation benefits were claimed in spite of official opposition from state
and federal recreation agencies. Similar distortions exist in the New Melones project."30
30 Quoted in T. Palmer, (1982) Stanislaus, the struggle for a River, University of California Press, Berkeley, page 102.
76
The GAO report referred to by Carter was the result of an independent audit by
Congress's watchdog agency of a cross section of seven dam projects then being undertaken in
the US.31 It contained some stinging criticisms of the major dam building agencies. Julian
McCaull, former editor of Environment, reported:
"The study shows many specific instances in which sponsoring agencies, intent on having the projects authorized, overstated expected annual monetary gains to be realized from water management activities such as flood control, irrigation, generation of electricity and outdoor recreation. At the same time, estimated costs were sharply underestimated for annual operation and maintenance of the projects, reservoir-flooding of productive land, and loss of out-door recreation sites."32
In one case, the US Army Corps of Engineers claimed that Missouri's Pattonsburg Lake
Project would bring $1.1 million a year in agricultural benefits. In sharp contrast, the US
Department of Agriculture estimated that the project would result in an annual loss of $1 million
a year through the destruction of existing agricultural land and the loss of business to local farm
industries. Typically, the Corps chose its own figures for the purpose of its cost-benefit analysis.
It also claimed $198,700 worth of flood control benefits and $413,000 worth of water supply
benefits without any documented evidence to support either claim.33
In another instance, the Corps claimed $65,000 worth of benefits a year in irrigation from
the Lost Creek Lake Project on Oregon's Rogue River. Yet, McCaull reported that those
irrigation facilities would have had to be provided "by a separate project, the proposal for which
was subsequently shelved without ever being presented to Congress."34
31 Comptroller General of the United States (1974), Improvements Needed in Making Benefit-Cost Analyses for Federal Water Resource Projects, U.S. General Accounting Office, No. B-16794, Washington, D.C., September. 32 Julian McCaull (1975), “Dams of Pork”, Environment, Volume 17, Number 1, Jan/Feb, Page 11. 33 Ibid, Pages 13-14. 34 Ibid, Page 13.
77
In a similar vein, the Corps boosted the project's hydroelectric potential by including:
"not only the economic value of on-site generating capacity of 14,100 kilowatts, but also the
value of 10,500 kilowatts which might be added in the future (but which had not been formally
proposed to Congress) at some other site in the Rogue River Basin, and which might then be
used to supplement the Lost Creek capacity."
Reviewing the Final Environmental Statement (FES) submitted by the US Bureau of
Reclamation in support of its Garrison Diversion Project, the Washington-based Institute of
Ecology concluded that the scheme had "no economic justification".35 Under the scheme, a 77-
mile open channel and a string of dams are being built in order to channel the waters of the
Missouri River to a massive reservoir for the purpose of irrigating some 250,000 acres.
Initially authorized in 1946, the Tennessee-Tom Bigbee (Tenn-Tom) Canal was intended
to link the Tennessee and Tombigbee Rivers at a cost of $316 million. George Laycock reported:
"When the calculations were completed, the cost-benefit ratio came out at 1.24 to 1. To reach that profit making conclusion, the engineers had tossed in all the benefit ingredients they could justify from among those allowed by Congress, including several million dollars for recreation, fish and wildlife 'enhancement' and wage payments to those employed to work on the canal." [12]
By 1976, however, the benefit-cost ratio had fallen to 1.08 to 1 -and even that ratio, claim
critics, was only achieved by underestimating costs and over-estimating benefits. Thus, in 1981,
R. Jeffery Smith reported in Science:
"In 1976 ... the Corps and its economic consultant, A. T. Kearney of Chicago, found several dozen firms in the region of the waterway who said they planned to use it after it was completed. Early in 1981, the General Accounting Office contacted 17 of these firms - representing the bulk of the predicted shipments -and discovered that only about half were still interested. The GAO found that some of the predictions 'were not based on 'definite' company plans.' In other instances, the GAO said, Kearney's estimating
35 Quoted by Onno Kremers (1975), “Prairie Madness: the Garrison Diversion, Alternatives, Winter, Page 29.
78
practices 'may have been too liberal'."36
By 1981, the cost of the project had leapt to 1 billion dollars - and a further $960 million
dollars was estimated to be necessary to straighten and widen the third leg of the canal in order to
avoid bottlenecks.
"Other hidden federal project costs detected by the GAO could include as much as $31.5 million to soften the waterways impact on fish and wildlife: $360 million to deepen and widen the port of Mobile where barges will enter the Gulf: and $48 million to construct waterway-related recreational facilities. Mississippi and Alabama, which are obligated under federal water project rules to spend $170 million for highway and bridge relocations, are actually receiving $90 million of this amount from the Federal Department of Transport ... None of these costs are included in the Corp's cost-benefit calculations. 37
Despite such criticisms, however, Congress voted in 1981 to continue with the project – at the cost of $10 million a month - on the grounds that construction work on the canal had proceeded too far to put an end to it. Stopping the project, commented one of the scheme's backers, would leave behind "the largest swamp in America". References: Goldsmith, Edward and Nicholas Hildyard, (1984) Published as Chapter 20 of “The Social and Environmental Effects of Large Dams”, Volume 1 Overview, Wadebridge Ecological Centre, Worthvale, Manor Camelford, Cornwall, PL32 9TT, UK.
X. CONCLUSIONS
Clearly, from the literature reviewed, “more is better”. , in a perfect world where time
and monetary resources were not in short supply, initiative life-cycle review could provide
timely, accurate and complete estimates of both benefits and costs. From these numbers, BCA
rations could be developed and employed with due diligence and an eye toward legal Employing
both government and private entity recommendations results in a number of tenets which can be
36 R. Jeffrey Amith, (1981), “The Waterway that Cannot be Stopped”, Science, Volume 213, August 14th, Page 741. 37 Ibid, Page 742.
79
described as “best practices”. Goldsmith and Hildyard (1984) caution against the following (at
the fifty-thousand foot level) These include:
• Over estimation of: - job-creation potential - life of deliverable or program - benefits from recreation, transportation, noise, safety, environment, irrigation, flood control, climate, trip / time reduction & reliability - other primary economic benefits - secondary and tertiary (multiplier) economic benefits - non-market benefits - failure to identify dis-benefits - adoption rates by beneficiaries
• Under estimation of: - unrealistic low discount rates - energy costs associated with construction - maintenance and operation costs - decommissioning costs - construction costs - support costs for operation - economics of scale, density, etc. on existing systems (dis and pro costs) - Life-cycle costs (owing to shortened estimations)
• Omitting differential inflation of costs and benefits
• Inaccurate joint cost/benefit sharing
• Logic Model - Understanding and explaining causality (versus simple correlation)
• Lack of sensitivity analyses (or beta “risk” estimate impacts)
• Unilateral absolute analysis in lieu of marginal analysis
From these recommendations and guidelines, a series of transportation-related studies
performed by academics, practitioners and laypersons were reviewed and summarized within the
following “best practices” matrix (Refer to Table 5):
Column 1 – Author & Year of Article
80
Column 2 – What was Evaluated? Column 3 – Transportation Mode(s) investigated
Column 4 – Location(s) of Study Column 5 – Method(s) of Investigation (Benefits or cost only, Benefit-Cost, Cost Effectiveness, Other) Column 6 – How benefit and cost data collected Column 7 – Benefits
Column 8 - Costs Column 9 - Strengths of study Column 10 – Weaknesses of study
In conclusion, Weisbrod and Weisbrod (1997) best encapsulate what has been suggested throughout the literature base as prudent to assess in order to achieve “best practices” when they state:
“Benefit Cost analysis for new services should be evaluated with a period of time from the start of financing through the life span of the project”; and, “Research studies of existing services should be evaluated with a period of time including pre- and post-project periods.” 38
Of the 26 studies reviewed to date, the one on runway extension in Wisconsin (by
Economic Development Research Group (2001)) is one of the best in terms of adherence to best
practices.
38 Weisbrod, Glen, and Burton Weisbrod, (1997), “Assessing the Economic Impact of Transportation Projects – How to Choose the Appropriate Technique for Your Project”, National Research Council, Transportation Research Board, Circular Number 477, October. Source: Table 3, page 14. (Choosing the Correct Study Period).

81
While time and monetary resources are clearly legitimate factors that can limit the degree
to which recommended best practices can be followed, it is clear from the literature that the
farther one gets from such ideals, the lower the persuasive impact the study may have on its
intended audience.
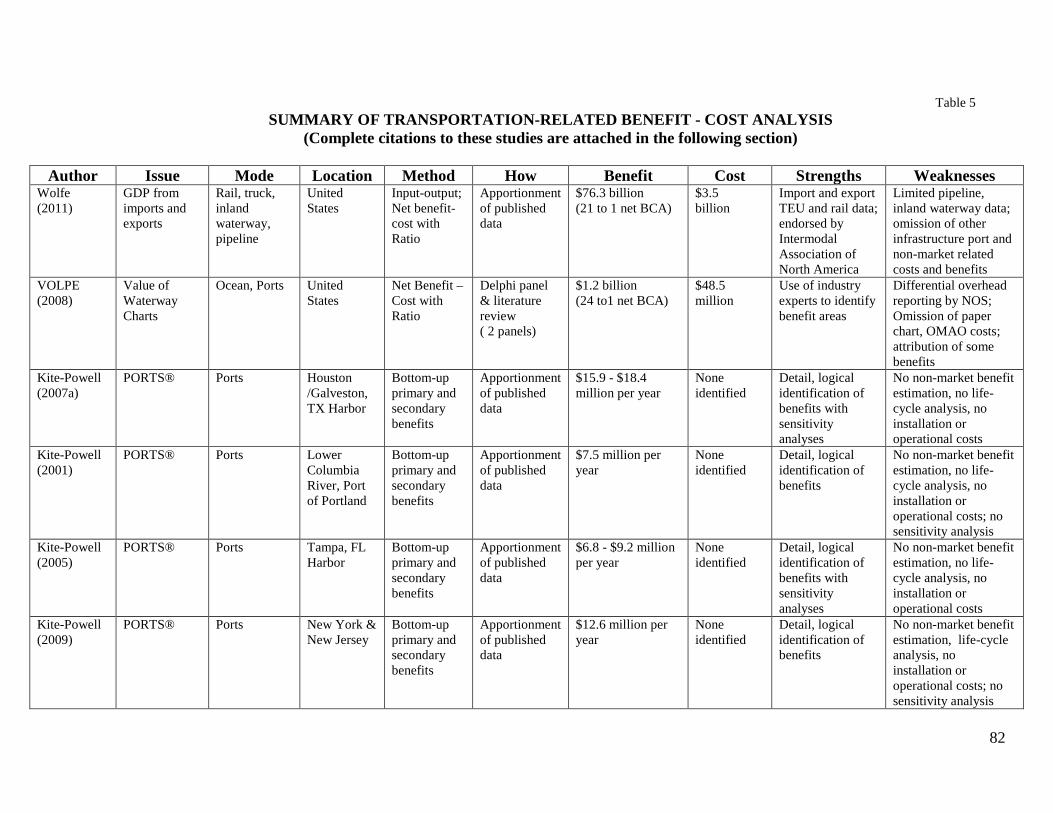
82
Table 5 SUMMARY OF TRANSPORTATION-RELATED BENEFIT - COST ANALYSIS
(Complete citations to these studies are attached in the following section)
Author Issue Mode Location Method How Benefit Cost Strengths Weaknesses Wolfe (2011)
GDP from imports and exports
Rail, truck, inland waterway, pipeline
United States
Input-output; Net benefit-cost with Ratio
Apportionment of published data
$76.3 billion (21 to 1 net BCA)
$3.5 billion
Import and export TEU and rail data; endorsed by Intermodal Association of North America
Limited pipeline, inland waterway data; omission of other infrastructure port and non-market related costs and benefits
VOLPE (2008)
Value of Waterway Charts
Ocean, Ports United States
Net Benefit –Cost with Ratio
Delphi panel & literature review ( 2 panels)
$1.2 billion (24 to1 net BCA)
$48.5 million
Use of industry experts to identify benefit areas
Differential overhead reporting by NOS; Omission of paper chart, OMAO costs; attribution of some benefits
Kite-Powell (2007a)
PORTS® Ports Houston /Galveston, TX Harbor
Bottom-up primary and secondary benefits
Apportionment of published data
$15.9 - $18.4 million per year
None identified
Detail, logical identification of benefits with sensitivity analyses
No non-market benefit estimation, no life-cycle analysis, no installation or operational costs
Kite-Powell (2001)
PORTS® Ports Lower Columbia River, Port of Portland
Bottom-up primary and secondary benefits
Apportionment of published data
$7.5 million per year
None identified
Detail, logical identification of benefits
No non-market benefit estimation, no life-cycle analysis, no installation or operational costs; no sensitivity analysis
Kite-Powell (2005)
PORTS® Ports Tampa, FL Harbor
Bottom-up primary and secondary benefits
Apportionment of published data
$6.8 - $9.2 million per year
None identified
Detail, logical identification of benefits with sensitivity analyses
No non-market benefit estimation, no life-cycle analysis, no installation or operational costs
Kite-Powell (2009)
PORTS® Ports New York & New Jersey
Bottom-up primary and secondary benefits
Apportionment of published data
$12.6 million per year
None identified
Detail, logical identification of benefits
No non-market benefit estimation, life-cycle analysis, no installation or operational costs; no sensitivity analysis
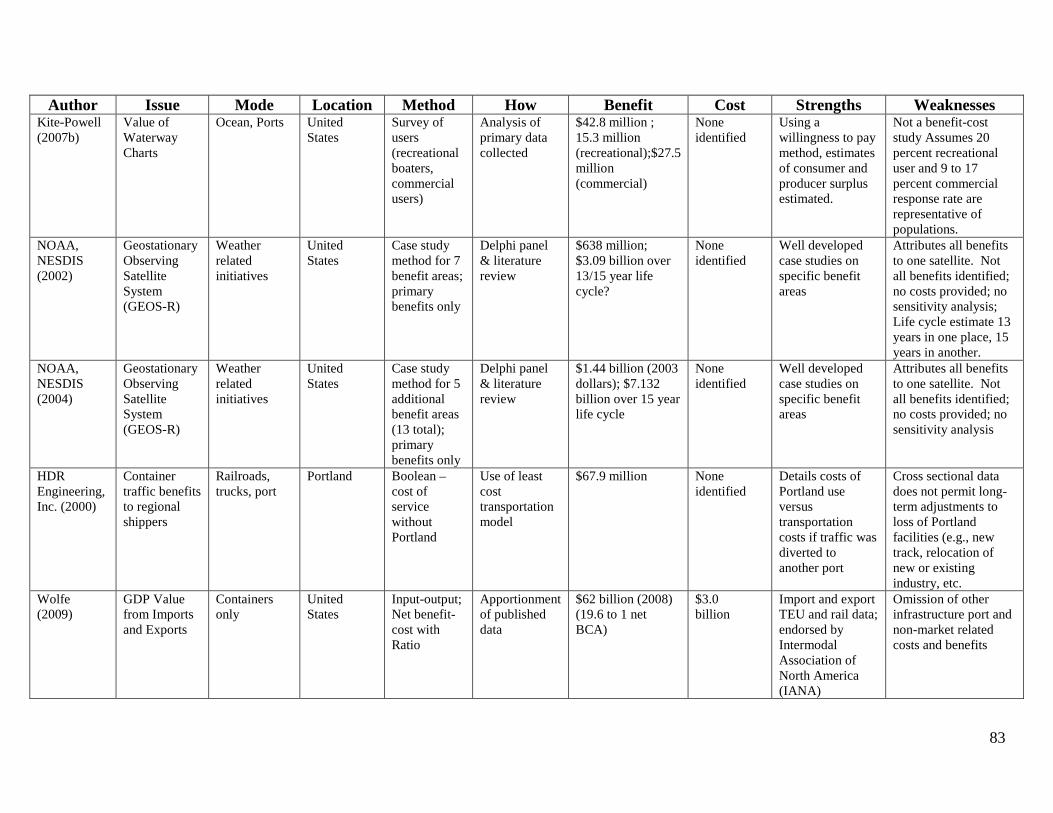
83
Author Issue Mode Location Method How Benefit Cost Strengths Weaknesses Kite-Powell (2007b)
Value of Waterway Charts
Ocean, Ports United States
Survey of users (recreational boaters, commercial users)
Analysis of primary data collected
$42.8 million ; 15.3 million (recreational);$27.5 million (commercial)
None identified
Using a willingness to pay method, estimates of consumer and producer surplus estimated.
Not a benefit-cost study Assumes 20 percent recreational user and 9 to 17 percent commercial response rate are representative of populations.
NOAA, NESDIS (2002)
Geostationary Observing Satellite System (GEOS-R)
Weather related initiatives
United States
Case study method for 7 benefit areas; primary benefits only
Delphi panel & literature review
$638 million; $3.09 billion over 13/15 year life cycle?
None identified
Well developed case studies on specific benefit areas
Attributes all benefits to one satellite. Not all benefits identified; no costs provided; no sensitivity analysis; Life cycle estimate 13 years in one place, 15 years in another.
NOAA, NESDIS (2004)
Geostationary Observing Satellite System (GEOS-R)
Weather related initiatives
United States
Case study method for 5 additional benefit areas (13 total); primary benefits only
Delphi panel & literature review
$1.44 billion (2003 dollars); $7.132 billion over 15 year life cycle
None identified
Well developed case studies on specific benefit areas
Attributes all benefits to one satellite. Not all benefits identified; no costs provided; no sensitivity analysis
HDR Engineering, Inc. (2000)
Container traffic benefits to regional shippers
Railroads, trucks, port
Portland Boolean – cost of service without Portland
Use of least cost transportation model
$67.9 million None identified
Details costs of Portland use versus transportation costs if traffic was diverted to another port
Cross sectional data does not permit long-term adjustments to loss of Portland facilities (e.g., new track, relocation of new or existing industry, etc.
Wolfe (2009)
GDP Value from Imports and Exports
Containers only
United States
Input-output; Net benefit-cost with Ratio
Apportionment of published data
$62 billion (2008) (19.6 to 1 net BCA)
$3.0 billion
Import and export TEU and rail data; endorsed by Intermodal Association of North America (IANA)
Omission of other infrastructure port and non-market related costs and benefits
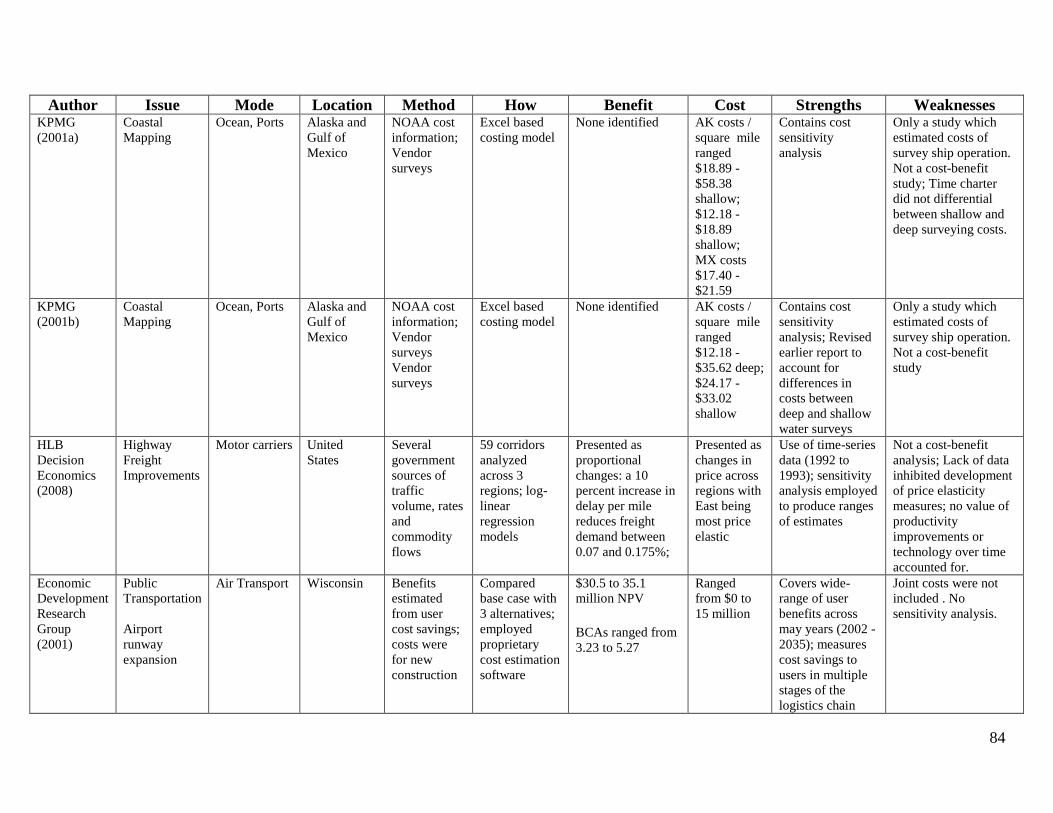
84
Author Issue Mode Location Method How Benefit Cost Strengths Weaknesses KPMG (2001a)
Coastal Mapping
Ocean, Ports Alaska and Gulf of Mexico
NOAA cost information; Vendor surveys
Excel based costing model
None identified AK costs / square mile ranged $18.89 - $58.38 shallow; $12.18 - $18.89 shallow; MX costs $17.40 -$21.59
Contains cost sensitivity analysis
Only a study which estimated costs of survey ship operation. Not a cost-benefit study; Time charter did not differential between shallow and deep surveying costs.
KPMG (2001b)
Coastal Mapping
Ocean, Ports Alaska and Gulf of Mexico
NOAA cost information; Vendor surveys Vendor surveys
Excel based costing model
None identified AK costs / square mile ranged $12.18 - $35.62 deep; $24.17 - $33.02 shallow
Contains cost sensitivity analysis; Revised earlier report to account for differences in costs between deep and shallow water surveys
Only a study which estimated costs of survey ship operation. Not a cost-benefit study
HLB Decision Economics (2008)
Highway Freight Improvements
Motor carriers United States
Several government sources of traffic volume, rates and commodity flows
59 corridors analyzed across 3 regions; log-linear regression models
Presented as proportional changes: a 10 percent increase in delay per mile reduces freight demand between 0.07 and 0.175%;
Presented as changes in price across regions with East being most price elastic
Use of time-series data (1992 to 1993); sensitivity analysis employed to produce ranges of estimates
Not a cost-benefit analysis; Lack of data inhibited development of price elasticity measures; no value of productivity improvements or technology over time accounted for.
Economic Development Research Group (2001)
Public Transportation Airport runway expansion
Air Transport Wisconsin Benefits estimated from user cost savings; costs were for new construction
Compared base case with 3 alternatives; employed proprietary cost estimation software
$30.5 to 35.1 million NPV
BCAs ranged from 3.23 to 5.27
Ranged from $0 to 15 million
Covers wide-range of user benefits across may years (2002 - 2035); measures cost savings to users in multiple stages of the logistics chain
Joint costs were not included . No sensitivity analysis.
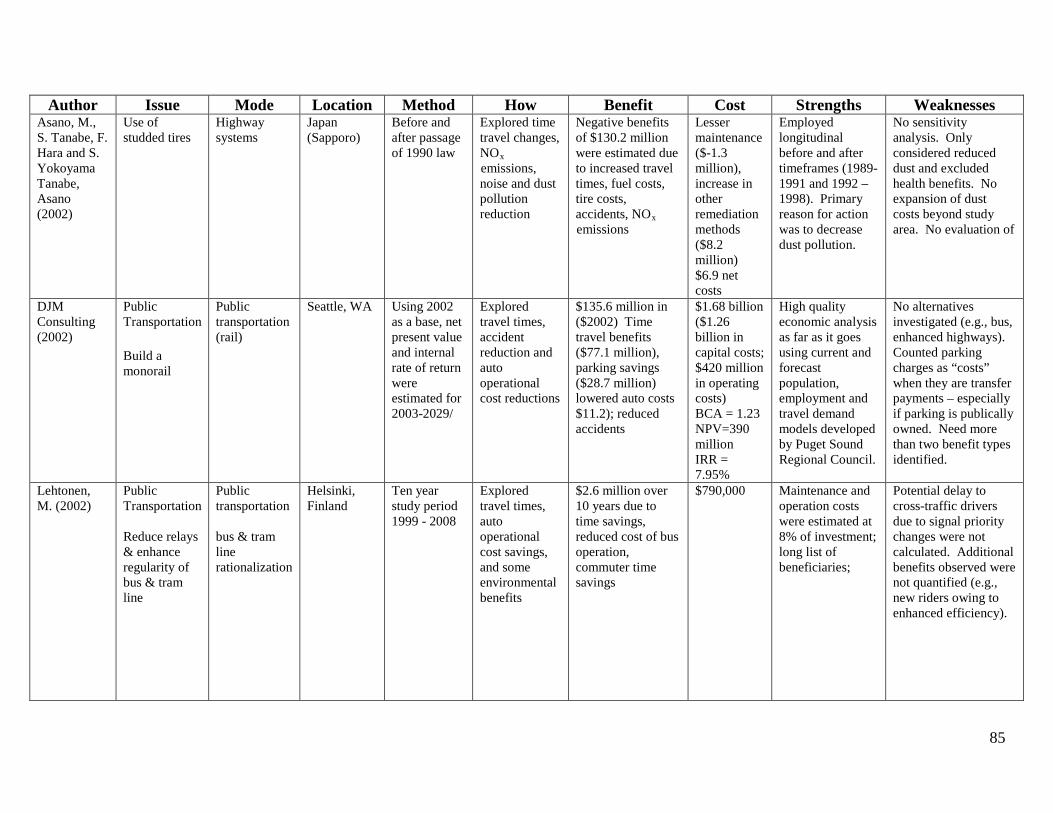
85
Author Issue Mode Location Method How Benefit Cost Strengths Weaknesses Asano, M., S. Tanabe, F. Hara and S. Yokoyama Tanabe, Asano (2002)
Use of studded tires
Highway systems
Japan (Sapporo)
Before and after passage of 1990 law
Explored time travel changes, NOx emissions, noise and dust pollution reduction
Negative benefits of $130.2 million were estimated due to increased travel times, fuel costs, tire costs, accidents, NOx emissions
Lesser maintenance ($-1.3 million), increase in other remediation methods ($8.2 million) $6.9 net costs
Employed longitudinal before and after timeframes (1989-1991 and 1992 – 1998). Primary reason for action was to decrease dust pollution.
No sensitivity analysis. Only considered reduced dust and excluded health benefits. No expansion of dust costs beyond study area. No evaluation of
DJM Consulting (2002)
Public Transportation
Build a monorail
Public transportation (rail)
Seattle, WA Using 2002 as a base, net present value and internal rate of return were estimated for 2003-2029/
Explored travel times, accident reduction and auto operational cost reductions
$135.6 million in ($2002) Time travel benefits ($77.1 million), parking savings ($28.7 million) lowered auto costs $11.2); reduced accidents
$1.68 billion ($1.26 billion in capital costs; $420 million in operating costs) BCA = 1.23 NPV=390 million IRR = 7.95%
High quality economic analysis as far as it goes using current and forecast population, employment and travel demand models developed by Puget Sound Regional Council.
No alternatives investigated (e.g., bus, enhanced highways). Counted parking charges as “costs” when they are transfer payments – especially if parking is publically owned. Need more than two benefit types identified.
Lehtonen, M. (2002)
Public Transportation Reduce relays & enhance regularity of bus & tram line
Public transportation bus & tram line rationalization
Helsinki, Finland
Ten year study period 1999 - 2008
Explored travel times, auto operational cost savings, and some environmental benefits
$2.6 million over 10 years due to time savings, reduced cost of bus operation, commuter time savings
$790,000 Maintenance and operation costs were estimated at 8% of investment; long list of beneficiaries;
Potential delay to cross-traffic drivers due to signal priority changes were not calculated. Additional benefits observed were not quantified (e.g., new riders owing to enhanced efficiency).
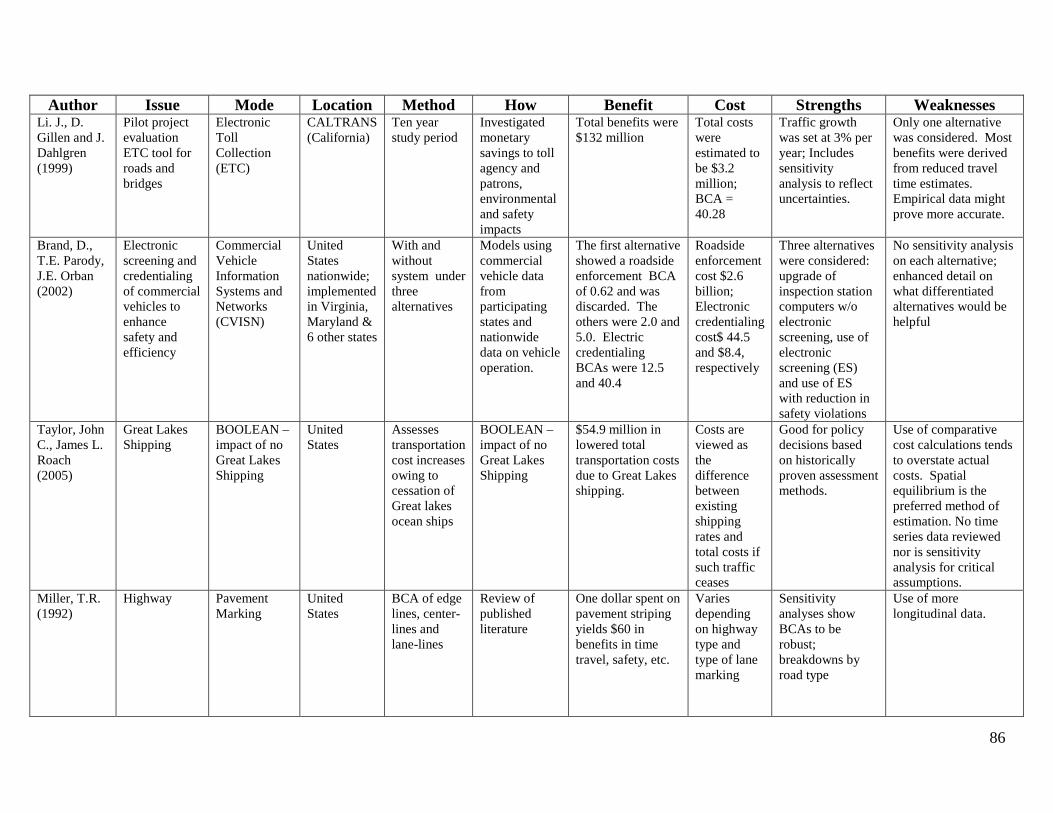
86
Author Issue Mode Location Method How Benefit Cost Strengths Weaknesses Li. J., D. Gillen and J. Dahlgren (1999)
Pilot project evaluation ETC tool for roads and bridges
Electronic Toll Collection (ETC)
CALTRANS (California)
Ten year study period
Investigated monetary savings to toll agency and patrons, environmental and safety impacts
Total benefits were $132 million
Total costs were estimated to be $3.2 million; BCA = 40.28
Traffic growth was set at 3% per year; Includes sensitivity analysis to reflect uncertainties.
Only one alternative was considered. Most benefits were derived from reduced travel time estimates. Empirical data might prove more accurate.
Brand, D., T.E. Parody, J.E. Orban (2002)
Electronic screening and credentialing of commercial vehicles to enhance safety and efficiency
Commercial Vehicle Information Systems and Networks (CVISN)
United States nationwide; implemented in Virginia, Maryland & 6 other states
With and without system under three alternatives
Models using commercial vehicle data from participating states and nationwide data on vehicle operation.
The first alternative showed a roadside enforcement BCA of 0.62 and was discarded. The others were 2.0 and 5.0. Electric credentialing BCAs were 12.5 and 40.4
Roadside enforcement cost $2.6 billion; Electronic credentialing cost$ 44.5 and $8.4, respectively
Three alternatives were considered: upgrade of inspection station computers w/o electronic screening, use of electronic screening (ES) and use of ES with reduction in safety violations
No sensitivity analysis on each alternative; enhanced detail on what differentiated alternatives would be helpful
Taylor, John C., James L. Roach (2005)
Great Lakes Shipping
BOOLEAN – impact of no Great Lakes Shipping
United States
Assesses transportation cost increases owing to cessation of Great lakes ocean ships
BOOLEAN – impact of no Great Lakes Shipping
$54.9 million in lowered total transportation costs due to Great Lakes shipping.
Costs are viewed as the difference between existing shipping rates and total costs if such traffic ceases
Good for policy decisions based on historically proven assessment methods.
Use of comparative cost calculations tends to overstate actual costs. Spatial equilibrium is the preferred method of estimation. No time series data reviewed nor is sensitivity analysis for critical assumptions.
Miller, T.R. (1992)
Highway Pavement Marking
United States
BCA of edge lines, center-lines and lane-lines
Review of published literature
One dollar spent on pavement striping yields $60 in benefits in time travel, safety, etc.
Varies depending on highway type and type of lane marking
Sensitivity analyses show BCAs to be robust; breakdowns by road type
Use of more longitudinal data.
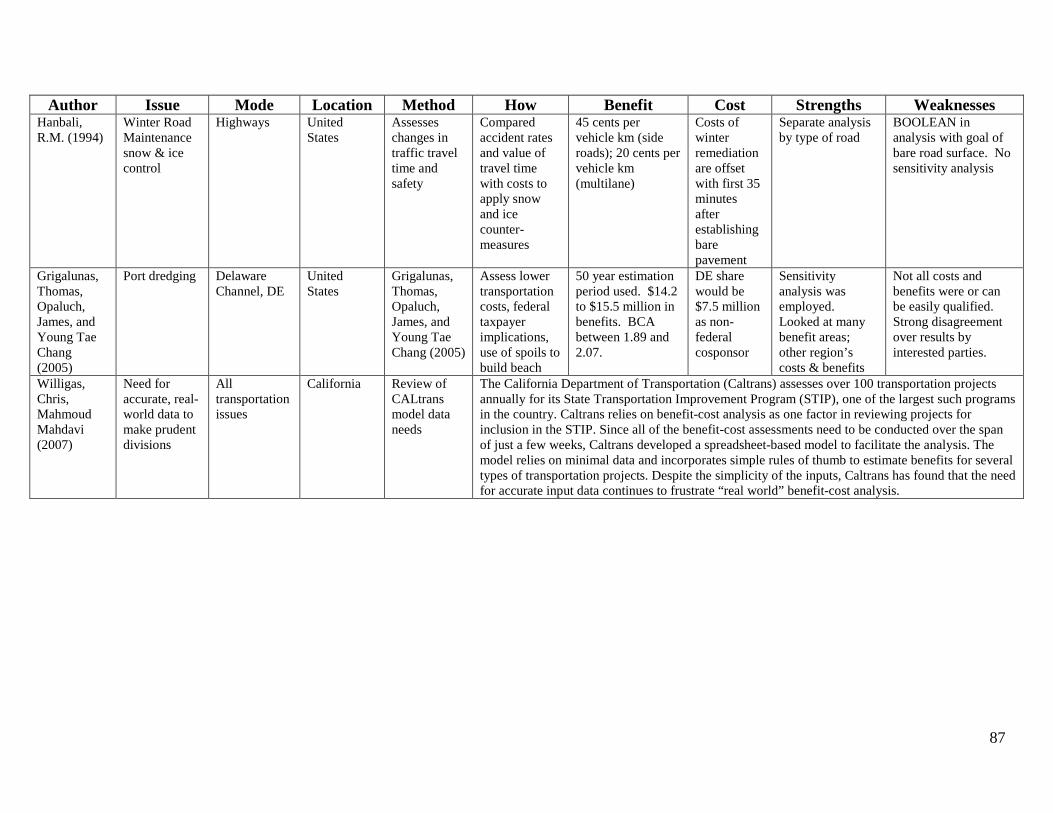
87
Author Issue Mode Location Method How Benefit Cost Strengths Weaknesses Hanbali, R.M. (1994)
Winter Road Maintenance snow & ice control
Highways United States
Assesses changes in traffic travel time and safety
Compared accident rates and value of travel time with costs to apply snow and ice counter- measures
45 cents per vehicle km (side roads); 20 cents per vehicle km (multilane)
Costs of winter remediation are offset with first 35 minutes after establishing bare pavement
Separate analysis by type of road
BOOLEAN in analysis with goal of bare road surface. No sensitivity analysis
Grigalunas, Thomas, Opaluch, James, and Young Tae Chang (2005)
Port dredging Delaware Channel, DE
United States
Grigalunas, Thomas, Opaluch, James, and Young Tae Chang (2005)
Assess lower transportation costs, federal taxpayer implications, use of spoils to build beach
50 year estimation period used. $14.2 to $15.5 million in benefits. BCA between 1.89 and 2.07.
DE share would be $7.5 million as non-federal cosponsor
Sensitivity analysis was employed. Looked at many benefit areas; other region’s costs & benefits
Not all costs and benefits were or can be easily qualified. Strong disagreement over results by interested parties.
Willigas, Chris, Mahmoud Mahdavi (2007)
Need for accurate, real-world data to make prudent divisions
All transportation issues
California Review of CALtrans model data needs
The California Department of Transportation (Caltrans) assesses over 100 transportation projects annually for its State Transportation Improvement Program (STIP), one of the largest such programs in the country. Caltrans relies on benefit-cost analysis as one factor in reviewing projects for inclusion in the STIP. Since all of the benefit-cost assessments need to be conducted over the span of just a few weeks, Caltrans developed a spreadsheet-based model to facilitate the analysis. The model relies on minimal data and incorporates simple rules of thumb to estimate benefits for several types of transportation projects. Despite the simplicity of the inputs, Caltrans has found that the need for accurate input data continues to frustrate “real world” benefit-cost analysis.
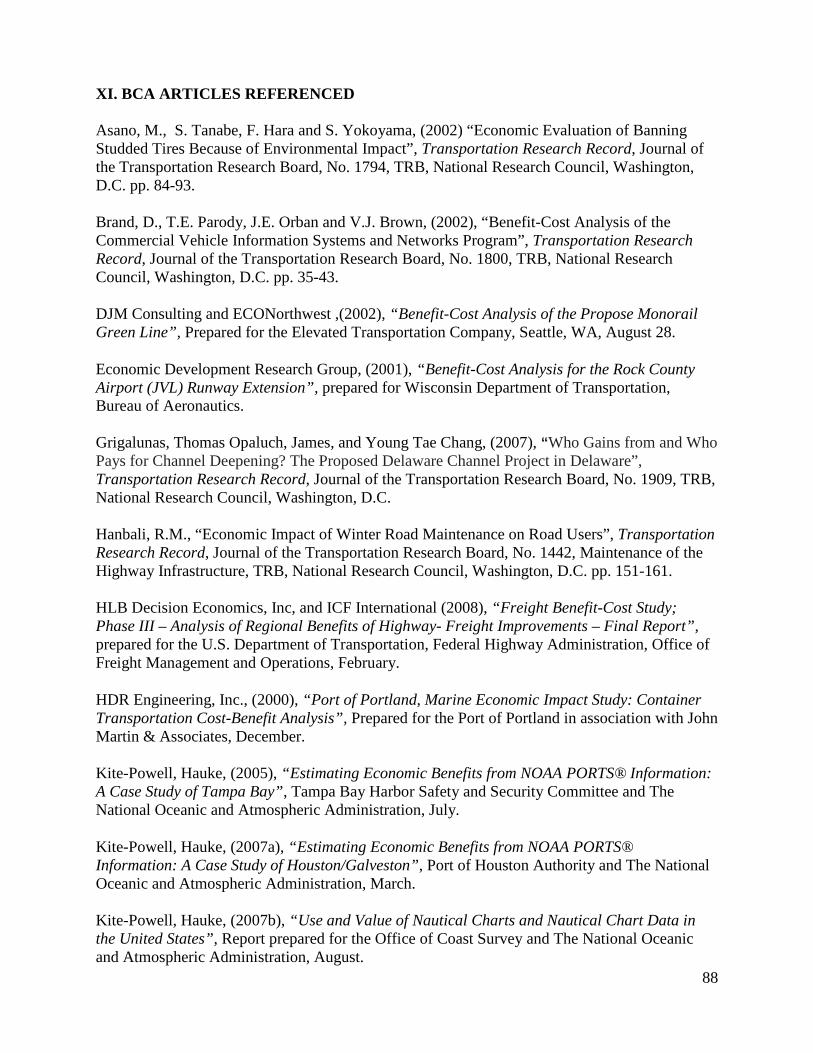
88
XI. BCA ARTICLES REFERENCED Asano, M., S. Tanabe, F. Hara and S. Yokoyama, (2002) “Economic Evaluation of Banning Studded Tires Because of Environmental Impact”, Transportation Research Record, Journal of the Transportation Research Board, No. 1794, TRB, National Research Council, Washington, D.C. pp. 84-93. Brand, D., T.E. Parody, J.E. Orban and V.J. Brown, (2002), “Benefit-Cost Analysis of the Commercial Vehicle Information Systems and Networks Program”, Transportation Research Record, Journal of the Transportation Research Board, No. 1800, TRB, National Research Council, Washington, D.C. pp. 35-43. DJM Consulting and ECONorthwest ,(2002), “Benefit-Cost Analysis of the Propose Monorail Green Line”, Prepared for the Elevated Transportation Company, Seattle, WA, August 28.
Economic Development Research Group, (2001), “Benefit-Cost Analysis for the Rock County Airport (JVL) Runway Extension”, prepared for Wisconsin Department of Transportation, Bureau of Aeronautics. Grigalunas, Thomas Opaluch, James, and Young Tae Chang, (2007), “Who Gains from and Who Pays for Channel Deepening? The Proposed Delaware Channel Project in Delaware”, Transportation Research Record, Journal of the Transportation Research Board, No. 1909, TRB, National Research Council, Washington, D.C. Hanbali, R.M., “Economic Impact of Winter Road Maintenance on Road Users”, Transportation Research Record, Journal of the Transportation Research Board, No. 1442, Maintenance of the Highway Infrastructure, TRB, National Research Council, Washington, D.C. pp. 151-161. HLB Decision Economics, Inc, and ICF International (2008), “Freight Benefit-Cost Study; Phase III – Analysis of Regional Benefits of Highway- Freight Improvements – Final Report”, prepared for the U.S. Department of Transportation, Federal Highway Administration, Office of Freight Management and Operations, February.
HDR Engineering, Inc., (2000), “Port of Portland, Marine Economic Impact Study: Container Transportation Cost-Benefit Analysis”, Prepared for the Port of Portland in association with John Martin & Associates, December. Kite-Powell, Hauke, (2005), “Estimating Economic Benefits from NOAA PORTS® Information: A Case Study of Tampa Bay”, Tampa Bay Harbor Safety and Security Committee and The National Oceanic and Atmospheric Administration, July.
Kite-Powell, Hauke, (2007a), “Estimating Economic Benefits from NOAA PORTS® Information: A Case Study of Houston/Galveston”, Port of Houston Authority and The National Oceanic and Atmospheric Administration, March. Kite-Powell, Hauke, (2007b), “Use and Value of Nautical Charts and Nautical Chart Data in the United States”, Report prepared for the Office of Coast Survey and The National Oceanic and Atmospheric Administration, August.
89
Kite-Powell, Hauke, (2009), “Estimating Economic Benefits from NOAA PORTS® Information: A Case Study of the Port of New/York/New Jersey”, Report prepared for the Center for Operational Oceanographic Products and Services (CO-OPs) National Ocean Service, National Oceanic and Atmospheric Administration, May.
Kite-Powell, Hauke, (2010), “Estimating Economic Benefits from NOAA PORTS® Information: A Case Study of the Columbia River”, Report prepared for the Center for Operational Oceanographic Products and Services (CO-OPs) National Ocean Service, National Oceanic and Atmospheric Administration, June. KPMG Consulting, (2001a) “Cost Analysis of Hydrographic Surveys in Alaska and the Gulf of Mexico – Final Report”, Contract GS23F9896H, Order Number 40AANC1A9074, for the Office of Coast Survey, National Oceanic and Atmospheric Administration, September 21. KPMG Consulting, (2001b) “Cost Analysis of Hydrographic Surveys in Alaska and the Gulf of Mexico – Addendum to Final Report”, Contract GS23F9896H, Order Number 40AANC1A9074, for the Office of Coast Survey, National Oceanic and Atmospheric Administration, October 5. Lehtonen, M., R. Kulmala, (2002), “Benefits of Pilot Implementation of Public Transport Signal Priorities and Real-Time Passenger Information”, Transportation Research Record, Journal of the Transportation Research Board, No. 1799, TRB, National Research Council, Washington, D.C. pp. 18-25. Li. J., D. Gillen and J. Dahlgren, (1999), “Benefit-Cost Evaluation of the Electronic Toll Collection System: A Comprehensive Framework and Application”, Transportation Research Record, Journal of the Transportation Research Board, No. 1659, TRB, National Research Council, Washington, D.C. pp. 31-38. Miller, T.R., (1992), “Benefit-Cost Analysis of Lane Marking”, Transportation Research Record, Journal of the Transportation Research Board, No. 1334, Maintenance of Pavements’ Lane Markings and Roadsides”, TRB, National Research Council, Washington, D.C. pp. 38-45.
National Oceanic and Atmospheric Administration, (2002), “Geostationary Operational Environmental Satellite System (GOES), GOES-R Sounder and Imager, Cost/Benefit Analysis (CBA)”, National Environmental Satellite, Data and Information Service (NESDIS), Office of Systems Development, November 15. National Oceanic and Atmospheric Administration, (2004), “Geostationary Operational Environmental Satellite System (GOES), GOES-R Sounder and Imager, Cost/Benefit Analysis (CBA)- Phase III”, National Environmental Satellite, Data and Information Service (NESDIS), Office of Systems Development, January. Shefer, Daniel, Haim Aviram, (2005), “Incorporating Agglomeration Economies in Transport Cost-Benefit Analysis: the Case of the Proposed Light-Rail Transit in the Tel-Aviv Metropolitan Area”, Papers in Regional Science, Volume 84, Issue 3, Pages 487-508, August.
90
Taylor, John C., James L. Roach (2005), “Ocean Shipping In the Great Lakes: Transportation Cost Increases That Would Result From A Cessation of Ocean Vessel Shipping”, This report was prepared with the assistance of a grant from The Joyce Foundation to Grand Valley State University. The researchers wish to thank The Joyce Foundation for their support of the research, August. Volpe National Transportation Systems Center (the Volpe Center), (2009) “Final Report Task 4 – Benefit-Cost Analysis (BCA) Model Estimates Valuation of the NOS Navigational Products”, Intermodal Infrastructure Security and Operations Division (RVT-51), Center of Innovation (COI), Freight Logistics and Transportation Systems, Research and Innovative Technology Administration (RITA), U.S. Department of Transportation (USDOT), In partial fulfillment of the Reimbursable Agreement RA-VXD2 with the National Ocean Service, National Oceanic and Atmospheric Administration NOS, March 23. Williges, Charles, and Mahmoud Mahdavi (2007), “Transportation Benefit-Cost Analysis: It’s All About the Inputs”, Prepared for presentation at the 2007 Benefit-Cost Analysis Conference, University of Washington, Seattle, Washington, May 18-19. Wolfe, K. Eric (2010), “Value Added to Gross Domestic Product From Surface Transportation From Import and Export Container Traffic”, National Ocean Service, National Oceanic and Atmospheric Administration, February, 26.
Wolfe, K. Eric (2011), “Value Added to Gross Domestic Product From Surface Transportation Of Imports and Exports”, National Ocean Service, National Oceanic and Atmospheric Administration, February, 15.
91
APPENDIX A
GOVERNMENT PERFORMANCE AND RESULTS ACT (GPRA) OF 1993
92
Calendar No. 96
103d Congress, 1st Session
Report 103-58
GOVERNMENT PERFORMANCE AND RESULTS ACT OF 1993
June 16 (legislative day, June 15), 1993.-Ordered to be printed
Mr. Glenn, from the Committee on Governmental Affairs, submitted the following
CONFERENCE REPORT together with ADDITIONAL VIEWS [To accompany S. 20]
The Committee on Governmental Affairs, to which was referred the bill (S. 20) to provide for the establishment, testing, and evaluation of strategic planning and performance measurement in the Federal Government, and for other purposes, having considered the same, reports favorably thereon and recommends that the bill do pass.
I. Purpose
The purpose of S. 20, the Government Performance and Results Act of 1993, is to improve the efficiency and effectiveness of Federal programs by establishing a system to set goals for program performance and to measure results.
II. Summary
On March 24, 1993, the Committee on Governmental Affairs voted to report S. 20 as amended. The bill requires that, beginning in FY 1994, there shall be at least 10 three-year pilot projects in program performance goal setting, measurement, and reporting, and at least 5 two-year pilot projects in greater managerial flexibility in return for commitments to greater program performance. In 1997, OMB and GAO shall report on the results of the pilot projects. By FY 1998, the requirements of the Act for five-year strategic planning, annual program performance plans, and annual program performance reports shall come into force government wide. Also in 1997, OMB will begin at least 5 two-year pilot projects in performance budgeting.
III. Need for Legislation
OVERVIEW
Public confidence in the institutions of American government is suffering from a perception that those institutions are not working well. Recent public opinion polls indicate that this is particularly true with respect to the Federal Government, as both Congress and the Executive Branch are held in low esteem by the American people.
Much has been made of the seeming inconsistency between the public's desire for a wide range of government services, and that same public's disdain for government and objections to paying
93
higher taxes. The Committee believes that part of the explanation for this apparent inconsistency can be seen in the results of a recent public opinion poll which shows that Americans, on average, believe that as much as 48 cents out of every Federal tax dollar is wasted. In other words, the public believes that it is not getting the level and quality of government service for which it is paying.
The Committee shares the public's frustration with waste, inefficiency, and ineffectiveness in Federal programs. As the general oversight committee of the Senate, it has a long history of examining and exposing those types of problems throughout government. The committee has also authored a series of legislative remedies which have been, or promise to be, very helpful in addressing these problems-including the Inspectors General Act and the Chief Financial Officers Act.
Following on these measures, the Committee believes that the regular and systematic measurement and reporting of program performance, compared to pre-established goals, would be a major addition, providing a valuable supplement to the Committee's previous work in the area of management improvement. Governmental waste and under-performance will likely persist until there is a change in the behavior of federal agencies. James Q. Wilson, a noted student of government, stated it well in his book "Bureaucracy: What Government Agencies Do and Why They Do It": "* * * government management tends to be driven by the constraints of the organization, not the tasks of the organization." A key step in changing government behavior is to create a focus on results.
At present, congressional policymaking, spending decisions, and oversight are all seriously handicapped by the lack both of sufficiently precise program goals and of adequate program performance information. Federal managers, too, are greatly disadvantaged in their own efforts to improve program efficiency and effectiveness by that same lack of clear goals and information on results. The goal-setting, performance measurement, and results reporting requirements of S. 20 are intended to address these needs of Congress and of federal program managers.
This reform has the potential to mark a significant change in the way that managers, policymakers, and the American people think about what services the government should provide, and how well it does at providing them. The legislation will provide the information necessary to strengthen program management, to make objective evaluations of program performance, and to set realistic, measurable goals for future performance-ensuring that the information is reliable will, of course, require attention by agencies, OMB, GAO, and Congress.
The legislation begins this effort with a series of pilot projects, recognizing that while necessary, this is a new and challenging direction for Federal agencies. However, the Committee believes that the eventual result will be not just better oversight and improved performance, but greater public confidence in the institutions of government.
ADMINISTRATION POSITION
The Administration expressly endorsed S. 20 at the March 11, 1993, hearing of the Committee on Governmental Affairs. At that hearing, OMB Director Leon Panetta stated that President Clinton, "has reviewed and discussed S. 20, the Government Performance and Results Act of
94
1993, and I am pleased to be able to advise the Committee today that this Administration strongly supports this bill." He described the reasons for the Administration's support as follows:
S. 20 is a major step toward making the Government accountable to the American people by making it clear what the taxpayers are getting for their money and removing some of the red tape that bedevils all of us. As every other enterprise has learned, government officials must manage for results, not just rules and regulations. This accountability both empowers and rewards those who improve performance. S. 20 provides us with a sound foundation as we go about the task of re-inventing our government, and we urge its swift passage.
GAO INTEREST
The General Accounting Office has had a long-standing interest in improving government management through the use of strategic planning and performance measurement. Since 1973, GAO has produced over 70 reports on performance measures and currently has nearly a dozen ongoing efforts to assess measurement in specific agencies. At the Committee's October 3, 1990 hearing on "OMB's Response to Government Management Failures", Comptroller General Charles A. Bowsher testified:
We very much support the development of performance measurements. It is something that we have advocated for some time, and one interesting note is that when I was dealing with some of the people from London during the last few years on the issue of financial management, the one thing that surprises them is that we are still talking about improving our accounting system. They are moving on to performance measurement. In other words, they have got the financial management and the accounting in place, are getting good cost information, and their big debate now is what are the performance measurements. And they have even got it down to the local government level covering fire departments, trash hauling, and similar services. It is impressive, and I think we could do it here at the Federal level.
At that hearing, Mr. Bowsher was asked if regular program performance reports identifying objective measurable accomplishments compared against original goals would be helpful in focusing Congressional oversight, and if it would help GAO in its program evaluation activities. He responded:
Yes to both. It would be very helpful I think to Congress to have this information, and that is why I think you need an annual report from all these departments, just like you have in the private sector, where you actually tell what was your performance goals, what were you trying to achieve with the program objectives, and how did you do. And it would help us immensely. We waste half our time in doing our program evaluation work and our financial audit work even in trying to figure out what is the goal that was trying to be achieved and where is the information. We are always over there trying to gather the data. It should be brought together in an organized fashion by the agencies themselves.
Donald H. Chapin, Assistant Comptroller General for Accounting and Financial Management, added:
We have been working recently with the VA and with the Agriculture Department to try to take some of the goals that are clear to us and that are reasonable and try to relate those to financial

95
information, and it is amazing when you do that what you can see about an agency's operations. You can see what the trends are. You can understand what the numbers mean. And if we can get the agencies to supply us with measurable goals, we can relate those to financial results and then you can see what you are spending your money on and whether that money is well spent. And that is my fond hope, that we can get that into our system of Government and have it reported to the Committees of Congress as a regular matter so that they can see the effectiveness of the money that they appropriate. And you don't see this now, you really don't see that.
The issue of performance measurement was a major focus of a February 1985 GAO report entitled, "Managing the Cost of Government-Building An Effective Financial Management Structure" (GAO/AFMD-85-35). That report emphasized that reform of federal financial management should stress (as one of four key areas) the "systematic measurement of performance", arguing that "effective management of resources requires examining the results of government activities as well as their costs." The report stated that:
Whether the goal is defending the nation or immunizing children against disease, government officials and the public need to know how well government is accomplishing its intended objectives. Assessing government accomplishments requires measuring employee and program performance. Though the size and complexity of the government make it difficult, developing effective performance measurement systems is clearly possible.
The work of nearly two-thirds of government employees, for example, can be measured by means of formal productivity measurement systems. For the remaining one-third, substantial time and effort may be required to develop reliable measures of performance. Indeed, there may be some government activities (such as basic research) for which quantitative measures are not feasible. Even in these cases, however, qualitative measures can usually be developed and used.
A well-developed financial management structure should include performance information that can be used both for day-to- day management and policy and budgeting decisions.
The report points out that several state and local governments have already done this to a far greater extent than has the federal Government, and concludes that "We are convinced that such a structure can be built for the federal government."
At the Committee's May 5, 1992, hearing on S. 20, the Comptroller General reiterated his position that:
[A]gencies need to clearly articulate their missions in the context of statutory objectives and, with regard to services, citizen expectations. These objectives need to be written in terms that can be used to judge progress toward achieving them. It is essential that agreement be reached between Congress, the Office of Management and Budget, and the executive agencies on realistic, outcome-oriented goals if they are to use the data to assess progress.
At the March 11, 1993, hearing of the Committee on S. 20, he urged that "action on the bill should not be delayed." http://www.whitehouse.gov/omb/mgmt-gpra/gprptm.aspx
Florida's Children, Youth and Family Services is a state program nationally recognized for its sophisticated measurement of program outcomes and results. Its Chief of Research and
96
Development, Dennis Affholter, testified that it generates information very similar to that mandated by S. 20, and that, "A small staff properly equipped can do this job * * *. It cost us about a quarter of a million dollars to support the staff to do this job out of a total budget that approaches $500 million * * *."
The Committee received other testimony that this type of measurement might potentially be costly, but the agencies should be able to measure their performance effectively with no more than one percent of their program funds (and much less for some of them). It was also pointed out that there is already a great deal of such data collection going on in federal programs and that this activity could be re-directed, coordinated, and the data better reported and used.
This latter point was supported by a GAO study released at the second hearing on S. 20.
STRATEGIC PLANS
Strategic plans are the starting point and basic underpinning for a system of program goal-setting and performance measurement that will be established throughout the Federal Government. A multi-year strategic plan articulates the fundamental mission (or missions) of an organization, and lays out its long-term general goals for implementing that mission, including the resources needed to reach these goals.
The clearer and more precise these goals are, the better able the organization will be to maintain a consistent sense of direction, regardless of leadership changes at the top. This is particularly important in the Federal Government, where turn-over in top-level positions (such as Assistant and Deputy Assistant Secretary) occurs on a perhaps too frequent basis.
Even when a change in Administration brings about a shift in political philosophy, the program's missions and long-term general goals remain largely intact. The priorities and means of achieving those goals, and the approach to problem-solving, may vary significantly, but the long-term goals usually remain the same. Plans for how an agency will maintain its continuous operations and progress towards those long-term goals is vitally important.
As has previously been pointed out, many agencies already have what they call "strategic plans", but these are generally inadequate and poorly used. A major problem with many is that they have little direct linkage to the agency's daily operations, which greatly weakens their effectiveness.
PERFORMANCE PLANS
Annual program performance plans are what provide the direct linkage between an agency's longer-term goals (as defined in the strategic plan) and what its managers and staff are doing on a day-to-day basis. These plans are often hierarchical in form, showing what annual performance goals need to be accomplished at each level in order for the next higher level to meet its own goals.
97
Performance goals may relate to either "outputs" or "outcomes", the latter usually being the most important for policy purposes, but the former often being a useful management tool (especially when their per-unit costs are also tracked). A common weakness in program performance plans is an over-reliance on output measures, to the neglect of outcomes. Eligible clients completing a job training program are outputs; an increase in their rate of long-term employment would be an outcome. There could be similar outcome goals measuring the effectiveness of Federal community development block grants, such as percentage increases in property values and net new jobs created within the targeted areas. Even at the lowest operational level, there can be goals for processing time, error rates, customer/citizen- satisfaction levels, etc.
It is very important that annual performance plans include goals, not just for the quantity of effort, but also for the quality of that effort. These goals should be as specific as possible, they should drive much of the daily operations of the agency, and they should aim at achieving the long-term general goals of the agency's strategic plan.
It is also important that the resources needed to achieve the goals be indicated as part of the plan. The Committee is concerned about the "hollow government" phenomenon-where an agency has inadequate resources to meet its public missions. Whether the proper remedy is to increase the level of resources allocated, or to reduce the level of service to which the agency is committed, both should be brought into balance. The annual performance plan should show how program goals will be supported through sufficient management skills and human, budgetary, and physical resources.
Not all governmental programs lend themselves easily to measurable goals. For some it will be very difficult, and for a few, perhaps impractical altogether. Nonetheless, managers should resist the temptation to decide too quickly that a particular program is unsuitable for measurable goals. The fundamental question is, what is the difference between a successful program and a failure? Between a well-run operation and one that is mismanaged? How can we tell the difference, and how should that be defined? If the difference cannot be defined, then is that not just an invitation to waste, inefficiency, and ineffectiveness?
PERFORMANCE REPORTS
Annual program performance reports are the feedback to managers, policymakers, and the public as to what was actually accomplished for the resources expended-in other words, how well the original goals were met. This type of information is ideally available to program managers on a more regular basis throughout the year, but at a minimum there needs to be an annual compilation and reporting of results.
There may be more performance information tracked by the agency for management purposes than is summarized in the annual report, but there should be a match between the report and the goals of the previous performance plan. And while the nature of some of what is measured might change periodically, that should not be a frequent, widespread occurrence (especially after the first few years' experience). Otherwise, it will be difficult to spot trends in program performance, which is often the most revealing type of information for managers and policymakers.
The Government Performance and Results Act also asks that the annual performance reports include explanatory information on goals not met. This includes plans for achieving the goals, or
98
reasons why that is not possible and recommended action. The goal itself might be unreasonable, given the resources allocated. Or the goal might be reasonable, if the program is restructured. Or an unforeseen occurrence might have interfered with the goals attainability. Or the entire underlying premise of the program might be flawed. Or the program might simply have been mismanaged. Each of these and other possible explanations suggest different responses by top executives and the Congress.
Finally, the reports should also relate performance measurement information to program evaluation findings, in order to give a clear picture of the agency's performance and its efforts at improvement.
MANAGERIAL FLEXIBILITY WAIVERS
The Committee recognizes that Federal managers, as a general rule, are greatly limited in their ability to shift resources around within their programs, and to exercise other forms of managerial discretion. Rather than being held accountable for achieving results, they are generally held accountable for following detailed and specific procedures, within programs whose structures are rigidly mandated.
The Committee heard considerable testimony that governmental program results can often be improved if the balance between those two forms of accountability were shifted somewhat. This is, it has been the experience of other governments (local, state, and foreign) that managers can improve program performance if there is more specific agreement on what they are to accomplish, if they are given greater managerial flexibility, and then held accountable for the result. The British government, for example, signs agency heads to employment contracts with measurable goals for program performance, while giving them wider latitude in how they expend allocated resources to accomplish those goals.
At the March 11, 1993, hearing on S. 20, Comptroller General Charles A. Bowsher testified that,
[T]he experience of some states and other countries suggests that providing greater flexibility and incentives for managers to act is critical to fundamentally improving agencies' performance. These governments granted managers greater freedom by
- reforming their civil service systems to make it easier for agencies to hire and to provide different compensation, incentive, and promotion systems;
- recasting their budget execution systems to allow multiyear budget allocations, gain sharing, and a reduced number of line items in their appropriations;
- devolving more responsibility for control of operations away from central management agencies and creating an environment where managers are held more responsible for their actions; and
- streamlining acquisition processes and allowing choice between government and nongovernment service providers.
Along with this increased flexibility, the governments also increased accountability-but for results rather than processes.
99
The freedom to be innovative and creative, and to marshal resources as seen appropriate, is also one way to improve the morale and self-esteem of program staff.
For the reasons, the Act includes a provision for the granting of managerial accountability and flexibility waivers; that is, the opportunity to be exempt from certain specific types of non-statutory administrative procedural requirements, in return for achieving greater program results than would otherwise occur. OMB would have to approve such waivers-the agreed conditions and promised benefits of which would be specifically spelled out. The requirements eligible for waiver are exclusively those regarding the internal allocation and use of resources. They do not include any requirements that directly affect persons or activities outside the agency. The Act does not give agencies the authority to waive statutory provisions or regulations promulgated under the Administrative Procedure Act.
The Committee recognizes that there will always be a need for certain procedural controls on management discretion. This is one reason the additional flexibility granted under the Act is fairly limited. Also, such flexibility is not intended as a way around existing labor agreements, Civil Service laws, or to permit inappropriate favoritism. Nor should it undermine organizational morale. However, given the need for government programs to find innovative ways to "do more with less", the Committee believes that the Act provides an important first step in a direction that may pay significant dividends. Experimentation in this area would be worthwhile.
PERFORMANCE BUDGETING
Traditional line-item budgets sent annually to the Congress are rather imprecise policymaking documents, and are rarely effective as management tools. Line-item budgets show how much the President proposes to spend on each program, and how that money should be allocated among various accounts. That format, however, provides a fairly weak linkage to anticipated program results. In other words, it shows how the money should be spent, but not what should be accomplished.
Particularly during this time of very tight budget constraints, it is important that Congress develop a clear understanding of what it is getting in the way of results from each dollar spent, and how those results would change with an increase or decrease in funding. In all likelihood, Congress will face difficult, wrenching budget decisions for years to come. But even if the budget were balanced, and revenues strong, this information would be important in the making of wise spending decisions.
Therefore, it would be most useful if Congress received a budget showing a direct relationship between proposed spending and expected results, along with the anticipated effects of higher or lower amounts. To use a hypothetical example, a survey of National Parks visitors might show that they give their experience an average rating of 3.7 on a 5-point scale. After examining the specifics of the survey results (i.e., what were the problem areas, in which parks), the Park Service might indicate that for an additional 5 percent in funding, it expects to be able to raise the average score to a 4.0. On the other hand, a 5 percent cut might result in a drop to 3.5. Likewise, in this example, the Park Service could show how rising costs or needed capital improvements require increased spending to maintain current services, and to what extent those services might decline if current spending is maintained or decreased. Congressional committees,
100
of course, would examine the rationale underlying those assumptions, but they would have more concrete information on which to base their decisions.
The Government Performance and Results Act addresses the need for this type of information in two ways. First, it requires the President, beginning with FY 1999, to submit an overall Federal Government performance plan along with the budget, derived from the agency performance plans. While this is not a performance budget as such, it would be a very helpful first step. It begins to explicitly link expected results with expenditures in the budget. And second, the Act requires that there be two-year pilot projects in performance budgeting (linking anticipated results to alternative spending levels) in at least five Federal programs, beginning in FY 1998. It then calls for a report from OMB on these tests, along with recommendations on whether the entire Budget ought to be cast in those terms. New legislation would be required for full implementation.
The Committee believes that this pilot project approach is best because, while performance budgeting promises to link program performance information with specific budget requests, it is unclear how best to present that information and what the results will be. For example, GAO, in "Performance Budgeting: State Experiences and Implications for the Federal Government" (GAO/AFMD-93-41, February 1993), reports:
Despite long-standing efforts in states regarded as leaders in performance budgeting, performance measures have not attained sufficient credibility to influence resource allocation decisions. Instead, according to most of the state legislative and executive branch officials we interviewed, resource allocations continue to be driven, for the most part, by traditional budgeting practices. Reasons for this condition include difficulties in achieving consensus on meaningful performance measures, dissimilarities in program and fund reporting structures, and limitations of current accounting systems.
Accordingly, pilot projects will allow OMB to test possible approaches and develop capabilities towards realizing the potential of performance budgeting. At the March 11, 1993, hearing of the Committee, OMB Director Panetta emphasized the Administration's commitment to this endeavor:
With this bill, we will immediately undertake a more limited-but very useful-form of performance budgeting, in which the performance goals that are annually set will conform with the level of resources requested in the budget. Starting next year with the pilot phase of S. 20, we will begin building a system that comprehensively sets out to correlate performance, particularly results-oriented performance, with budgeted amounts.
VIII. Implementation of S. 20
The Committee recognizes that the reforms of S. 20 are a major undertaking. Comprehensive program goal-setting, and performance measurement and reporting, on a government-wide basis will not be accomplished easily. Many Federal agencies will have to think about their programs in ways they are not now accustomed-with a focus on results. Determining what to measure and how to measure it, and then collecting information that is both accurate and meaningful, will be challenging for many organizations. It may be several years before a truly effective performance measurement system is operating.
101
Past efforts at comprehensive management reform, such as the Planning-Programming-Budgeting System (PPBS), and Zero-Based Budgeting (ZBB), though equally well-intended, were less than satisfactory. New information technologies, unavailable in past decades, should now be a great advantage in bringing about successful program performance measurement. However, this effort will require careful planning and thoughtful execution, because the ultimate objective is to change agency and managerial behavior-not to create another bureaucratic system.
PILOT PROJECTS
One of the lessons learned from the experience of other governments studied by the Committee, OMB, and GAO is that it is best to begin with several pilot projects. Focusing on doing it right in a handful of programs-often learning on a trial-and- error basis-maximizes the likelihood of ultimate, government-wide success.
Because the Committee feels it is important not to try to do too much, too soon, S. 20 mandates that the requirements of the Act first be tested on a pilot project basis for three years (FY 1994, 1995, and 1996). This will give OMB the opportunity to study those examples and to develop useful guidance for more full-scale implementation. Congress too will have the opportunity to make changes to the underlying statute, if the pilot project experiences suggest needed modification.
The legislation allows OMB to designate the pilot project programs, in consultation with agency heads, but specifies that there shall be at least ten such pilots, and that they shall "reflect a representative range of Government functions and capabilities in measuring and reporting program performance." In other words, there shall be pilot projects in defense programs as well as social programs, and in difficult to measure areas as well as presumably easier areas.
Another lesson from other countries is the need to create incentives for managers to want to use performance measures. Having failed at effective performance measurement in the past, countries such as Australia and the United Kingdom have more recently found that providing agencies greater flexibility to manage seems to increase the chances of success in getting performance measures used. This was done by reducing central agency constraints on actions in personnel, budget, and procurement.
Based on this experience the legislation mandates that, from among the pilot projects, at least five also test "managerial accountability and flexibility" to see if the influence of incentives will, as in the other countries, increase the chances for successfully implementing better accountability systems. This additional flexibility is defined as the granting of exemption from certain specified types of internal, administrative requirements (dealing primarily with the shifting of funds between certain internal accounts), in return for agreeing to achieve even greater program results. Statutory requirements could not be waived.
After the three-year pilot projects in program performance measurement, OMB and GAO will each issue reports to Congress on the results of those tests, in mid-1997. Government wide implementation of the Act's requirements will begin in FY 1998.
Many Federal programs assisting or affecting the public are administered by States and local governments. Their role in delivering services directly to the public is often greater than that of
102
the Federal agency funding the program. A number of States and local governments have, or are developing, a capability to set strategic goals and extensively measure program performance. For these reasons, the Committee encourages OMB and the agencies to work with States and local governments during this three-year pilot project phase to examine ways for reflecting the role of third parties in agency performance plans and reports.
During this pilot phase, the Committee also encourages that studies be done on the use of waivers. These waivers would give State and local officials greater flexibility, in exchange for their sharing with Federal officials an increased accountability for program results and improved performance. The waivers should look at the application of existing statutory demonstration-type authority or waiver authority currently contained in agency rules. These studies of State and local waivers does not, of course, give agencies any new authority to waive statutory or non-statutory requirements, though recommendations in that regard could be contained in the OMB report on the pilot projects.
TIMELINE FOR IMPLEMENTATION
Just as important as beginning cautiously in implementing these performance measurement requirements, is the necessity of a clear, long-term commitment to the reforms. The Committee felt it important to outline a comprehensive plan for phase-in of the Act's requirements, from pilot projects through government wide program performance reporting. This will put all Federal agencies on notice, even those not participating in the pilot projects, that they should begin now preparing for a new focus on reporting the results of their programs. The general timeline for implementation of S. 20 is as follows:
October 1, 1993.....10 pilot projects in annual performance plans and reports (FY 1994, 1995, 1996).
October 1, 1994.....5 pilot projects in managerial flexibility waivers (FY 1995, 1996).
May 1, 1997.........OMB reports on pilot projects.
June 1, 1997........GAO report on pilot projects.
September 30, 1997..All agencies submit 5-year strategic plans (and every 3 years thereafter), and annual performance plans (and each year thereafter).
..5 pilot projects in performance budgeting (FY 1998 and 1999).
January 1998 (approx.)..OMB submits Federal Government performance plan with FY 1999 budget (and each year thereafter).
..FY 1999 budget also shown in performance budget format for pilot projects in performance budgeting.
March 31, 2000.....All agencies submit annual performance reports for FY 1999 (and each March 31 thereafter).
March 31, 2001.....OMB report on performance budgeting pilot projects.
103
IX. Legislative History of S. 20
DEFINITIONS
An "outcome measure" assesses the actual results, effects, or impact of a program activity compared to its intended purpose. Outcome measurement cannot be done until a program or project reaches either a point of maturity (usually at least several years of full operation for programs continuing indefinitely) or at completion. Another prerequisite for measuring outcomes is the existence at the outset (in statute, directive, or other document) of a clear definition of what results are expected from the program or project. While recognizing that outcome measurement is often difficult, and is infeasible for some program activities, the Committee views outcome measures as the most important and desirable measures, because they gauge the ultimate success of government activities.
An "output measure" records the actual level of activity or effort that was realized, and can be expressed in a quantitative or qualitative manner. Output measures are often intermediate, in that they assess how well a program or operation is being carried out during a particular time period, such as a quarter or a year. The number of schools and students participating in a national test of reading skills, and the percentage of eligible students receiving additional reading instruction, might be output measures, while improved national reading scores might be an outcome. Output measures in the annual performance plans should emphasize those used by agency officials in day-to-day operations and program management.
A "performance goal" is the target level of performance (either output or outcome) expressed as a tangible, measurable objective, against which actual achievement will be compared. An example of a performance goal for a student reading program would be to have 2.3 million students receive an average of three additional hours of reading instruction per week during the 1990 school year.
A "performance indicator" is a specific value or characteristic used to measure output or outcome. In other words, it is what will be measured. Quantitative indicators are used in measuring work-load, production, transactions, records, and various rates, such as utilization, consumption, and frequency. Qualitative indicators are used to measure timeliness, stoppage or out-of-service conditions, and various rates such as error or defect rates, inventory fill, and maintenance or repair intervals. Quality of service indicators include measures of complaints, customer satisfaction levels, and responsiveness rates. Efficiency indicators measure relative transaction or production costs. Financial indicators are numerous and can include receipt, collection, and credit obligation rates. Other examples of indicators include milestone and activity schedules, design specifications (such as hardware performance levels), operating parameters (such as mean failure rates), status of conditions (such as highway miles in good repair), and percentage coverage (such as eligible population).
The term "program activity" refers to the listings of projects and activities in the appendix portion of the Budget of the United States Government. That appendix contains one or more program and financing schedules for each agency, one part of which is the "Program by activities" section.
104
"Program evaluation" is an objective and formal assessment of the results, impact, or effects of a program or policy. While most often aimed at assessing the degree to which a program's stated objectives are being or have been realized, program evaluations are also frequently used for measurement of "unintended" results, good or bad, that were not explicitly included in the original statement of objectives or foreseen in the implementation design. Thus, they can serve to validate or find error in the basic purposes and premises that underlay a program or policy. Finally, this definition should be read as including evaluations of program implementation process and operating policies and practices when the primary concern is about these issues rather than program outcome. However, the definition is not intended to include program monitoring activities that are (or should be) a routine component of good program management.
PROGRAM PERFORMANCE REPORTS
Beginning with FY 1999, the head of each agency shall prepare and submit to the President and Congress a report on program performance. The first of these annual reports is to be submitted no later than March 31, 2000. These reports will contain two main parts: a report on the actual performance achieved compared to the performance goals expressed in the performance goals plan; and of the steps to be taken to achieve those goals that were not met. If a performance goal becomes impractical or infeasible to achieve, the agency should explain why that is the case and what legislative, regulatory, or other actions are needed to accomplish the goal, or whether the goal ought to be modified.
The agency's performance report must be submitted to the appropriate authorization and appropriations committees of the Congress, and copies provided other committees and to the public upon request. The agency shall also provide to any committee of Congress, upon request, more specific information on the actual performance for any performance indicator established in its annual performance plan. Agencies are required to begin reporting performance trends, on a phased-in basis, so that for FY 2002 and thereafter, performance data will be shown for each of the most recent four years.
A performance report shall also describe the use and assess the effectiveness of any waiver of administrative requirements and controls as provided under Section 5, and summarize the findings of those program evaluations completed during the year covered by the report. If the agency has prepared a classified or non-public annex to its annual performance plan, then those same items shall be covered in a classified or non-public annex to the performance report.
The Committee recognizes that in some cases not all of the performance data will be available in time for the March 31 reporting date. In that situation, the Committee expects that the reporting entity will provide whatever data is available, with notation as to its incomplete status. The Committee anticipates that the preliminary figures will be updated as part of the trend information in future annual reports.
Many agencies are currently developing systems for measuring performance to provide financial and program information for the audited financial statements required by the CFOs Act. The CFOs Act is a product of this Committee. The linking of program performance information with financial information is both a key feature of sound management, and an important element in presenting to the public a useful and informative perspective on Federal spending. In this regard,
105
the Committee expects that agencies will continue to present program performance data in their audited financial statements.
The Committee also anticipates that substantial differences could potentially exist between the content of financial statements and of program performance reports, particularly with respect to program coverage. Nonetheless, during the period before the first program performance report is required on March 31, 2000, the Committee encourages agencies to examine the potential use of audited financial statements for reporting program performance under this Act.
The March 31 reporting date coincides with the date that agencies are to submit their annual financial statements to OMB under the CFOs Act (31 U.S.C. 3515). The Government Performance and Results Act allows both submissions to be combined, at the agency's option.
EXEMPTION
The Director of OMB is authorized, though not required, to exempt any agency with annual outlays of $20 million or less from having to prepare strategic plans, annual performance plans, and program performance reports-a level the Committee concluded would ensure that virtually all major program and regulating agencies were covered by the Act. In the report mandated by Section 6(a), the Director of OMB may discuss whether a higher amount or some progressive annual adjustment to the amount, is appropriate. Such exemptions are not permanent, and may be modified or repealed at the discretion of the Director.
Section 5. Managerial accountability and flexibility
This section of the Act allows agencies to propose, and OMB to approve, waivers of certain non-statutory administrative procedural requirements and controls in return for specific individual or organizational accountability to achieve a higher performance goal. An example of increased flexibility would be to allow an organization to recapture unspent operating funds because of increased efficiencies, and then to use these funds to purchase new equipment or expand employee training. Another example might involve delegating more authority to line managers to make procurement decisions.
These waivers can include specification of personnel staffing levels, limitations on compensation or remuneration, and prohibitions or restrictions on funding transfers among budget object classification 20 (contractual services and supplies, including travel and transportation of persons and things, rental payments to GSA and others, communications, utilities, and miscellaneous charges), and sub classifications 11 (personnel compensation), 12 (personnel benefits), 31 (equipment), and 32 (land and structures). Such proposed waivers are to be reviewed by OMB and are subject to its approval, as well as by the originating agency. For example, requirements dealing with personnel matters that were issued by the Office of Personnel Management would also require OPM approval for waiver. The Committee urges the originating agencies to make every reasonable effort to be supportive of such managerial flexibility waivers, particularly on a pilot project basis.
Agencies are not authorized through a waiver under this Act to transfer funds budgeted for the following sub classifications: 13 (benefits for former personnel), 33 (investments and loans), 41 (grants, subsidies, and contributions), 42 (insurance claims and indemnities), 43 (interest and
106
dividends), and 44 (refunds). An agency may not use a waiver to transfer funds from one program activity to another program activity unless it has received authority, other than under this Act, to do so.
The Committee emphasizes that agencies are not authorized to propose a waiver of a requirement or control established in law. However, if an agency has authority under a law other than this Act to waive a statutory requirement or control, it may do so and need satisfy only the requirements of that law. This section also does not convey any authority for a Government manager or official to waive unilaterally the terms or provisions of any contract, collective bargaining agreement, or other legal instrument that is in effect. Additionally, this Act does not authorize waiver of any regulation promulgated under 5 U.S.C. 553, without appropriate notice and comment, unless the rule already provides authority for such waivers.
Proposed waivers shall describe in quantifiable terms the anticipated efforts on performance resulting from greater managerial or organizational flexibility, and compare that to the current level of performance and the projected performance that would otherwise occur. Also assessed should be the extent that expected improvements will be sustained over future years. Waivers of limitations on compensation or remuneration shall precisely state the monetary change in amounts that will result from meeting, exceeding, or failing to meet the performance goals, and identify by organizational placement or title the individuals covered. Also described shall be the potential adverse effects on compensation where performance goals are not met, particularly where the waiver could result in a substantial increase in compensation if the goal is met or exceeded and the actual performance fails even to maintain previous levels.
The annual performance report is to include a description on the use and effectiveness of any waiver in achieving a performance goal. This description should also identify the individual or organizational consequences resulting from a failure to maintain the previous level of performance as a result of using the waiver. This latter information would supplement that portion of the annual performance report that addresses the reasons why a performance goal was not achieved, and the plans and actions that will be taken to achieve the goal.
The Committee believes that no manager should be confident that a proposed waiver will improve performance if employees are unhappy with or opposed to the effects that the waiver would have on them or their jobs. The Committee is convinced that employee participation, including participation by employee representatives, in the development of proposed waivers is critical-if the employees are not supportive, then the chance for failure will be high. Agencies are strongly encouraged to involve employees when developing proposed waivers, and to regularly seek employee views and suggestions. Performance improvement is not the exclusive responsibility of the manager, and should be viewed as a shared enterprise by managers and staff working together as partners.
In proposing waivers, agencies should, as appropriate, comport with the provisions of 5 U.S.C. 7106, Management rights; 5 U.S.C. 7113, National consultation rights; 5 U.S.C. 7117(d), Consultation rights on government-wide rules and regulations; and 5 U.S.C. 7114, Representation rights and duties.
107
Proposed waivers are to be included in the Federal Government performance plan for the overall budget as required by section 1105(a)(29). This will give general notice about the specifics of any waiver approximately eight months before it would go into effect.
An agency may withdraw a proposed waiver prior to the beginning of the fiscal year it would go into effect. If an agency suspends or ends prematurely a waiver during the fiscal year, the agency should briefly explain its reasons for doing so in its annual program performance report for that fiscal year.
After a waiver has been in effect for three years, an agency may propose that a waiver, other than one on limitations on compensation or remuneration, be made permanent. Approval shall be noted in the subsequent annual Federal Government performance plan and in each of the agency's annual performance plans. Such a permanent waiver may be rescinded by OMB should changed circumstances or policies warrant.
The Committee encourages agencies to be creative and entrepreneurial in developing and applying managerial flexibility waivers. The successful experience of other national governments and certain state and local governments, in providing much greater authority to managers and staff in administering and implementing programs, suggests that substantial improvements in performance can result. A limited or constrained approach to waivers is unlikely to lead to much improvement in performance.
The Committee has emphasized that this Act does not authorize waiver of any requirement or control established by law. The Committee recognizes that this may inhibit the establishment of improved performance levels. However, neither the Committee nor the agencies are able at this time to identify in a complete way those specific statutory requirements and controls for which a waiver should be considered.
The Director of OMB is encouraged to include in the May 1, 1997 report required by Section 6(a), a list of statutory requirements for which Congress, in future legislation, should consider authorizing waivers. This list should describe the performance-related benefits of such waivers, as well as other effects or consequences.
The Committee also emphasizes that these waivers are intended to improve program results. Should they be used for other purposes, or in an inappropriate way to avoid lawful requirements or responsibilities, this Committee will act quickly to end this provision.
Section 6. Pilot projects
Because the Committee believes that immediate and government wide implementation of this Act is neither feasible nor desirable, implementation begins with a set of pilot projects, before proceeding government-wide in the Fall of 1997.
http://www.whitehouse.gov/omb/mgmt-gpra/gprptm.aspx
PILOT PROJECTS
108
The Office of Management and Budget (OMB) would select 10 agencies to conduct pilot projects in performance management over the 1994-1996 period.
Additional pilot projects in specific aspects of performance management would be conducted through 1999. OMB indicates that, in developing the pilot projects, it would select agencies that already have a strategic plan and are already collecting data on the performance of their programs. Based on experience with performance measurement to date, largely from implementing the Chief Financial Officers Act of 1990, we expect that each pilot agency might use 5 to 10 employees annually to set goals and report on performance. Based on this level of effort, CBO estimates that the cost of the pilot projects would range from $5 million to $10 million annually over the 1994-1996 period. Such costs would be paid from appropriated funds.
GOVERNMENTWIDE PROGRAM
The bill would require all government agencies to prepare long-term strategic plans beginning in fiscal year 1997 and annual performance plans beginning in fiscal year 1998. Agencies would probably begin developing strategic plans several years before they are due; therefore, CBO estimates that the cost of implementing S. 20 government wide would begin in fiscal year 1995 or 1996.
For a number of reasons, however, CBO does not currently have a reliable basis for estimating the cost of a government wide effort.
APPENDIX http://www.whitehouse.gov/omb/mgmt-gpra/gplaw2m.aspx#t2
SECTION 1. SHORT TITLE.
This Act may be cited as the "Government Performance and Results Act of 1993".
SECTION 2. FINDINGS AND PURPOSES.
(a) Findings.-The Congress finds that-
(1) waste and inefficiency in Federal programs undermine the confidence of the American people in the Government and reduces the Federal Government's ability to address adequately vital public needs;
(2) Federal managers are seriously disadvantaged in their efforts to improve program efficiency and effectiveness, because of insufficient articulation of program goals and inadequate information on program performance; and
(3) congressional policymaking, spending decisions and program oversight are seriously handicapped by insufficient attention to program performance and results.
(b) Purposes.-The purposes of this Act are to-
109
(1) improve the confidence of the American people in the capability of the Federal Government, by systematically holding Federal agencies accountable for achieving program results;
(2) initiate program performance reform with a series of pilot projects in setting program goals, measuring program performance against those goals, and reporting publicly on their progress;
(3) improve Federal program effectiveness and public accountability by promoting a new focus on results, service quality, and customer satisfaction;
(4) help Federal managers improve service delivery, by requiring that they plan for meeting program objectives and by providing them with information about program results and service quality;
(5) improve congressional decision making by providing more objective information on achieving statutory objectives, and on the relative effectiveness and efficiency of Federal programs and spending; and
(6) improve internal management of the Federal Government.
SECTION 3. STRATEGIC PLANNING.
Chapter 3 of title 5, United States Code, is amended by adding after section 305 the following new section:
"Sec. 306. Strategic plans
"(a) No later than September 30, 1997, the head of each agency shall submit to the Director of the Office of Management and Budget and to the Congress a strategic plan for program activities. Such plan shall contain-
"(1) a comprehensive mission statement covering the major functions and operations of the agency;
"(2) general goals and objectives, including outcome- related goals and objectives, for the major functions and operations of the agency;
"(3) a description of how the goals and objectives are to be achieved, including a description of the operational processes, skills and technology, and the human, capital, information, and other resources required to meet those goals and objectives;
"(4) a description of how the performance goals included in the plan required by section 1115(a) of title 31 shall be related to the general goals and objectives in the strategic plan;
"(5) an identification of those key factors external to the agency and beyond its control that could significantly affect the achievement of the general goals and objectives; and
"(6) a description of the program evaluations used in establishing or revising general goals and objectives, with a schedule for future program evaluations.
110
"(b) The strategic plan shall cover a period of not less than five years forward from the fiscal year in which it is submitted, and shall be updated and revised at least every three years.
"(c) The performance plan required by section 1115 of title 31 shall be consistent with the agency's strategic plan. A performance plan may not be submitted for a fiscal year not covered by a current strategic plan under this section.
"(d) When developing a strategic plan, the agency shall consult with the Congress, and shall solicit and consider the views and suggestions of those entities potentially affected by or interested in such a plan.
"(e) The functions and activities of this section shall be considered to be inherently Governmental functions. The drafting of strategic plans under this section shall be performed only by Federal employees.
"(f) For purposes of this section the term 'agency' means an Executive agency defined under section 105, but does not include the Central Intelligence Agency, the General Accounting Office, the Panama Canal Commission, the United States Postal Service, and the Postal Rate Commission.".
SECTION 4. ANNUAL PERFORMANCE PLANS AND REPORTS.
(a) Budget Contents and Submission to Congress.-Section 1105(a) of title 31, United States Code, is amended by adding at the end thereof the following new paragraph:
"(29) beginning with fiscal year 1999, a Federal Government performance plan for the overall budget as provided for under section 1115.".
(b) Performance Plans and Reports.-Chapter 11 of title 31, United States Code, is amended by adding after section 1114 the following new sections:
"Sec. 1115. Performance plans
"(a) In carrying out the provisions of section 1105(a)(29), the Director of the Office of Management and Budget shall require each agency to prepare an annual performance plan covering each program activity set forth in the budget of such agency. Such plan shall-
"(1) establish performance goals to define the level of performance to be achieved by a program activity;
"(2) express such goals in an objective, quantifiable, and measurable form unless authorized to be in an alternative form under subsection (b);
"(3) briefly describe the operational processes, skills and technology, and the human, capital, information, or other resources required to meet the performance goals;
"(4) establish performance indicators to be used in measuring or assessing the relevant outputs, service levels, and outcomes of each program activity;
111
"(5) provide a basis for comparing actual program results with the established performance goals; and
"(6) describe the means to be used to verify and validate measured values.
"(b) If an agency, in consultation with the Director of the Office of Management and Budget, determines that it is not feasible to express the performance goals for a particular program activity in an objective, quantifiable, and measurable form, the Director of the Office of Management and Budget may authorize an alternative form. Such alternative form shall-
"(1) include separate descriptive statements of-
"(A)(i) a minimally effective program, and
"(ii) a successful program, or
"(B) such alternative as authorized by the Director of the Office of Management and Budget, with sufficient precision and in such terms that would allow for an accurate, independent determination of whether the program activity's performance meets the criteria of the description; or
"(2) state why it is infeasible or impractical to express a performance goal in any form for the program activity.
"(c) For the purpose of complying with this section, an agency may aggregate, disaggregate, or consolidate program activities, except that any aggregation or consolidation may not omit or minimize the significance of any program activity constituting a major function or operation for the agency.
"(d) An agency may submit with its annual performance plan an appendix covering any portion of the plan that-
"(1) is specifically authorized under criteria established by an Executive order to be kept secret in the interest of national defense or foreign policy; and
"(2) is properly classified pursuant to such Executive order.
"(e) The functions and activities of this section shall be considered to be inherently Governmental functions. The drafting of performance plans under this section shall be performed only by Federal employees.
"(f) For purposes of this section and sections 1116 through 1119, and sections 9703 and 9704 the term-
"(1) 'agency' has the same meaning as such term is defined under section 306(f) of title 5;
"(2) 'outcome measure' means an assessment of the results of a program activity compared to its intended purpose;
112
"(3) 'output measure' means the tabulation, calculation, or recording of activity or effort and can be expressed in a quantitative or qualitative manner;
"(4) 'performance goal' means a target level of performance expressed as a tangible, measurable objective, against which actual achievement can be compared, including a goal expressed as a quantitative standard, value, or rate;
"(5) 'performance indicator' means a particular value or characteristic used to measure output or outcome;
"(6) 'program activity' means a specific activity or project as listed in the program and financing schedules of the annual budget of the United States Government; and
"(7) 'program evaluation' means an assessment, through objective measurement and systematic analysis, of the manner and extent to which Federal programs achieve intended objectives.
"Sec. 1116. Program performance reports
"(a) No later than March 31, 2000, and no later than March 31 of each year thereafter, the head of each agency shall prepare and submit to the President and the Congress, a report on program performance for the previous fiscal year.
"(b)(1) Each program performance report shall set forth the performance indicators established in the agency performance plan under section 1115, along with the actual program performance achieved compared with the performance goals expressed in the plan for that fiscal year.
"(2) If performance goals are specified in an alternative form under section 1115(b), the results of such program shall be described in relation to such specifications, including whether the performance failed to meet the criteria of a minimally effective or successful program.
"(c) The report for fiscal year 2000 shall include actual results for the preceding fiscal year, the report for fiscal year 2001 shall include actual results for the two preceding fiscal years, and the report for fiscal year 2002 and all subsequent reports shall include actual results for the three preceding fiscal years.
"(d) Each report shall-
"(1) review the success of achieving the performance goals of the fiscal year;
"(2) evaluate the performance plan for the current fiscal year relative to the performance achieved toward the performance goals in the fiscal year covered by the report;
"(3) explain and describe, where a performance goal has not been met (including when a program activity's performance is determined not to have met the criteria of a successful program activity under section 1115(b)(1)(A)(ii) or a corresponding level of achievement if another alternative form is used)-
"(A) why the goal was not met;
"(B) those plans and schedules for achieving the established performance goal; and
113
"(C) if the performance goal is impractical or infeasible, why that is the case and what action is recommended;
"(4) describe the use and assess the effectiveness in achieving performance goals of any waiver under section 9703 of this title; and
"(5) include the summary findings of those program evaluations completed during the fiscal year covered by the report.
"(e) An agency head may include all program performance information required annually under this section in an annual financial statement required under section 3515 if any such statement is submitted to the Congress no later than March 31 of the applicable fiscal year.
"(f) The functions and activities of this section shall be considered to be inherently Governmental functions. The drafting of program performance reports under this section shall be performed only by Federal employees.
"Sec. 1117. Exemption
"The Director of the Office of Management and Budget may exempt from the requirements of sections 1115 and 1116 of this title and section 306 of title 5, any agency with annual outlays of $20,000,000 or less.".
SECTION 5. MANAGERIAL ACCOUNTABILITY AND FLEXIBILITY.
(a) Managerial Accountability and Flexibility.-Chapter 97 of title 31, United States Code, is amended by adding after section 9702, the following new section:
"Sec. 9703. Managerial accountability and flexibility
"(a) Beginning with fiscal year 1999, the performance plans required under section 1115 may include proposals to waive administrative procedural requirements and controls, including specification of personnel staffing levels, limitations on compensation or remuneration, and prohibitions or restrictions on funding transfers among budget object classification 20 and subclassifications 11, 12, 31, and 32 of each annual budget submitted under section 1105, in return for specific individual or organization accountability to achieve a performance goal. In preparing and submitting the performance plan under section 1105(a)(29), the Director of the Office of Management and Budget shall review and may approve any proposed waivers. A waiver shall take effect at the beginning of the fiscal year for which the waiver is approved.
"(b) Any such proposal under subsection (a) shall describe the anticipated effects on performance resulting from greater managerial or organizational flexibility, discretion, and authority, and shall quantify the expected improvements in performance resulting from any waiver. The expected improvements shall be compared to current actual performance, and to the projected level of performance that would be achieved independent of any waiver.
"(c) Any proposal waiving limitations on compensation or remuneration shall precisely express the monetary change in compensation or remuneration amounts, such as bonuses or awards, that shall result from meeting, exceeding, or failing to meet performance goals.
114
"(d) Any proposed waiver of procedural requirements or controls imposed by an agency (other than the proposing agency or the Office of Management and Budget) may not be included in a performance plan unless it is endorsed by the agency that established the requirement, and the endorsement included in the proposing agency's performance plan.
"(e) A waiver shall be in effect for one or two years as specified by the Director of the Office of Management and Budget in approving the waiver. A waiver may be renewed for a subsequent year. After a waiver has been in effect for three consecutive years, the performance plan prepared under section 1115 may propose that a waiver, other than a waiver of limitations on compensation or remuneration, be made permanent.
"(f) For purposes of this section, the definitions under section 1115(f) shall apply.".
SECTION 6. PILOT PROJECTS.
(a) Performance Plans and Reports.-Chapter 11 of title 31, United States Code, is amended by inserting after section 1117 (as added by section 4 of this Act) the following new section:
"Sec. 1118. Pilot projects for performance goals
"(a) The Director of the Office of Management and Budget, after consultation with the head of each agency, shall designate not less than ten agencies as pilot projects in performance measurement for fiscal years 1994, 1995, and 1996. The selected agencies shall reflect a representative range of Government functions and capabilities in measuring and reporting program performance.
"(b) Pilot projects in the designated agencies shall undertake the preparation of performance plans under section 1115, and program performance reports under section 1116, other than section 1116(c), for one or more of the major functions and operations of the agency. A strategic plan shall be used when preparing agency performance plans during one or more years of the pilot period.
"(c) No later than May 1, 1997, the Director of the Office of Management and Budget shall submit a report to the President and to the Congress which shall-
"(1) assess the benefits, costs, and usefulness of the plans and reports prepared by the pilot agencies in meeting the purposes of the Government Performance and Results Act of 1993;
"(2) identify any significant difficulties experienced by the pilot agencies in preparing plans and reports; and
"(3) set forth any recommended changes in the requirements of the provisions of Government Performance and Results Act of 1993, section 306 of title 5, sections 1105, 1115, 1116, 1117, 1119 and 9703 of this title, and this section.".
(b) Managerial Accountability and Flexibility.-Chapter 97 of title 31, United States Code, is amended by inserting after section 9703 (as added by section 5 of this Act) the following new section:
115
"Sec. 9704. Pilot projects for managerial accountability and flexibility
"(a) The Director of the Office of Management and Budget shall designate not less than five agencies as pilot projects in managerial accountability and flexibility for fiscal years 1995 and 1996. Such agencies shall be selected from those designated as pilot projects under section 1118 and shall reflect a representative range of Government functions and capabilities in measuring and reporting program performance.
"(b) Pilot projects in the designated agencies shall include proposed waivers in accordance with section 9703 for one or more of the major functions and operations of the agency.
"(c) The Director of the Office of Management and Budget shall include in the report to the President and to the Congress required under section 1118(c)-
"(1) an assessment of the benefits, costs, and usefulness of increasing managerial and organizational flexibility, discretion, and authority in exchange for improved performance through a waiver; and
"(2) an identification of any significant difficulties experienced by the pilot agencies in preparing proposed waivers.
"(d) For purposes of this section the definitions under section 1115(f) shall apply.".
(c) Performance Budgeting.-Chapter 11 of title 31, United States Code, is amended by inserting after section 1118 (as added by section 6 of this Act) the following new section:
"Sec. 1119. Pilot projects for performance budgeting
"(a) The Director of the Office of Management and Budget, after consultation with the head of each agency shall designate not less than five agencies as pilot projects in performance budgeting for fiscal years 1998 and 1999. At least three of the agencies shall be selected from those designated as pilot projects under section 1118, and shall also reflect a representative range of Government functions and capabilities in measuring and reporting program performance.
"(b) Pilot projects in the designated agencies shall cover the preparation of performance budgets. Such budgets shall present, for one or more of the major functions and operations of the agency, the varying levels of performance, including outcome-related performance, that would result from different budgeted amounts.
"(c) The Director of the Office of Management and Budget shall include, as an alternative budget presentation in the budget submitted under section 1105 for fiscal year 1999, the performance budgets of the designated agencies for this fiscal year.
"(d) No later than March 31, 2001, the Director of the Office of Management and Budget shall transmit a report to the President and to the Congress on the performance budgeting pilot projects which shall-
"(1) assess the feasibility and advisability of including a performance budget as part of the annual budget submitted under section 1105;
116
"(2) describe any difficulties encountered by the pilot agencies in preparing a performance budget;
"(3) recommend whether legislation requiring performance budgets should be proposed and the general provisions of any legislation; and
"(4) set forth any recommended changes in the other requirements of the Government Performance and Results Act of 1993, section 306 of title 5, sections 1105, 1115, 1116, 1117, and 9703 of this title, and this section.
"(e) After receipt of the report required under subsection (d), the Congress may specify that a performance budget be submitted as part of the annual budget submitted under section 1105.".
SECTION 7. UNITED STATES POSTAL SERVICE.
Part III of title 39, United States Code, is amended by adding at the end thereof the following new chapter:
"CHAPTER 28-STRATEGIC PLANNING AND PERFORMANCE MANAGEMENT
"Sec.
"2801. Definitions.
"2802. Strategic plans.
"2803. Performance plans.
"2804. Program performance reports.
"2805. Inherently Governmental functions.
"Sec. 2801. Definitions
"For purposes of this chapter the term-
"(1) 'outcome measure' refers to an assessment of the results of a program activity compared to its intended purpose;
"(2) 'output measure' refers to the tabulation, calculation, or recording of activity or effort and can be expressed in a quantitative or qualitative manner;
"(3) 'performance goal' means a target level of performance expressed as a tangible, measurable objective, against which actual achievement shall be compared, including a goal expressed as a quantitative standard, value, or rate;
"(4) 'performance indicator' refers to a particular value or characteristic used to measure output or outcome;
"(5) 'program activity' means a specific activity related to the mission of the Postal Service; and
117
"(6) 'program evaluation' means an assessment, through objective measurement and systematic analysis, of the manner and extent to which Postal Service programs achieve intended objectives.
"Sec. 2802. Strategic plans
"(a) No later than September 30, 1997, the Postal Service shall submit to the President and the Congress a strategic plan for its program activities. Such plan shall contain-
"(1) a comprehensive mission statement covering the major functions and operations of the Postal Service;
"(2) general goals and objectives, including outcome- related goals and objectives, for the major functions and operations of the Postal Service;
"(3) a description of how the goals and objectives are to be achieved, including a description of the operational processes, skills and technology, and the human, capital, information, and other resources required to meet those goals and objectives;
"(4) a description of how the performance goals included in the plan required under section 2803 shall be related to the general goals and objectives in the strategic plan;
"(5) an identification of those key factors external to the Postal Service and beyond its control that could significantly affect the achievement of the general goals and objectives; and
"(6) a description of the program evaluations used in establishing or revising general goals and objectives, with a schedule for future program evaluations.
"(b) The strategic plan shall cover a period of not less than five years forward from the fiscal year in which it is submitted, and shall be updated and revised at least every three years.
"(c) The performance plan required under section 2803 shall be consistent with the Postal Service's strategic plan. A performance plan may not be submitted for a fiscal year not covered by a current strategic plan under this section.
"(d) When developing a strategic plan, the Postal Service shall solicit and consider the views and suggestions of those entities potentially affected by or interested in such a plan, and shall advise the Congress of the contents of the plan.
"Sec. 2803. Performance plans
"(a) The Postal Service shall prepare an annual performance plan covering each program activity set forth in the Postal Service budget, which shall be included in the comprehensive statement presented under section 2401(g) of this title. Such plan shall-
"(1) establish performance goals to define the level of performance to be achieved by a program activity;
"(2) express such goals in an objective, quantifiable, and measurable form unless an alternative form is used under subsection (b);
118
"(3) briefly describe the operational processes, skills and technology, and the human, capital, information, or other resources required to meet the performance goals;
"(4) establish performance indicators to be used in measuring or assessing the relevant outputs, service levels, and outcomes of each program activity;
"(5) provide a basis for comparing actual program results with the established performance goals; and
"(6) describe the means to be used to verify and validate measured values.
"(b) If the Postal Service determines that it is not feasible to express the performance goals for a particular program activity in an objective, quantifiable, and measurable form, the Postal Service may use an alternative form. Such alternative form shall-
"(1) include separate descriptive statements of-
"(A) a minimally effective program, and
"(B) a successful program,
with sufficient precision and in such terms that would allow for an accurate, independent determination of whether the program activity's performance meets the criteria of either description; or
"(2) state why it is infeasible or impractical to express a performance goal in any form for the program activity.
"(c) In preparing a comprehensive and informative plan under this section, the Postal Service may aggregate, disaggregate, or consolidate program activities, except that any aggregation or consolidation may not omit or minimize the significance of any program activity constituting a major function or operation.
"(d) The Postal Service may prepare a non-public annex to its plan covering program activities or parts of program activities relating to-
"(1) the avoidance of interference with criminal prosecution; or
"(2) matters otherwise exempt from public disclosure under section 410(c) of this title.
"Sec. 2804. Program performance reports
"(a) The Postal Service shall prepare a report on program performance for each fiscal year, which shall be included in the annual comprehensive statement presented under section 2401(g) of this title.
"(b)(1) The program performance report shall set forth the performance indicators established in the Postal Service performance plan, along with the actual program performance achieved compared with the performance goals expressed in the plan for that fiscal year.
119
"(2) If performance goals are specified by descriptive statements of a minimally effective program activity and a successful program activity, the results of such program shall be described in relationship to those categories, including whether the performance failed to meet the criteria of either category.
"(c) The report for fiscal year 2000 shall include actual results for the preceding fiscal year, the report for fiscal year 2001 shall include actual results for the two preceding fiscal years, and the report for fiscal year 2002 and all subsequent reports shall include actual results for the three preceding fiscal years.
"(d) Each report shall-
"(1) review the success of achieving the performance goals of the fiscal year;
"(2) evaluate the performance plan for the current fiscal year relative to the performance achieved towards the performance goals in the fiscal year covered by the report;
"(3) explain and describe, where a performance goal has not been met (including when a program activity's performance is determined not to have met the criteria of a successful program activity under section 2803(b)(2))-
"(A) why the goal was not met;
"(B) those plans and schedules for achieving the established performance goal; and
"(C) if the performance goal is impractical or infeasible, why that is the case and what action is recommended; and
"(4) include the summary findings of those program evaluations completed during the fiscal year covered by the report.
"Sec. 2805. Inherently Governmental functions
"The functions and activities of this chapter shall be considered to be inherently Governmental functions. The drafting of strategic plans, performance plans, and program performance reports under this section shall be performed only by employees of the Postal Service.".
SECTION 8. CONGRESSIONAL OVERSIGHT AND LEGISLATION.
(a) In General.-Nothing in this Act shall be construed as limiting the ability of Congress to establish, amend, suspend, or annul a performance goal. Any such action shall have the effect of superseding that goal in the plan submitted under section 1105(a)(29) of title 31, United States Code.
(b) GAO Report.-No later than June 1, 1997, the Comptroller General of the United States shall report to Congress on the implementation of this Act, including the prospects for compliance by Federal agencies beyond those participating as pilot projects under sections 1118 and 9704 of title 31, United States Code.
SECTION 9. TRAINING.
120
The Office of Personnel Management shall, in consultation with the Director of the Office of Management and Budget and the Comptroller General of the United States, develop a strategic planning and performance measurement training component for its management training program and otherwise provide managers with an orientation on the development and use of strategic planning and program performance measurement.
SECTION 10. APPLICATION OF ACT.
No provision or amendment made by this Act may be construed as-
(1) creating any right, privilege, benefit, or entitlement for any person who is not an officer or employee of the United States acting in such capacity, and no person who is not an officer or employee of the United States acting in such capacity shall have standing to file any civil action in a court of the United States to enforce any provision or amendment made by this Act; or
(2) superseding any statutory requirement, including any requirement under section 553 of title 5, United States Code.
SECTION 11. TECHNICAL AND CONFORMING AMENDMENTS.
(a) Amendment to Title 5, United States Code.-The table of sections for chapter 3 of title 5, United States Code, is amended by adding after the item relating to section 305 the following:
"306. Strategic plans.".
(b) Amendments to Title 31, United States Code.-
(1) Amendment to chapter 11.-The table of sections for chapter 11 of title 31, United States Code, is amended by adding after the item relating to section 1114 the following:
"1115. Performance plans.
"1116. Program performance reports.
"1117. Exemptions.
"1118. Pilot projects for performance goals.
"1119. Pilot projects for performance budgeting.".
(2) Amendment to chapter 97.-The table of sections for chapter 97 of title 31, United States Code, is amended by adding after the item relating to section 9702 the following:
"9703. Managerial accountability and flexibility.
"9704. Pilot projects for managerial accountability and flexibility.".
(c) Amendment to Title 39, United States Code.-The table of chapters for part III of title 39, United States Code, is amended by adding at the end thereof the following new item:
"28. Strategic planning and performance management 2801".

121
Speaker of the House of Representatives.
Vice President of the United States and President of the Senate.