Embed Size (px)
Citation preview
A Sensitivity Analysis of an Epidemiological Model of Viral Marketing: When Viral Marketing Efforts Fall Flat
John T. Gardner
SUNY, College at Brockport
Kyongsei Sohn SUNY, College at Brockport
Joon Yong Seo
SUNY, College at Brockport
Jerald L. Weaver SUNY, College at Brockport
This paper offers insights for marketers implementing a viral marketing (VM) strategy. We examine how various factors in the campaign drive the threshold for ‘going viral’. Using an epidemiological model of disease propagation, we develop a framework which helps marketers better understand what drives VM success. We use a simulation approach to investigate the responses to various aspects of a VM campaign that a manager may manipulate. We find strong interactions across the parameters and there appear to be significant limits to the impact of larger viral message seeding. We also examine how to balance different components of a VM campaign should a campaign fail. INTRODUCTION
Subaru’s ‘First Car Story’ campaign involves a nifty application that produces a short video with music from a consumer-provided text of a short description of their first car. The firm paid for advertisements and other promotional avenues to seed the market with knowledge of how to make their own video clips. The application makes it simple to post the clips to various social media. This represents a typical and current approach to viral marketing (hereafter VM) wherein marketers develop a marketing message and encourage customers to forward this message to their contacts (van der Lans, Bruggen, Eliashberg, & Wierenga, 2010). VM has recently become a hot topic and generated a lot of excitement among practitioners and researchers. Hotmail generated 12 million subscribers in just 18 months with a marketing budget of only $50,000. Unilever’s Dove Evolution campaign generated over 2.3 million views in its first 10 days and three times more traffic to its website than the 30-second commercial that aired during the Super Bowl (van Wyck, 2007). Most recently, Oreo’s ‘You still dunk in the dark’ message immediately took off in cyberspace, generating a chain of retweeting and Facebook ‘likes’ (Schultz, 2013). These VM campaigns were successful in part because the marketers effectively utilized VM’s
Journal of Marketing Development and Competitiveness vol. 7(4) 2013 25
unique potential to reach large numbers of potential customers in a short period of time at a lower cost. While some VM campaigns take off, others fail. For every high-profile example of a successful VM campaign, there are many more VM attempts that fail (Watts & Peretti, 2007).
Implementing VM campaigns, marketers often face substantial challenges. In the case of Subaru’s ‘First Car Story’ campaign, for instance, if the campaign does not take off quickly, what is the reason and what should Subaru’s marketers do? Should they increase the size of seeding (the initial set of targeted consumers chosen by the initiator of VM campaign)? Should they better match the content of the message to the target market? Should they spend more on the programming of the video application to make it easier and more attractive? Or is the problem the mechanism for including the resultant video into social media? Marketing efforts addressing each of these issues will likely pay off to some extent, but most marketers have limited resources. Thus, it is important for marketers to first find out where in the VM process things are failing. A remaining and critical question is ‘Which of these issues should receive more attention than others to pass the threshold for a propagation of a marketing message throughout a target market?’
Despite increasing popularity of VM, there is little research that provides the foundation that marketers should bring to an analysis of a failing VM campaign. Most of the recent research on VM focuses on one component of VM campaigns (e.g., social network structures, seeding, etc.). Although these studies are helpful in understanding and improving a certain component of a VM campaign, as a result of focusing on one or two aspects of VM, they provide little insights into what the various components of a VM campaign are and how they must come together. The purpose of the present research is to help marketers take a holistic approach to a VM campaign and understand what can drive a propagation of a viral message. We provide a framework with which marketers can estimate their VM campaign and help them effectively decide where to direct their marketing efforts. To this aim, we develop a VM model based on epidemiology, the study of spread of disease in populations, and analyze relative impact of VM components on VM success or failure. We achieve this objective by conducting sensitivity analyses through computer simulations with various parameters under different scenarios and conditions.
The structure of this article is as follows. We start with a brief review of recent research on VM, particularly studies relying on epidemiology, followed by our VM definition. We then select a model of infectious epidemic spread and apply it to VM to explore different scenarios of the model, using different parameter values. We conclude with discussions of marketing implications of the model and our contributions. RESEARCH BACKGROUND
Word-of-mouth (WOM) marketing has attracted a great deal of attention among marketing practitioners. Compared to the traditional forms of communication that appear to be losing effectiveness, WOM strategies have higher possibility of overcoming consumer resistance (Nail, 2005). At significantly lower costs WOM can harness the willingness of customers to pass along the marketing message. In particular, Internet WOM marketing has attracted a number of marketing practitioners and researchers. By quantifying the effect of online WOM referrals, Trusov, Bucklin, and Pauwels (2009) find that online WOM referrals have significantly longer carryover effects than traditional forms of marketing. The Internet provides numerous arenas for individuals to share their views and experiences with others. Utilizing online communications appear increasingly important as more consumers rely on the Internet as information sources. Firms have adapted to these trends by shifting their marketing budget from mass media to online marketing activities (Hinz, Skiera, Barrot, & Becker, 2011). Further, WOM strategies can achieve significantly faster delivery through the Internet and mobile technology. All these advantages have led to a resurgence of interest in WOM strategies on the Internet.
One such strategy is VM which practitioners have widely accepted. A number of firms such as Procter & Gamble, Microsoft, BMW, and Samsung have gone viral. In a VM campaign, marketers typically develop a marketing message and stimulate consumers to share this message with members of
26 Journal of Marketing Development and Competitiveness vol. 7(4) 2013
their social network. Email viral campaigns emerged early in the Internet era in which marketers encourage consumers to send others emails containing a marketing message or a link to a commercial website (e.g., Hotmail). Recipients of the message are subsequently encouraged to forward the message to their contacts, and so on. VM continues to be critical for marketers to understand even if the viral email campaign is relatively passé. The nature of the Internet allows marketers to use various forms of communications such as video clips, games, interactive websites, and user-generated contents in their marketing campaigns. More recently, one of the fastest-growing arenas on the Internet is the social networking sites. Marketers are increasingly seeking to harness the potential of social networks for marketing purposes, which has revived the use of electronic viral campaigns. Since messages from other consumers’ social network sites likely have more impact than the traditional marketing communications (e.g., TV ads), VM can be a powerful marketing communication tool that may reach a number of consumers who try to avoid traditional marketing communications (De Bruyn & Lilien, 2008). Recent studies by Hinz et al. (2011), Yang and Zhou (2011), and Berger and Milkman (2012) illustrate an integral fabric of modern life that is associated with behavior, attitude, and messages towards VM. Mobile communications, online contents including video clips and coupons, texting, blogging, and many other technologically driven networking capacity help VM strategies remain relevant to current marketing studies. Recent Research on Viral Marketing
In general, recent studies on VM address one of five VM factors: message contents (Berger & Milkman, 2012; Gladwell, 2002), social network structures (Bampo, Ewing, Mather, Stewart, & Wallace, 2008), demographic and behavioral characteristics of target market (De Bruyn & Lilien, 2008), prediction of the number of people a VM message reaches (van der Lans et al., 2010), and seeding strategy (Hinz et al., 2011). Berger and Milkman (2012) investigate what type of online content is more likely to be shared. They show that content that evokes high (vs. low) -arousal positive or negative emotion is more viral and more practically useful, interesting, and surprising content is more viral. Bampo et al. (2008) find that social network structures have a significant impact on VM campaign performance and demonstrate that scale-free networks are most effective for VM performance. De Bruyn and Lilien (2008) find the similarities between social network members in values, likes, and experiences have positive impact on propagation of a viral message while demographic similarities have a negative impact. Van der Lans et al. (2010) develop viral branching model that predicts how many people will be reached by a VM campaign. Hinz et al. (2011) compare the performance of various seeding strategies and find that seeding to well-connected people is optimal because they are more likely to participate in VM campaigns and thus promise a wider spread of the viral message. Viral Marketing and Epidemiology
In epidemiology an epidemic is defined as a situation in which the number of the infective increases beyond the number initially infected. In the marketing context going viral may mean a situation where the marketing message is broadly received by the target market through person-to-person transmission. When a marketing message goes viral, it is analogous to an epidemic in that the message moves through a population by propagation through social networks in a relatively rapid and self-replicating manner. Due to this similarity between an epidemic and the VM process, marketing theorists and practitioners have long been relying on epidemiology. Multiple marketing phenomena exhibit viral properties, including traditional WOM, new product diffusion, email campaigns, and social networking-enabled campaigns, in that a marketing stimulus can be easily forwarded to multiple recipients through person-to-person contact.
A handful of marketing researchers have utilized epidemic models to study the spread of new products or marketing messages. Bass (1969) developed the famous new product diffusion model on the basis of a simple epidemic model developed by Bartlett (1960). Trusov et al. (2009) also use Bass’ model to estimate social contagion model in an online setting. Van der Lans et al. (2010) develop viral branching model to predict the reach of a VM campaign, also using insights from epidemiology to describe the spread of viruses as a branching process. Du and Kamakura (2011) explain interpersonal influence in the
Journal of Marketing Development and Competitiveness vol. 7(4) 2013 27

new product adoption process, using a hazard model derived from an epidemic model of contagion. In Hinz et al. (2011) epidemiology forms the foundation of the discussion of seeding in a VM campaign. Among marketing practitioners, epidemiological concepts are often used in more informal terms to explain the VM process (Godin 2003, 2011; Rosen, 2009; Southgate, Westoby, & Page, 2010).
In short, there are multiple contexts in which VM research adopts frameworks from epidemiology and utilizes them to study the VM process and to offer managerial implications. This is mainly because the viral metaphor neatly captures the essence of the propagation process of a viral message and draws on a rich body of the epidemiology literature (cf. Bampo et al., 2008). We follow this stream of research and refer back to the underlying theoretical foundation of the viral metaphor. The Current Research
Marketers face various substantial challenges. How should a marketer react to a failing VM campaign? What may be the consequence of improving certain components of a VM campaign on its overall performance? How should the various components be adjusted to efficiently launch or improve the campaign? These questions call for a deeper understanding of VM dynamics. Epidemic models have been developed to study and predict the whole process of disease spread. In spite of the origination of the term viral marketing and its connection to epidemiology, the extant research doses not fully exploit the epidemic model foundations. Overall, recent studies tend to investigate specific elements of having a successful VM campaign. While many of these studies utilize the concepts and terms from epidemiology, they tend to use the epidemiological foundation selectively, focusing on limited aspects of VM. As a result, most of the existing research does not fully address entire framework of VM and provides limited insight into the dynamic mechanism of the entire propagation process.
We believe a holistic approach to VM campaigns is needed for a better understanding of various VM components and how they must come together to create a successful marketing campaign. We refer back to the theory underpinning the viral metaphor and examine the applicability of an epidemic model to VM. In so doing, we develop a framework which helps marketers better understand what drives a VM success and how to balance different components of VM campaign should a campaign fail to meet its goals. We first develop a VM model on the basis of a standard epidemic model, and then conduct sensitivity analysis which will demonstrate relative impacts of various VM components on its success. Viral Marketing Definition
Understanding VM must start with a clear, useful, and rigorous definition of VM. Examination of the existing literature indicates that there is a lack of consensus on the definition of VM (Sohn, Gardner & Weaver, 2013). The theory for building a VM definition could come from the field of epidemiology, given the viral metaphor that underlies the term. One important issue for epidemiologists is that the disease agent is accurately replicated. While word-of-mouth transmission is never totally replicated, from a modeling perspective a mutated message would represent a new seed of a new potential epidemic. A marketer-initiated message typically should be accurately replicated to increase message effectiveness and achieve the marketing objective. To be consonant with the epidemiological foundations of viral spread, we propose that the marketing definition for VM should take accurate replication into account. A definition of VM compatible with this aspect of epidemiology would be as follows:
Viral marketing is a tactic utilizing marketer-initiated consumer activity that spreads a marketing message unaltered across a market or segment in a limited time period, mimicking an epidemic.
Thus, the message would be set and launched by a marketer with a specific goal in mind. The target
market audience would be predetermined, and successful VM would only be recognized if that population has been significantly penetrated. This definition emphasizes that the accurate replication of the message is critical for a VM campaign to be successful.
28 Journal of Marketing Development and Competitiveness vol. 7(4) 2013
THEORETICAL FRAMEWORK Selection of an Epidemiology Model
As discussed above, marketing research has used the theoretical foundation of epidemiology as there are a number of contexts in which VM research adopts frameworks from epidemiology. Given marketing researchers’ adoption of epidemiological frameworks and our definition of VM, epidemiological models should offer useful insights into understanding the entire mechanism of VM. There are several epidemic models from which to choose; the Susceptible-Infective-Recovered (SIR) (Kermack & McKendrick, 1927), the Susceptible-Exposed-Infective-Asymptomatic-Recovered (SEIAR) (Chowell, Nishiura & Bettencourt, 2006), the Susceptible-Infective-Recovered-Susceptible (SIRS) (Hethcote, 2000), etc. These compartmentalised models can explain progress of a VM campaign at different time periods (Leskovec, Adamic & Huberman, 2007). These snapshots can increase marketers’ success rate of a VM campaign. The current research uses the Susceptible-Exposed-Infective-Recovered (SEIR) model of infectious disease propagation. The SEIR model explains comprehensively the epidemiological view of the communicable disease spread by person to person contact. Yet, it is succinct enough to provide readily applicable insights for marketers since it does not require incorporation of vectors or complicated stochastic processes. We first explain the SEIR model and then provide a VM model that corresponds to each of the variables of the model. Susceptible-Exposed-Infective-Recovered (SEIR) Epidemic Model
The susceptible (S) are individuals who are at risk of catching the disease, and the exposed (E) are individuals who have been infected but are not yet infectious. The infective (I) have the disease and can transmit it to the susceptible. The recovered (R) are individuals who have had the disease, but have recovered and can no longer transmit it. For some of the infectious diseases, the recovered are always immune, but for other diseases, they can be re-infected. The following equation describes the SEIR epidemic model. Assuming the total size of the population (N) is fixed, the accounting identity of these groups is:
N = St + Et + It + Rt + Dt, (1)
where St represents number of the susceptible, Et the exposed, It the infective, Rt the recovered, and Dt the deceased all at time t. A compartmental diagram of the SEIR epidemic model is presented in Figure 1.
Journal of Marketing Development and Competitiveness vol. 7(4) 2013 29

FIGURE 1 SEIR COMPARTMENTAL MODEL DIAGRAM
From the stationary population, the initial conditions are:
S0 = N – E0 – I0 – R0 – D0 > 0, (2) where S0 > 0, I0 > 0, E0 = 0, R0 = 0 and D0 = 0. Some proportion of the susceptible becomes exposed after a brief latent period. The number of infections among the susceptible population in a period of time depends on the constant contact rate (δ) at a given period and the transmissibility (τ) of the disease given contact. The reduction in the number of the susceptible due to infection per period will be given by:
,NIS
NIS
dtdS tttt βδτ −=−= (3)
where β = δτ is called the infectivity parameter. The number of the exposed is augmented by the decrease in the number of the susceptible from (3) and is reduced by the number who become fully infectious:
,tt
tt EN
ISdtdE αβ −= (4)
where α is the rate at which the exposed become infectious. The number of individuals who are infectious depends upon the rate at which the exposed become infectious (α) and decreases by those who recover or die:
(π)
(β)
Susceptible Individuals
Exposed Individuals (E)
Infective Individuals (I)
Deceased Individuals
Recovered Individuals (R)
(α)
(γ)
(1-α)
30 Journal of Marketing Development and Competitiveness vol. 7(4) 2013

,)( tt IEdtdI πγα +−= (5)
where γ is the recovery rate and π is the mortality rate among the fully infectious. The change in the size of the recovered population is given by:
.tIdtdR γ= (6)
The number of deaths (D) at time t is given by:
,tIdtdD π= (7)
where π is the mortality rate among infective individuals.
For an epidemic driven by a novel strain of virus without a vector, assuming the entire population being susceptible, the parameters of the model can be summarized by a statistic called the basic reproductive ratio (R0). The ratio is equivalent to the average number of secondary cases taking place from the introduction of a single infective. In a simple deterministic epidemic model, if R0> 1, the introduction of an infective in a population will generate an epidemic. In the SEIR model, the basic reproductive ratio will be given by (Chowell et al., 2006):
.)(0 πγ
β+
=R (8)
In the epidemiology literature, an epidemic is defined as a situation in which the number of the
infective increases beyond the number initially infected (Last, 2001). In the marketing context, it would be a situation where a person-to-person network generates successful momentum for the message propagation so the marketing message is broadly received by the target market consumers.
TABLE 1 SUMMARY OF THE PARAMETERS IN THE SEIR MODEL
Parameter Meaning
Contact rate Delta () The rate of contact among individuals per period of time
Transmissibility Thau (τ) The probability that a contact between a susceptible and an infective resulting in transmission of the disease
Exit rate (or recovery rate) Gamma (γ) The constant removal rate for exiting the infectious state
Infectivity parameter Beta(β) (β= τ)
The infectivity of the disease or contact rate times transmissibility
Mortality rate Phi (π) The mortality rate among the infective
Journal of Marketing Development and Competitiveness vol. 7(4) 2013 31

The SEIR Model of Viral Marketing The concept of the virus’ relationship to the human immune system has a parallel in marketing. The
passive immune system is represented by the skin and the mucus membranes as examples. The parallel in marketing is consumers’ attention mechanisms that are seen by marketers as perceptual barriers that must be overcome for a message to be effectively communicated. The active immune system in humans is represented by white blood cells, t-cells, etc. The parallel in marketing is the hurdle that the marketer must clear in terms of cognitive (and often conscious) resistance to the message. Will the consumer perceive and accept the message? The entire hierarchy of effects model (Rogers, 1962) must be overcome to reach the ultimate goal of purchase. Similarly, a consumer must become aware of, understand, and accept the message, and be motivated by the message before infection – sharing the message – can occur.
A good example of an attempted VM campaign would be the Subaru campaign introduced earlier. It was designed to get consumers to go to a website, http://www.firstcarstory.com/, to create a short video with music and narration. The site allows one-click posting of the resultant video into multiple social media websites such as Facebook. One of the purposes of this campaign was possibly maximizing the target market exposure to Subaru brand. For the campaign to be fully successful, those visiting friends need to see the video and go on to create their own video for their own postings. If a critical mass of responses is achieved, the message connected with the making of the video will have gone viral. Using this as our example, it is clear that VM is still relevant even after the days of sharing cute pictures by email have passed. SEIR Variables and Marketing Equivalents
The variables in the SEIR model have clear parallels in marketing. N is the population-at-risk in epidemiology, while it would represent the target market in marketing. S is the susceptible, and in marketing this would be those in the target market that are not infective. Not infective means they are not sharing the message unchanged. E is the exposed portion of the target population. This language works fine for marketing since exposure to the marketing message is a typical marketing goal. I represents the infective, the individuals in the target market who are actively sharing the message. Finally, R represents the recovered, and in marketing these are those who have stopped sharing the message. In the marketing context, the recovered can be potentially moved back into the susceptible group through creative marketing or social forces. The deceased are not of great interest to marketer if they are really dead. In a practical sense, however, they could represent those who received negative feedback from sharing the message and are now soured from the campaign. For each variable the value varies at each time period. Individuals move from state to state. Figure 2 illustrates our VM model that is based on the SEIR model. The S variable is shaded in Figure 2, since S is thought to be the same initially as the target market as a whole from the perspective of this study. SEIR parameters and marketing equivalents
If the SEIR variables have clear meanings in marketing, what is the meaning of the parameters? α is the parameter that represents the likelihood of an individual transition from exposed to infective. In marketing it represents the probability of an exposed consumer becoming an active sharer of the message. α is the likelihood of moving from susceptible to exposed. In marketing it is the transition from being a member of the target market that is not currently sharing to being exposed to the message. It is a typical goal of a marketing effort to expose as much of the target market to the message as possible. All the infective must have been exposed, so the total marketing exposure rate is one minus the portion of the susceptible. γ is the transition rate from infective to recovered. In a marketing sense this means the rate at which individuals cease sharing. This could be from forgetting about the message or removing the message from a social network site. Overall, these parameters capture the dynamics of VM process very well.
32 Journal of Marketing Development and Competitiveness vol. 7(4) 2013

FIGURE 2 SEIR-BASED VM MODEL
(β) (α)
(π)
(γ)
SENSITIVITY ANALYSIS
With the marketing meaning of the SEIR model variables and parameters established, how do they respond as the values progress across a spectrum? Using Matlab ODE routine, we simulate the spread of a VM campaign with different scenarios of the SEIR epidemic model. Specifically, we test the model with various values of key model parameters and size of seeding. Our analysis is centered on how sensitive the VM performance is to the changes in parameter values. In particular, we focus on identifying parameter values that result in a failure of a VM campaign. Independent Effects of the Parameters
In the first set of analyses we look at independent effects of each of the three key parameters: α, β, and γ. Each scenario begins with baseline parameter values with an epidemic. Starting with α we gradually change the value of each parameter and demonstrate effects of lowering or raising each parameter until VM campaign falls flat. In each case all of the rest parameters are kept constant at the base case level. Second, we examine the interaction effects across the three parameters by simultaneously changing values of multiple parameters. Next, we present scenarios with possible treatments for a failed VM effort. Finally, we examine the effects of a very small seeding of infective compared to the baseline case. In each situation the sensitivity of the variables with respect to a baseline case are presented graphically. The baseline case of parameters are set at α = .5, β = .01 and γ = .1. The parameters chosen represent a strong epidemic. This case represents an exceptional marketing success such as the Hotmail success of last century. In each case time period in the graph spans from 0 to 60. Note that in epidemiology typically time units are measured in days. In our simulation time units are not specified, because different media and strategies would propagate at very different rates.
s Susceptible Individuals (S) Target Market
Infective Individuals (I) Actively Passing the Message
Recovered Individuals (R) Done Passing the Message
Exposed Individuals (E) Exposed to the Message
Oblivious: Exposed but did not Cross Perception
Threshold or
Mildly Receptive: Exposed and Perceived but not Motivated to Share the Message
Deceased Individuals (D) Individuals who received negative
feedback from sharing the message
Population
(1-α)
Journal of Marketing Development and Competitiveness vol. 7(4) 2013 33
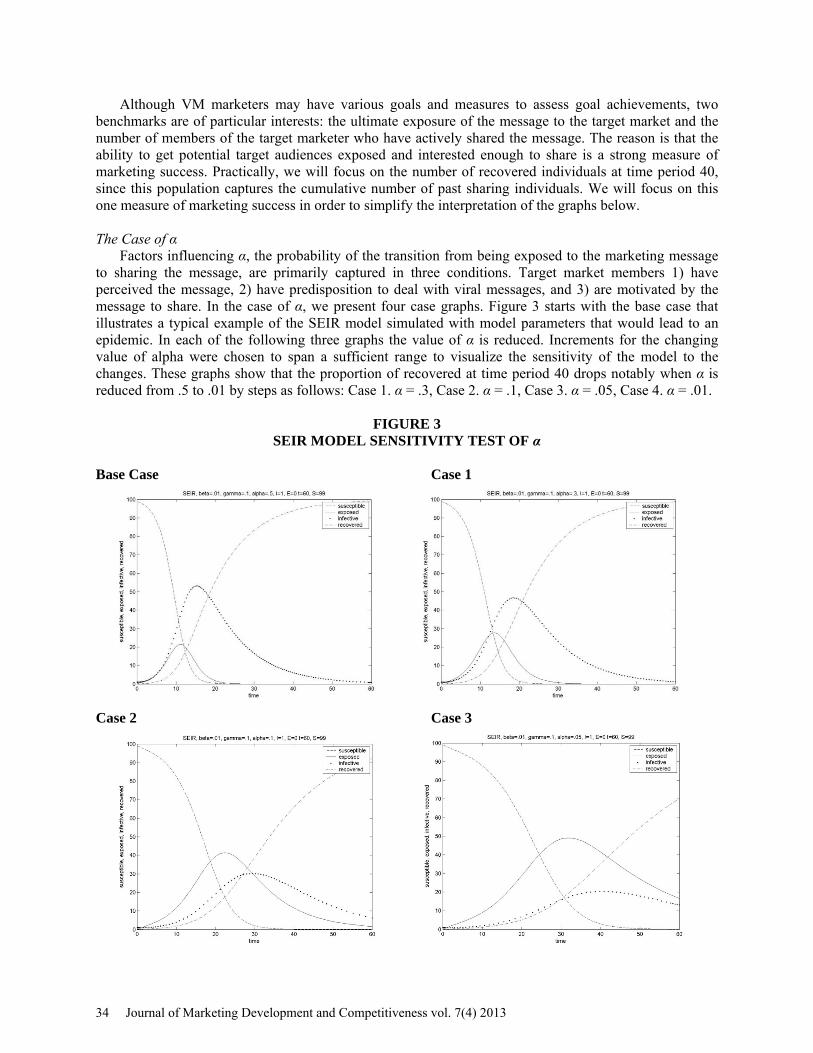
Although VM marketers may have various goals and measures to assess goal achievements, two benchmarks are of particular interests: the ultimate exposure of the message to the target market and the number of members of the target marketer who have actively shared the message. The reason is that the ability to get potential target audiences exposed and interested enough to share is a strong measure of marketing success. Practically, we will focus on the number of recovered individuals at time period 40, since this population captures the cumulative number of past sharing individuals. We will focus on this one measure of marketing success in order to simplify the interpretation of the graphs below. The Case of α
Factors influencing α, the probability of the transition from being exposed to the marketing message to sharing the message, are primarily captured in three conditions. Target market members 1) have perceived the message, 2) have predisposition to deal with viral messages, and 3) are motivated by the message to share. In the case of α, we present four case graphs. Figure 3 starts with the base case that illustrates a typical example of the SEIR model simulated with model parameters that would lead to an epidemic. In each of the following three graphs the value of α is reduced. Increments for the changing value of alpha were chosen to span a sufficient range to visualize the sensitivity of the model to the changes. These graphs show that the proportion of recovered at time period 40 drops notably when α is reduced from .5 to .01 by steps as follows: Case 1. α = .3, Case 2. α = .1, Case 3. α = .05, Case 4. α = .01.
FIGURE 3 SEIR MODEL SENSITIVITY TEST OF α
Base Case Case 1
Case 2 Case 3
34 Journal of Marketing Development and Competitiveness vol. 7(4) 2013

Case 4
At period 40 those who have recovered fall from over 90 to slightly below 10 in the lowest case for alpha. The last incremental decrease yielded a drastic drop in recovered and a failure to ‘go viral’. From these graphs it appears that while the number of infective is fairly sensitive to decreases in α in comparison to the lack of the sensitivity of the exposed, the total exposed target market population remains strong at period 40. Therefore, the primary effect of decreasing α appears to be a significant delay in achieving good marketing results, and in the extreme, a failure to take off (go viral). In conclusion, α, taken alone, has a fairly wide range of acceptable levels, given the goal of target market exposure to the viral message. The Case of β
β is the probability of transition from the target market to being exposed to the message. It includes two components. The first is the epidemiological concept of transmissibility. It is the likelihood of becoming exposed, given membership in the target market. Transmissibility is influenced by at least three elements: 1) the marketer’s efforts to seed the market with the message or the cumulative presence of the message in the environment, 2) the likelihood of passing along the message unchanged, and 3) the acceptability of the cost in time and effort to pass along the message. The second key component of β is the contact rate. This is primarily influenced by the extent to which a social network metrics is tight and the social network matches the characteristics of the target market.
To illustrate the effect of changing β on VM performance, we gradually decreased its value across four cases. Figure 4 starts with the same base case. In the following four graphs the value of β is reduced by a factor of .002 four times (Case 5. β = .008, Case 6. β = .006, Case 7. β = .004, Case 8. β = .002). While β drops from one percent to 0.2 percent over the range presented, at time period 40 the number of recovered drops from over 90 percent to less than 20 percent. For the early decreases of β, relatively small changes in the proportion of recovered are demonstrated though there is some delay in the campaign success due to the slow increase of the number of infective. The last incremental decrease yields a drastic drop in recovered and a failure to ‘go viral’. Compared to the case of α, the total change in β across the five graphs was small in an absolute sense. When we compared the impact of decreasing β against the impact of decreasing α, we found a more pronounced effect of smaller decreases in β relative to α. This suggests that managing β is critical in any VM campaign. This apparent threshold effect should give marketers a pause in any confidence they may have in replicating a past VM success.
S0 = the total number of initial susceptible in the target market
St = the number of susceptible in the target market at t E0 = the number of initial exposed in the target market Et = the number of exposed in the target market at t I0 = the number of initial infective (i.e., seeds) used in
the campaign It = the number of infective in the target market at t R0 = the number of initial recovered in the target market Rt = the number of recovered in the target market at t t = time unit (unspecified, maximum of 60 given for the
simulation)
Journal of Marketing Development and Competitiveness vol. 7(4) 2013 35
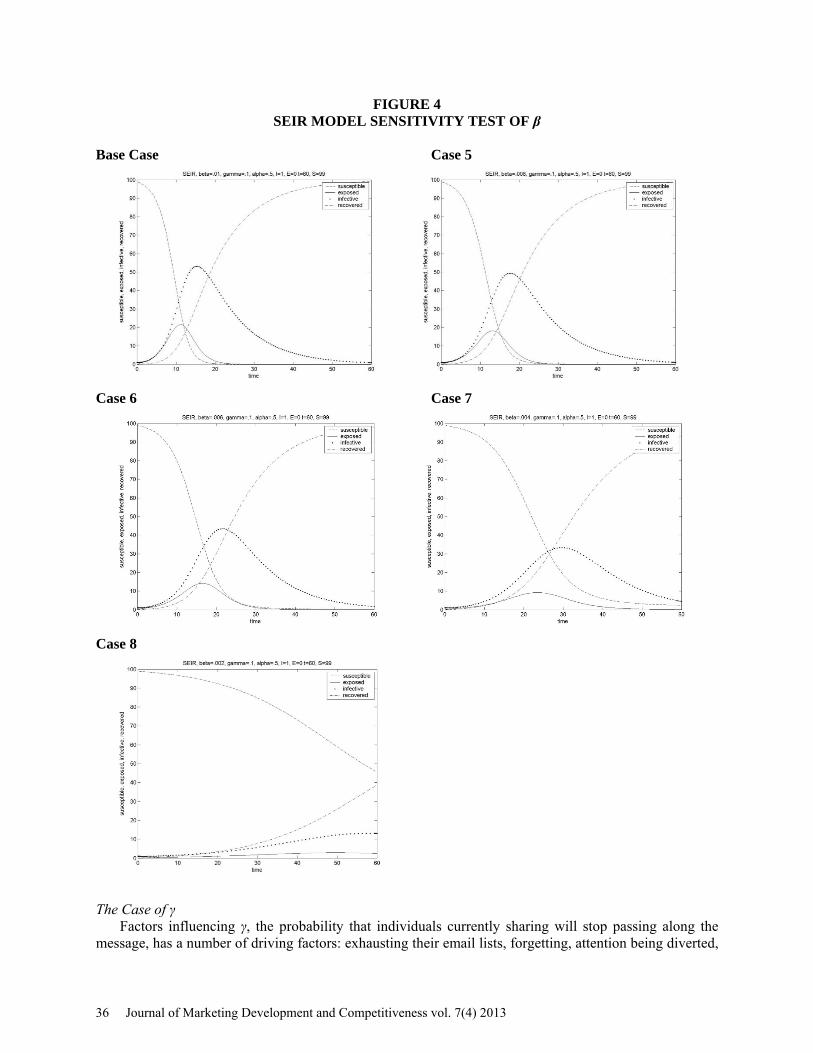
FIGURE 4 SEIR MODEL SENSITIVITY TEST OF β
Base Case Case 5
Case 6 Case 7
Case 8
The Case of γ Factors influencing γ, the probability that individuals currently sharing will stop passing along the message, has a number of driving factors: exhausting their email lists, forgetting, attention being diverted,
36 Journal of Marketing Development and Competitiveness vol. 7(4) 2013
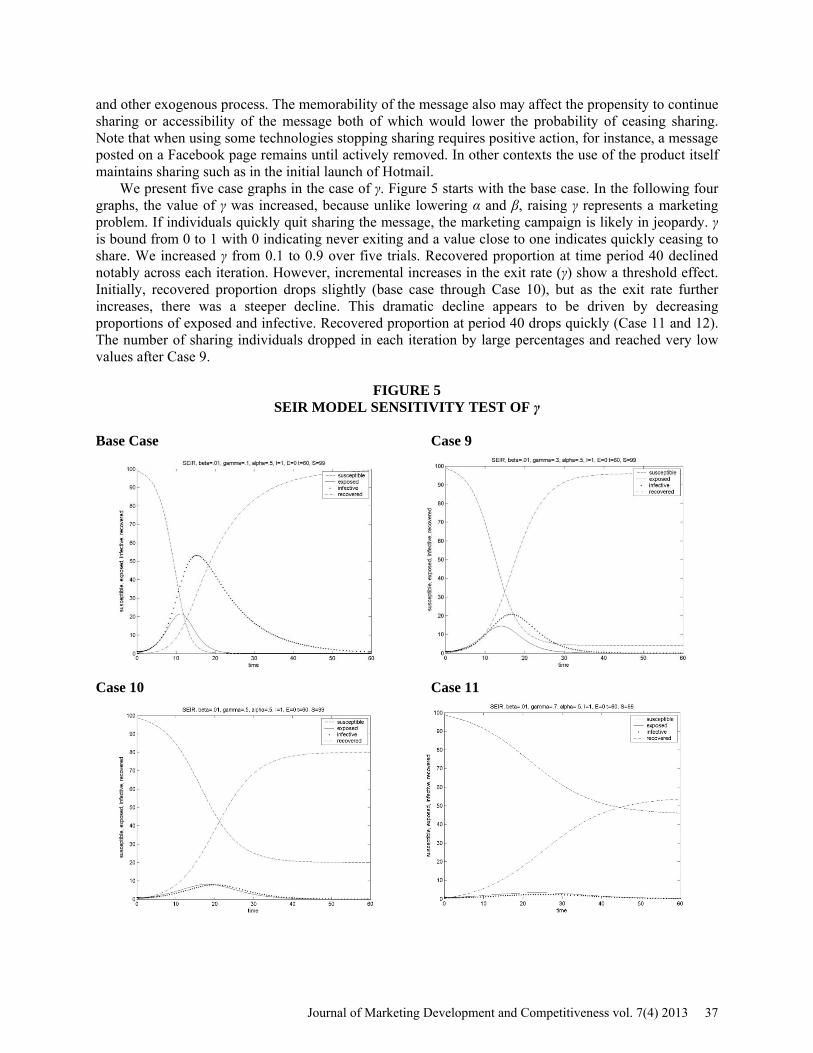
and other exogenous process. The memorability of the message also may affect the propensity to continue sharing or accessibility of the message both of which would lower the probability of ceasing sharing. Note that when using some technologies stopping sharing requires positive action, for instance, a message posted on a Facebook page remains until actively removed. In other contexts the use of the product itself maintains sharing such as in the initial launch of Hotmail. We present five case graphs in the case of γ. Figure 5 starts with the base case. In the following four graphs, the value of γ was increased, because unlike lowering α and β, raising γ represents a marketing problem. If individuals quickly quit sharing the message, the marketing campaign is likely in jeopardy. γ is bound from 0 to 1 with 0 indicating never exiting and a value close to one indicates quickly ceasing to share. We increased γ from 0.1 to 0.9 over five trials. Recovered proportion at time period 40 declined notably across each iteration. However, incremental increases in the exit rate (γ) show a threshold effect. Initially, recovered proportion drops slightly (base case through Case 10), but as the exit rate further increases, there was a steeper decline. This dramatic decline appears to be driven by decreasing proportions of exposed and infective. Recovered proportion at period 40 drops quickly (Case 11 and 12). The number of sharing individuals dropped in each iteration by large percentages and reached very low values after Case 9.
FIGURE 5 SEIR MODEL SENSITIVITY TEST OF γ
Base Case Case 9
Case 10 Case 11
Journal of Marketing Development and Competitiveness vol. 7(4) 2013 37
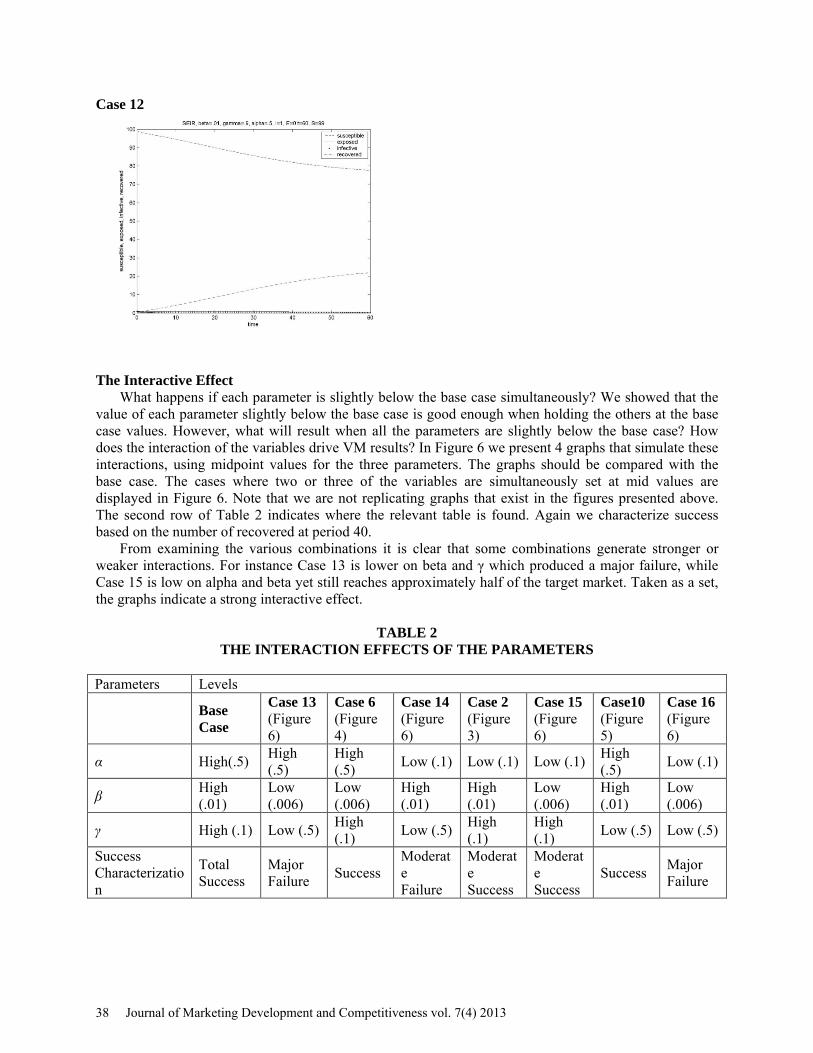
Case 12
The Interactive Effect
What happens if each parameter is slightly below the base case simultaneously? We showed that the value of each parameter slightly below the base case is good enough when holding the others at the base case values. However, what will result when all the parameters are slightly below the base case? How does the interaction of the variables drive VM results? In Figure 6 we present 4 graphs that simulate these interactions, using midpoint values for the three parameters. The graphs should be compared with the base case. The cases where two or three of the variables are simultaneously set at mid values are displayed in Figure 6. Note that we are not replicating graphs that exist in the figures presented above. The second row of Table 2 indicates where the relevant table is found. Again we characterize success based on the number of recovered at period 40.
From examining the various combinations it is clear that some combinations generate stronger or weaker interactions. For instance Case 13 is lower on beta and γ which produced a major failure, while Case 15 is low on alpha and beta yet still reaches approximately half of the target market. Taken as a set, the graphs indicate a strong interactive effect.
TABLE 2 THE INTERACTION EFFECTS OF THE PARAMETERS
Parameters Levels
Base Case
Case 13 (Figure 6)
Case 6 (Figure 4)
Case 14 (Figure 6)
Case 2 (Figure 3)
Case 15 (Figure 6)
Case10 (Figure 5)
Case 16 (Figure 6)
α High(.5) High (.5)
High (.5) Low (.1) Low (.1) Low (.1) High
(.5) Low (.1)
β High (.01)
Low (.006)
Low (.006)
High (.01)
High (.01)
Low (.006)
High (.01)
Low (.006)
γ High (.1) Low (.5) High (.1) Low (.5) High
(.1) High (.1) Low (.5) Low (.5)
Success Characterization
Total Success
Major Failure Success
Moderate Failure
Moderate Success
Moderate Success
Success Major Failure
38 Journal of Marketing Development and Competitiveness vol. 7(4) 2013
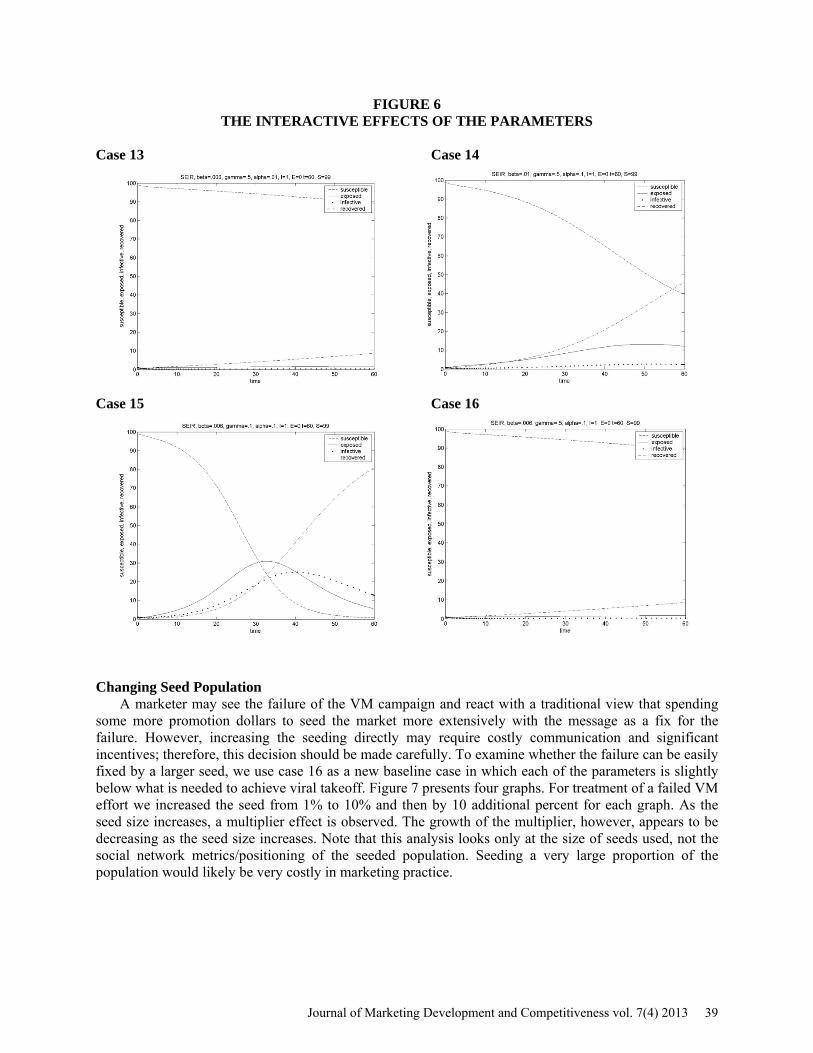
FIGURE 6 THE INTERACTIVE EFFECTS OF THE PARAMETERS
Case 13 Case 14
Case 15 Case 16
Changing Seed Population
A marketer may see the failure of the VM campaign and react with a traditional view that spending some more promotion dollars to seed the market more extensively with the message as a fix for the failure. However, increasing the seeding directly may require costly communication and significant incentives; therefore, this decision should be made carefully. To examine whether the failure can be easily fixed by a larger seed, we use case 16 as a new baseline case in which each of the parameters is slightly below what is needed to achieve viral takeoff. Figure 7 presents four graphs. For treatment of a failed VM effort we increased the seed from 1% to 10% and then by 10 additional percent for each graph. As the seed size increases, a multiplier effect is observed. The growth of the multiplier, however, appears to be decreasing as the seed size increases. Note that this analysis looks only at the size of seeds used, not the social network metrics/positioning of the seeded population. Seeding a very large proportion of the population would likely be very costly in marketing practice.
Journal of Marketing Development and Competitiveness vol. 7(4) 2013 39
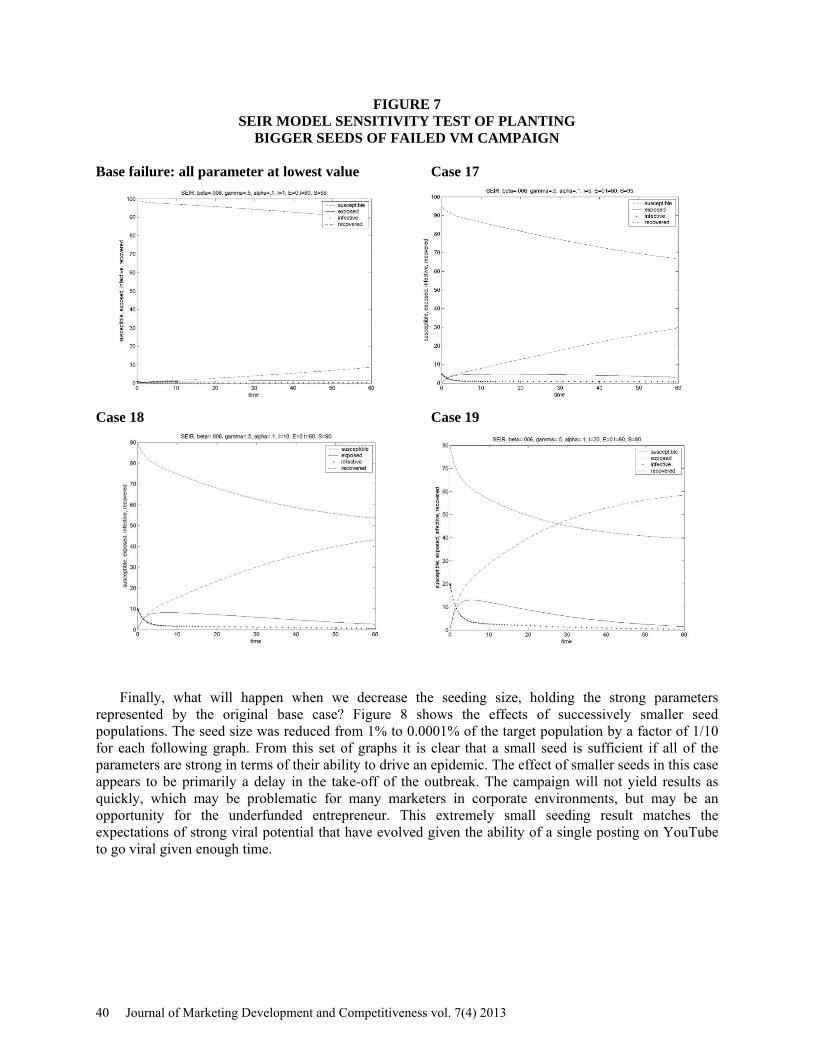
FIGURE 7 SEIR MODEL SENSITIVITY TEST OF PLANTING
BIGGER SEEDS OF FAILED VM CAMPAIGN Base failure: all parameter at lowest value Case 17
Case 18 Case 19
Finally, what will happen when we decrease the seeding size, holding the strong parameters represented by the original base case? Figure 8 shows the effects of successively smaller seed populations. The seed size was reduced from 1% to 0.0001% of the target population by a factor of 1/10 for each following graph. From this set of graphs it is clear that a small seed is sufficient if all of the parameters are strong in terms of their ability to drive an epidemic. The effect of smaller seeds in this case appears to be primarily a delay in the take-off of the outbreak. The campaign will not yield results as quickly, which may be problematic for many marketers in corporate environments, but may be an opportunity for the underfunded entrepreneur. This extremely small seeding result matches the expectations of strong viral potential that have evolved given the ability of a single posting on YouTube to go viral given enough time.
40 Journal of Marketing Development and Competitiveness vol. 7(4) 2013
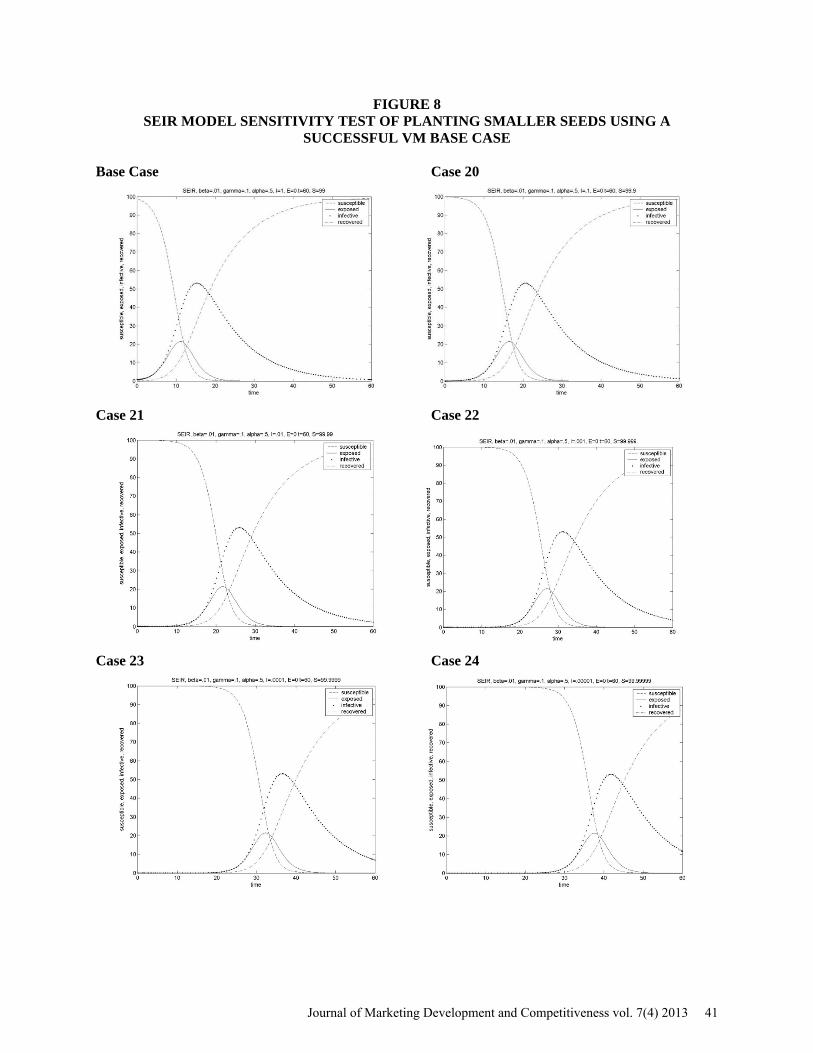
FIGURE 8 SEIR MODEL SENSITIVITY TEST OF PLANTING SMALLER SEEDS USING A
SUCCESSFUL VM BASE CASE Base Case Case 20
Case 21 Case 22
Case 23 Case 24
Journal of Marketing Development and Competitiveness vol. 7(4) 2013 41

In summary, our results show that seeding plays a critical role in VM, which confirms the findings from the recent spate of studies examining seeding approaches (cf. Hinz et al., 2011; van der Lans et al., 2010). The ability to attain a multiplier effect by larger or better seeding is clear. However, the ability to achieve the extremely large multiplier effect of a truly viral message cannot be duplicated through seeding enhancements. Note that seeding for Cases 1-11 assumes a seeding of 1% and they often achieve extremely high cumulative exposures. DISCUSSIONS
The current research focuses on the challenging decisions that marketers often face when a VM campaign does not take off quickly. The major purpose of this research was to help marketers better understand how various VM components must come together and effectively decide where to direct their marketing efforts for a successful marketing campaign. To this aim, we took a holistic approach to understanding the VM process by referring back to the viral metaphor and the epidemiology literature. We selected and applied an epidemic model (SEIR) to the marketing context and demonstrated that its variables and parameters have parallels in the marketing context. We explored different scenarios of the model with various parameter values independently. We also examined interactive effect of parameters by modifying each of the three parameters modestly in combination. Finally, we examined the effects of initially seeding a population by changing the number of individuals sharing the message at the outset. Major Findings
First, the transition from exposed to infective is a very complex marketing challenge. Message contents and attributes, target market characteristics, and environmental effects should all drive α, the probability of the transition from exposed to the marketing message to sharing the message. α is also influenced by perceptual barriers, motivations, and willingness to share. These are likely interactive and influenced by many outside forces. Through the sensitivity analyses we found that varying α alone has a notable influence on the number of exposed and infective, given the larger incremental probability changes used in the graphs as compared to the changes used for β. This means α has a wider range of acceptable levels, but as α drops below 0.1, VM effectiveness drops off quickly as shown in Case 4.
β, the probability of the transition from unexposed to the viral message to the exposed, also represents a complex process that involves both transmissibility and contact rate. Transmissibility is influenced by the marketers’ efforts to seed the market, the prevalence of the message in the market due to prior sharing, the likelihood of passing along the message unchanged, and finally, the cost in time and effort to pass along the message. Contact rate is also critical. This is primarily influenced by the tightness of the social network online or in real life and the fit of the social network to the target market. β was shown to have a more pronounced effect than α. Note that the relative magnitude of probabilities for state transitions to effect similar marketing result shifts. We decreased β gradually and found there is a threshold effect where an incremental decrease in β yielded a dramatic drop in exposure, which likely results in a relative failure of a VM campaign as shown in Case 8.
γ, the exit rate from the infective to the recovered, appears to be a relatively simple concept focusing on message persistence. One potential influence is how memorable the message is in the case where the message is transmitted by mouth or other active mechanisms. Also if the message is passed mechanically such as a posting online or by using a highly visible and distinct product that in use represents the message, then the transition to recovered state is often determined by a conscious decision to cease sharing. However, in our example of the first car story of Subaru, the sharing will diminish as the video moves down on the wall of the Facebook user’s site. Varying γ leads to a notable decline in the number of the infective (sharing individuals) at each iteration, while it showed a threshold effect on recovered proportion when we further decreased the value (see Case 12). Interestingly, when the exit rate was highest, recovered proportion was as high as above 20% even with a very small portion of infective, which may be considered a marketing success for firms with very limited budget and small market share.
42 Journal of Marketing Development and Competitiveness vol. 7(4) 2013

The analysis of the main effects of changes in α, β, and γ, indicated both thresholds and strong variations in the magnitude of parameter choices to see parallel epidemic effects.
In the interaction analysis the key problem of diagnosing a failed VM campaign becomes clearer. The failed campaign may well be caused by an interaction as in Case 13 or 16. Alternatively, a modest success as in Case 15 could be greatly improved by recognizing the interaction of α and β. We also looked at seed size, and we found that paying to better seed a population can pay off to some extent. However, the cost would likely be high to artificially induce a large percent of the target market to share. Increasing a seed size resulted in a multiplier effect in the number of exposed, although the growth of the multiplier decreased as the seed size further increased. On the other hand, a case with strong parameters (well executed VM message) requires only a very small seed. For a small seed or by extension a seed that is not optimally situated in a social network, the viral takeoff is delayed. Contributions and Implications
Most VM studies focus on one component of a VM campaign and do not provide a framework that marketers can use when analyzing a failing marketing campaign. As a result, they do not offer useful insights about how various VM elements should come together and where marketers should direct their efforts and resources. We referred back to the viral metaphor and the epidemiology literature. On the basis of the SEIR model, we developed a model which is succinct enough to provide a reasonable understanding of the VM mechanism. The model offers a guide to how each parameter of the epidemiological models enters and how they should be combined to achieve marketing objectives. Thus, one of our major contributions is providing a conceptual framework with which marketers can analyze the performance of their marketing campaign. In addition, our application of the epidemiological foundations to the VM context offers some cautions in looking at VM piece by piece independently and helps marketers take a holistic approach to understanding the whole VM process.
Our study addresses critical issues of VM when the target message is not sufficiently ‘viral.’ A major finding in this study centers on the issue of passing the threshold for a full epidemic-like propagation of a marketing message throughout a target market. The results demonstrate that a threshold for α, β and γ must be met to generate an epidemic, getting the marketing message to ‘go viral’. Some parameters have a clearer threshold than others. This information should help marketers decide where they should direct their marketing efforts to effectively increase the likelihood of going viral. The good news is that when the thresholds have been crossed, the propagation of the message is practically inevitable.
Through the sensitivity analysis we also analyzed the relative impact of VM components on marketing success. Our results show that the number of recovered, used as the major indicator of VM performance, are more sensitive to β than α or γ. This means varying β has more pronounced effect on the VM performance than varying α or γ, given equal probability shifts. Thus, marketers may need to take extra care when trying to meet the threshold of β. On the other hand, the results show no one parameter of the model dominates exclusively. The message, the context, the social network, the medium, the stability of the message, and all of the rest of the considerations are highly important and potentially interactive.
The current research extends recent findings by Hinz et al. (2011) which demonstrates a clear main effect of seeding in both simulation and real VM contexts. Hinz and colleagues held most of the variables in our models constant and examined the nature of the social network metrics. Extending this research, we examined whether and how various seeding sizes can fix a failing VM campaign. The result confirms previous finding that seeding can increase exposure to the target message significantly. When the parameters are weak and a marketing campaign falls flat, therefore, increasing seed size can be a costly but potentially effective strategy. A new implication from our analysis is that a small seed is sufficient when all the parameters are strong enough to drive an epidemic though it may cause some delay in market penetration. Our results also show that if a marketer is disappointed with VM results and suspects a seeding problem, the marketer should be aware that inadequate seeding appears to delay effectiveness. An otherwise strong campaign should not require large seeding.
In addition to these major contributions, by referring back to the epidemiology foundations, we provide some useful insights to marketers. In particular, our research sheds light on two VM elements to
Journal of Marketing Development and Competitiveness vol. 7(4) 2013 43
which researchers have paid little attention. First element is an accurate self-replication of a viral message. The epidemiology literature says an epidemic will not result from a disease without adequate virulence. Although in epidemiology a mutation may increase or decrease virulence, in marketing a mutation (i.e., an inaccurate replication of a marketing message by consumers) likely loses its effectiveness. A mutation may even have a negative impact on marketing success. Therefore, it is important for a marketer-initiated viral message to be accurately replicated. This means marketers need to make an extra effort to facilitate accurate replications of the viral message. Easy and accurate replications of a viral message can not only maximize the message effectiveness, but also encourage spread of the message by target audience. Marketers can achieve this by using electronic media or designing the product to communicate the message accurately and independently. The importance of accurate self-replications in the VM process is also reflected in our VM definition.
Another VM element this study illuminates is the exit rate (γ), the probability that individuals currently sharing will stop passing along the message. Apparently, increasing the number of individuals exposed to the target message and the number of consumers passing along the message is critical part of the VM process. Due to this, VM researchers tend to focus on these two elements. However, our model suggests the exit rate is another very important part of VM success in that the size of these two populations is quite sensitive to the change of the exit rate. This means marketers should pay a careful attention to this element. For example, γ will decrease if there is positive feedback as ‘friends’ respond to the forwarding or posting of the message (Sohn et al. 2012). This can be facilitated by creating appealing, pleasant, or useful viral message contents or encouraging target audience to give a positive feedback to the sender. Limitations
Although we could greatly benefit from the VM-epidemiology analogy, it should be acknowledged that the metaphor is not perfect. First, the SEIR model includes death, a situation that is not readily translated into marketing terms. In addition, in the marketing context an individual could move back into an infective state from a recovered state. This is not allowed by the mathematics of the SEIR model. Intuitively, the shift from a recovered state to actively sharing the message again seems unlikely. It should also be noted that the model does not treat time in a way that is clearly analogous to how time would be expressed in a typical VM environment. The days used in epidemiology may or may not be appropriate. Another limitation of our research is that the model is yet to be examined with actual data. Our model is built on appropriate epidemiology theory, and it is theoretically and mathematically sound. Yet, the model will provide more practical implications if it is tested with actual data. Finally, like other epidemic models, the SEIR model of VM requires special assumptions that may need to be modified for the managerial application. The rate of contact among individuals per period of time () is fixed. In addition, contacts among individuals are random and the probability (τ) that a contact between a susceptible and an infective resulting in transmission of the disease is constant during the course of an epidemic. In the VM context this means target population has the same probabilities of being exposed to and spread the viral message. These assumptions can be justified for a homogeneous market, but they will need to be relieved and modified for a heterogeneous population. Marketing segments’ behavioral variation in sharing behaviors may be critical. Future Research
The above discussion leads to some directions for future research. First, additional research into the size of the seeding, social network metrics, and their interactions with the strength of α, β, and γ is needed. Research approaches for predicting VM success should be developed through taking into account the threshold and interactive effects we demonstrated. Measures devised to diagnose failed VM campaigns should take into account the interactions as well. Second, case studies of VM campaigns can potentially offer insights into the most fruitful paths to understanding the threshold and interaction effects in real marketing campaigns. In addition, depth interviews with target market individuals may help inform the evolution of a campaign and contribute to a rich case. Finally, the meaning of time units in social
44 Journal of Marketing Development and Competitiveness vol. 7(4) 2013
network or other VM contexts is not well understood. The model used in this study typically uses days as the unit of time. It has yet to be answered what the best unit of time to use is in an electronic environment.
For most effective use of this model in practice methodology must be developed and compared, focusing on tracking populations according to their membership in the four states described in the model. Additionally, methodology must be developed and compared, focusing on the behavioral aspects which drive the transition probabilities of α, β, and γ. An extension of using epidemiological concepts to understand VM suggests that understanding the VM analogue to the immune system should be worthwhile for future research. Consumers’ resistance to sharing messages likely varies across individuals and segments. In particular, in electronic media environment what mediates the propensity to move from exposure to the message to actively sharing the message? Any barriers to this movement from exposure to an infective state would be analogous to the immune system. REFERENCES Barlett, M.S. (1960). Stochastic population models: ecology and epidemiology, London: Metheun and Company. Bampo, M., Ewing, M., Mather, D., Stewart, D. & Wallace, M. (2008). The effects of the social structure of digital networks on viral marketing performance. Information Systems Research, 19(3), 273-290. Bass, F.M. (1969). A new product growth for model consumer durables. Marketing Science, 15(5), 215-227. Berger, J., Milkman, K. L. (2012). What makes online content viral? Journal of Marketing Research, 49(2), 192-205. Chowell, G., Nishiura, H. & Bettencourt, L.M.A. (2006). Comparative estimation of the reproduction number for pandemic influenza from daily case notification data. Journal of the Royal Society Interface, doi:10.1098/rsif.2006.0161. De Bruyn, A. & Lilien, G. (2008). A multi‐stage model of word‐of‐mouth influence. International Journal of Research in Marketing, 25(3), 151‐163. Du, R.Y. & Kamakura, W.A. (2011). Measuring contagion in the diffusion of consumer packaged goods. Journal of Marketing Research, 48(1), 28-47. Godin, S. (2003). Purple cow: Transform your business by being remarkable. New York: Penguin Group. Godin, S. (2011). Unleashing the ideavirus. New York: Hyperion. Hethcote, H.W. (2000). The mathematics of infectious disease. SIAM Review, 42(4), 599-653. Hinz, O., Skiera, B., Barrot, C. & Becker, J. U. (2011). Seeding strategies for viral marketing: An empirical comparison. Journal of Marketing, 75(6), 55-71. Kermack, W.O. & McKendrick, A.G. (1927). Contribution to the mathematical theory of epidemics. Proceedings of the Royal Society, 115, 700-721. Last, J.M. (2001). A dictionary of epidemiology, New York: Oxford University Press.
Journal of Marketing Development and Competitiveness vol. 7(4) 2013 45
Leskovec, J., Adamic, L.A. & Huberman, B.A. (2007). The Dynamics of Viral Marketing, ACM Transactions on the Web (TWEB), 1(1), Art 5. Nail, J. (2005). What’s the buzz on word-of-mouth marketing? Social computing and consumer control put momentum into viral marketing, Retrieved from http://www.Forrester.com/Research/Document/Excerpt/0,7211,36916,00.html Newman M.E.J. (2002). Spread of epidemic disease on networks. Physical Review. 66(1), 1-12. Palka, W., Pousttchi, K. & Wiedemann D.G. (2009). Mobile word-of-mouth - a grounded theory of mobile viral marketing. Journal of Information Technology, 24(2), 172-185. Rogers, E.M. (1962). Diffusion of innovation. New York: Free Press. Rosen, E. (2009). The Anatomy of Buzz Revisited. New York: Crown Business. Schultz, E. J. (2013). “Oreo,” Advertising Age, 84(8), 32. Sohn, K., Gardner, J. & Weaver, J. (2013), “Viral marketing – more than a buzzword,” Journal of Applied Business and Economics, 14(1), 21-42. Southgate, D., Westoby, N. & Page, G. (2009). Creative determinants of viral video viewing. International Journal of Advertising, 29(3), 349-368. Trusov, M., Bucklin, R.E. & Pauwels, K. (2009). Effects of word-of-mouth versus traditional marketing: Findings from an Internet social networking site. Journal of Marketing, 73(5), 90–102. Van den Bulte, C. & Joshi Y.V. (2007). New product diffusion with independents and imitators. Marketing Science, 26(3), 400–421. van der Lans, R., van Bruggen, G., Eliashberg, J. & Wierenga, B. (2010). A viral branching model for predicting the spread of electronic word of mouth. Marketing Science, 29(2), 348-365. van Wyck, S. (2007). Viral is worth the investment. B&T Weekly, 57(2600), 14. Yang, H. & Zhou, L. (2011). Extending TPB and TAM to mobile viral marketing: An exploratory study on American young consumers' mobile viral marketing attitude, intent and behavior. Journal of Targeting, Measurement & Analysis for Marketing, 19(2), 85-98.
46 Journal of Marketing Development and Competitiveness vol. 7(4) 2013