Embed Size (px)
Citation preview
A Spatial-Temporal Contextual Kernel Method
for Generating High-Quality Land-Cover Time Series
Adam Wehmann
Thesis Defense Presentation
23 April 2014
Email: [email protected] Department of GeographyThe Ohio State University

Outline
• Introduction• Background• Methods• Results• Discussion• Conclusion

Introduction
Introduction
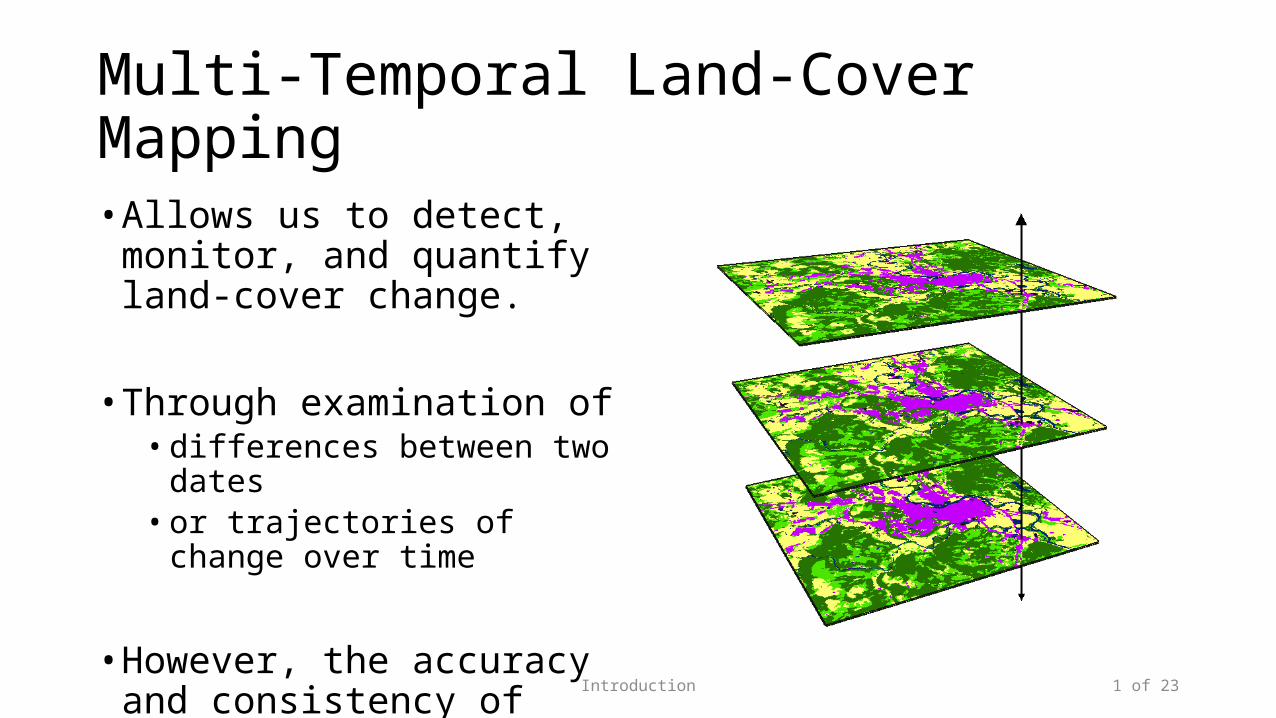
Multi-Temporal Land-Cover Mapping
• Allows us to detect, monitor, and quantify land-cover change.
• Through examination of• differences between two dates• or trajectories of change over time
• However, the accuracy and consistency of land-cover time series is paramount!
1 of 23
Introduction
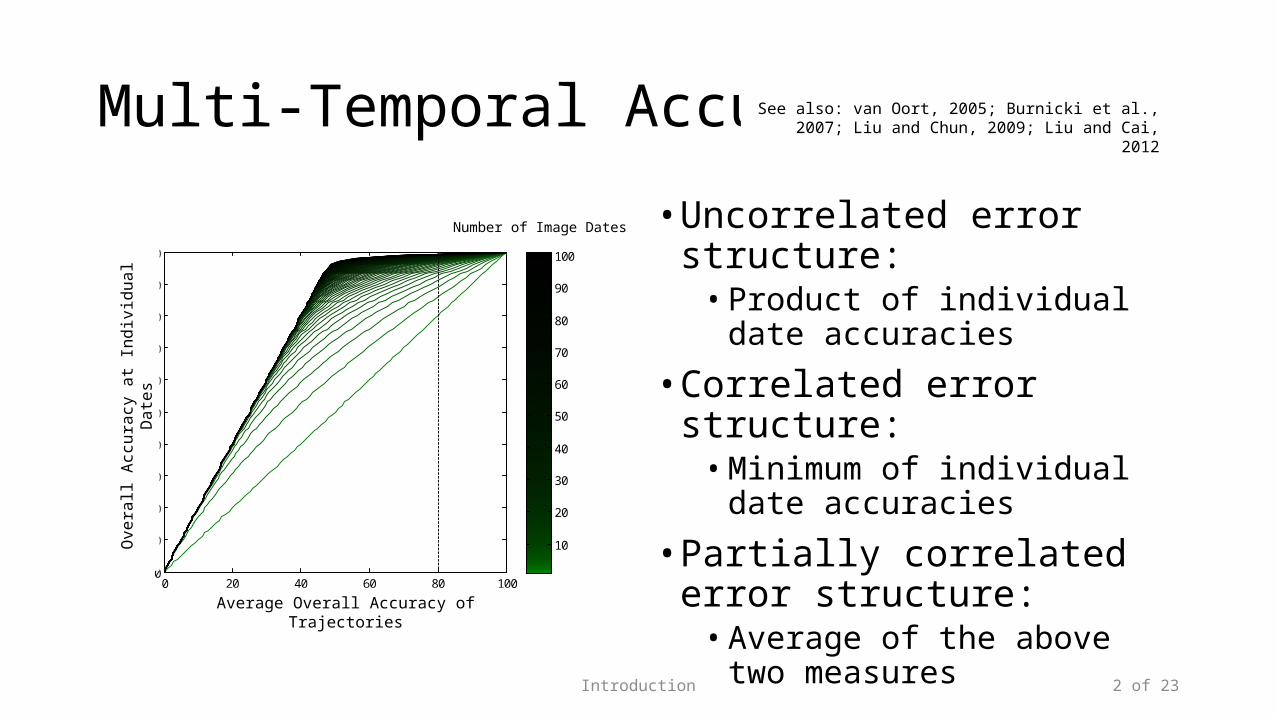
Multi-Temporal Accuracy
0 20 40 60 80 1000
10
20
30
40
50
60
70
80
90
100
Average Overall Accuracy of Trajectories
Ove
rall
Acc
urac
y at
Ind
ivid
ual D
ates
10
20
30
40
50
60
70
80
90
100
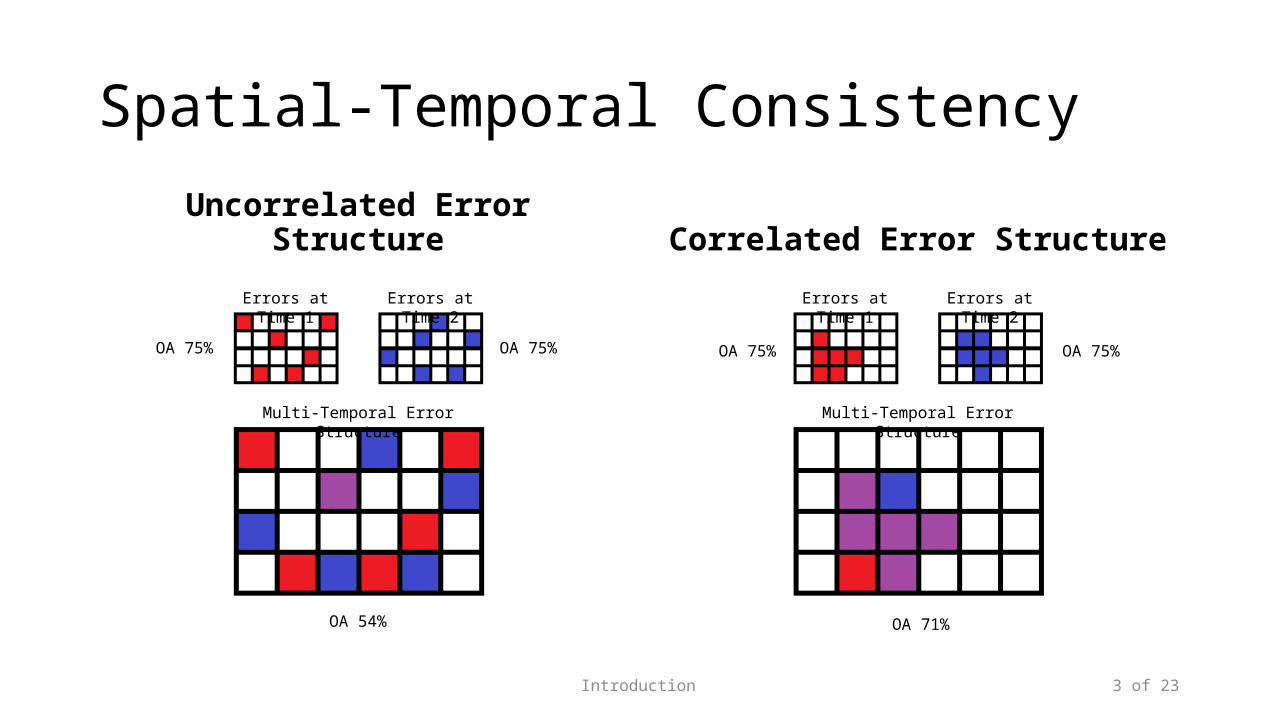
• Uncorrelated error structure:• Product of individual date
accuracies
• Correlated error structure:• Minimum of individual date
accuracies
• Partially correlated error structure:
• Average of the above two measures
Number of Image Dates
Average Overall Accuracy of Trajectories
Ove
rall
Accu
racy
at I
ndiv
idua
l Dat
esSee also: van Oort, 2005; Burnicki et al., 2007; Liu and Chun,
2009; Liu and Cai, 2012
2 of 23
Introduction
Spatial-Temporal Consistency
Uncorrelated Error Structure Correlated Error Structure
Errors at Time 1 Errors at Time 2
Multi-Temporal Error Structure
3 of 23
Errors at Time 1 Errors at Time 2
Multi-Temporal Error Structure
OA 75% OA 75%
OA 54%
OA 75% OA 75%
OA 71%
Introduction
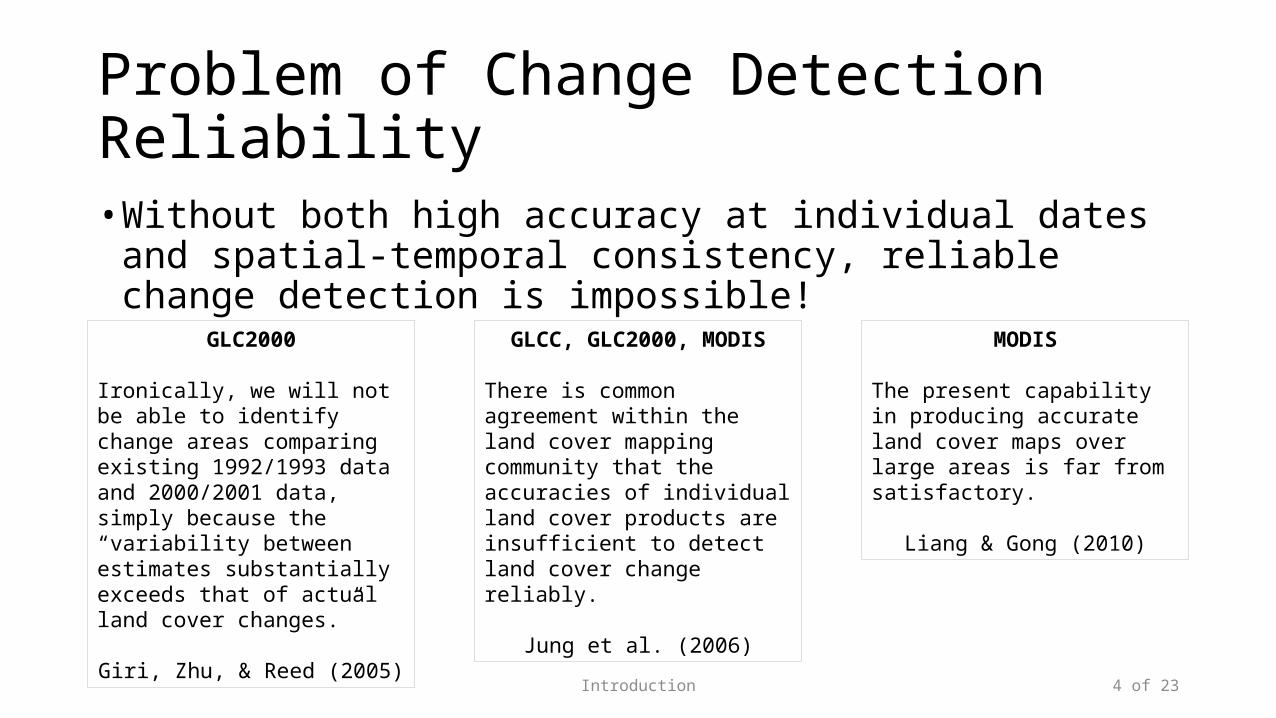
Problem of Change Detection Reliability• Without both high accuracy at individual dates and spatial-temporal
consistency, reliable change detection is impossible!
GLC2000
Ironically, we will not be able to identify change areas comparing existing 1992/1993 data and 2000/2001 data, simply because the “variability between estimates substantially exceeds that of actual land cover changes.”
Giri, Zhu, & Reed (2005)
GLCC, GLC2000, MODIS
There is common agreement within the land cover mapping community that the accuracies of individual land cover products are insufficient to detect land cover change reliably.
Jung et al. (2006)
MODIS
The present capability in producing accurate land cover maps over large areas is far from satisfactory.
Liang & Gong (2010)
4 of 23
Introduction
Solution and Objective of Thesis
• Contextual classification offers ability to make better use of geographic information, yet variously:
• Existing methods can better use contextual information.• Existing methods lack integration of classifiers.• Existing methods are not resistant to sensor advancement.
• Objective: Advance methodology for multi-temporal land-cover mapping through the development of contextual classifier that:
1. Improves classification accuracy over the state-of-the-art.2. Increases spatial-temporal consistency among land-cover maps.3. Remains robust against advances in remote sensor technology.
5 of 23

Background
Background
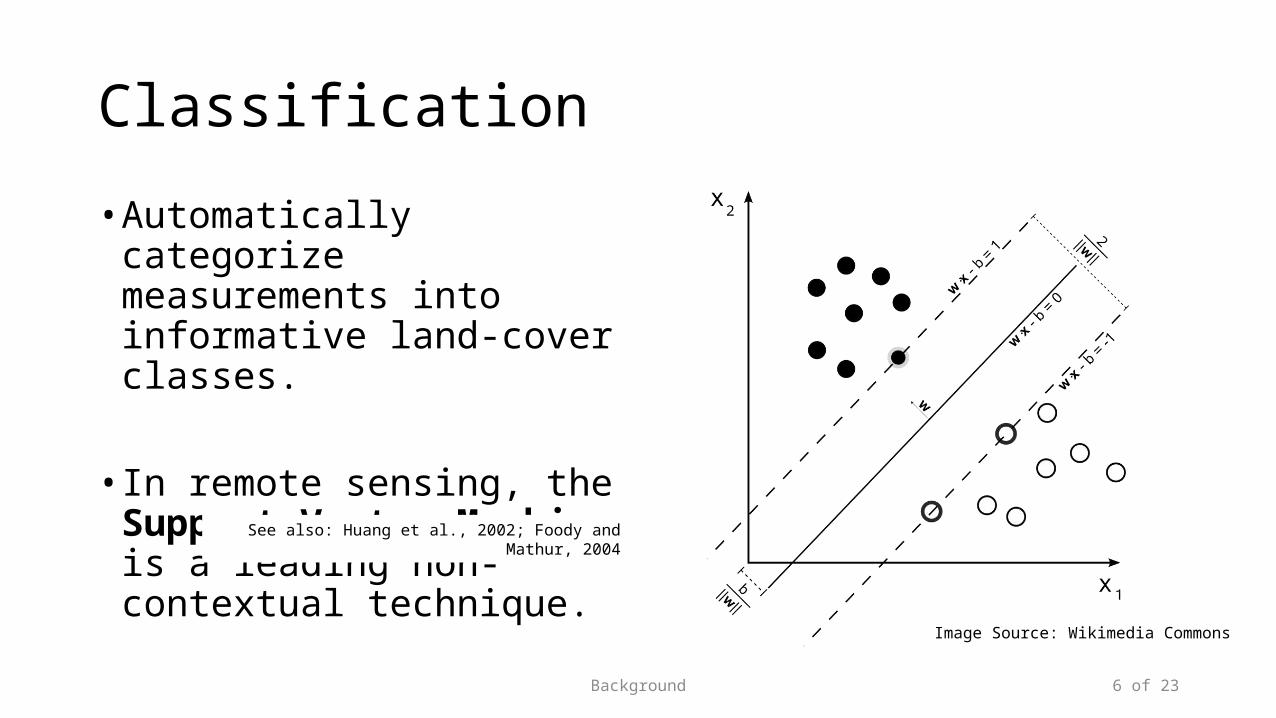
Classification
• Automatically categorize measurements into informative land-cover classes.
• In remote sensing, the Support Vector Machine is a leading non-contextual technique.
Image Source: Wikimedia Commons
See also: Huang et al., 2002; Foody and Mathur, 2004
6 of 23
Background
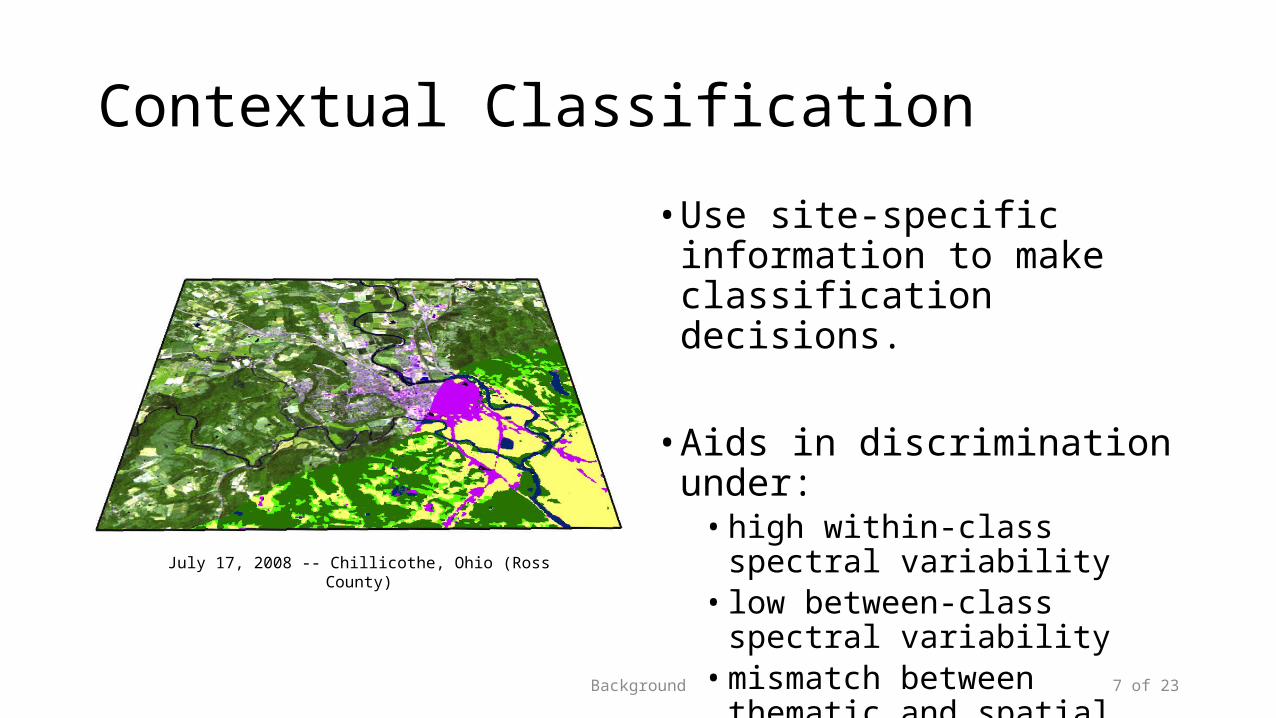
Contextual Classification
• Use site-specific information to make classification decisions.
• Aids in discrimination under:• high within-class spectral
variability• low between-class spectral
variability• mismatch between thematic and
spatial resolutions
7 of 23
July 17, 2008 -- Chillicothe, Ohio (Ross County)
Background
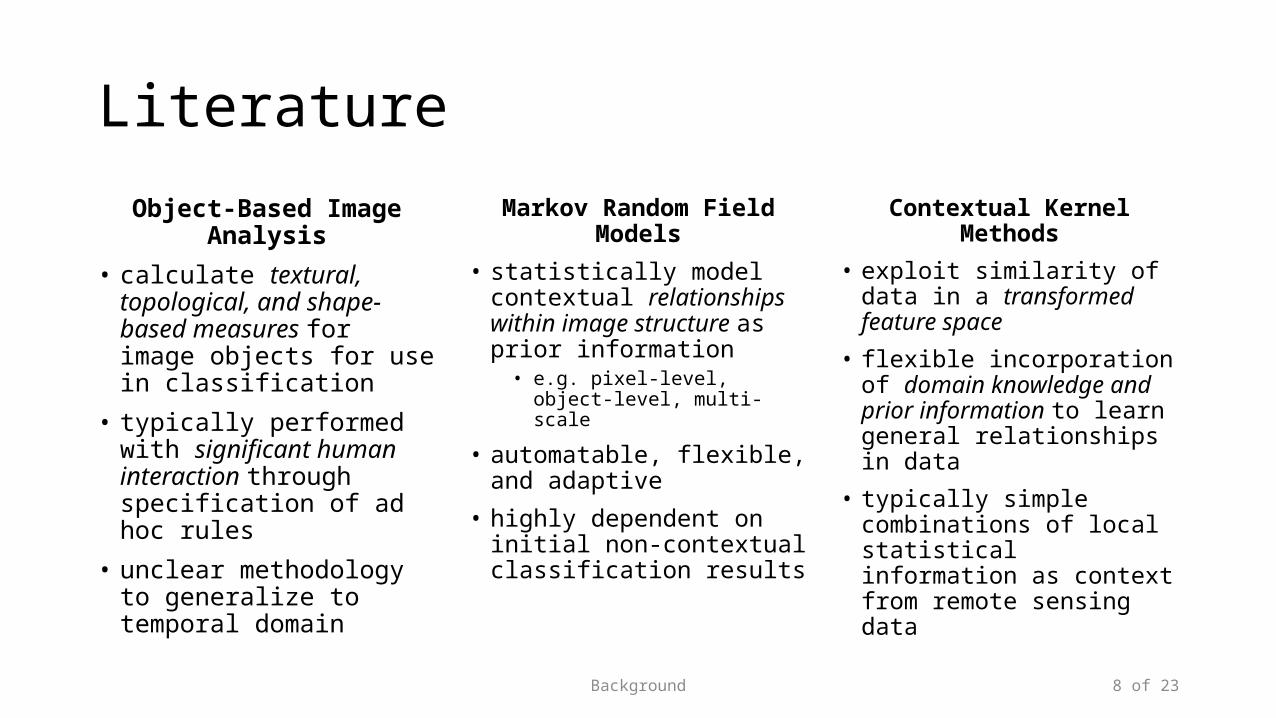
Literature
Object-Based Image Analysis
• calculate textural, topological, and shape-based measures for image objects for use in classification
• typically performed with significant human interaction through specification of ad hoc rules
• unclear methodology to generalize to temporal domain
Markov Random Field Models
• statistically model contextual relationships within image structure as prior information
• e.g. pixel-level, object-level, multi-scale
• automatable, flexible, and adaptive
• highly dependent on initial non-contextual classification results
Contextual Kernel Methods
• exploit similarity of data in a transformed feature space
• flexible incorporation of domain knowledge and prior information to learn general relationships in data
• typically simple combinations of local statistical information as context from remote sensing data
8 of 23

Methods
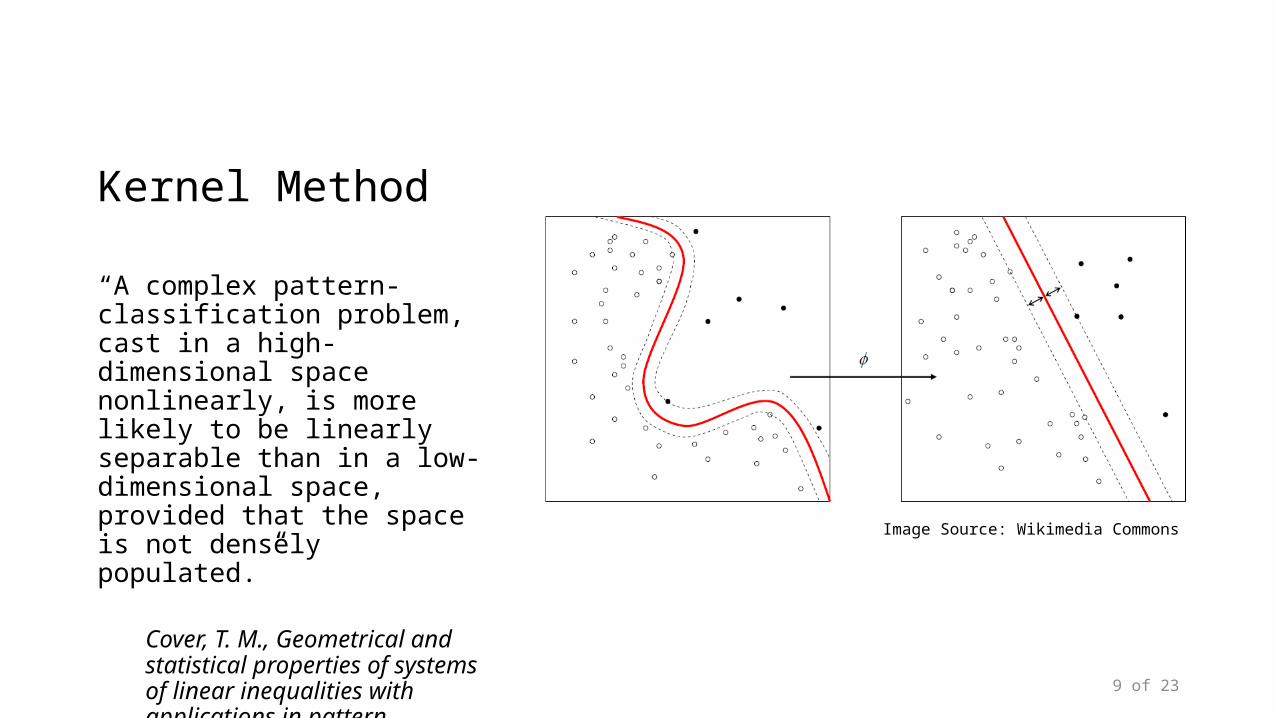
Kernel Method
“A complex pattern-classification problem, cast in a high-dimensional space nonlinearly, is more likely to be linearly separable than in a low-dimensional space, provided that the space is not densely populated.”
Cover, T. M., Geometrical and statistical properties of systems of linear inequalities with applications in pattern recognition, 1965
9 of 23
Image Source: Wikimedia Commons
Methods
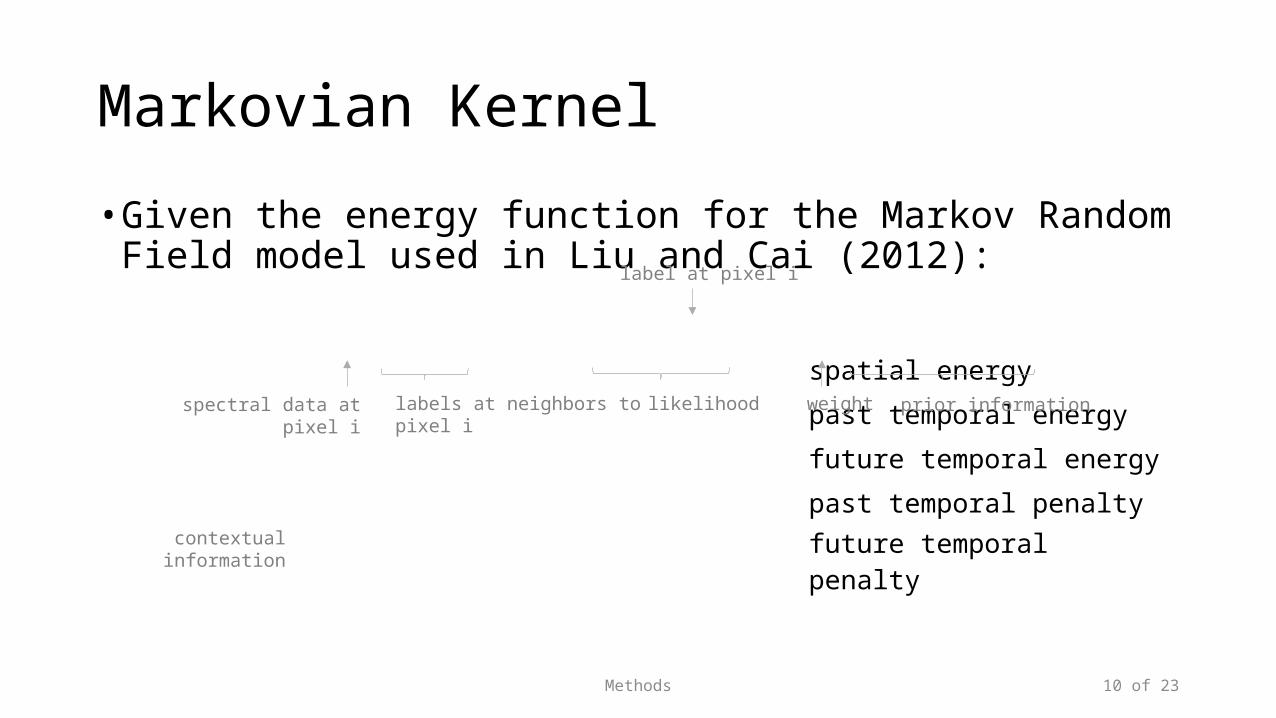
Markovian Kernel
• Given the energy function for the Markov Random Field model used in Liu and Cai (2012):
spatial energy past temporal energy future temporal energy past temporal penalty future temporal penalty
contextual information
label at pixel i
labels at neighbors to pixel i likelihood prior informationweightspectral data at pixel i
10 of 23
Methods
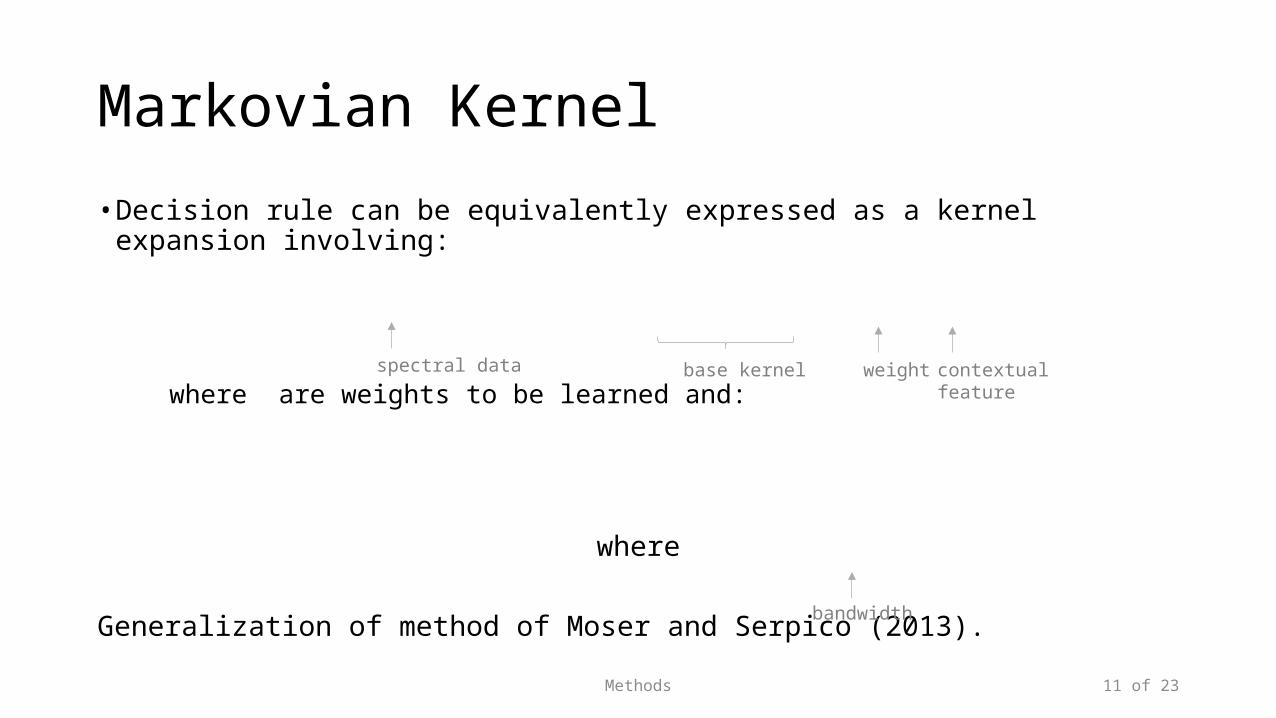
Markovian Kernel
• Decision rule can be equivalently expressed as a kernel expansion involving:
where are weights to be learned and:
where
Generalization of method of Moser and Serpico (2013).
base kernel weight contextual featurespectral data
bandwidth
11 of 23
Methods
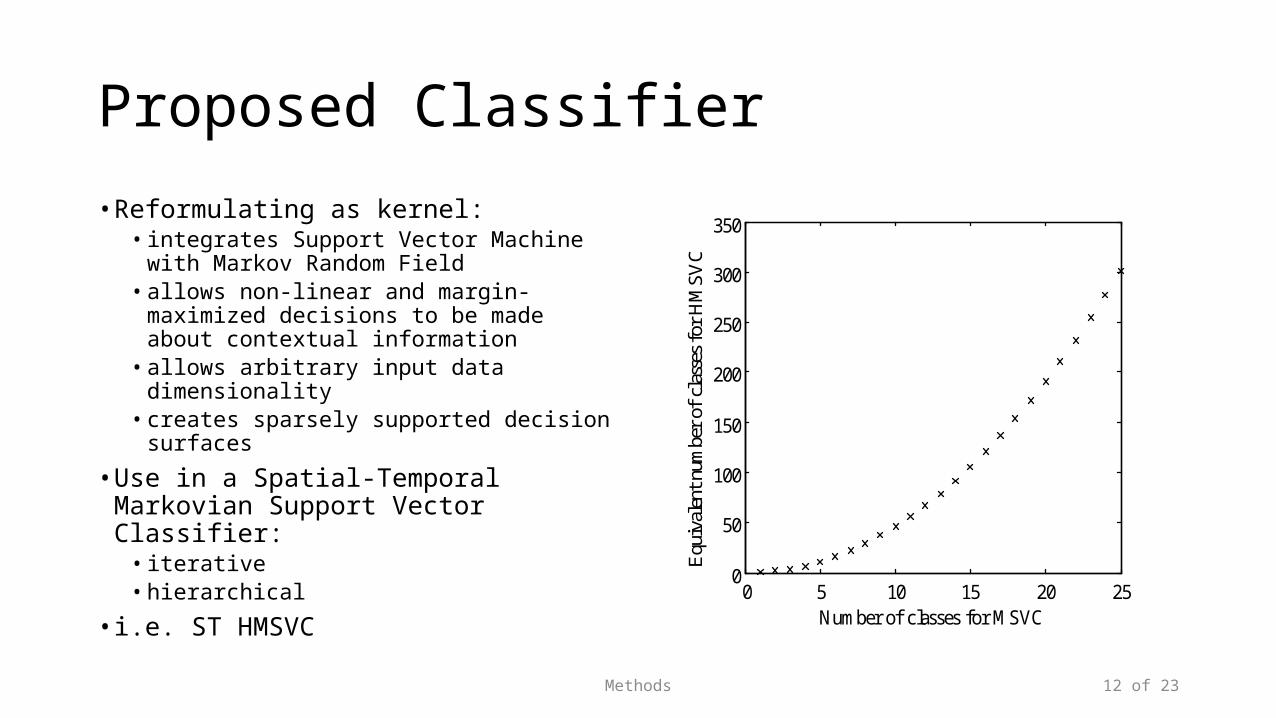
Proposed Classifier
• Reformulating as kernel:• integrates Support Vector Machine with
Markov Random Field• allows non-linear and margin-maximized
decisions to be made about contextual information
• allows arbitrary input data dimensionality• creates sparsely supported decision
surfaces
• Use in a Spatial-Temporal Markovian Support Vector Classifier:
• iterative• hierarchical
• i.e. ST HMSVC
0 5 10 15 20 250
50
100
150
200
250
300
350
Number of classes for MSVC
Equ
ival
ent n
umbe
r of
cla
sses
for
HM
SVC
12 of 23
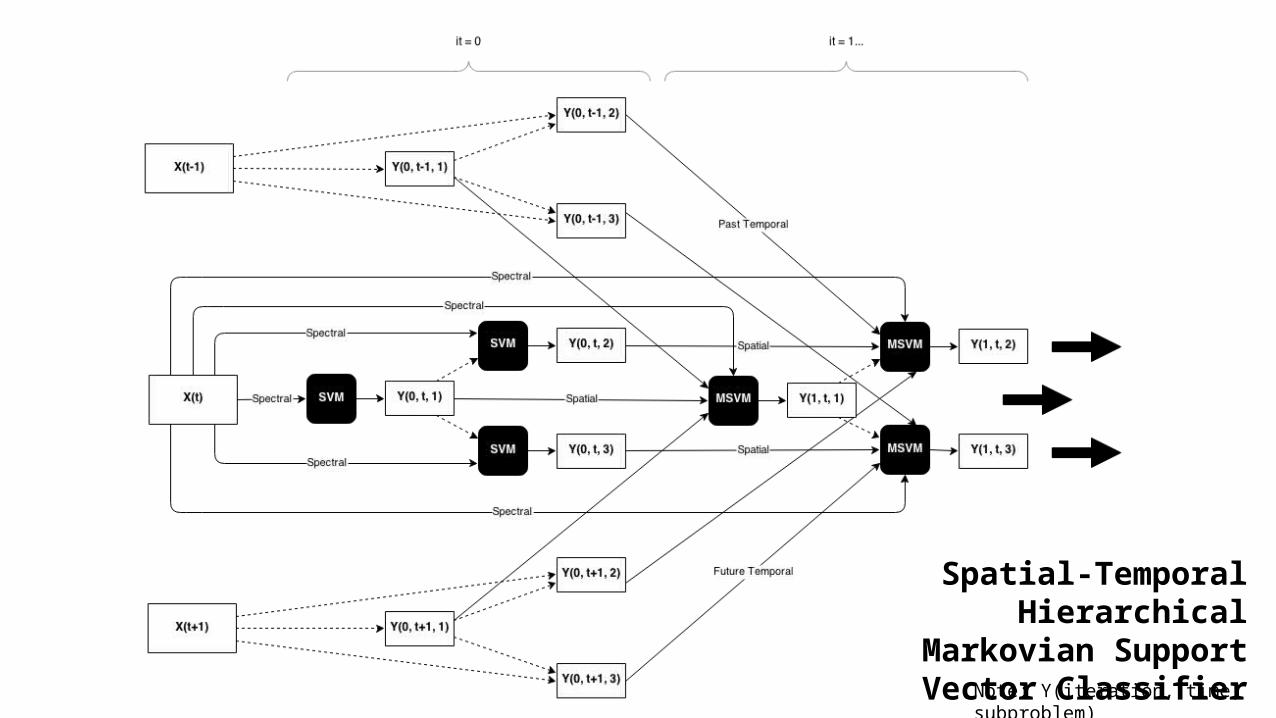
Spatial-Temporal Hierarchical Markovian Support Vector
ClassifierNote: Y(iteration, time, subproblem)

Results
Results
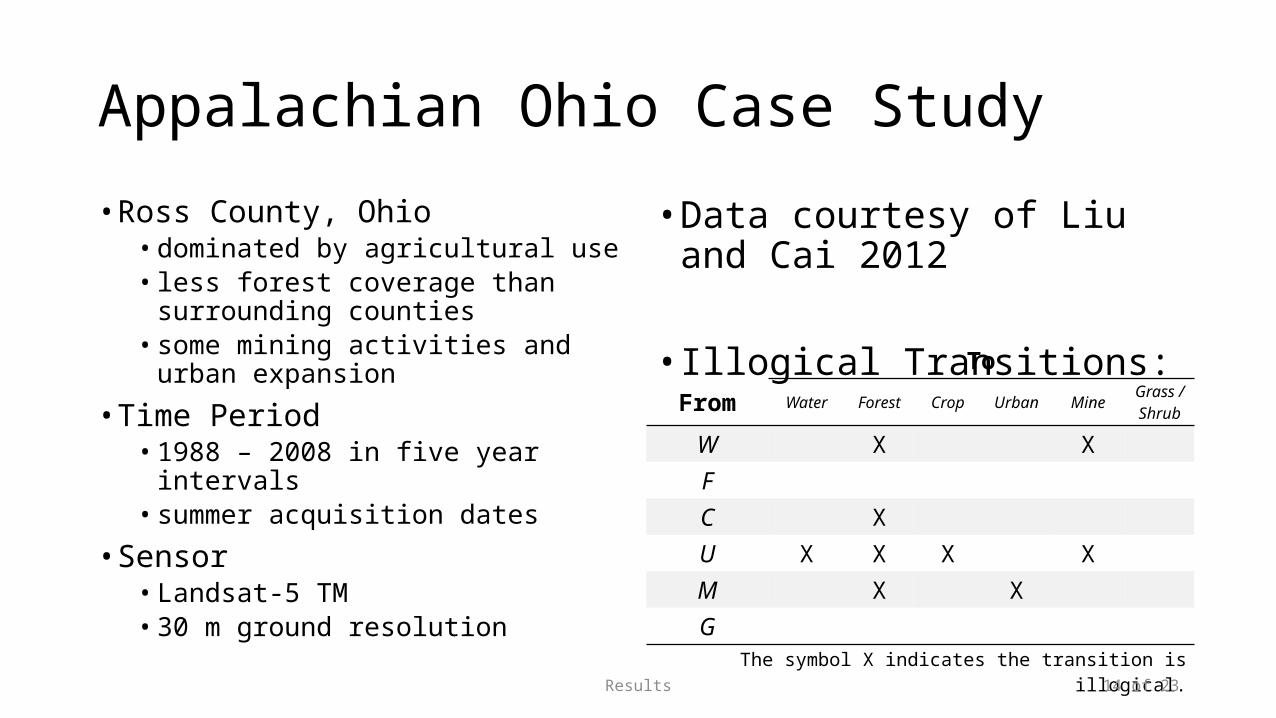
Appalachian Ohio Case Study
• Ross County, Ohio• dominated by agricultural use• less forest coverage than surrounding
counties• some mining activities and urban
expansion
• Time Period• 1988 – 2008 in five year intervals• summer acquisition dates
• Sensor• Landsat-5 TM• 30 m ground resolution
• Data courtesy of Liu and Cai 2012
• Illogical Transitions: ToFrom Water Forest Crop Urban Mine Grass /
Shrub
W X X F C X U X X X X M X X G
The symbol X indicates the transition is illogical.
14 of 23
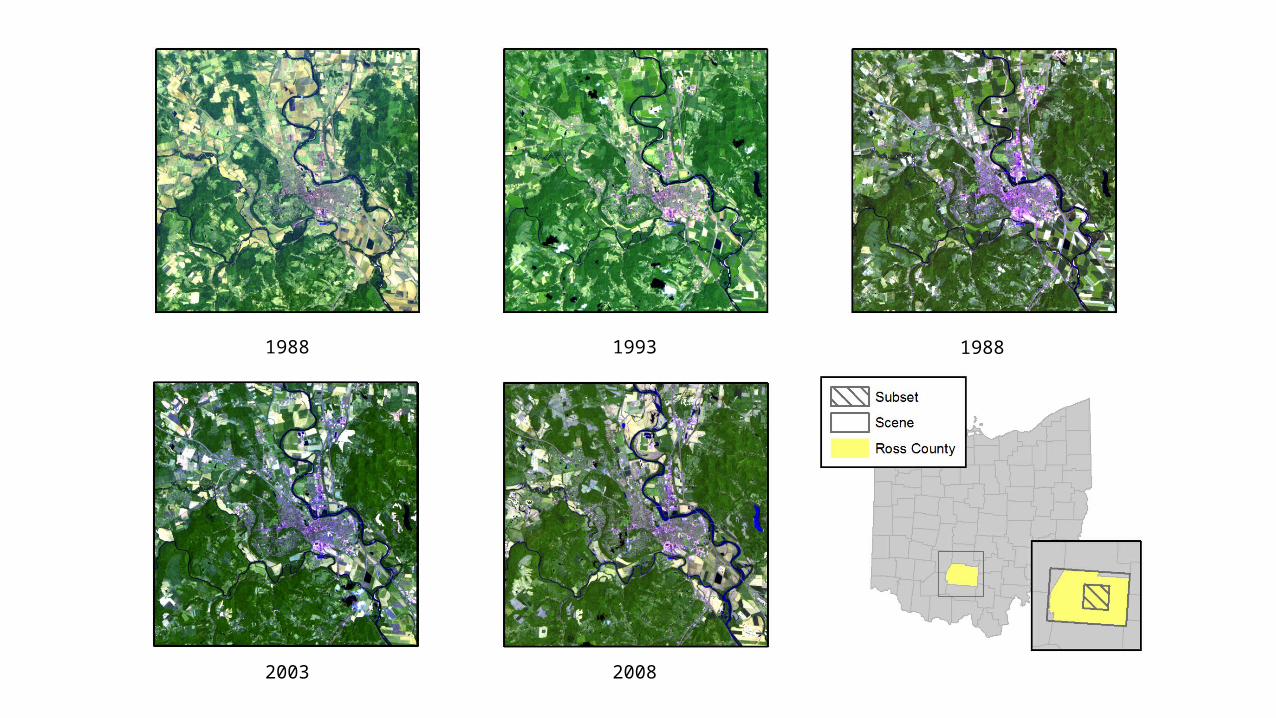
1988 1993 1988
2003 2008
Results
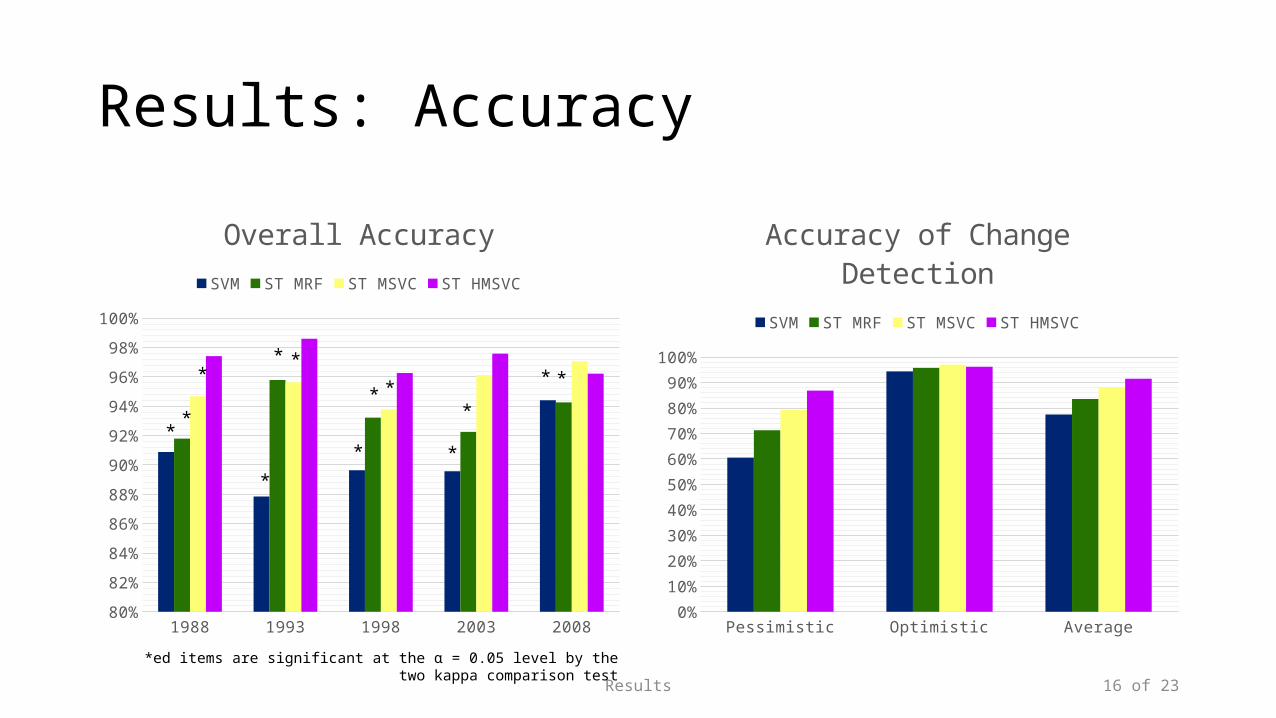
Results: Accuracy
1988 1993 1998 2003 200880%
82%
84%
86%
88%
90%
92%
94%
96%
98%
100%
Overall AccuracySVM ST MRF ST MSVC ST HMSVC
Pessimistic Optimistic Average0%
10%
20%
30%
40%
50%
60%
70%
80%
90%
100%
Accuracy of Change De-tection
SVM ST MRF ST MSVC ST HMSVC
**
*
*
* *
*
* *
*
*
* *
*ed items are significant at the α = 0.05 level by the two kappa comparison test
16 of 23
Results
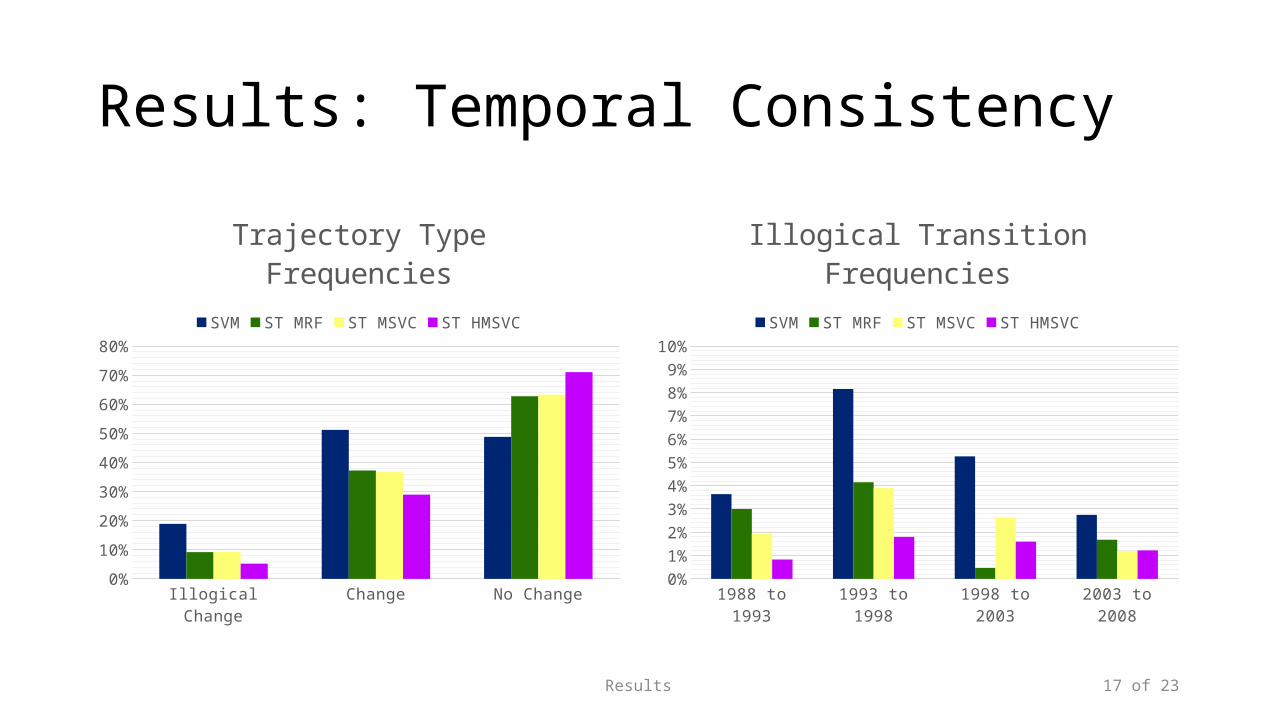
Results: Temporal Consistency
Illogical Change Change No Change0%
10%
20%
30%
40%
50%
60%
70%
80%
Trajectory Type FrequenciesSVM ST MRF ST MSVC ST HMSVC
1988 to 1993 1993 to 1998 1998 to 2003 2003 to 20080%
1%
2%
3%
4%
5%
6%
7%
8%
9%
10%
Illogical Transition Fre-quencies
SVM ST MRF ST MSVC ST HMSVC
17 of 23
Results
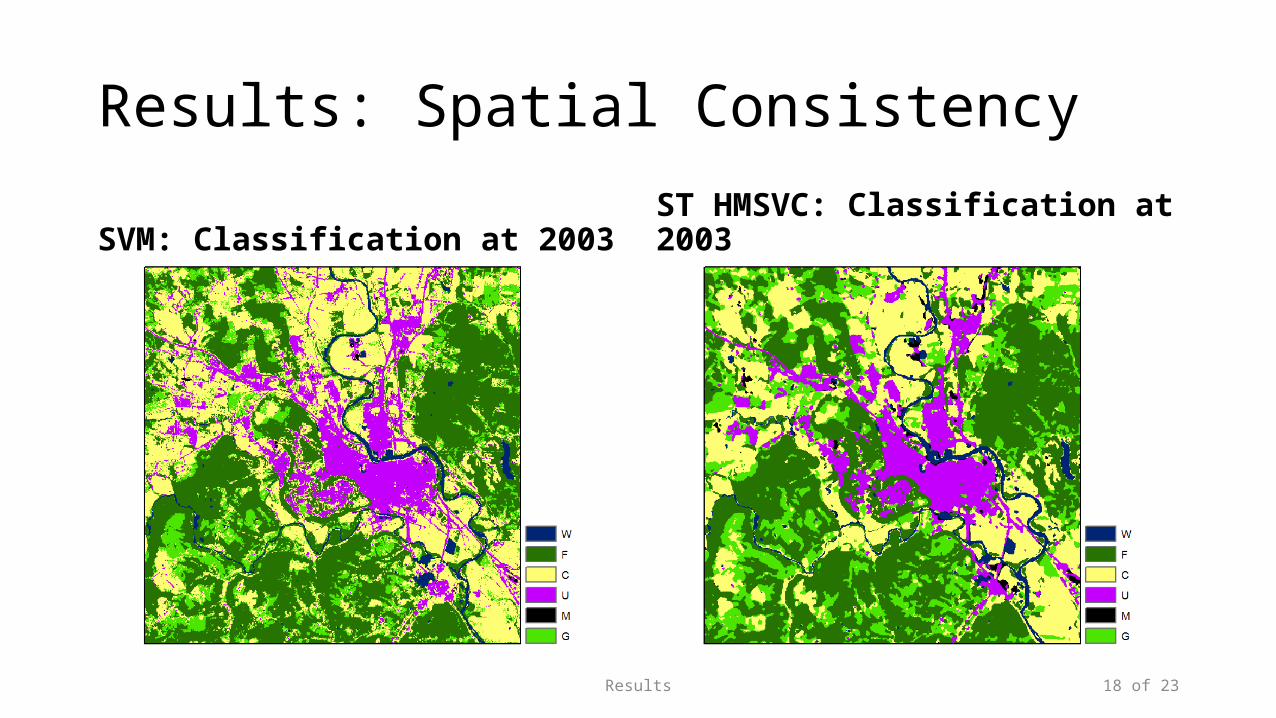
Results: Spatial Consistency
SVM: Classification at 2003 ST HMSVC: Classification at 2003
18 of 23
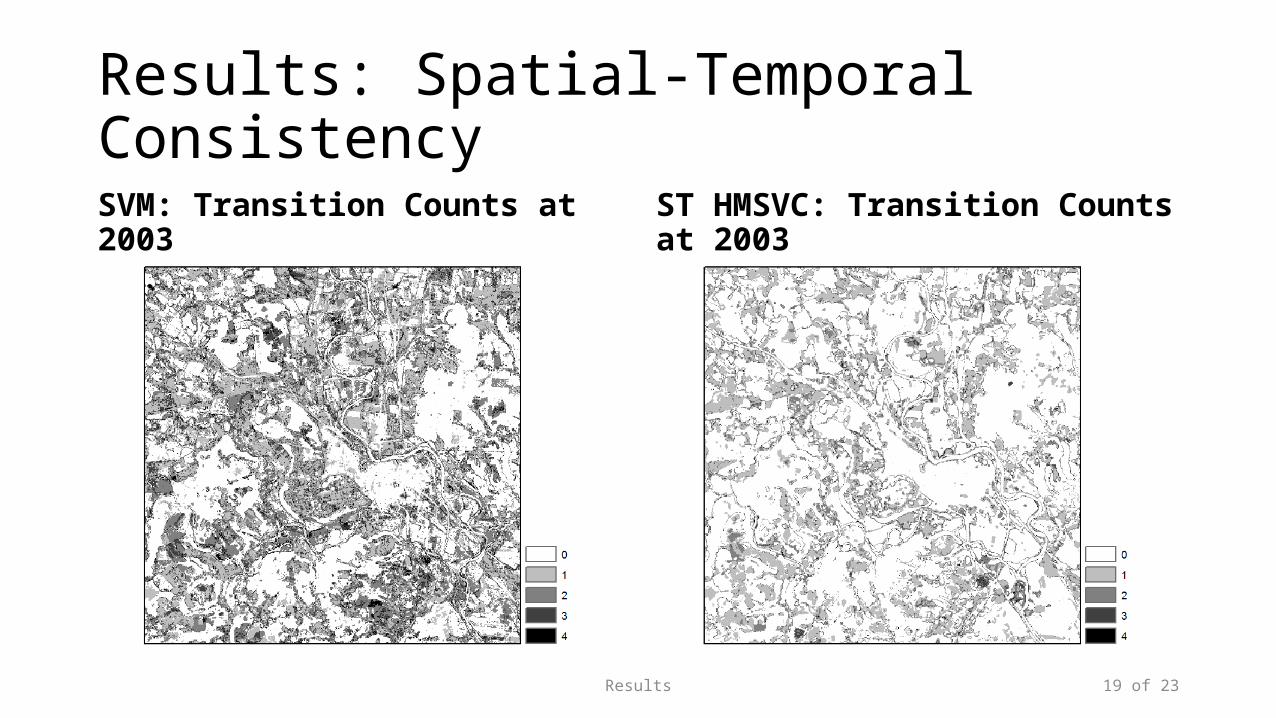
Results
Results: Spatial-Temporal Consistency
SVM: Transition Counts at 2003 ST HMSVC: Transition Counts at 2003
19 of 23
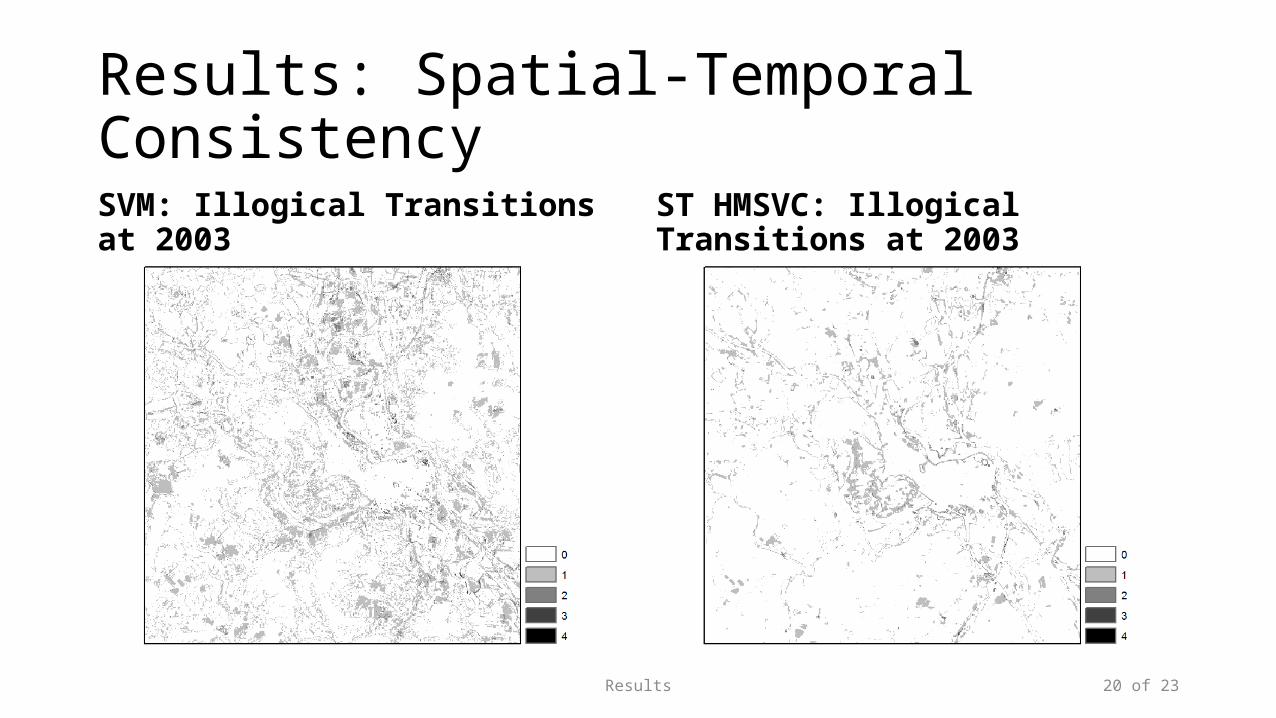
Results
Results: Spatial-Temporal Consistency
SVM: Illogical Transitions at 2003 ST HMSVC: Illogical Transitions at 2003
20 of 23
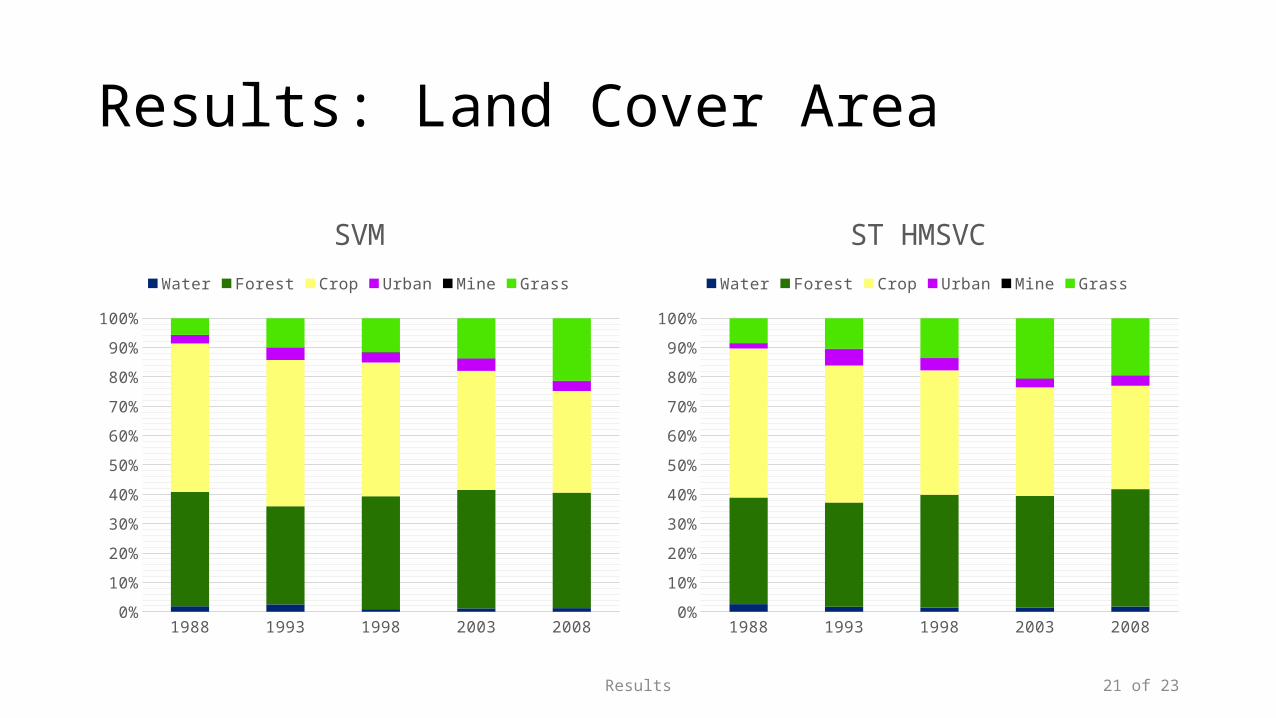
Results
Results: Land Cover Area
1988 1993 1998 2003 20080%
10%
20%
30%
40%
50%
60%
70%
80%
90%
100%
SVMWater Forest Crop Urban Mine Grass
1988 1993 1998 2003 20080%
10%
20%
30%
40%
50%
60%
70%
80%
90%
100%
ST HMSVCWater Forest Crop Urban Mine Grass
21 of 23

Discussion and Conclusion
Discussion
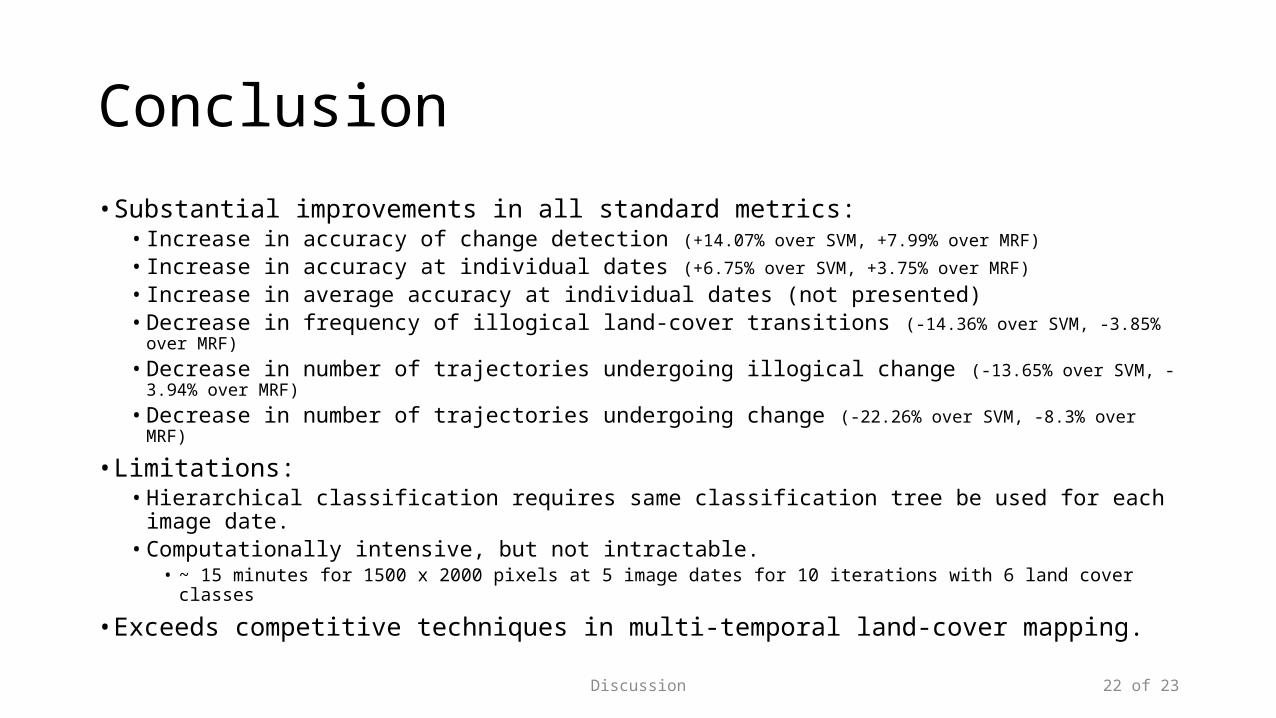
Conclusion
• Substantial improvements in all standard metrics:• Increase in accuracy of change detection (+14.07% over SVM, +7.99% over MRF)
• Increase in accuracy at individual dates (+6.75% over SVM, +3.75% over MRF)
• Increase in average accuracy at individual dates (not presented)• Decrease in frequency of illogical land-cover transitions (-14.36% over SVM, -3.85% over MRF)
• Decrease in number of trajectories undergoing illogical change (-13.65% over SVM, -3.94% over MRF)
• Decrease in number of trajectories undergoing change (-22.26% over SVM, -8.3% over MRF)
• Limitations:• Hierarchical classification requires same classification tree be used for each image date.• Computationally intensive, but not intractable.
• ~ 15 minutes for 1500 x 2000 pixels at 5 image dates for 10 iterations with 6 land cover classes
• Exceeds competitive techniques in multi-temporal land-cover mapping.22 of 23
Conclusion
Future Work
• Publication.
• NESSF Proposal:• A Spatial-Temporal Structured Learning Framework for Reconstructing Land-
Cover Change Trajectories from Dense Landsat Time Series
• Continue on with Ph.D. here at OSU under Dr. Desheng Liu.
23 of 23
References
References• Burnicki, A. C., Brown, D. G., & Goovaerts, P. (2007). Simulating error propagation in land-cover change analysis: The implications of temporal dependence.
Computers, Environment and Urban Systems, 31(3), 282-302.• Cover, T. M. (1965). Geometrical and statistical properties of systems of linear inequalities with applications in pattern recognition. IEEE Transactions on
Electronic Computers, EC-14, 326-334.• Foody, G. M., & Mathur, A. (2004). A relative evaluation of multiclass image classification by support vector machines. IEEE Transactions on Geoscience and
Remote Sensing, 42(6), 1335-1343.• Giri, C., Zhu, Z., & Reed, B. (2005). A comparative analysis of the Global Land Cover 2000 and MODIS land cover data sets. Remote Sensing of Environment,
94, 123-132.• Huang, C., Davis, L. S., & Townshend, J. R. G. (2002). An assessment of support vector machines for land cover classification. International Journal of
Remote Sensing, 23(4), 725-749.• Jung, M., Henkel, K., Herold, M., & Churkina, G. (2006). Exploiting synergies of global land cover products for carbon cycle monitoring. Remote Sensing of
Environment, 101, 534-553.• Liang, L. & Gong, P. (2010). An assessment of MODIS Collection 5 global land cover product for biological conservation studies. 2010 18th International
Conference on Geoinformatics, 18-20 June, 1-6.• Liu, D., & Chun, Y. W. (2009). The effects of different classification models on error propagation in land cover change detection. International Journal of
Remote Sensing, 30(20), 5345-5364.• Liu, D., & Cai, S. (2012). A spatial-temporal modeling approach to reconstructing land-cover change trajectories from multi-temporal satellite imagery.
Annals of the Association of American Geographers, 102(6), 1329-1347.• Moser, G. & Serpico, S. B. (2013). Combining support vector machines and Markov random fields in an integrated framework for contextual image
classification. IEEE Transactions on Geoscience and Remote Sensing, 51(5), 2734-2752.• van Oort, P. J. (2005). Improving land cover change estimates by accounting for classification errors. International Journal of Remote Sensing, 26(14), 3009-
3024.

Thank [email protected]