Embed Size (px)
Citation preview

NASA/CR-1998-208454
A Study of Failure in Small PressurizedCylindrical Shells Containing a CrackCraig A. Barwell, Lorenz Eber, and Ian M. FyfeUniversity of Washington, Seattle, Washington
August 1998

The NASA STI Program Office . . . in Profile
Since its founding, NASA has been dedicatedto the advancement of aeronautics and spacescience. The NASA Scientific and TechnicalInformation (STI) Program Office plays a keypart in helping NASA maintain thisimportant role.
The NASA STI Program Office is operated byLangley Research Center, the lead center forNASA’s scientific and technical information.The NASA STI Program Office providesaccess to the NASA STI Database, thelargest collection of aeronautical and spacescience STI in the world. The Program Officeis also NASA’s institutional mechanism fordisseminating the results of its research anddevelopment activities. These results arepublished by NASA in the NASA STI ReportSeries, which includes the following reporttypes:
• TECHNICAL PUBLICATION. Reports ofcompleted research or a major significantphase of research that present the resultsof NASA programs and include extensivedata or theoretical analysis. Includescompilations of significant scientific andtechnical data and information deemedto be of continuing reference value. NASAcounter-part or peer-reviewed formalprofessional papers, but having lessstringent limitations on manuscriptlength and extent of graphicpresentations.
• TECHNICAL MEMORANDUM.Scientific and technical findings that arepreliminary or of specialized interest,e.g., quick release reports, workingpapers, and bibliographies that containminimal annotation. Does not containextensive analysis.
• CONTRACTOR REPORT. Scientific andtechnical findings by NASA-sponsoredcontractors and grantees.
• CONFERENCE PUBLICATION.Collected papers from scientific andtechnical conferences, symposia,seminars, or other meetings sponsored orco-sponsored by NASA.
• SPECIAL PUBLICATION. Scientific,technical, or historical information fromNASA programs, projects, and missions,often concerned with subjects havingsubstantial public interest.
• TECHNICAL TRANSLATION. English-language translations of foreign scientificand technical material pertinent toNASA’s mission.
Specialized services that help round out theSTI Program Office’s diverse offerings includecreating custom thesauri, building customizeddatabases, organizing and publishingresearch results . . . even providing videos.
For more information about the NASA STIProgram Office, see the following:
• Access the NASA STI Program HomePage at http://www.sti.nasa.gov
• Email your question via the Internet [email protected]
• Fax your question to the NASA AccessHelp Desk at (301) 621-0134
• Phone the NASA Access Help Desk at(301) 621-0390
• Write to:NASA Access Help DeskNASA Center for AeroSpace Information7121 Standard DriveHanover, MD 21076-1320

National Aeronautics andSpace Administration
Langley Research CenterHampton, Virginia 23681-2199
NASA/CR-1998-208454
A Study of Failure in Small PressurizedCylindrical Shells Containing a CrackCraig A. Barwell, Lorenz Eber, and Ian M. FyfeUniversity of Washington, Seattle, Washington
August 1998
Prepared for Langley Research Centerunder Grant NAG1-1586

Available from the following:
NASA Center for AeroSpace Information (CASI) National Technical Information Service (NTIS)7121 Standard Drive 5285 Port Royal RoadHanover, MD 21076-1320 Springfield, VA 22161-2171(301) 621-0390 (703) 487-4650

TABLE OF CONTENTS
PAGE
SUMMARY 1
INTRODUCTION 2
APPARATUS AND PROCEDURES 4
Experimental Equipment 4
Instrumentation 4
Specimen Configuration 6
Computational Aspects 7
RESULTS 9
Bulge Deformations 9
Axial and Hoop Strains 11
Crack Opening Displacements 14
Crack Tip Opening Angle (C.T.O.A.) 16
Unsymmetric Loading 20
CONCLUDING REMARKS 24
REFERENCES 26
APPENDIX 28
iii

1
A STUDY OF FAILURE IN SMALL PRESSURIZED CYLINDRICALSHELLS CONTAINING A CRACK
Craig A. Barwell, Lorenz Eber & Ian M. Fyfe,
Department of Aeronautics & AstronauticsUniversity of Washington
SUMMARY
The deformation in the vicinity of axial cracks in thin pressurized cylinders is examined using
small experimental models. The loading applied was either symmetric or unsymmetric about
the crack plane, the latter being caused by structural constraints such as stringers. The
objective was twofold - one, to provide the experiment results which will allow computer
modeling techniques to be evaluated for deformations that are significantly different from that
experienced by flat plates, and the other to examine the deformations and conditions
associated with the onset of crack kinking which often precedes crack curving.
The stresses which control crack growth in a cylindrical geometry depend on
conditions introduced by the axial bulging, which is an integral part of this type of failure. For
the symmetric geometry, both the hoop and radial strain just ahead of the crack, r = a, were
measured and these results compared with those obtained from a variety of structural analysis
codes, in particular STAGS [1], ABAQUS and ANSYS. In addition to these measurements,
the pressures at the onset of stable and unstable crack growth were obtained, and the
corresponding crack deformations measured as the pressures were increased to failure. For
the unsymmetric cases, measurements were taken of the crack kinking angle and the
displacements in the vicinity of the crack.
In general, the strains ahead of the crack showed good agreement between the three
computer codes, and between the codes and the experiments. In the case of crack behavior, it
was determined that modeling stable tearing with a crack-tip opening displacement fracture
criterion could be successfully combined with the finite-element analysis techniques as used in
structural analysis codes. The analytic results obtained in this study were very compatible
with the experimental observations of crack growth. Measured crack kinking angles also
showed good agreement with theories based on the maximum principle stress criterion.

2
INTRODUCTION
When a crack curves sufficiently to allow the internal pressure to cause a shell to open in a
small area we have a condition in which controlled decompression occurs by flapping [2].
However, although crack growth to a flapped condition is very desirable, the techniques to
model this type of crack growth are still being developed, and so the experimental data to
verify these models is also required. The research described in this report examines crack
growth in thin cylinders under conditions that produce the deformations that are unique to
constrained thin cylinders.
It has been known for some time that bulging [3,4], which occurs when a pressurized cylinder
has a longitudinal crack, plays an important role in crack growth. In addition to the bulge if
the loading is unsymmetric, due to the presence of a stringer or other constraint, the resultant
mode II deformations result in a crack whose growth is along a curved path. This turning,
together with the presence of a constraint, introduces a tearing, or "nominal mode-III" type of
loading. This latter effect could be important in fuselage failure, and is so recognized in the
recent work by Ingraffea and associates [5,6]. Although experimental research in this area has
been quite limited, an important study on a full scale fuselage is described by Miller et al [7].
However, because of the high costs involved in full scale studies the use of small or sub-scale
cylindrical models provides an attractive alternative as a means of obtaining the required data.
Tests in thin walled cylinders pose unique problems in that a pressurized cylinder is expected
to have a sizable leak before the fatigue crack has propagated any significant distance. In an
aircraft fuselage, where the pressure is quite low, two conditions exist which could allow
significant undetected crack growth, these being that air loss is reduced because of insulating
blankets, and minor air loss can be compensated for by the air conditioning system. In thin
cylinders when the crack curves, the internal pressure is then acting on a flap, and so the
loading for the "nominal mode III" increases. These complications require extensive testing of
any proposed models, and so the need for sub scale testing also increases if costs are to be
contained. An example of sub-scale testing is shown in Fig. 1, where fatigue crack growth
next to a stringer in a pressurized thin cylinder shows the effect of unsymmetric loading on the
crack path. In this case the cylinder is only 2.5 inches in diameter, but the crack behavior is
almost identical to that described in [7].

3
In using scale models one usually hopes that not only is the model geometrically
similar, but also has complete similarity. However, with the small radius of the cylinders used
in this study, geometric similarity would require the cylinder model to have a thickness so
small that this requirement can not be met. It is this lack of geometric similarity that suggests
the use of sub-scale to describe the type of model being studied.
Fig. 1 An Unsymmetric Fatigue Crack near a Stringer in a 2.5 ins. Diameter Thin Cylindrical Shell

4
APPARATUS AND PROCEDURES
Experimental Apparatus
The hydraulic system used in this project was designed to apply a variety of loads to
the cylinders, such as, montonically increasing static pressure, axial loads and cyclic internal
pressures. Depending on the type of tests being carried out, either oil or water could be used
as the hydraulic fluid. In this particular project water was used in all the tests, and the axial
and cyclic loading features were disconnected. A drawing of this system is shown in Fig. 2a
Two problems that apply in particular to thin cylinder testing are, the conditions
introduced by the need to close the ends of the cylinder, and the method required to seal any
existing cracks. In this study, the former was handled by specially designed end plates, shown
in Fig. 2b, in which the specimen is supported by two holding plates which are used to transfer
the axial loading caused by internal pressure to external supports, so that the axial load is
independent of the internal pressure. This resulted in a cylinder loaded so that the axial
stresses some distance from the crack were zero, that this condition was satisfied was checked
from strain data obtained from gauges placed close to the ends of the cylinders. In addition to
checking this particular end condition, this data was also used to show that the results
obtained were compatible with the theory associated with infinitely long cylinders, and was
also in accord with the values obtained from the STAGS finite element code. To prevent
leakage through the crack during the tests, a metallized polyester tape (3M "Scotchtab") was
used. This tape is only 0.002 inches thick, and has a Young's modulus of approximately one
tenth that of aluminum. The strip was pleated to allow tangential expansion, as shown in
Fig. 2c. The strip was attached to the cylinder by its pressure sensitive adhesive backing, but
silicone grease was applied in the region of the crack to allow free movement of this seal.
Instrumentation
In addition to the pressure as the specimen was loaded to failure, a number of
additional measurements were taken. In particular, strains ahead of the crack tip, crack
opening displacement at the midpoint of the crack (C.M.O.D.), the crack tip opening angle
(C.T.O.A.), radial displacements along the crack faces and ahead of the crack tip, and the
length of stable crack growth before catastrophic failure.

5
Fig. 2 Experimental Configuration for Thin Cylinder Testing

6
Strains were measured using standard metal foil electrical resistance strain gauges,
which were located near the crack tip (at r = a) in the plane of the crack, and also near the
ends of the specimens to confirm that the boundary conditions at the ends were satisfied. In
cases where the loading was unsymmetric due to the presence of a stringer a strain gauge was
located at the center of the crack in order to obtain the axial strains due to the bulge.
The crack opening displacement was measured using a standard clip gauge. The clip
gauge arms had tabs machined onto the ends to allow insertion into a small hole
drilled at the crack midpoint. Although this instrument was calibrated with a micrometer,
allowance had to be made for a slight displacement caused by the crack seal pressing against
the tabs when the pressure was first applied
With the introduction of the crack growth option to STAGS (version 2.3) it was also
possible to compare the analysis predictions with data obtained from photographs of the
deformation and growth of the crack prior to complete failure. Using a standard 35mm
camera with a 60 mm AF Nicon micro lens and a Vivitar 2X macro focusing teleconverter it
was also possible to determine the pressure at the onset of stable crack growth, the length of
this growth before failure and the C.T.O.A. values.
Radial displacements were measured using a dial gauge, which was mounted
horizontally, and suspended from two steel rods. The rods were in turn attached to a swing
arm which pivoted about the venting cap at the top of the specimen. The rods could be
moved vertically independent of the swing arm position, and thus allowed radial
measurements to be taken over a fair portion of the cylinder around the crack. Although the
dial gauge could measure to the nearest 0.0001 inches, the overall accuracy was much less,
due to the slight play inherent in such a device.
Specimen Configuration
Three materials 2024-T3, 2024-O and 6061-T4 aluminum were used throughout the
project. The 6061-T4 material, a standard stock tubing of 2.5-inch diameter with a wall
thickness of 0.028 inches, was used in a series of preliminary tests to develop the required
techniques, and to calibrate the system. These results will not be reported. The remaining
specimens were manufactured from 2024-T3 and 2024-O clad sheet stock, with the latter
material introduced to provide a low yield material that would emphasis the nonlinear and
plasticity aspects of the deformations.
7
To eliminate end effects around the crack the specimen lengths were varied from 15
inches for the 6061-T4 specimens to 27.25 for the larger diameter 2024 specimens. The
crack itself was actually a 0.020-inch wide slot cut axially into the center of the cylinder.
The ends of the slot were fashioned into sharp crack tips using a razor blade. The majority
of the specimens were cut so that the longitudinal direction of the sheet stock was in the
circumferential direction on the cylinder.
The unsymmetric loading was controlled by the specimen configuration, in that the
presence of a stringer introduced the unsymmetric deformations in the region of the crack. In
this case the kink angle was obtained directly from the failed specimen.
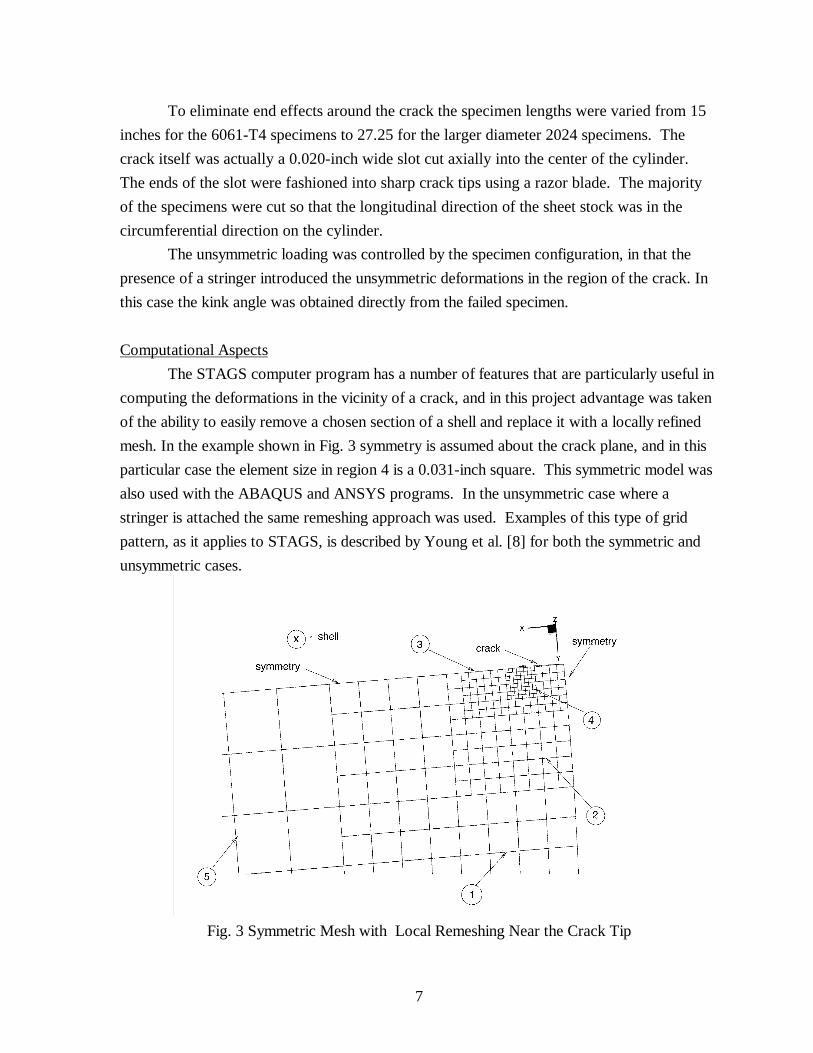
Computational Aspects
The STAGS computer program has a number of features that are particularly useful in
computing the deformations in the vicinity of a crack, and in this project advantage was taken
of the ability to easily remove a chosen section of a shell and replace it with a locally refined
mesh. In the example shown in Fig. 3 symmetry is assumed about the crack plane, and in this
particular case the element size in region 4 is a 0.031-inch square. This symmetric model was
also used with the ABAQUS and ANSYS programs. In the unsymmetric case where a
stringer is attached the same remeshing approach was used. Examples of this type of grid
pattern, as it applies to STAGS, is described by Young et al. [8] for both the symmetric and
unsymmetric cases.
Fig. 3 Symmetric Mesh with Local Remeshing Near the Crack Tip

8
A finer grid was also generated by halving the distance between the nodes in both the
x and y directions, but the results showed little change in the C.M.O.D values, and so the
more economical or coarser grid shown in Fig. 3 was used throughout this study.

9
RESULTS
As the main objective of this study was to use sub scale models to obtain the
experimental data to compare with the computational predictions, it had been hoped to study
both the experimental and numerical aspects of each configuration simultaneously. However,
as this was not always possible the results are presented in terms of the particular deformation
being considered, and the numerical results as obtained from STAGS (version 2.0 and 2.3),
ABAQUS (version 5.4-1) and ANSYS (version 5.0) are included if they were available.
Bulge Deformations
As the distinguishing feature of an axial crack in a thin cylinder is the bulging, it is
appropriate that these deformations should be considered first. Three dimensional views of
these deformations were obtained using the "stapl" post-processing capability of STAGS, or
by coupling the program output with the TECPLOT [9] data visualization program. An
example of this former type of presentation is shown in Fig. 4.
Fig. 4 Radial Displacement Contours in the Vicinity of a Longitudinal Crack
A particular feature of cylinder deformations in the vicinity of an axial crack is the
inward deformation or dip ahead of the crack [4]. As can be seen in Figs. 4 and 5 this feature
was observed both experimentally and by all three computer codes. As is to be expected, the
more ductile 2024-O showed not only larger radial displacements, but also a more

10
(a)
(b)
Fig. 5 Radial Displacements in the Plane of the Crack for a Symmetrically
Loaded Thin Cylinder
(a) 2024-T3 at p = 100 psi, (b) 2024-O at p = 60 psi.

11
pronounced dip. In line with the results reported in [4] the normalizing displacement and
crack aspect ratio are
Cw = λ2pR2/(2Et) λ = [12(1 - ν2)]1/4a/√(Rt)
The agreement between the experimental and numerical predicted displacements were
in general very good. However, near the dip (x/a = 2) and at the center of the crack
(x = 0), the experimental values for both cases, were larger than the numerical predicted ones.
Although some improvement can be expected using a finer mesh, later studies showed that a
more likely cause for the smaller numerical values was due to the fact that no allowance was
made for cladding or the small amount of stable crack growth that occurred at these
pressures. Also as the experimental values were obtained using the dial gauge system,
described earlier, the accuracy of the small deformations measurements associated with the
dip might be questioned.
Axial and Hoop strains
In all of the tests the positioning of the strain gauges was largely a matter of individual
choice, and so, except for the end conditions described earlier, strain gauges were placed on a
point ahead of the projected crack path. In the symmetrically loaded specimens the selected
position was in the crack plane, at r = a, while in the stringer experiments the position varied
such, that the distance ahead of the crack had value of r equal to a or 2.5a with the angle
ahead of the crack varying, depending on the position of the stringer.
The results shown in Figs. 6 through 9 are for the symmetrically loaded cylinders,
where it can be seen that all three codes gave comparable results. These experiments, and the
corresponding computer analysis, were carried out during the early stages of this project when
none of the analysis programs included a stable tearing option. As will be shown later this
stable crack growth is an important aspect of thin cylinder failure, and this together with the
need to consider the effect of cladding could account for discrepancies between the numerical
and experimental results. Unfortunately, it is no longer practical to repeat these analyses and
hence eliminate this possible source of error. An interesting feature of these strains is that the
axial strains are in tension due to the influence of the bulge. It might also be noted that the
axial strain values were measured at a point (x/a = 2) where those strains were changing quite
rapidly due to the dip, as shown on Fig. 5, and so a deviation between experiment and
predictions might be expected in this case.

12
Fig. 6 Hoop Strains at r = a in 2024-T3 Thin Cylinders
Fig. 7 Axial Strains at r = a in 2024-T3 Thin Cylinders

13
Fig. 8 Hoop Strains at r = a in 2024-O Thin Cylinders
Fig. 9 Crack Tip Plastic Region for 2024-T3 and 2024-O Aluminum Alloys

14
The results in Fig. 8, where the specimen material was 2024-O, show a much closer
agreement between the numerical and experimental results when compared with the higher
yield 2024-T3. This feature indicates the importance of the plastic deformations at the crack
tip, and could have a significant bearing on how these deformations are modeled in the codes.
However, as these results did not allow for either cladding or stable crack growth further
analysis is required.
To determine the extent of the plastic region at the crack tip the plastic hoop strains
were calculated using the 2.0 version of the STAGS code, and these values are presented in
Fig. 9. Clearly any analysis of crack growth, which depends on the deformations in elements at
the tip of the crack, requires an accurate determination of these plastic deformations.
The axial strains measured on the edge of the crack at its mid-point (x=0) are not
presented in this report as they are essentially linear, but they do indicate that those strains
become plastic at the higher pressure levels
Crack Opening Displacements
Crack opening displacements at the center of the crack (C.M.O.D.) were measured in
the majority of the cylinders tested, and invariably the experimental displacements appeared to
be considerably greater than those initially predicted by STAGS. It can be seen from Figs. 10
and 11, that both ABAQUS and ANSYS also predicted similar values to STAGS. For all three
codes the plasticity and large deformation options were used, and the thickness was the
nominal value of 0.016 inches. To confirm the experimental results a number of additional
tests were conducted using photographic comparisons and direct measurements using calipers.
In all cases the experimental values were in general agreement, and considerably larger than
those numerically predicted. It is this discrepancy that suggested a low yield material (2024-O)
be tested, where the plasticity effects would be emphasized. However, as can be seen in Fig.
11, the low yield material gave closer agreement than the higher yield 2024-T3, which
indicated that the particular plasticity models used were not the cause of the discrepancy.
If allowance is made for the cladding the specimen thickness value could be reduced
from the nominal 0.016 inches to a nonclad value of 0.0145 inches according to [10], although
subsequent measurements of the actual cladding indicated that allowing 0.001 inches for the
cladding was more realistic. As can be seen in Fig. 12 this resulted in a closer agreement
between the experimental and computed values. This figure also shows that the linear elastic
model was clearly inadequate.

15
Fig. 10 C.M.O.D. predictions for a 2024-T3 Thin Cylinder
Fig. 11 C.M.O.D predictions for a 2024-O Thin Cylinder

16
Fig. 12 Influence of Cladding and Plastic deformations on C.M.O.D predictions.
The code inputs were also adjusted to include the loading caused by the polyester seal
acting on the edge of the crack, but this additional load provided no significant increase in the
predicted displacements.
A close examination of the specimens showed that there was a small, but significant, amount of
stable crack growth. This additional crack length was quite small, indeed smaller than the
plastic region ahead of the crack.
Crack Tip Opening Angle (C.T.O.A.)
Crack growth prior to failure can be incorporated into the analysis using the stable
tearing option available in the 2.3 version of STAGS. However, this option requires that the
critical crack tip opening angle be specified as an input parameter, and so a series of tests were
conducted in which the crack growth was observed photographically. An example of the
results obtained from these tests can be seen in the photograph of Fig. 13, and the C.M.O.D.
predictions are presented in Fig. 14. For the configuration under consideration, in which the
total specimen thickness was 0.016 inches, the value for the C.T.O.A. was approximately 10o.

17
Fig. 13 C.T.O.A. Angle in a Pressurized Specimen just Prior to Failure
Fig. 14 Influence of Stable Tearing for C.M.O.D. Predictions
Using the C.T.O.A. Criterion [11], with A1 the Pressure Measured
at Stable Crack Growth Initiation

18
Although the C.T.O.A. value obtained in these latest tests were approximately 10o it
was found that in order to obtain the correct pressure at the onset of stable crack growth, the
correct length of this stable crack growth and the final pressure at failure, a critical C.T.O.A.
value of 8o was the appropriate value. In these experiments the onset of stable crack growth
was defined as the point where the crack had grown by approximately 0.015 inches, which is
one half of the finite element grid size used in the region of the crack tip. From Fig. 6 the
onset of stable crack growth is also evident by the rapid increase in the hoop strains at that
pressure. Clearly the very limited number of tests carried out in which the crack growth was
photographed did not allow any idea of how much scatter could be expected in these
measurements.
In these additional tests, not only could the pressure at failure be determined, but also
the pressure at the onset of stable crack growth, the extent of this growth, and the C.T.O.A.
during growth. With this additional knowledge the analysis to obtain C.M.O.D. as a function
of applied internal pressure could again be carried out. The improved capability of STAGS in
predicting the C.M.O.D values can be seen when the results presented in Fig. 14 are compared
with the earlier calculations shown in Fig. 10, this is especially so at the higher pressures just
prior to unstable tearing. As mentioned earlier it was felt that the differences at the lower
pressures could be due in part to the tendency of the clip gauges to give slightly higher
readings as the internal seal acted on the gauge.
A series of tests were conducted in which the crack length was varied, and as can be
seen in Fig. 15 the values for both the pressure at failure and the C.M.O.D. changed quite
markedly for even modest changes in the crack length. For the tests in which 2a=0.75 ins. the
curve in Fig. 15 represent an average (see Appendix). The ability of STAGS to accurately
predict these changes was examined where the value of 2a was increased from 0.75 inches to
1.0 inches. The result of this analysis is shown in Fig. 16 where it can be seen that, using the
crack tip opening angle criterion, STAGS could be used to predict the onset of stable crack
growth and the subsequent cylinder failure.

19
Fig. 15 Experimental measurements of C.M.O.D. for Different Crack Lengths
Fig.16 The Variation in C.M.O.D. as a Function of Pressure for 2a= 1.0 inches

20
Unsymmetric Loading
A number of tests were conducted on cylinders in which the attached stringer created
an unsymmetric loading condition. The cylinders in this case were 8 inches in diameter, and of
the 2024-T3 material. The stringers were simple 3/8-inch square aluminum rods, which were
riveted or epoxyed to the outside of the cylinder, as shown in Fig. 2. In this set of tests the
crack no longer extends in the plane of the original crack, but at an angle to this plane. This
angle referred to as the kink angle reflects the mixed mode deformations to be expected in the
presence of a stringer. Examples of crack growth under mixed mode deformations are shown
in Figs. 17. As is to be expected the crack path is controlled by the position of the stringer
relative to the crack, and the well defined changes in the kink angle with the distance of the
crack from the stringer is a notable feature of the sub scale experiments. However, as this
distance is increased it becomes difficult to distinguish between a true kink and the crack
curving that also occurs with the unsymmetric loading. Figs. 17a and 17b give examples of
crack growth when the stringer was riveted to the cylinder, while Fig. 17c is an example of the
case where the stringer had been epoxyed to the cylinder, and in this case the pressure had not
quite reached the point of unstable crack growth. In all three cases mode three deformations
were observed.
The analysis of this configuration was carried out to determine the kink angle as
predicted by STAGS, which used the maximum principal stress criterion [12]. However, as
the name of the code implies, the analysis is designed to handle shell structures, and our
choice of a stiffener, which was a square rod, could not be readily modeled. However, a
reasonable model was obtained by using the discrete stringer option of STAGS. The stringer
model in this case was placed on the column that coincided with distance h (see Fig. 18),
which is the distance from the crack to the edge of the stringer. As the actual stringer
extended over a number of columns, the discrete stringer assumption restricted the region of
the STAGS analysis that could be considered as being comparable with the experimental
conditions.
In the stringer experiments the strains were also measured at a number of locations
ahead of the crack, where it was determined that the influence of the stringer was quite local.
This finding was also confirmed by the STAGS analysis, and by the fact that the failure
pressure was much higher with the stringer adjacent to the crack, but the stringer had
negligible effect when h/a exceeded 3.0. This feature of the influence of the stringer on the
failure pressure is shown in Fig. 19.

21
(a)
(b)
(c)
Fig. 17 Examples of Crack Growth in the Presence of a Stringer

22
Fig 18 Crack Kinking Angle as a Function of Stringer Location for Parallel
Stringers and Cracks
Fig 19 Failure Pressure as a Function of the Distance of Crack from Stringer

23
The fact that the influence of the stringer is quite local as shown in Figs. 18 and 19 also
accounted for the difficulty in measuring the kink angle as the distance between stringer and
crack increased. Indeed in these cases the strains obtained in the stringer tests were negligibly
different from those obtained in the symmetrically loaded cylinders where the directional
instability of the crack growth is due to the presence of the bulge, not the stringer.

24
CONCLUDING REMARKS
The mixed mode deformations which characterize crack growth in a thin cylindrical
shell clearly requires that computer programs designed to provide this analysis should be
subjected to extensive experimental verification. The results of this study shows how the sub-
scale cylindrical configuration can provide a sufficient variety of tests to provide this model
verification at a substantially reduced cost when compared with the full scale counterpart. In
particular, it can be seen how the introduction of stable tearing into the analysis greatly
improved the predictive capabilities of STAGS, and that the program can predict the
deformations associated with the presence of a longitudinal crack in a cylindrical shell with
reasonable accuracy.
These tests also highlighted the importance of cladding and the plasticity component in
crack analysis; although, in the latter case this may only be in the role of evaluating the
particular plasticity model chosen, as it doesn't necessarily follow that plasticity will play such
an important role in the full-scale cylinder. However, as plasticity also plays an important role
in flat plate analysis it one might assume that it does. An allowance for cladding is clearly
required, and as this essentially controls the role played by thickness it should be equally
important for the full scale configuration.
The well defined kink angles shown in sub-scale testing provides the data required to
further refine and develop the computer models being used to predict crack growth. In this
study the crack growth analysis was limited to the initial direction in which the crack would
grow, as the complexities introduced by the continual changing direction of subsequent stable
crack growth was beyond the scope of the study. It was noted that the closer the crack was
to the stringer the higher the required pressure for failure.
These results, when combined with those reported by Fyfe and Sethi [13], show that
crack induced bulging can have a significant effect on deformations in the vicinity of the crack.
Although, it may be argued that for the large diameters associated with a fuselage, the bulge
effect can be ignored and flat plate theory used. However, these studies, together with that of
Swift [2], suggest that the influence of the bulging is such, that, even with a large radius
cylinder the resultant deformations in the vicinity of a crack may be critically affected in that
they can lead to crack curving. In the work of Riks, Brogan and Rankin [14] they indicate
that the crack aspect ratio λ is an important measure in the analysis. In a fuselage this number

25
is typically between 6 and 7 as indicated in the results reported in [7] and so the configuration
of the sub-scale models can at least be chosen to meet the requirement of similar values for λ,
even though geometric similarity cannot be met.
In general these studies show that the STAGS program provides results which
compare very favorably with those provided by ABAQUS and ANSYS. It also shows that,
using the C.T.O.A. criterion, STAGS can predict the onset of stable crack growth and the
subsequent growth, which eventually leads to the unstable conditions associated with failure.

26
REFERENCES
[1] Brogan, F. A., Rankin, C. C., and Cabiness, H. D., "STAGS User Manual," Lockheed Palo Alto Research Laboratory, LMSC Report P032594, 1994.
[2] Swift, T., "Damage Tolerance in Pressurized Fuselages," 11th Plantema Memorial Lecture presented to 14th Symposium of the International Committee on Aeronautical Fatigue (ICAF), Ottawa, Canada, June 10-12, 1987.
[3] Folias, E. S. "An Axial Crack in a Pressurized Cylindrical Shell," International Journal of Fracture Mechanics, Vol. 1, No. 2 1965, pp. 104-113.
[4] Erdogan, F. and Ratwani, M., "Fracture of Cylindrical and Spherical Shells Containing a Crack," Nuclear Engineering and Design, Vol. 20, 1972, pp. 265-286.
[5] Zehnder A. T., Viz, M. J. and Ingraffea, A. R., "Fatigue Fracture in Thin Plates Subjected to Tensile and Shearing Loads: Crack Tip Fields, J Integral and Preliminary Experimental Results," Proceedings VII SEM International Congress on Experimental Mechanics, Las Vegas, June 1992.
[6] Potyondy, D. O. and Ingraffea, A. R. "A Methodology for Simulation of Curvilinear Crack Growth in Pressurized Fuselages," Durability of Metal Aircraft Structures, (eds. S. N. Atluri et al.), Atlanta Publ., 1992, pp 167-199.
[7] Miller, M., Kaelber, K. N. and Worden, E. R., "Finite Element Analysis of Pressure Vessel Panels," Durability of Metal Aircraft Structures, (eds. S. N. Atluri et al.), Atlanta Publ., 1992, pp 337-348.
[8] Young, R., Rankin, C., Starnes, J. and Britt, V., "Introduction to Stags", informal report, March 199l.
[9] "Tecplot Version 6 User’s Manual," Amtec Engineering, Inc., Bellevue, WA, 1993.
[10] Aluminum Standards & Data, 3rd. Edition, The Aluminum Association, New York, N.Y., 1972.
[11] Newman, J. C. Jr., Bigelow, C. A., and Dawicke, D. S. "Finite-element Analysis and Fracture Simulation in Thin-sheet Aluminum Alloy," Durability of Metal Aircraft Structures, (eds. S. N. Atluri et al.), Atlanta Publ., 1992, pp 167-199.
[12] Erdogan, F. and Sih, G. C., "On the Crack Extension in Plates under Plane Loading and Transverse Shear," J. Basic Eng., 85, 1963, pp. 519-527.

27
[13] Fyfe, I. M. and Sethi, V. "The Role of Thin Cylinder Bulging on Crack Curvature," AIAA, 32nd Structures, Structural Dynamics, and Materials Conference, Part 2, 1991, pp. 1341-1348.
[14] Riks, E., Brogan, F. A. and Rankin, C. C., "Bulging Cracks in Pressurized Fuselages: A Procedure for Computation," Analytical and Computational Models of Shells, A.K. Noor, T. Belytschko, and J.C. Simo, eds., ASME, New York, ASME CED Vol. 3, 1989, pp. 483-507.

28
APPENDIX
Summary of Test Program
#of Specimens Mat'l Yld, psi R, in t , in 2a , in h, in #StrainGuages
COD Method P(f), psi
1 6061-T4 16,000 1.250 0.028 0.75 ––– 4 Clip, Calip's 375
23 6061-T4 16,000 1.250 0.028 0.75 ––– 0 Calipers 275-400
2 6061-T4 16,000 1.250 0.028 0.75 ––– 0 Photos 300-350
Specimen #
452 2024-T3 44,000 3.000 0.016 ––– ––– 4 ––– –––
453 2024-T3 44,000 3.000 0.016 0.75 ––– 4 ––– 118
457 2024-T3 44,000 3.000 0.016 0.75 ––– 0 Clip Gauge 105
458 2024-T3 44,000 3.000 0.016 0.75 ––– 1 ––– 99
459 2024-T3 44,000 3.000 0.016 0.75 ––– 4 Clip Gauge 100
480 2024-T3 44,000 3.000 0.016 0.75 ––– 1 ––– –––
479 (Tr) 2024-T3 44,000 3.000 0.016 0.75 ––– 2 Clip Gauge 105
471/483/484 2024-T3 44,000 3.000 0.016 1.00 ––– 2/0/0 Clip Gauge 84/81/84
472 2024-T3 44,000 3.000 0.016 1.25 ––– 2 Clip Gauge 70
468 2024-T3 44,000 3.000 0.016 1.50 ––– 2 Clip Gauge 58
474 2024-T3 44,000 3.000 0.025 0.75 ––– 2 Clip Gauge 173
475 2024-T3 44,000 3.000 0.025 1.00 ––– 2 Clip Gauge 139
477 2024-T3 44,000 3.000 0.025 1.25 ––– 2 Clip Gauge 118
478 2024-T3 44,000 3.000 0.025 1.50 ––– 2 Clip Gauge 101
460 2024-O 14,000 3.000 0.016 0.75 ––– 4 Clip Gauge 59
461 2024-O 14,000 3.000 0.016 0.75 ––– 2 Clip Gauge 62
481 2024-O 14,000 3.000 0.016 0.75 ––– 1 ––– –––
462 2024-O 14,000 3.000 0.016 1.50 ––– 2 Clip Gauge 41
463 2024-T3 44,000 4.000 0.016 0.75 ––– 4 ––– 84
464 2024-T3 44,000 4.000 0.016 0.75 ––– 2 Clip Gauge 87
465 2024-T3 44,000 4.000 0.016 0.75 ––– 2 Clip Gauge 87
473 2024-T3 44,000 4.000 0.016 1.25 ––– 2 Clip Gauge 62
476 2024-T3 44,000 4.000 0.016 1.50 ––– 2 Clip Gauge 53
467 2024-O 14,000 4.000 0.016 0.75 ––– 2 Clip Gauge 52
466/486 2024-T3 44,000 4.000 0.016 0.75 0.31 2/0 ––– 108/105
469 2024-T3 44,000 4.000 0.016 0.75 0.81 4 Clip Gauge 92
470/487 2024-T3 44,000 4.000 0.016 0.75 0.06 2/0 Clip Gauge 117/120
490 2024-T3 44,000 3.000 0.016 0.75 0.52 0 U.S.C. 119
491 2024-T3 44,000 3.000 0.016 0.75 0.52 0 U.S.C. 124

REPORT DOCUMENTATION PAGE Form ApprovedOMB No. 0704-0188
Public reporting burden for this collection of information is estimated to average 1 hour per response, including the time for reviewing instructions,searching existing data sources, gathering and maintaining the data needed, and completing and reviewing the collection of information. Sendcomments regarding this burden estimate or any other aspect of this collection of information, including suggestions for reducing the burden, toWashington Headquarters Services, Directorate for Information Operations and Reports, 1215 Jefferson Davis Highway, Suite 1204, Arlington, VA22202-4302, and to the Office of Management and Budget, Paperwork Reduction Project (0704-0188), Washington, DC 20503.1. AGENCY USE ONLY (Leave Blank) 2. REPORT DATE
August 19983. REPORT TYPE AND DATES COVEREDContractor Report
4. TITLE AND SUBTITLEA Study of Failure in Small Pressurized Cylindrical ShellsContaining a Crack
5. FUNDING NUMBERS
WU 538-02-10-01
6. AUTHOR(S)Craig A. Barwell, Lorenz Eber, and Ian M. Fyfe
7. PERFORMING ORGANIZATION NAME(S) AND ADDRESS(ES)University of WashingtonSeattle, Washington
8. PERFORMING ORGANIZATION REPORT NUMBER
9. SPONSORING/MONITORING AGENCY NAME(S) AND ADDRESS(ES )National Aeronautics and Space AdministrationWashington, DC 20546-0001
10. SPONSORING/MONITORING AGENCY REPORT NUMBER
NASA/CR-1998-208454
11. SUPPLEMENTARY NOTESFinal Report, NASA Contract NAG1-1586, from Professor I. M. Fyfe, Department of Aeronautics and Astronautics,University of Washington, Seattle, WA.
12a. DISTRIBUTION/AVAILABILITY STATEMENTUnclassified-UnlimitedSubject Category 24 Distribution: StandardAvailability: NASA CASI (301) 621-0390
12b. DISTRIBUTION CODE
13. ABSTRACT (Maximum 200 words)The deformation in the vicinity of axial cracks in thin pressurized cylinders is examined using small experimentalmodels. The loading applied was either symmetric or unsymmetric about the crack plane, the latter being caused bystructural constraints such as stringers. The objective was two fold - one, to provide the experimental results which willallow computer modeling techniques to be evaluated for deformations that are significantly different from thatexperienced by flat plates, and the other to examine the deformations and conditions associated with the onset of crackkinking which often precedes crack curving.
The stresses which control crack growth in a cylindrical geometry depend on conditions introduced by the axial bulging,which is an integral part of this type of failure. For the symmetric geometry, both the hoop and radial strain just aheadoff the crack, r = a, were measured and these results compared with those obtained from a variety of structural analysiscodes, in particular STAGS [1], ABAQUS and ANSYS. In addition to these measurements, the pressures at the onsetof stable and unstable crack growth were obtained and the corresponding crack deformations measured as the pressureswere increased to failure. For the unsymmetric cases, measurements were taken of the crack kinking angle, and thedisplacements in the vicinity of the crack.
In general, the strains ahead of the crack showed good agreement between the three computer codes and between the codesand the experiments. In the case of crack behavior, it was determined that modeling stable tearing with a crack-tipopening displacement fracture criterion could be successfully combined with the finite-element analysis techniques asused in structural analysis codes. The analytic results obtained in this study were very compatible with the experimentalobservations of crack growth. Measured crack kinking angles also showed good agreement with theories based on themaximum principle stress criterion.14. SUBJECT TERMSFracture; CTOA; STAGS; Cylinders; Cracks; Plasticity
15. NUMBER OF PAGES34
16. PRICE CODEA03
17. SECURITY CLASSIFICATION OF REPORT Unclassified
18. SECURITY CLASSIFICATION OF THIS PAGE Unclassified
19. SECURITY CLASSIFICATION OF ABSTRACT Unclassified
20. LIMITATION OF ABSTRACT
NSN 7540-01-280-5500 Standard Form 298 (Rev. 2-89)Prescribed by ANSI Std. Z-39-18298-102