Embed Size (px)
Citation preview
13 11 20 All Queenslanders, all cancers. cancerqld.org.au
A SUMMARY OF
Childhood Cancer Statistics in Australia, 1983-2014
Cancer is one of the most common causes of death among children aged under 15 years in Australia. Beyond the loss of young lives, the burden of childhood cancer extends to the long-term adverse health effects experienced by a large proportion of childhood cancer survivors, either because of the cancer itself or as a result of treatment.
Cancer Council Queensland funds and manages the Australian Childhood Cancer Registry (ACCR). The ACCR is a national resource and operates in collaboration with the Australasian Association of Cancer Registries, all Australian State and Territory population cancer registries and all paediatric oncology treating hospitals.
It’s purpose is to provide epidemiological information to clinicians, researchers and patients and their families, with the aim of developing a better understanding of the causes of childhood cancer and improving outcomes for children with cancer.
What is the Australian Childhood Cancer Registry (ACCR)?
• The ACCR is one of only a few national registries of childhood cancer in the world.
• It covers all Australian children aged 0-14 years old at diagnosis.
• Information is collected on cancer diagnosis, stage, treatment and survival.
• Detailed and verified data is currently available for the period 1983-2014.
How many children are diagnosed with cancer in Australia? (2010-2014)
• On average, about 750 children aged 0-14 years old were diagnosed with cancer each year in Australia between 2010 and 2014, corresponding to an age-standardised rate of 172 cases per million children per year.
• Australia has the fifth highest incidence rate of childhood cancers among countries in the G20, following Germany, the United States, South Korea and Canada.
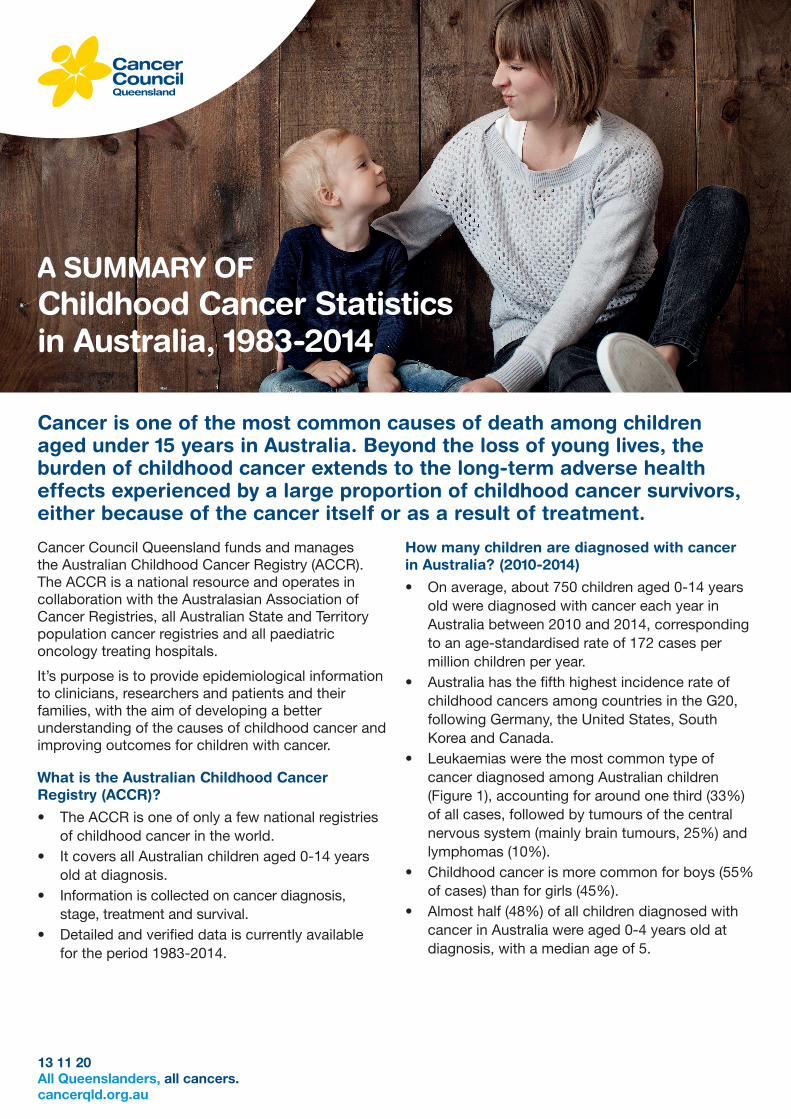
• Leukaemias were the most common type of cancer diagnosed among Australian children (Figure 1), accounting for around one third (33%) of all cases, followed by tumours of the central nervous system (mainly brain tumours, 25%) and lymphomas (10%).
• Childhood cancer is more common for boys (55% of cases) than for girls (45%).
• Almost half (48%) of all children diagnosed with cancer in Australia were aged 0-4 years old at diagnosis, with a median age of 5.
13 11 20 All Queenslanders, all cancers. cancerqld.org.au
0 50 100 150 200 250
Hepatic tumours
Dia
gno
stic
gro
up
Inci
den
t ra
te (p
er m
illio
n ch
ildre
n)C
oun
try
Time since diagnosis (years)
Mortality rate (per million children)
Retinoblastoma
Malignant bone tumours
Other malignant epithelial tumours & melanomas
Germ cell tumours
Renal tumours
Soft tissue sarcomas
Neuroblastoma
Lymphomas
Tumours of the centralnervous system
Leukaemias
10.4
17.2
28.0
29.4
31.0
36.0
45.2
45.6
74.8
185.2
245.4
Trend Observed
2003-2012 1993-2002 1983-1992
1998
Mo
rtal
ity
rate
(per
mill
ion
child
ren)
Trend Observed
0 20 40 60 80 100
Australia
Japan
France
Germany
United Kingdom
United States
Canada
India
South Africa
Italy
South Korea
Argentina
Russia
China
Brazil
Mexico
Saudi Arabia
Indonesia
Turkey
19
19
21
21
21
23
24
26
26
30
30
38
38
44
45
51
63
75
87
0
100
200
2014200820031998199319881983
Rel
ativ
e su
rviv
al (%
)
0
10
20
30
40
50
60
70
80
90
100
54321
0
10
20
30
40
50
201420092004
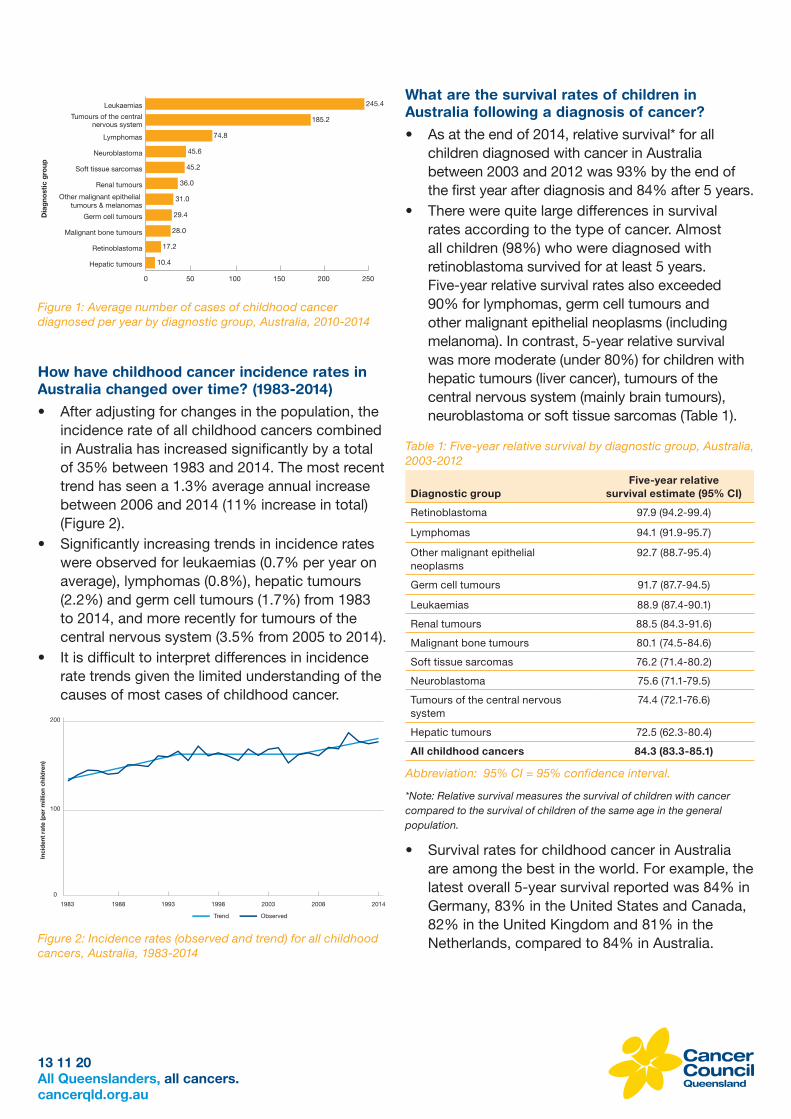
Figure 1: Average number of cases of childhood cancer diagnosed per year by diagnostic group, Australia, 2010-2014
How have childhood cancer incidence rates in Australia changed over time? (1983-2014)
• After adjusting for changes in the population, the incidence rate of all childhood cancers combined in Australia has increased significantly by a total of 35% between 1983 and 2014. The most recent trend has seen a 1.3% average annual increase between 2006 and 2014 (11% increase in total) (Figure 2).
• Significantly increasing trends in incidence rates were observed for leukaemias (0.7% per year on average), lymphomas (0.8%), hepatic tumours (2.2%) and germ cell tumours (1.7%) from 1983 to 2014, and more recently for tumours of the central nervous system (3.5% from 2005 to 2014).
• It is difficult to interpret differences in incidence rate trends given the limited understanding of the causes of most cases of childhood cancer.0 50 100 150 200 250
Hepatic tumours
Dia
gno
stic
gro
up
Inci
den
t ra
te (p
er m
illio
n ch
ildre
n)C
oun
try
Time since diagnosis (years)
Mortality rate (per million children)
Retinoblastoma
Malignant bone tumours
Other malignant epithelial tumours & melanomas
Germ cell tumours
Renal tumours
Soft tissue sarcomas
Neuroblastoma
Lymphomas
Tumours of the centralnervous system
Leukaemias
10.4
17.2
28.0
29.4
31.0
36.0
45.2
45.6
74.8
185.2
245.4
Trend Observed
2003-2012 1993-2002 1983-1992
1998
Mo
rtal
ity
rate
(per
mill
ion
child
ren)
Trend Observed
0 20 40 60 80 100
Australia
Japan
France
Germany
United Kingdom
United States
Canada
India
South Africa
Italy
South Korea
Argentina
Russia
China
Brazil
Mexico
Saudi Arabia
Indonesia
Turkey
19
19
21
21
21
23
24
26
26
30
30
38
38
44
45
51
63
75
87
0
100
200
2014200820031998199319881983
Rel
ativ
e su
rviv
al (%
)
0
10
20
30
40
50
60
70
80
90
100
54321
0
10
20
30
40
50
201420092004
Figure 2: Incidence rates (observed and trend) for all childhood cancers, Australia, 1983-2014
What are the survival rates of children in Australia following a diagnosis of cancer?
• As at the end of 2014, relative survival* for all children diagnosed with cancer in Australia between 2003 and 2012 was 93% by the end of the first year after diagnosis and 84% after 5 years.
• There were quite large differences in survival rates according to the type of cancer. Almost all children (98%) who were diagnosed with retinoblastoma survived for at least 5 years. Five-year relative survival rates also exceeded 90% for lymphomas, germ cell tumours and other malignant epithelial neoplasms (including melanoma). In contrast, 5-year relative survival was more moderate (under 80%) for children with hepatic tumours (liver cancer), tumours of the central nervous system (mainly brain tumours), neuroblastoma or soft tissue sarcomas (Table 1).
Table 1: Five-year relative survival by diagnostic group, Australia, 2003-2012
Diagnostic groupFive-year relative
survival estimate (95% CI)
Retinoblastoma 97.9 (94.2-99.4)
Lymphomas 94.1 (91.9-95.7)
Other malignant epithelial neoplasms
92.7 (88.7-95.4)
Germ cell tumours 91.7 (87.7-94.5)
Leukaemias 88.9 (87.4-90.1)
Renal tumours 88.5 (84.3-91.6)
Malignant bone tumours 80.1 (74.5-84.6)
Soft tissue sarcomas 76.2 (71.4-80.2)
Neuroblastoma 75.6 (71.1-79.5)
Tumours of the central nervous system
74.4 (72.1-76.6)
Hepatic tumours 72.5 (62.3-80.4)
All childhood cancers 84.3 (83.3-85.1)
Abbreviation: 95% CI = 95% confidence interval.
*Note: Relative survival measures the survival of children with cancer compared to the survival of children of the same age in the general population.
• Survival rates for childhood cancer in Australia are among the best in the world. For example, the latest overall 5-year survival reported was 84% in Germany, 83% in the United States and Canada, 82% in the United Kingdom and 81% in the Netherlands, compared to 84% in Australia.
13 11 20 All Queenslanders, all cancers. cancerqld.org.au
How have survival rates for children with cancer in Australia changed over time?
• Five-year relative survival for all childhood cancers combined improved from 72% for children diagnosed between 1983-1992 to 84% for those diagnosed between 2003-2012 (Figure 3).
• Very large improvements in survival were found for the diagnostic groups of leukaemias, lymphomas, neuroblastoma and malignant bone tumours. However, there has been little or no improvement in survival for several other types of childhood cancer over recent years, particularly hepatic tumours.
• Most of the gains in childhood cancer survival have occurred as a direct result of improvements in treatment through international collaborative clinical trials.
0 50 100 150 200 250
Hepatic tumours
Dia
gno
stic
gro
up
Inci
den
t ra
te (p
er m
illio
n ch
ildre
n)C
oun
try
Time since diagnosis (years)
Mortality rate (per million children)
Retinoblastoma
Malignant bone tumours
Other malignant epithelial tumours & melanomas
Germ cell tumours
Renal tumours
Soft tissue sarcomas
Neuroblastoma
Lymphomas
Tumours of the centralnervous system
Leukaemias
10.4
17.2
28.0
29.4
31.0
36.0
45.2
45.6
74.8
185.2
245.4
Trend Observed
2003-2012 1993-2002 1983-1992
1998
Mo
rtal
ity
rate
(per
mill
ion
child
ren)
Trend Observed
0 20 40 60 80 100
Australia
Japan
France
Germany
United Kingdom
United States
Canada
India
South Africa
Italy
South Korea
Argentina
Russia
China
Brazil
Mexico
Saudi Arabia
Indonesia
Turkey
19
19
21
21
21
23
24
26
26
30
30
38
38
44
45
51
63
75
87
0
100
200
2014200820031998199319881983
Rel
ativ
e su
rviv
al (%
)
0
10
20
30
40
50
60
70
80
90
100
54321
0
10
20
30
40
50
201420092004
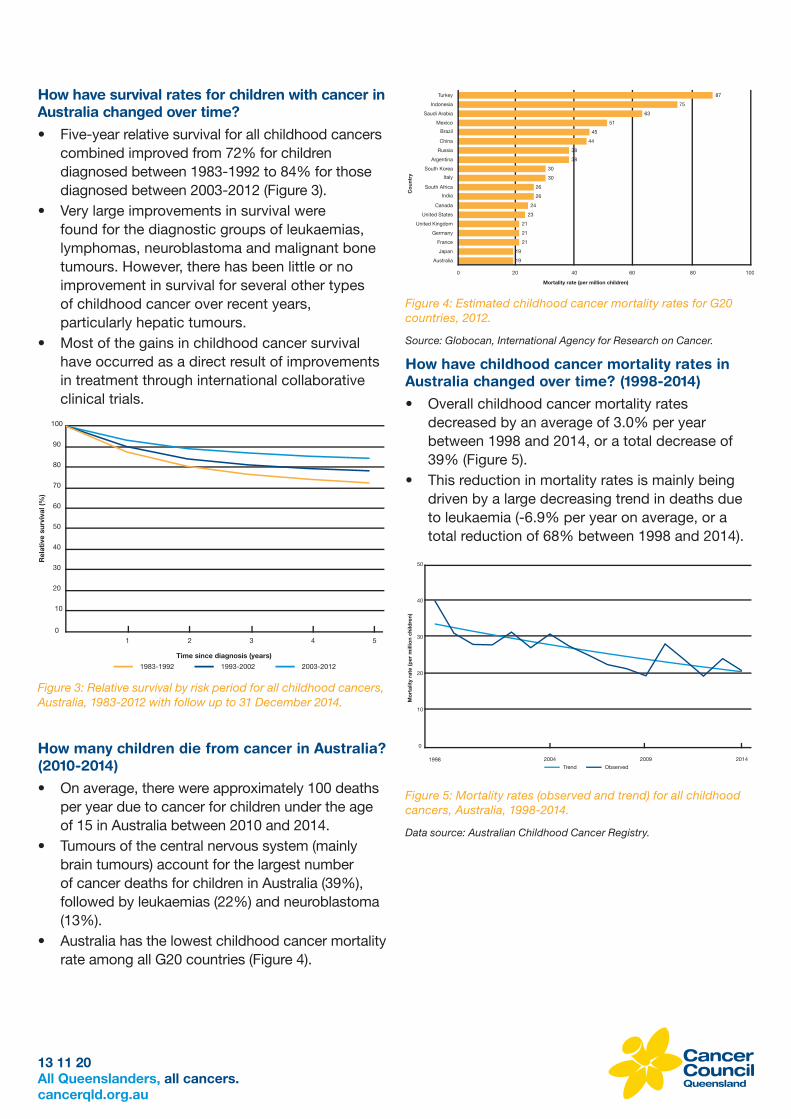
Figure 3: Relative survival by risk period for all childhood cancers, Australia, 1983-2012 with follow up to 31 December 2014.
How many children die from cancer in Australia? (2010-2014)
• On average, there were approximately 100 deaths per year due to cancer for children under the age of 15 in Australia between 2010 and 2014.
• Tumours of the central nervous system (mainly brain tumours) account for the largest number of cancer deaths for children in Australia (39%), followed by leukaemias (22%) and neuroblastoma (13%).
• Australia has the lowest childhood cancer mortality rate among all G20 countries (Figure 4).
0 50 100 150 200 250
Hepatic tumours
Dia
gno
stic
gro
up
Inci
den
t ra
te (p
er m
illio
n ch
ildre
n)C
oun
try
Time since diagnosis (years)
Mortality rate (per million children)
Retinoblastoma
Malignant bone tumours
Other malignant epithelial tumours & melanomas
Germ cell tumours
Renal tumours
Soft tissue sarcomas
Neuroblastoma
Lymphomas
Tumours of the centralnervous system
Leukaemias
10.4
17.2
28.0
29.4
31.0
36.0
45.2
45.6
74.8
185.2
245.4
Trend Observed
2003-2012 1993-2002 1983-1992
1998
Mo
rtal
ity
rate
(per
mill
ion
child
ren)
Trend Observed
0 20 40 60 80 100
Australia
Japan
France
Germany
United Kingdom
United States
Canada
India
South Africa
Italy
South Korea
Argentina
Russia
China
Brazil
Mexico
Saudi Arabia
Indonesia
Turkey
19
19
21
21
21
23
24
26
26
30
30
38
38
44
45
51
63
75
87
0
100
200
2014200820031998199319881983
Rel
ativ
e su
rviv
al (%
)
0
10
20
30
40
50
60
70
80
90
100
54321
0
10
20
30
40
50
201420092004
Figure 4: Estimated childhood cancer mortality rates for G20 countries, 2012.
Source: Globocan, International Agency for Research on Cancer.
How have childhood cancer mortality rates in Australia changed over time? (1998-2014)
• Overall childhood cancer mortality rates decreased by an average of 3.0% per year between 1998 and 2014, or a total decrease of 39% (Figure 5).
• This reduction in mortality rates is mainly being driven by a large decreasing trend in deaths due to leukaemia (-6.9% per year on average, or a total reduction of 68% between 1998 and 2014).
0 50 100 150 200 250
Hepatic tumours
Dia
gno
stic
gro
up
Inci
den
t ra
te (p
er m
illio
n ch
ildre
n)C
oun
try
Time since diagnosis (years)
Mortality rate (per million children)
Retinoblastoma
Malignant bone tumours
Other malignant epithelial tumours & melanomas
Germ cell tumours
Renal tumours
Soft tissue sarcomas
Neuroblastoma
Lymphomas
Tumours of the centralnervous system
Leukaemias
10.4
17.2
28.0
29.4
31.0
36.0
45.2
45.6
74.8
185.2
245.4
Trend Observed
2003-2012 1993-2002 1983-1992
1998
Mo
rtal
ity
rate
(per
mill
ion
child
ren)
Trend Observed
0 20 40 60 80 100
Australia
Japan
France
Germany
United Kingdom
United States
Canada
India
South Africa
Italy
South Korea
Argentina
Russia
China
Brazil
Mexico
Saudi Arabia
Indonesia
Turkey
19
19
21
21
21
23
24
26
26
30
30
38
38
44
45
51
63
75
87
0
100
200
2014200820031998199319881983
Rel
ativ
e su
rviv
al (%
)
0
10
20
30
40
50
60
70
80
90
100
54321
0
10
20
30
40
50
201420092004
Figure 5: Mortality rates (observed and trend) for all childhood cancers, Australia, 1998-2014.
Data source: Australian Childhood Cancer Registry.