Embed Size (px)
Citation preview
A synaptic organizing principle for corticalneuronal groupsRodrigo Perin, Thomas K. Berger1, and Henry Markram2
Blue Brain Project, Ecole Polytechnique Fédérale de Lausanne (EPFL), CH-1015 Lausanne, Switzerland
Edited by Roger A. Nicoll, University of California, San Francisco, CA, and approved February 7, 2011 (received for review October 29, 2010)
Neuronal circuitry is often considered a clean slate that can bedynamically and arbitrarily molded by experience. However, whenwe investigated synaptic connectivity in groups of pyramidalneurons in the neocortex, we found that both connectivity andsynaptic weights were surprisingly predictable. Synaptic weightsfollowvery closely the number of connections in a group of neurons,saturating after only 20% of possible connections are formedbetween neurons in a group. When we examined the networktopology of connectivity between neurons, we found that theneurons cluster into small world networks that are not scale-free,with less than 2 degrees of separation. We found a simple clusteringrule where connectivity is directly proportional to the number ofcommon neighbors, which accounts for these small world networksand accurately predicts the connection probability between anytwo neurons. This pyramidal neuron network clusters into multiplegroups of a few dozen neurons each. The neurons composing eachgroup are surprisingly distributed, typically more than 100 μmapart,allowing for multiple groups to be interlaced in the same space. Insummary, we discovered a synaptic organizing principle that groupsneurons in a manner that is common across animals and hence, in-dependent of individual experiences. We speculate that these ele-mentary neuronal groups are prescribed Lego-like building blocks ofperception and that acquired memory relies more on combiningthese elementary assemblies into higher-order constructs.
cell assemblies | Edelman | Hebb | brain development | learning
Hebb’s (1) contributions to the theory of learning and mem-ory have shaped psychological, philosophical, and neuro-
scientific theories for over 60 y. Three of the concepts that he putforward were particularly important. The first defines a correla-tion-based learning rule, namely that when one neuron persis-tently drives another, then the connection between them will bestrengthened. The second states that this leads to the formationof clustered synaptic coupling of neurons into cell assemblieswhose network topologies are molded by experience; the thirdsuggests that such elementary cell assemblies are synapticallylinked by the same learning rule to form trains of percepts (aphase sequence), constituting thoughts (1–6). There is a vastbody of evidence for all three concepts (5, 7–10).Despite this evidence, theorists have pointed out that the first
postulate would cause synapses within cell assemblies to saturate,restricting their dynamic range and limiting memory storage ca-pacity (11–20). Experimental studies have confirmed that saturatedlong-term potentiation (LTP) is unfavorable to learning andmemory (21, 22). Although Hebb (1) had suggested a mechanismfor passive weakening of unused synaptic connections, these ob-jections suggested the need for an active depressive mechanism(16, 17, 23), inspiring the discoveries of long-term depression(LTD) (24) and bidirectional and spike timing-dependent plasticity(STDP) (25). Bidirectional plasticity provided a plausible mecha-nism for synaptic weights to assume arbitrary values depending oncorrelated activity among neurons. In artificial neural networksincorporating these modified Hebbian mechanisms, experiencecan mold the network topology of cell assemblies, endowing themwith remarkable information processing and memory capabilities(11–20). However, these models are based on two key assump-
tions. The first is that memory is stored in the configuration ofthe connectivity of neurons in an assembly and in the set of syn-aptic weights of the connections; the second is that experience canfreely mold the network connectivity and synaptic weights.What is known about the network topology of cortical micro-
circuits? Intracellular recordings from multiple neurons haveshown that different types of neurons have different connectionprobabilities and different numbers and distributions of synapses(26–30). Connection probabilities between neocortical neuronsalso vary according to the layer in which they reside (31, 32), thebrain regions to which they project, and the brain regions fromwhich they receive input (33, 34). Although these findings provideevidence for synaptic clustering, it is likely that these forms ofclustering also involve genetically determined, topographical, andneuron-specific connectivity principles (35–38).Evidence for synaptic clustering between neurons of the same
type in a microcircuit began with the finding that layer 5 pyramidalneurons are reciprocally connected more often than expectedfrom their unidirectional connection probabilities (39). A sys-tematic study of triplets of these same pyramidal neurons by Songet al. (40) led to the discovery of three-cell motifs of connectivity.There is considerable evidence for circuit plasticity between
neocortical pyramidal neurons. When neurons lie within about50 μm of each other (i.e., within the dimensions of a mini-column), the axon of every pyramidal neuron is structurallyconnected to the dendrites of virtually every other pyramidalneuron in the immediate vicinity (41). This structural tabula rasaoffers enormous opportunities for functional rewiring of neuronconnectivities without major growth and reorganization of theirneural arbors (42–44). Indeed, the synaptic circuitry of theselayer 5 pyramidal neurons dynamically rewires after stimulation(45), indicating that activity can influence synaptic connectivity.Transmission across these established synaptic connections alsoundergoes lasting changes (46) driven by the relative timing ofspikes emitted by pre- and postsynaptic neurons (47), providinga mechanism for stimuli to specifically mold the synaptic weights.Indeed, numerous models have shown that timing-dependent bi-directional plasticity rules have the potential to uniquely con-figure cell assemblies in ways that represent specific stimuli,allowing assemblies to learn from experience (48–52). What isnot known, however, is whether such plasticity mechanisms havefree range to arbitrarily mold neuron assemblies starting froma clean slate, as suggested by the structural tabula rasa, orwhether they must operate under constraints of some prescribed
Author contributions: H.M. conceived the 12-patch system and experiments; R.P. built the12-patch system; R.P. and T.K.B. performed experiments; R.P. and H.M. analyzed the data;and H.M. and R.P. wrote the paper.
The authors declare no conflict of interest.
This article is a PNAS Direct Submission.
Freely available online through the PNAS open access option.1Present address: Department of Molecular and Cell Biology, University of California,Berkeley, CA 94720-3200.
2To whom correspondence should be addressed. E-mail: [email protected].
This article contains supporting information online at www.pnas.org/lookup/suppl/doi:10.1073/pnas.1016051108/-/DCSupplemental.
www.pnas.org/cgi/doi/10.1073/pnas.1016051108 PNAS Early Edition | 1 of 6
NEU
ROSC
IENCE
synaptic organization. It is, therefore, important to knowwhether there exists any preferred synaptic connectivity betweenneurons at early stages of brain development.In this paper, we present a study in which we searched for
synaptically clustered neurons in the neocortex of neonatal ani-mals (postnatal day 14) in the same neocortical region (so-matosensory) and on the same layer 5 pyramidal (thick-tuftedsubcortically projecting) neurons on which a vast number ofstructural, functional, and plasticity studies have already gener-ated extensive evidence for experience-dependent plasticity. Westudied the topology and weights of the synaptic networks ofgroups of up to 12 simultaneously recorded neurons usinga newly designed multineuron patch-clamp set-up.
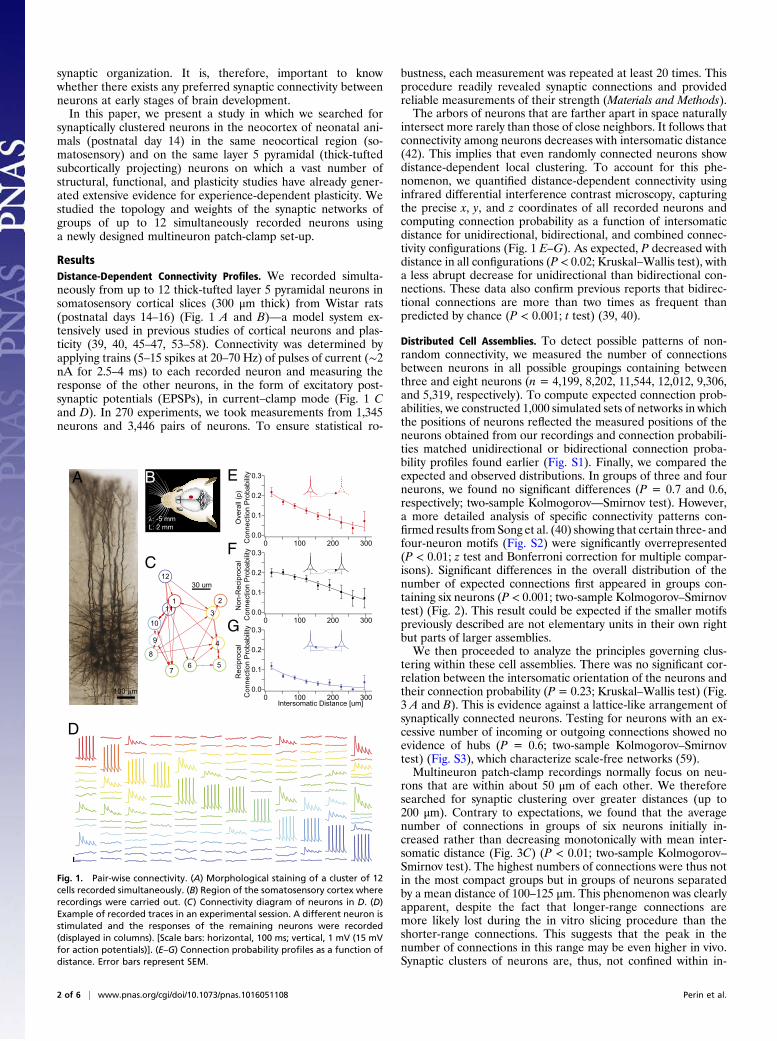
ResultsDistance-Dependent Connectivity Profiles. We recorded simulta-neously from up to 12 thick-tufted layer 5 pyramidal neurons insomatosensory cortical slices (300 μm thick) from Wistar rats(postnatal days 14–16) (Fig. 1 A and B)—a model system ex-tensively used in previous studies of cortical neurons and plas-ticity (39, 40, 45–47, 53–58). Connectivity was determined byapplying trains (5–15 spikes at 20–70 Hz) of pulses of current (∼2nA for 2.5–4 ms) to each recorded neuron and measuring theresponse of the other neurons, in the form of excitatory post-synaptic potentials (EPSPs), in current–clamp mode (Fig. 1 Cand D). In 270 experiments, we took measurements from 1,345neurons and 3,446 pairs of neurons. To ensure statistical ro-
bustness, each measurement was repeated at least 20 times. Thisprocedure readily revealed synaptic connections and providedreliable measurements of their strength (Materials and Methods).The arbors of neurons that are farther apart in space naturally
intersect more rarely than those of close neighbors. It follows thatconnectivity among neurons decreases with intersomatic distance(42). This implies that even randomly connected neurons showdistance-dependent local clustering. To account for this phe-nomenon, we quantified distance-dependent connectivity usinginfrared differential interference contrast microscopy, capturingthe precise x, y, and z coordinates of all recorded neurons andcomputing connection probability as a function of intersomaticdistance for unidirectional, bidirectional, and combined connec-tivity configurations (Fig. 1 E–G). As expected, P decreased withdistance in all configurations (P < 0.02; Kruskal–Wallis test), witha less abrupt decrease for unidirectional than bidirectional con-nections. These data also confirm previous reports that bidirec-tional connections are more than two times as frequent thanpredicted by chance (P < 0.001; t test) (39, 40).
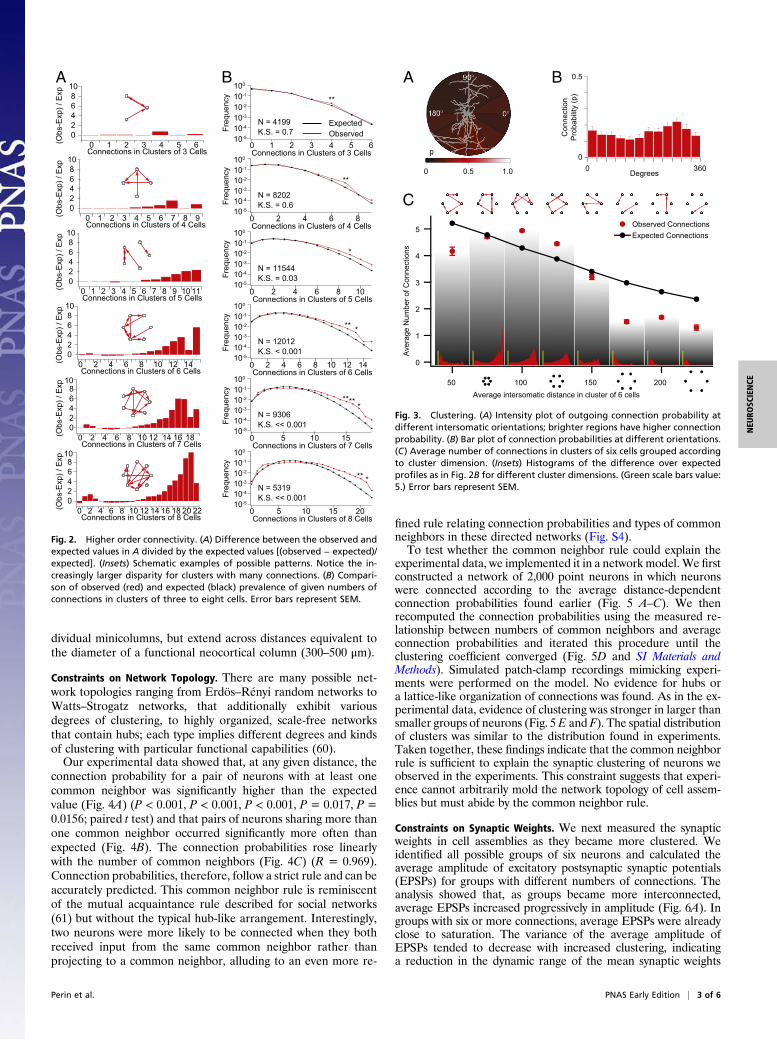
Distributed Cell Assemblies. To detect possible patterns of non-random connectivity, we measured the number of connectionsbetween neurons in all possible groupings containing betweenthree and eight neurons (n = 4,199, 8,202, 11,544, 12,012, 9,306,and 5,319, respectively). To compute expected connection prob-abilities, we constructed 1,000 simulated sets of networks in whichthe positions of neurons reflected the measured positions of theneurons obtained from our recordings and connection probabili-ties matched unidirectional or bidirectional connection proba-bility profiles found earlier (Fig. S1). Finally, we compared theexpected and observed distributions. In groups of three and fourneurons, we found no significant differences (P = 0.7 and 0.6,respectively; two-sample Kolmogorov—Smirnov test). However,a more detailed analysis of specific connectivity patterns con-firmed results from Song et al. (40) showing that certain three- andfour-neuron motifs (Fig. S2) were significantly overrepresented(P < 0.01; z test and Bonferroni correction for multiple compar-isons). Significant differences in the overall distribution of thenumber of expected connections first appeared in groups con-taining six neurons (P < 0.001; two-sample Kolmogorov–Smirnovtest) (Fig. 2). This result could be expected if the smaller motifspreviously described are not elementary units in their own rightbut parts of larger assemblies.We then proceeded to analyze the principles governing clus-
tering within these cell assemblies. There was no significant cor-relation between the intersomatic orientation of the neurons andtheir connection probability (P = 0.23; Kruskal–Wallis test) (Fig.3 A and B). This is evidence against a lattice-like arrangement ofsynaptically connected neurons. Testing for neurons with an ex-cessive number of incoming or outgoing connections showed noevidence of hubs (P = 0.6; two-sample Kolmogorov–Smirnovtest) (Fig. S3), which characterize scale-free networks (59).Multineuron patch-clamp recordings normally focus on neu-
rons that are within about 50 μm of each other. We thereforesearched for synaptic clustering over greater distances (up to200 μm). Contrary to expectations, we found that the averagenumber of connections in groups of six neurons initially in-creased rather than decreasing monotonically with mean inter-somatic distance (Fig. 3C) (P < 0.01; two-sample Kolmogorov–Smirnov test). The highest numbers of connections were thus notin the most compact groups but in groups of neurons separatedby a mean distance of 100–125 μm. This phenomenon was clearlyapparent, despite the fact that longer-range connections aremore likely lost during the in vitro slicing procedure than theshorter-range connections. This suggests that the peak in thenumber of connections in this range may be even higher in vivo.Synaptic clusters of neurons are, thus, not confined within in-
D
A
Ove
rall
(p)
Con
nect
ion
Pro
babi
lityE
Intersomatic Distance [um]
Rec
ipro
cal
Con
nect
ion
Pro
babi
lityG
Non
-Rec
ipro
cal
Con
nect
ion
Pro
babi
lityF
0.3
0.2
0.1
0.03002001000
0.3
0.2
0.1
0.03002001000
0.3
0.2
0.1
0.03002001000
C30 um
1 2
3
4
567
8
9
10
11
12
100 μm
B
λ: -5 mmL: 2 mm
Fig. 1. Pair-wise connectivity. (A) Morphological staining of a cluster of 12cells recorded simultaneously. (B) Region of the somatosensory cortex whererecordings were carried out. (C) Connectivity diagram of neurons in D. (D)Example of recorded traces in an experimental session. A different neuron isstimulated and the responses of the remaining neurons were recorded(displayed in columns). [Scale bars: horizontal, 100 ms; vertical, 1 mV (15 mVfor action potentials)]. (E–G) Connection probability profiles as a function ofdistance. Error bars represent SEM.
2 of 6 | www.pnas.org/cgi/doi/10.1073/pnas.1016051108 Perin et al.
dividual minicolumns, but extend across distances equivalent tothe diameter of a functional neocortical column (300–500 μm).
Constraints on Network Topology. There are many possible net-work topologies ranging from Erdös–Rényi random networks toWatts–Strogatz networks, that additionally exhibit variousdegrees of clustering, to highly organized, scale-free networksthat contain hubs; each type implies different degrees and kindsof clustering with particular functional capabilities (60).Our experimental data showed that, at any given distance, the
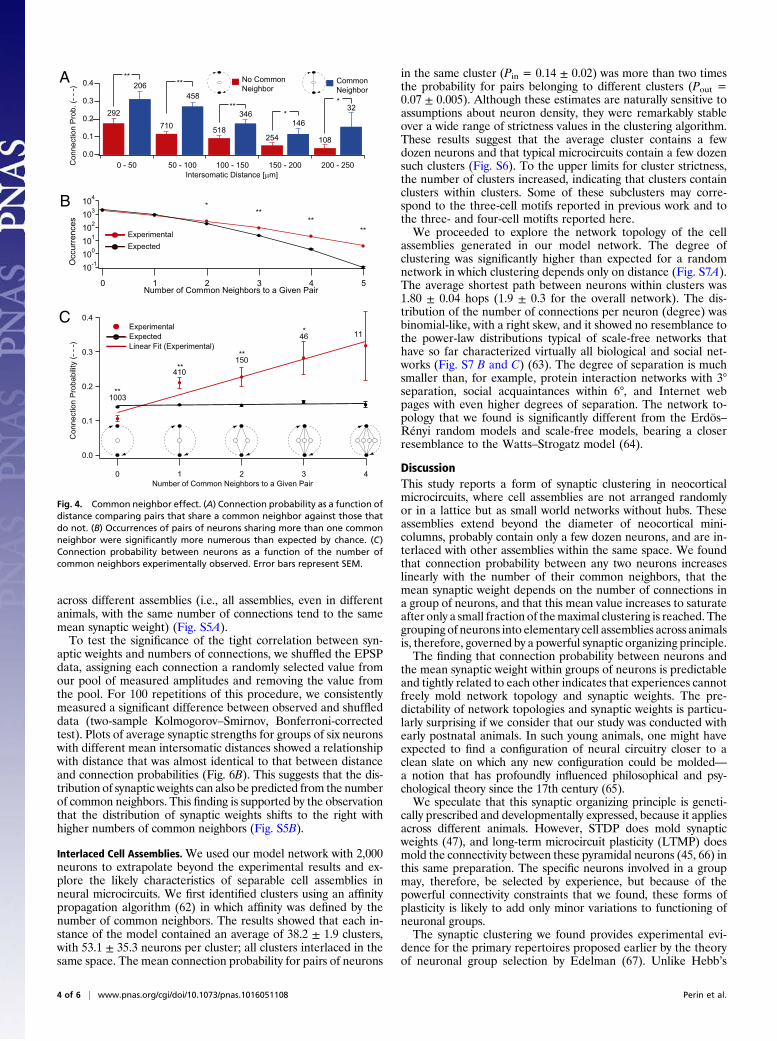
connection probability for a pair of neurons with at least onecommon neighbor was significantly higher than the expectedvalue (Fig. 4A) (P < 0.001, P < 0.001, P < 0.001, P = 0.017, P =0.0156; paired t test) and that pairs of neurons sharing more thanone common neighbor occurred significantly more often thanexpected (Fig. 4B). The connection probabilities rose linearlywith the number of common neighbors (Fig. 4C) (R = 0.969).Connection probabilities, therefore, follow a strict rule and can beaccurately predicted. This common neighbor rule is reminiscentof the mutual acquaintance rule described for social networks(61) but without the typical hub-like arrangement. Interestingly,two neurons were more likely to be connected when they bothreceived input from the same common neighbor rather thanprojecting to a common neighbor, alluding to an even more re-
fined rule relating connection probabilities and types of commonneighbors in these directed networks (Fig. S4).To test whether the common neighbor rule could explain the
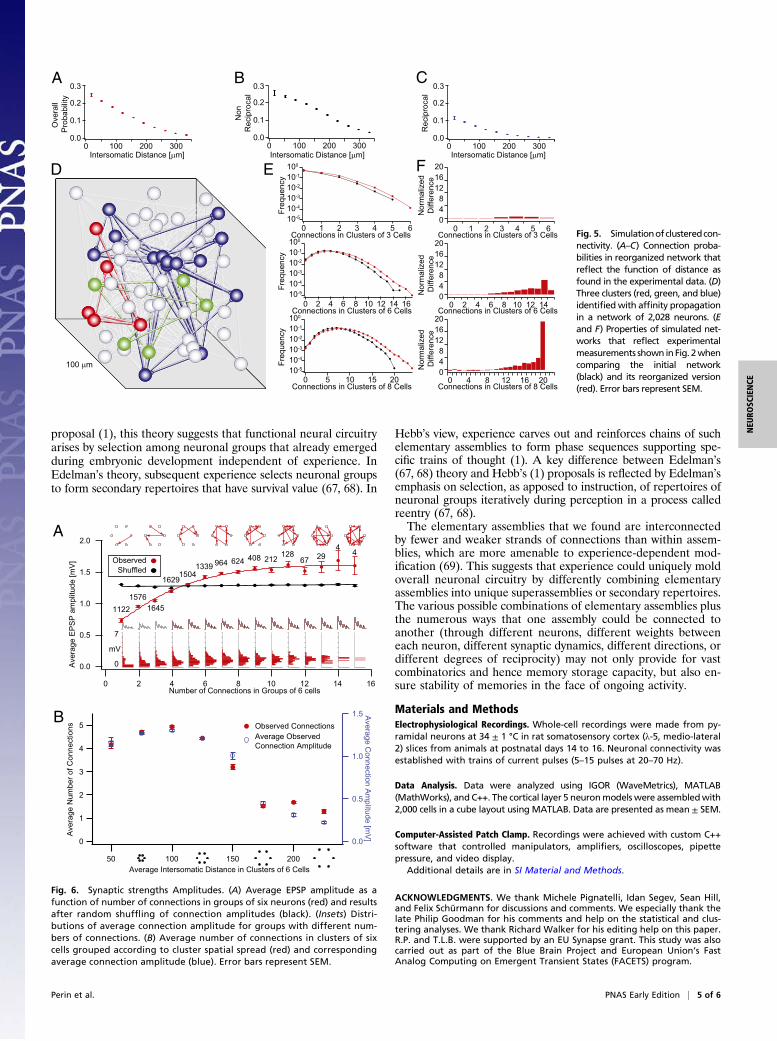
experimental data, we implemented it in a networkmodel.We firstconstructed a network of 2,000 point neurons in which neuronswere connected according to the average distance-dependentconnection probabilities found earlier (Fig. 5 A–C). We thenrecomputed the connection probabilities using the measured re-lationship between numbers of common neighbors and averageconnection probabilities and iterated this procedure until theclustering coefficient converged (Fig. 5D and SI Materials andMethods). Simulated patch-clamp recordings mimicking experi-ments were performed on the model. No evidence for hubs ora lattice-like organization of connections was found. As in the ex-perimental data, evidence of clustering was stronger in larger thansmaller groups of neurons (Fig. 5E and F). The spatial distributionof clusters was similar to the distribution found in experiments.Taken together, these findings indicate that the common neighborrule is sufficient to explain the synaptic clustering of neurons weobserved in the experiments. This constraint suggests that experi-ence cannot arbitrarily mold the network topology of cell assem-blies but must abide by the common neighbor rule.
Constraints on Synaptic Weights. We next measured the synapticweights in cell assemblies as they became more clustered. Weidentified all possible groups of six neurons and calculated theaverage amplitude of excitatory postsynaptic synaptic potentials(EPSPs) for groups with different numbers of connections. Theanalysis showed that, as groups became more interconnected,average EPSPs increased progressively in amplitude (Fig. 6A). Ingroups with six or more connections, average EPSPs were alreadyclose to saturation. The variance of the average amplitude ofEPSPs tended to decrease with increased clustering, indicatinga reduction in the dynamic range of the mean synaptic weights
1086420
0 2 4 6 8 10 12 14Connections in Clusters of 6 Cells
(Obs
-Exp
) / E
xp
1086420
0 1 2 3 4 5 6 7 8 9 10 11Connections in Clusters of 5 Cells
(Obs
-Exp
) / E
xp
1086420
0 1 2 3 4 5 6 7 8 9Connections in Clusters of 4 Cells
(Obs
-Exp
) / E
xp
1086420
0 1 2 3 4 5 6Connections in Clusters of 3 Cells
(Obs
-Exp
) / E
xp
BA
1086420
0 2 4 6 8 10 12 14 16 18Connections in Clusters of 7 Cells
(Obs
-Exp
) / E
xp
1086420
(Obs
-Exp
) / E
xp
0 2 4 6 8 10 12 14 16 18 20 22Connections in Clusters of 8 Cells
Freq
uenc
yFr
eque
ncy
Freq
uenc
yFr
eque
ncy
Freq
uenc
yFr
eque
ncy
10-510-410-310-210-1100
10-510-410-310-210-1100
10-510-410-310-210-1100
10-510-410-310-210-1100
10-510-410-310-210-1100
10-5
10-4
10-3
10-2
10-1
100
6543210
86420
1086420
14121086420
151050
20151050
Connections in Clusters of 6 Cells
Connections in Clusters of 5 Cells
Connections in Clusters of 4 Cells
Connections in Clusters of 3 Cells
Connections in Clusters of 7 Cells
Connections in Clusters of 8 Cells
ExpectedObserved
**
**
** *
*****
** *
K.S. < 0.001
K.S. = 0.03
K.S. = 0.6
K.S. = 0.7
K.S. << 0.001
K.S. << 0.001
N = 4199
N = 8202
N = 12012
N = 9306
N = 5319
N = 11544
*
Fig. 2. Higher order connectivity. (A) Difference between the observed andexpected values in A divided by the expected values [(observed − expected)/expected]. (Insets) Schematic examples of possible patterns. Notice the in-creasingly larger disparity for clusters with many connections. (B) Compari-son of observed (red) and expected (black) prevalence of given numbers ofconnections in clusters of three to eight cells. Error bars represent SEM.
C
5
4
3
2
1
0
Ave
rage
Num
ber o
f Con
nect
ions
20015010050Average intersomatic distance in cluster of 6 cells
Observed ConnectionsExpected Connections
A B 0.5
00
Degrees360
Con
nect
ion
Pro
babi
lity
(p)
1.00.5
p
0
90°
0°180°
Fig. 3. Clustering. (A) Intensity plot of outgoing connection probability atdifferent intersomatic orientations; brighter regions have higher connectionprobability. (B) Bar plot of connection probabilities at different orientations.(C) Average number of connections in clusters of six cells grouped accordingto cluster dimension. (Insets) Histograms of the difference over expectedprofiles as in Fig. 2B for different cluster dimensions. (Green scale bars value:5.) Error bars represent SEM.
Perin et al. PNAS Early Edition | 3 of 6
NEU
ROSC
IENCE
across different assemblies (i.e., all assemblies, even in differentanimals, with the same number of connections tend to the samemean synaptic weight) (Fig. S5A).To test the significance of the tight correlation between syn-
aptic weights and numbers of connections, we shuffled the EPSPdata, assigning each connection a randomly selected value fromour pool of measured amplitudes and removing the value fromthe pool. For 100 repetitions of this procedure, we consistentlymeasured a significant difference between observed and shuffleddata (two-sample Kolmogorov–Smirnov, Bonferroni-correctedtest). Plots of average synaptic strengths for groups of six neuronswith different mean intersomatic distances showed a relationshipwith distance that was almost identical to that between distanceand connection probabilities (Fig. 6B). This suggests that the dis-tribution of synaptic weights can also be predicted from the numberof common neighbors. This finding is supported by the observationthat the distribution of synaptic weights shifts to the right withhigher numbers of common neighbors (Fig. S5B).
Interlaced Cell Assemblies. We used our model network with 2,000neurons to extrapolate beyond the experimental results and ex-plore the likely characteristics of separable cell assemblies inneural microcircuits. We first identified clusters using an affinitypropagation algorithm (62) in which affinity was defined by thenumber of common neighbors. The results showed that each in-stance of the model contained an average of 38.2 ± 1.9 clusters,with 53.1 ± 35.3 neurons per cluster; all clusters interlaced in thesame space. The mean connection probability for pairs of neurons
in the same cluster (Pin = 0.14 ± 0.02) was more than two timesthe probability for pairs belonging to different clusters (Pout =0.07 ± 0.005). Although these estimates are naturally sensitive toassumptions about neuron density, they were remarkably stableover a wide range of strictness values in the clustering algorithm.These results suggest that the average cluster contains a fewdozen neurons and that typical microcircuits contain a few dozensuch clusters (Fig. S6). To the upper limits for cluster strictness,the number of clusters increased, indicating that clusters containclusters within clusters. Some of these subclusters may corre-spond to the three-cell motifs reported in previous work and tothe three- and four-cell motifts reported here.We proceeded to explore the network topology of the cell
assemblies generated in our model network. The degree ofclustering was significantly higher than expected for a randomnetwork in which clustering depends only on distance (Fig. S7A).The average shortest path between neurons within clusters was1.80 ± 0.04 hops (1.9 ± 0.3 for the overall network). The dis-tribution of the number of connections per neuron (degree) wasbinomial-like, with a right skew, and it showed no resemblance tothe power-law distributions typical of scale-free networks thathave so far characterized virtually all biological and social net-works (Fig. S7 B and C) (63). The degree of separation is muchsmaller than, for example, protein interaction networks with 3°separation, social acquaintances within 6°, and Internet webpages with even higher degrees of separation. The network to-pology that we found is significantly different from the Erdös–Rényi random models and scale-free models, bearing a closerresemblance to the Watts–Strogatz model (64).
DiscussionThis study reports a form of synaptic clustering in neocorticalmicrocircuits, where cell assemblies are not arranged randomlyor in a lattice but as small world networks without hubs. Theseassemblies extend beyond the diameter of neocortical mini-columns, probably contain only a few dozen neurons, and are in-terlaced with other assemblies within the same space. We foundthat connection probability between any two neurons increaseslinearly with the number of their common neighbors, that themean synaptic weight depends on the number of connections ina group of neurons, and that this mean value increases to saturateafter only a small fraction of themaximal clustering is reached. Thegrouping of neurons into elementary cell assemblies across animalsis, therefore, governed by a powerful synaptic organizing principle.The finding that connection probability between neurons and
the mean synaptic weight within groups of neurons is predictableand tightly related to each other indicates that experiences cannotfreely mold network topology and synaptic weights. The pre-dictability of network topologies and synaptic weights is particu-larly surprising if we consider that our study was conducted withearly postnatal animals. In such young animals, one might haveexpected to find a configuration of neural circuitry closer to aclean slate on which any new configuration could be molded—a notion that has profoundly influenced philosophical and psy-chological theory since the 17th century (65).We speculate that this synaptic organizing principle is geneti-
cally prescribed and developmentally expressed, because it appliesacross different animals. However, STDP does mold synapticweights (47), and long-term microcircuit plasticity (LTMP) doesmold the connectivity between these pyramidal neurons (45, 66) inthis same preparation. The specific neurons involved in a groupmay, therefore, be selected by experience, but because of thepowerful connectivity constraints that we found, these forms ofplasticity is likely to add only minor variations to functioning ofneuronal groups.The synaptic clustering we found provides experimental evi-
dence for the primary repertoires proposed earlier by the theoryof neuronal group selection by Edelman (67). Unlike Hebb’s
Con
nect
ion
Pro
babi
lity
(- -
-)
Number of Common Neighbors to a Given Pair
C 0.4
0.3
0.2
0.1
0.0
43210
Experimental
Linear Fit (Experimental) Expected
A
B
Intersomatic Distance [μm]
Con
nect
ion
Pro
b. (-
- -)
0 - 50 50 - 100 100 - 150 150 - 200 200 - 250
**** No Common
Neighbor Common Neighbor
**
0.4
0.3
0.2
0.1
0.0
206458
346146
32292
710 518254 108
*
10-1100101102103104
Occ
urre
nces
543210Number of Common Neighbors to a Given Pair
***
**** Experimental
Expected
*
1003
410150
46 11
**
**
**
*
Fig. 4. Common neighbor effect. (A) Connection probability as a function ofdistance comparing pairs that share a common neighbor against those thatdo not. (B) Occurrences of pairs of neurons sharing more than one commonneighbor were significantly more numerous than expected by chance. (C)Connection probability between neurons as a function of the number ofcommon neighbors experimentally observed. Error bars represent SEM.
4 of 6 | www.pnas.org/cgi/doi/10.1073/pnas.1016051108 Perin et al.
proposal (1), this theory suggests that functional neural circuitryarises by selection among neuronal groups that already emergedduring embryonic development independent of experience. InEdelman’s theory, subsequent experience selects neuronal groupsto form secondary repertoires that have survival value (67, 68). In
Hebb’s view, experience carves out and reinforces chains of suchelementary assemblies to form phase sequences supporting spe-cific trains of thought (1). A key difference between Edelman’s(67, 68) theory and Hebb’s (1) proposals is reflected by Edelman’semphasis on selection, as apposed to instruction, of repertoires ofneuronal groups iteratively during perception in a process calledreentry (67, 68).The elementary assemblies that we found are interconnected
by fewer and weaker strands of connections than within assem-blies, which are more amenable to experience-dependent mod-ification (69). This suggests that experience could uniquely moldoverall neuronal circuitry by differently combining elementaryassemblies into unique superassemblies or secondary repertoires.The various possible combinations of elementary assemblies plusthe numerous ways that one assembly could be connected toanother (through different neurons, different weights betweeneach neuron, different synaptic dynamics, different directions, ordifferent degrees of reciprocity) may not only provide for vastcombinatorics and hence memory storage capacity, but also en-sure stability of memories in the face of ongoing activity.
Materials and MethodsElectrophysiological Recordings. Whole-cell recordings were made from py-ramidal neurons at 34 ± 1 °C in rat somatosensory cortex (λ-5, medio-lateral2) slices from animals at postnatal days 14 to 16. Neuronal connectivity wasestablished with trains of current pulses (5–15 pulses at 20–70 Hz).
Data Analysis. Data were analyzed using IGOR (WaveMetrics), MATLAB(MathWorks), and C++. The cortical layer 5 neuronmodels were assembledwith2,000 cells in a cube layout using MATLAB. Data are presented as mean ± SEM.
Computer-Assisted Patch Clamp. Recordings were achieved with custom C++software that controlled manipulators, amplifiers, oscilloscopes, pipettepressure, and video display.
Additional details are in SI Material and Methods.
ACKNOWLEDGMENTS. We thank Michele Pignatelli, Idan Segev, Sean Hill,and Felix Schürmann for discussions and comments. We especially thank thelate Philip Goodman for his comments and help on the statistical and clus-tering analyses. We thank Richard Walker for his editing help on this paper.R.P. and T.L.B. were supported by an EU Synapse grant. This study was alsocarried out as part of the Blue Brain Project and European Union’s FastAnalog Computing on Emergent Transient States (FACETS) program.
A
B
Ave
rage
EP
SP
am
plitu
de [m
V]
2.0
1.5
1.0
0.5
0.0
1614121086420
11221576
1645
16291504
1339 964 624 408 212 12867 29
4 4
7
0
mV
Number of Connections in Groups of 6 cells
ShuffledObserved
5
4
3
2
1
0
Ave
rage
Num
ber o
f Con
nect
ions
20015010050Average Intersomatic Distance in Clusters of 6 Cells
1.5
1.0
0.5
0.0
Average C
onnection Am
plitude [mV
]
Observed ConnectionsAverage Observed Connection Amplitude
Fig. 6. Synaptic strengths Amplitudes. (A) Average EPSP amplitude as afunction of number of connections in groups of six neurons (red) and resultsafter random shuffling of connection amplitudes (black). (Insets) Distri-butions of average connection amplitude for groups with different num-bers of connections. (B) Average number of connections in clusters of sixcells grouped according to cluster spatial spread (red) and correspondingaverage connection amplitude (blue). Error bars represent SEM.
Rec
ipro
cal
Intersomatic Distance [μm]
C0.3
0.2
0.1
0.03002001000
Non
Rec
ipro
cal
Intersomatic Distance [μm]
B0.3
0.2
0.1
0.03002001000
Intersomatic Distance [μm]
0.3
0.2
0.1
0.03002001000
Ove
rall
Pro
babi
lity
A
Nor
mal
ized
Diff
eren
ce
Connections in Clusters of 8 Cells
Nor
mal
ized
D
iffer
ence
Connections in Clusters of 6 Cells
Nor
mal
ized
Diff
eren
ce
Connections in Clusters of 3 Cells0 1 2 3 4 5 6
0 2 4 6 8 10 12 14
201612
840
0 4 8 12 16 20
Freq
uenc
y
Connections in Clusters of 8 Cells
Freq
uenc
y
Connections in Clusters of 6 Cells
Freq
uenc
y
Connections in Clusters of 3 Cells
E F
10-5
10-4
10-3
10-2
10-1
100
20151050
1412108642010-5
10-4
10-3
10-2
10-1
100
654321010-5
10-4
10-3
10-2
10-1
100
16
201612
840
201612
840
D
100 μm
Fig. 5. Simulationofclusteredcon-nectivity. (A–C) Connection proba-bilities in reorganized network thatreflect the function of distance asfound in the experimental data. (D)Three clusters (red, green, and blue)identifiedwith affinity propagationin a network of 2,028 neurons. (Eand F) Properties of simulated net-works that reflect experimentalmeasurements shown in Fig. 2whencomparing the initial network(black) and its reorganized version(red). Error bars represent SEM.
Perin et al. PNAS Early Edition | 5 of 6
NEU
ROSC
IENCE
1. Hebb DO (1949) The Organization of Behavior—A Neuropsychological Theory (Wiley,New York).
2. Milner PM (1957) The cell assembly: Mark II. Psychol Rev 64:242–252.3. Sejnowski TJ (1999) The book of Hebb. Neuron 24:773–776.4. Fuster JM, Alexander GE (1971) Neuron activity related to short-termmemory. Science
173:652–654.5. Morris RG (1999) D.O. Hebb: The organization of behavior, Wiley: New York; 1949.
Brain Res Bull 50:437–438.6. Sejnowski TJ (2003) The once and future Hebb synapse. Can Psychol 44:17–20.7. Kandel ER (2006) In Search of Memory: The Emergence of a New Science of Mind
(W. W. Norton & Company, New York), 1st Ed.8. Dudai Y (1989) The Neurobiology of Memory: Concept, Findings, Trends (Oxford
University Press, London).9. Abeles M (1991) Corticonics: Neural Circuits of the Cerebral Cortex (Cambridge
University Press, Cambridge, UK).10. Byrne JH, Menzel R, Roediger HL (2008) Learning and Memory: A Comprehensive
Reference (Elsevier, Amsterdam), 1st Ed.11. Sejnowski TJ (1977) Statistical constraints on synaptic plasticity. J Theor Biol 69:
385–389.12. Rochester N, Holland J, Haibt L, Duda W (1956) Tests on a Cell Assembly Theory of the
Action of the Brain, Using a Large Digital Computer (IRE Transactions on InformationTheory), 80–93.
13. Rosenblatt F (1962) Principles of Neurodynamics; Perceptions and the Theory of BrainMechanisms (Spartan Books, Washington, DC).
14. Miller KD, Mackay DJC (1994) The role of constraints in Hebbian learning. NeuralComput 6:100–126.
15. Dayan P, Abbott LF (2001) Theoretical Neuroscience: Computational and Mathe-matical Modeling of Neural Systems (MIT Press, Cambridge, MA).
16. Stent GS (1973) A physiological mechanism for Hebb’s postulate of learning. Proc NatlAcad Sci USA 70:997–1001.
17. Bienenstock EL, Cooper LN, Munro PW (1982) Theory for the development of neuronselectivity: Orientation specificity and binocular interaction in visual cortex. J Neurosci2:32–48.
18. McNaughton BL, Morris RGM (1987) Hippocampal synaptic enhancement andinformation storage within a disMbuted memory system. Trends Neurosci 10:408–415.
19. Hopfield JJ (1982) Neural networks and physical systems with emergent collectivecomputational abilities. Proc Natl Acad Sci USA 79:2554–2558.
20. Amit DJ, Gutfreund H, Sompolinsky H (1987) Information storage in neural networkswith low levels of activity. Phys Rev A 35:2293–2303.
21. Barnes CA, et al. (1994) LTP saturation and spatial learning disruption: Effects of taskvariables and saturation levels. J Neurosci 14:5793–5806.
22. McNaughton N, Wickens J (2003) Hebb, pandemonium and catastrophic hypermnesia:The hippocampus as a suppressor of inappropriate associations. Cortex 39:1139–1163.
23. Sejnowski TJ (1977) Storing covariance with nonlinearly interacting neurons. J MathBiol 4:303–321.
24. Lynch GS, Dunwiddie T, Gribkoff V (1977) Heterosynaptic depression: A postsynapticcorrelate of long-term potentiation. Nature 266:737–739.
25. Abbott LF, Nelson SB (2000) Synaptic plasticity: Taming the beast. Nat Neurosci 3(Suppl):1178–1183.
26. Thomson AM, West DC, Wang Y, Bannister AP (2002) Synaptic connections and smallcircuits involving excitatory and inhibitory neurons in layers 2-5 of adult rat and catneocortex: Triple intracellular recordings and biocytin labelling in vitro. Cereb Cortex12:936–953.
27. Thomson AM, Morris OT (2002) Selectivity in the inter-laminar connections made byneocortical neurones. J Neurocytol 31:239–246.
28. Thomson AM, Bannister AP, Mercer A, Morris OT (2002) Target and temporal patternselection at neocortical synapses. Philos Trans R Soc Lond B Biol Sci 357:1781–1791.
29. Watts J, Thomson AM (2005) Excitatory and inhibitory connections show selectivity inthe neocortex. J Physiol 562:89–97.
30. West DC, Mercer A, Kirchhecker S, Morris OT, Thomson AM (2006) Layer 6 cortico-thalamic pyramidal cells preferentially innervate interneurons and generatefacilitating EPSPs. Cereb Cortex 16:200–211.
31. Yoshimura Y, Dantzker JL, Callaway EM (2005) Excitatory cortical neurons form fine-scale functional networks. Nature 433:868–873.
32. Kampa BM, Letzkus JJ, Stuart GJ (2006) Cortical feed-forward networks for bindingdifferent streams of sensory information. Nat Neurosci 9:1472–1473.
33. Le Be JV, Silberberg G, Wang Y, Markram H (2007) Morphological, electrophysiological,and synaptic properties of corticocallosal pyramidal cells in the neonatal rat neocortex.Cereb Cortex 17:2204–2213.
34. Brown SP, Hestrin S (2009) Intracortical circuits of pyramidal neurons reflect theirlong-range axonal targets. Nature 457:1133–1136.
35. Callaway EM, Katz LC (1993) Photostimulation using caged glutamate revealsfunctional circuitry in living brain slices. Proc Natl Acad Sci USA 90:7661–7665.
36. Luo L, Callaway EM, Svoboda K (2008) Genetic dissection of neural circuits. Neuron 57:634–660.
37. Chedotal A, Richards LJ (2010) Wiring the brain: The biology of neuronal guidance.Cold Spring Harb Perspect Biol 2:a001917.
38. Stepanyants A, Tamas G, Chklovskii DB (2004) Class-specific features of neuronalwiring. Neuron 43:251–259.
39. Markram H (1997) A network of tufted layer 5 pyramidal neurons. Cereb Cortex 7:523–533.
40. Song S, Sjostrom PJ, Reigl M, Nelson S, Chklovskii DB (2005) Highly nonrandomfeatures of synaptic connectivity in local cortical circuits. PLoS Biol 3:e68.
41. Kalisman N, Silberberg G, Markram H (2005) The neocortical microcircuit as a tabularasa. Proc Natl Acad Sci USA 102:880–885.
42. Stepanyants A, Chklovskii DB (2005) Neurogeometry and potential synapticconnectivity. Trends Neurosci 28:387–394.
43. Chklovskii DB, Mel BW, Svoboda K (2004) Cortical rewiring and information storage.Nature 431:782–788.
44. Chklovskii DB (2004) Synaptic connectivity and neuronal morphology: Two sides ofthe same coin. Neuron 43:609–617.
45. Le Be JV, Markram H (2006) Spontaneous and evoked synaptic rewiring in theneonatal neocortex. Proc Natl Acad Sci USA 103:13214–13219.
46. Markram H, Tsodyks M (1996) Redistribution of synaptic efficacy between neocorticalpyramidal neurons. Nature 382:807–810.
47. Markram H, Lübke J, Frotscher M, Sakmann B (1997) Regulation of synaptic efficacyby coincidence of postsynaptic APs and EPSPs. Science 275:213–215.
48. Gerstner W, Kempter R, van Hemmen JL, Wagner H (1996) A neuronal learning rulefor sub-millisecond temporal coding. Nature 383:76–81.
49. Blum KI, Abbott LF (1996) A model of spatial map formation in the hippocampus ofthe rat. Neural Comput 8:85–93.
50. Caporale N, Dan Y (2008) Spike timing-dependent plasticity: A Hebbian learning rule.Annu Rev Neurosci 31:25–46.
51. Rao RP, Sejnowski TJ (2001) Spike-timing-dependent Hebbian plasticity as temporaldifference learning. Neural Comput 13:2221–2237.
52. Song S, Miller KD, Abbott LF (2000) Competitive Hebbian learning through spike-timing-dependent synaptic plasticity. Nat Neurosci 3:919–926.
53. Stuart GJ, Sakmann B (1994) Active propagation of somatic action potentials intoneocortical pyramidal cell dendrites. Nature 367:69–72.
54. Markram H, Lübke J, Frotscher M, Roth A, Sakmann B (1997) Physiology and anatomyof synaptic connections between thick tufted pyramidal neurones in the developingrat neocortex. J Physiol 500:409–440.
55. Frick A, Feldmeyer D, Sakmann B (2007) Postnatal development of synaptictransmission in local networks of L5A pyramidal neurons in rat somatosensory cortex.J Physiol 585:103–116.
56. Krieger P, Kuner T, Sakmann B (2007) Synaptic connections between layer 5Bpyramidal neurons in mouse somatosensory cortex are independent of apicaldendrite bundling. J Neurosci 27:11473–11482.
57. Deuchars J, West DC, Thomson AM (1994) Relationships between morphology andphysiology of pyramid-pyramid single axon connections in rat neocortex in vitro.J Physiol 478:423–435.
58. Thomson AM, Deuchars J, West DC (1993) Large, deep layer pyramid-pyramid singleaxon EPSPs in slices of rat motor cortex display paired pulse and frequency-dependentdepression, mediated presynaptically and self-facilitation, mediated postsynaptically.J Neurophysiol 70:2354–2369.
59. Barabasi AL, Albert R (1999) Emergence of scaling in random networks. Science 286:509–512.
60. Bullmore E, Sporns O (2009) Complex brain networks: Graph theoretical analysis ofstructural and functional systems. Nat Rev Neurosci 10:186–198.
61. Jin EM, Girvan M, Newman ME (2001) Structure of growing social networks. Phys RevE Stat Nonlin Soft Matter Phys, 64:046132, 10.1103/PhysRevE.64.046132.
62. Frey BJ, Dueck D (2007) Clustering by passing messages between data points. Science315:972–976.
63. Barabasi AL (2009) Scale-free networks: A decade and beyond. Science 325:412–413.64. Watts DJ, Strogatz SH (1998) Collective dynamics of ‘small-world’ networks. Nature
393:440–442.65. Locke J. (1689) An Essay Concerning Human Understanding (William Tegg, London),
38th Ed.66. Silva GT, Le Bé J-V, Riachi I, Rinaldi T, Markram K, Markram H (2009) Enhanced long-
term microcircuit plasticity in the valproic acid animal model of autism. Front SynaNeurosci, 10.3389/neuro.19.001.2009.
67. Edelman GM (1987) Neural Darwinism: The Theory of Neuronal Group Selection (BasicBooks, New York).
68. Edelman GM (1993) Neural Darwinism: selection and reentrant signaling in higherbrain function. Neuron 10:115–125.
69. van Rossum MC, Bi GQ, Turrigiano GG (2000) Stable Hebbian learning from spiketiming-dependent plasticity. J Neurosci 20:8812–8821.
6 of 6 | www.pnas.org/cgi/doi/10.1073/pnas.1016051108 Perin et al.