Embed Size (px)
Citation preview
A-TYPICAL WORK PATTERNS OF WOMEN IN EUROPE: WHAT CAN WE LEARN FROM
SHARELIFE?
Antigone Lyberaki, Platon Tinios, George Papadoudis
221-2010

12 A-Typical Work Patterns of Women in Europe: What can we Learn From SHARELIFE?
Antigone Lyberaki, Platon Tinios and George Papadoudis
12.1 Introduction
The second half of the twentieth century was a time of rapid social transformation. Nowhere were the changes more radical than in women’s participation in society and work. Women increasingly claimed a fuller and more active position in all so-cietal functions. Though all parts of Europe and all social strata were affected, this process was unevenly distributed over time and space and driven by a variety of influences. Such influences could have been structural changes in production, transformations in the function of the family and last, but not least, attitudes in what woman’s position ought to be, as reflected in shifts of policy priorities. This period of rapid change corresponds to the lifetime of individuals in the SHARE survey. When today’s 50+ population were young girls, the world they were enter-ing was very different from today. The long term social changes correspond to lived experience of women in the SHARE sample. The women in SHARE were witnesses to the foundation, flowering and restructuring of the Welfare State. So-cial policy stances towards maternity and family policy as well as labour market institutions were defining fissures between certain forms of the so-called “Euro-pean Social Model”. This paper begins exploring how these factors – labour and social policy transformation – were reflected in the lives of women in the SHARELIFE sample.
For purposes of clarity of exposition, this paper utilizes the device of examin-ing groups whose characteristics place them in a minority in their own country, yet which are very similar to majorities in other countries in the SHARE sample. Thus family-centred women who have never worked are the exception in Scandinavia, yet are strongly represented in the South. Conversely career women in the South are uncommon, yet are the majority in the North.
These types of comparisons are useful for fixing ideas and for representational purposes. They can also be held to pose complex questions with clarity (approxi-mating in logic a controlled experiment): Given that the kind of obstacles to em-ployment which are held responsible for low labour participation in the South (child care facilities, income support) were patently available in the North, yet the minority chose traditional roles, what were the factors still placing obstacles to their participation? Was it limited availability of service infrastructure, a question of values, ill health or due to the vestiges of sex discrimination and insufficiency

2
of financial incentives? Conversely, given that the shortcomings of social services are deemed sufficient to explain persistence of traditional roles for the majority in the South, how did career women cope with the pressures of balancing work and family? Did they have fewer children, did they have access to child care from family resources, or were they forced to work by financial pressure? How did women’s own (socially conditioned) preferences affect their choices? Once we try to control for other factors, did social policy lead or follow developments?
12.2 Identifying the groups: dominant and atypical patterns
Patterns of female paid work vary hugely in Europe, as do work-care models. Evolving ‘models of family’ (i.e. the shift away from the male breadwinner model in the direction of dual-earner families – Jane Lewis, 2001) and ‘preferences’ (home-, work-centred or adaptives – K. Hakim, 2000, 2004) have been ways of analyzing complex trends. At the same time, economists have noticed the exis-tence of two ideal-types which can be rationalized as the result of two equilibria in Europe regarding women’s work patterns: a high labour force participation, good social infrastructure and high fertility rates equilibrium characterizing Northern countries, and a low participation, low fertility and missing social infrastructure equilibrium characterizing Southern economies (Boeri, 2003; Boeri et al, 2005; Villa & Bettio, 1998). This brings the welfare state into the discussion as an im-portant influence. Esping-Andersen’s welfare state typology (Esping-Andersen, 1990, expanded by Ferrera, 1996) leads one to expect patterns of female paid work to observe the boundaries of the ‘Worlds of Welfare Capitalism’. The exact typology of Esping-Andersen has been questioned in the context of gender - Lewis, Campbell & Huerta, 2008. However, this criticism does not affect the geo-graphical dividing lines which largely remain. The effect of the welfare state can be brought to bear in the explanation of inter-country and individual differences, or might point at specific areas of intervention. As Daly (2002) states in reviewing the current state of knowledge, evidence on a direct link between policies and par-ticular female labour profiles is still inconclusive. SHARELIFE, by providing data on the entire life of respondents (rather than synchronic information) allows us to introduce a time and cohort dimension. We can thus see not only whether patterns exist, but how they spread through time.
In defining female work patterns a number of ideal-types stand out; these are usually associated with the country groups in which they are prevalent. Hakim’s (2000) work predisposes to find women distributed in clusters around these behav-iour norms. Our first concern is to identify whether such groups exist. In doing so, the simple expedient of comparing years worked introduces bias, as older respon-dents will include years of work after 50 and will systematically exhibit longer ca-reers than 50-year olds who are still working. To allow for this, the key variable to be analysed is years of work of each respondent until the age of 50 – regardless of

3
age. Figure 12.1 shows the distributions of this variable for the four geographical groups which roughly correspond to distinct types of welfare state: The North, Centre, South and East.
Figure 12.2: Distribution of career length to age 50, by country group
0%
2%
4%
6%
8%
10%
12%
14%
16%
18%
0 2 4 6 8 10 12 14 16 18 20 22 24 26 28 30 32 34 36 38
Nordics East Europe Central Europe Southern
Simple visual inspection shows the existence of two polar types. The ‘Full career woman’ (FCW) or work-centred woman. In Figure 12.1 we see concentrations of women with around 30 years of work or more, which with an entry age of 20 es-sentially implies uninterrupted stay in employment (for those women with tertiary education, a full career necessarily starts later, so the FCW category is defined to include those with more than 26 years work) . At the other extreme, a large group of women never worked at all - the ‘full-time carer’ or ‘family-centred’ woman – full family woman (FFW) with no links to the labour market. Hakim’s category of the ‘adaptive’ woman falls in between (supplemental earner, main carer, in and out of work). This category can be further divided according to work-intensity (i.e. share of working years in total). For the purposes of exposition the continuum is divided into two groups: between 20 and 29 years ‘Adaptive Career Woman’ (ACW) and, between 1 and 19 years of work ‘Adaptive Family Woman’ (AFW). What distinguishes the one from the other is the different degree of continuity of employment characterizing the two groups. The picture of figure 12.2 largely con-firms Hakim’s expectation and leads to the following classification by country.
Figure 12.2: Women's career pattern by country

4
0%
20%
40%
60%
80%
100%
SE DK PL CZ DE-W DE-E NL BE FR CH AT IT ES GR Total
FFW AFW ACW FCW
Figure 12.2 examines the groups by country. Never worked group: The Southern countries are the champions (over 30%, on average, with Greece reaching almost 45%), while only a small minority (below 6%) in 5 countries (Denmark, Sweden –the Nordics-, Czech Republic, Germany and Switzerland), followed by France, Austria and Poland (around 10%). By contrast, the longest careers are recorded in the Nordics (Sweden and Denmark), the Czech Republic (and also former GDR), with over 60% of women working longer than 31 years. Long careers are also the rule in Central countries (ranging from 40% to 50%) – in Austria, Germany, France, Poland and Switzerland and Belgium at the limit. The group of adaptives is also largest in the North, signifying the possibility of leaving and then being able to return to work. The Mediterranean countries and the Netherlands, on the other hand, have moderate share of working women in long careers, and few adap-tives.
How does this picture change by cohort? If we examine the career length by country group we can observe that in all cases there is an actual decrease of the never-worked FFW group. As time passes we generally see a decrease in polariza-tion in favour of the adaptive group – with more than 19 years employment (ACW). We also see a reduction of very long careers (35+), connected presumably with later entry into the labour market as a result of the raising of the school-leaving age. Examining the distributions, we may retain three crucial observations:
• The critical decision – taken early on - is whether to enter the labour market.
• Those entering the labour market appear in many countries most likely to continue on for a full career.
• The intermediate group – those exiting and re-entering the labour market – are in a minority, though their prevalence is higher in younger cohorts.

5
Hence it is important to take a closer look at career interruption patterns.
12.3 Career interruptions of women with some work experience and children
The crucial factor in women’s working lives is childbearing. Here we focus only on mothers who had been working when they gave birth, i.e. x% of women with some work experience. We first show whether the arrival of a child affects work-ing patterns (Table 12.1). The rule is to stop work temporarily (more than half of working women), although the share of permanent drop outs is substantial, espe-cially in continental Europe. It is twice as high as in the Southern countries, and could be explained by the fact that in Mediterranean women, once they enter the labour market, appear to be more resilient compared to Continental women; career interruptions due to children do not translate into quitting work altogether. Over-all, one in four women had no interruption whatsoever after the arrival of their (last) child.
Table 12.1: Career interruptions due to children
Country
Never worked
again (%)
Stopped
working
temporarily
(%)
No
interruption
(%)
Women who
worked at the
time of 1st
childbirth (N)
SE 7.5 86.1 6.3 791
DK 14.5 69.9 15.7 825
PL 5.7 59.1 35.2 722
CZ 0.4 94.4 5.3 990
DE-E 2.1 73.0 25.0 215
DE-W 29.5 47.0 23.4 603
NL 31.1 54.4 14.5 678
BE 18.3 34.3 47.3 889
FR 17.6 43.9 38.5 851
CH 17.7 54.5 27.8 451
AT 24.2 55.8 19.9 435
IT 17.9 43.9 38.2 519
ES 13.3 46.3 40.4 292
GR 6.0 69.8 24.2 534
Total 16.9 54.4 28.8 8.795
6
The lowest rate of dropouts from work due to the birth of child are experienced in the Eastern European countries, ex-GDR, Sweden and, somehow surprisingly, Greece (probably due to dropping out at an earlier stage –e.g. at marriage). The highest dropout rates (over 20%) are recorded in Austria, Germany and the Neth-erlands, while a cluster including both continental (Belgium, France) and Southern countries (Spain, Italy) had the highest shares of women that did not interrupt their career at all when they had their children.
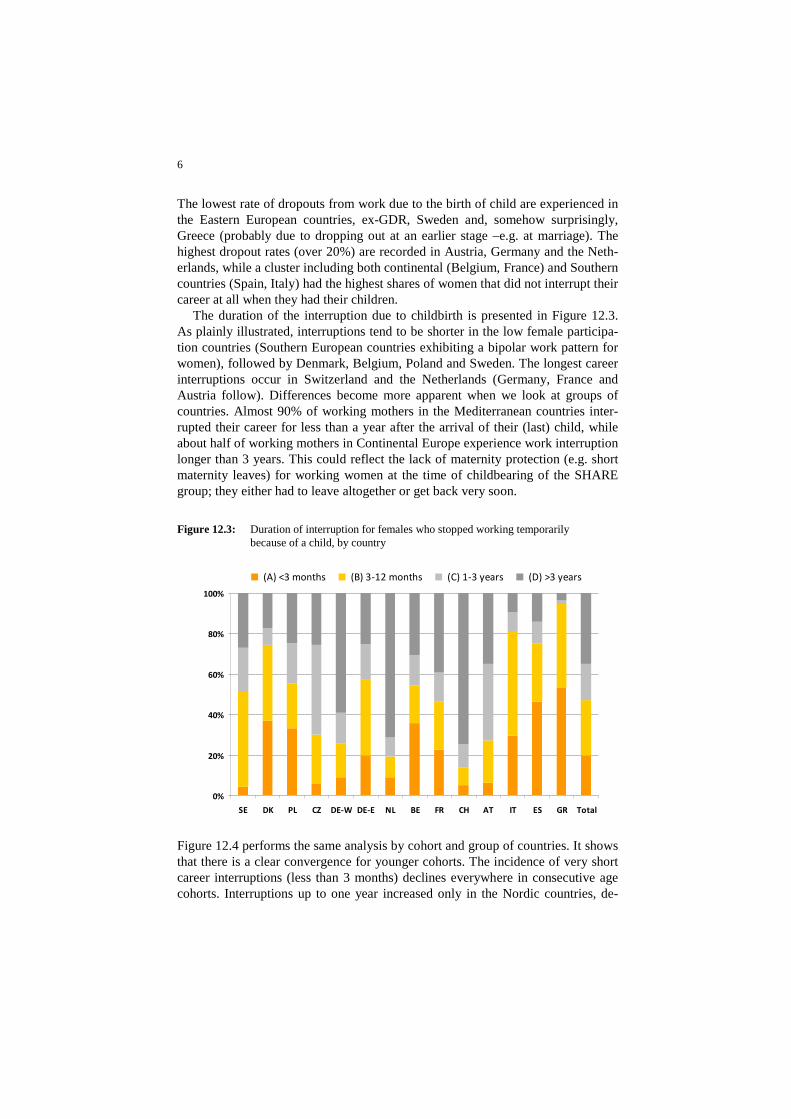
The duration of the interruption due to childbirth is presented in Figure 12.3. As plainly illustrated, interruptions tend to be shorter in the low female participa-tion countries (Southern European countries exhibiting a bipolar work pattern for women), followed by Denmark, Belgium, Poland and Sweden. The longest career interruptions occur in Switzerland and the Netherlands (Germany, France and Austria follow). Differences become more apparent when we look at groups of countries. Almost 90% of working mothers in the Mediterranean countries inter-rupted their career for less than a year after the arrival of their (last) child, while about half of working mothers in Continental Europe experience work interruption longer than 3 years. This could reflect the lack of maternity protection (e.g. short maternity leaves) for working women at the time of childbearing of the SHARE group; they either had to leave altogether or get back very soon.
Figure 12.3: Duration of interruption for females who stopped working temporarily because of a child, by country
0%
20%
40%
60%
80%
100%
SE DK PL CZ DE-W DE-E NL BE FR CH AT IT ES GR Total
(A) <3 months (B) 3-12 months (C) 1-3 years (D) >3 years
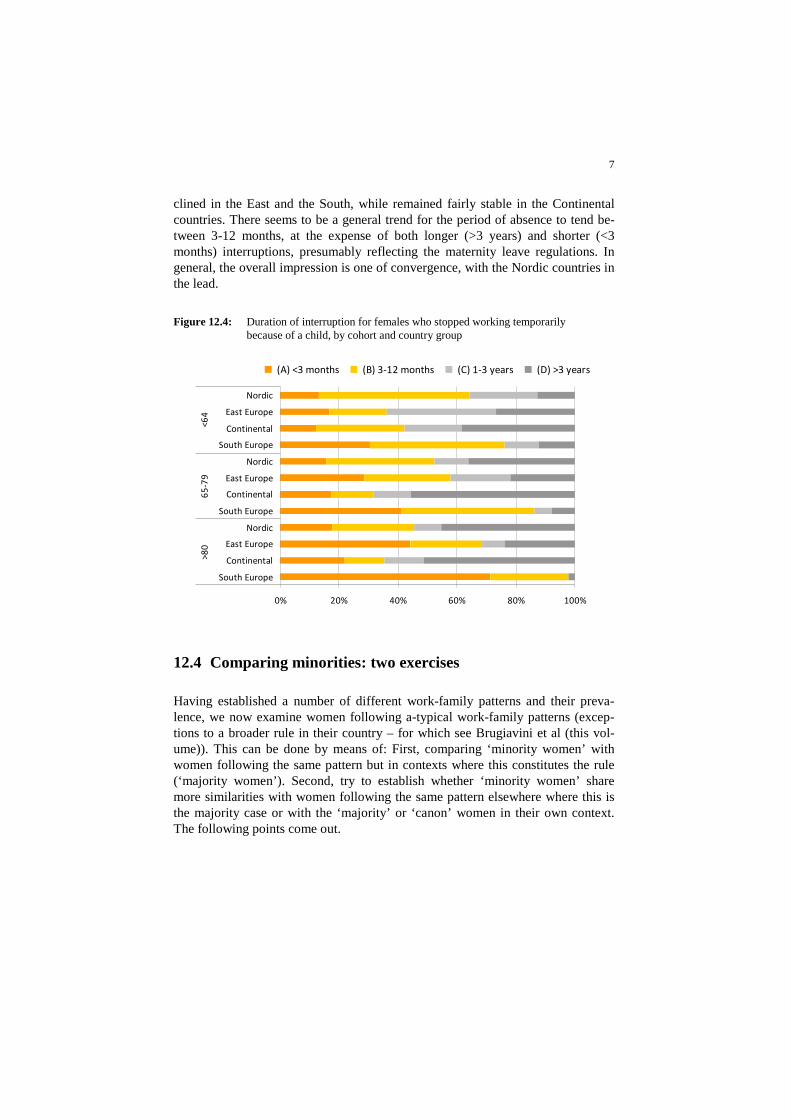
Figure 12.4 performs the same analysis by cohort and group of countries. It shows that there is a clear convergence for younger cohorts. The incidence of very short career interruptions (less than 3 months) declines everywhere in consecutive age cohorts. Interruptions up to one year increased only in the Nordic countries, de-
7
clined in the East and the South, while remained fairly stable in the Continental countries. There seems to be a general trend for the period of absence to tend be-tween 3-12 months, at the expense of both longer (>3 years) and shorter (<3 months) interruptions, presumably reflecting the maternity leave regulations. In general, the overall impression is one of convergence, with the Nordic countries in the lead.
Figure 12.4: Duration of interruption for females who stopped working temporarily because of a child, by cohort and country group
0% 20% 40% 60% 80% 100%
South Europe
Continental
East Europe
Nordic
South Europe
Continental
East Europe
Nordic
South Europe
Continental
East Europe
Nordic
>8
06
5-7
9<
64
(A) <3 months (B) 3-12 months (C) 1-3 years (D) >3 years
12.4 Comparing minorities: two exercises
Having established a number of different work-family patterns and their preva-lence, we now examine women following a-typical work-family patterns (excep-tions to a broader rule in their country – for which see Brugiavini et al (this vol-ume)). This can be done by means of: First, comparing ‘minority women’ with women following the same pattern but in contexts where this constitutes the rule (‘majority women’). Second, try to establish whether ‘minority women’ share more similarities with women following the same pattern elsewhere where this is the majority case or with the ‘majority’ or ‘canon’ women in their own context. The following points come out.

8
Exercise 1: The Full-Family-Model Women
• Full family (never worked) women tend to have more children than all other women, but the difference is larger when Full Family pattern is an exception.
• Where Full Family is the exception, the number of marriages is slightly higher, but when it is the rule it doesn’t have any influence on the num-ber of marriages.
• Full family women belong to poorer households, while their education is lower.
• Full family women are more likely to live in owned accommodation. • Initial conditions matter in a variety of ways. Having experienced poverty
as a child (few or no books at home) is more common for full-family women when they are the rule and considerably less when they are an exception (more opportunities and room for choice when more women work in a society?).
Exercise 2: The Full-Career-Model Women
• Women who have less than a full career are the same everywhere (re-gardless of context) in the sense that they have more children.
• Full career women tend to follow the general rule in their country, but have fewer numbers of marriages compared to the rest.
• Full career women tend to be more educated, but only when they are in the minority.
• Full career women tend to be richer, and this effect is stronger where they make up the majority trend (rule). Nevertheless, they have lower home-ownership rates.
• Where full career women are the rule, they have better self-perceived health scores, higher job and career satisfaction, fewer disappointments and fewer sacrifices for their job.
12.5 Explaining the patterns: Does social policy and employment protection matter?
The ‘naked eye’ analysis so far has uncovered sea-changes in the patterns of fe-male employment that have taken place in Europe over the life-span of the SHARE sample. To start uncovering relationships and the role of the policies, a multidimensional analysis must be the next step. The patterns we have seen, espe-cially, among the older individuals signal that the crucial decision is taken early on in the life of women: whether to enter the labour market or not. Once having en-

9
tered, most continue to a full career, though some drop off. To capture this pattern, our preliminary investigation employs a two stage analysis:
Firstly, the participation decision is modelled for the ever-entered group of women (i.e. those who have worked). Given that this is a decision adopted in their 20s, care is taken to include only those variables that would have been known at that time.
Secondly, the decision of how long to work is considered, conditional on hav-ing entered the labour force. The dependent variable is years of work to aged 50, in order to avoid bias as between women with completed working lives and those still working.
The structure of decisions is essentially recursive, where the participation and career length decisions are separated in time. Nevertheless, the fact that the group of women remaining in the labour market is essentially self-selected, creates a bias, implying that a simultaneous treatment of the two decisions is necessitated. Thus, a two stage Heckman type model is estimated (e.g. Maddala 1983), there being evidence of selection bias. Interestingly for the hypothesis that social policy matters, the selection bias evidence is much stronger once country groups are al-lowed.
In the participation decision, the effect we are trying to capture is the ease of entry in the labour market at the time when our sample was in their 20s. Thus the unemployment rate and the growth rate enter as proxies of labour market opportu-nities. The OECD Employment protection index is the earliest available – that of the mid-80s. Given that employment protection in Europe before that time was mostly greater than that, its value at the 80s can be taken as the minimum value for the appropriate decade. High employment protection can be expected to make labour force entry more difficult. The childhood relative well-being index is that of Lyberaki, Tinios and Georgiadis described in chapter 2 of this volume, and is a composite of the available indicators weighted according to their prevalence.
Table 12.2a: Determinants of Participation decision in a simultaneous Heckman sample selection model (selected effects)
Dependent variable = Ever worked
(i.e. >0 years of work)
Marginal
effect
Standard
error
Demographics
Constant 4.8098** 0.2059
Mother when 22 0.0654* 0.0331
Orphan -0.5148** 0.9597
Family size when child -0.0749** 0.0127
Initial conditions
Childhood relative well-being index: for each
country ranges from 0 to1
(complete to no deprivation) -1.4989** 0.1823

10
Occupation of breadwinner when 10:
Legislator, senior official, manager, clerk -0.1532** 0.0551
Occupation of breadwinner when 10:
Elementary agricultural or fishery worker -0.2251* 0.0632
Number of books when 10 (>10) 0.3964** 0.0393
Period of financial hardship up to 20 -0.4453** 0.0927
Primary education or lower F
Context variables when 20 (averages by cohort)
GDP real Growth rate -1.3271 1.9794
Unemployment rate -0.0105 0.0050
EPI index -0.5434** 0.0308
Transition country(CZ; PL; GDR) 0.1097* 0.0715
Effects not reported: Age 65-80 and 80+ strongly negative; education strongly
positive; foreign born, poor health when child– insignificant.
**,*: Significant at 1%, 5% respectively.
Source: SHARE Wave 1, Wave 2 release 2.3.0; Wave 3, release 0
Table 12.2a shows a strong cohort effect, a positive effect of being an orphan, as of a large family size at childhood. The ‘mother at 22’ variable (following Goldin, 2006: 14) has a positive effect, though that should be evaluated with a large nega-tive effect of the related ‘mother at first job’ variable in the length of career equa-tion. Interestingly, if country group dummies are introduced, it becomes negative, indicating the presence of an effect differentiated by country group (by a national difference not captured by the current specification). Relative childhood well-being has a negative effect, signifying that participation in many cases may have been dictated by strained circumstances. This interpretation is strengthened by the negative effect of elementary occupation. For some women starting to work was an imposed necessity, for others an active choice.
Turning to context variables, an interesting pattern emerges: High national av-erage unemployment in their 20’s is associated with smaller entrance. High em-ployment protection for those at work translates very strongly for problems to en-ter. Finally, though insignificant, high real GDP growth is associated with smaller entry probability. Adding country group dummies to this specification can be in-terpreted as allowing for the influence of social protection and labour protection ‘styles’. This addition has the effect of almost eradicating the influence of house-hold size, ‘mother at 22’ and financial hardship. It also changes the sign on unem-ployment, reduces the influence of employment protection and makes the effect of growth large. These effects can be taken as evidence that those variables may have opposing influence in different policy settings; once the overall effect of country groups is allowed for, the within-group variation is able to exhibit itself. The weakening of public policy variables once the influence of large country group-ings is allowed for can be taken as evidence that most of the public policy effect comes between country group variation.
11
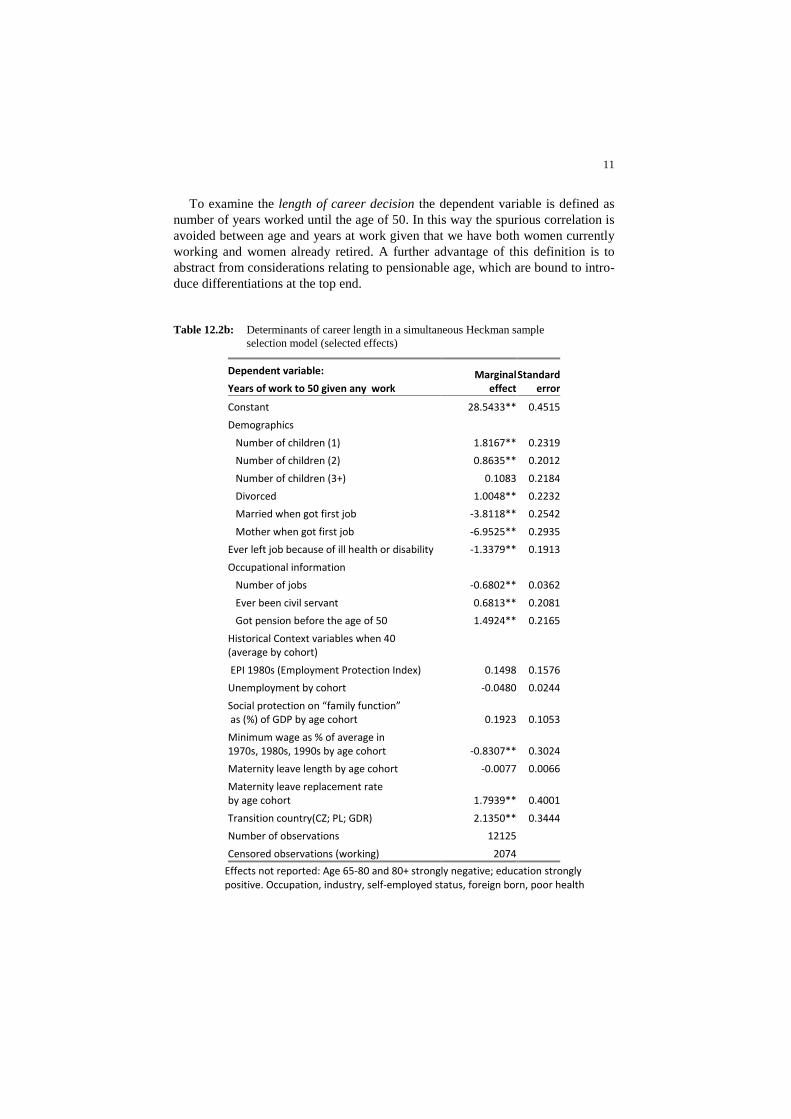
To examine the length of career decision the dependent variable is defined as number of years worked until the age of 50. In this way the spurious correlation is avoided between age and years at work given that we have both women currently working and women already retired. A further advantage of this definition is to abstract from considerations relating to pensionable age, which are bound to intro-duce differentiations at the top end.
Table 12.2b: Determinants of career length in a simultaneous Heckman sample selection model (selected effects)
Dependent variable:
Years of work to 50 given any work
Marginal
effect
Standard
error
Constant 28.5433** 0.4515
Demographics
Number of children (1) 1.8167** 0.2319
Number of children (2) 0.8635** 0.2012
Number of children (3+) 0.1083 0.2184
Divorced 1.0048** 0.2232
Married when got first job -3.8118** 0.2542
Mother when got first job -6.9525** 0.2935
Ever left job because of ill health or disability -1.3379** 0.1913
Occupational information
Number of jobs -0.6802** 0.0362
Ever been civil servant 0.6813** 0.2081
Got pension before the age of 50 1.4924** 0.2165
Historical Context variables when 40
(average by cohort)
EPI 1980s (Employment Protection Index) 0.1498 0.1576
Unemployment by cohort -0.0480 0.0244
Social protection on “family function”
as (%) of GDP by age cohort 0.1923 0.1053
Minimum wage as % of average in
1970s, 1980s, 1990s by age cohort -0.8307** 0.3024
Maternity leave length by age cohort -0.0077 0.0066
Maternity leave replacement rate
by age cohort 1.7939** 0.4001
Transition country(CZ; PL; GDR) 2.1350** 0.3444
Number of observations 12125
Censored observations (working) 2074
Effects not reported: Age 65-80 and 80+ strongly negative; education strongly
positive. Occupation, industry, self-employed status, foreign born, poor health

12
when child– insignificant.
Source: SHARE Wave 1, Wave 2 release 2.3.0; Wave 3, release 0
The continuous decision on career length appears in Table 12.2b. Children and Marriage: Being married and being a mother at the time of labour force entry are both very important, subtracting 11 years from the predicted value. This confirms Goldin’s 2006 observation for the US that being in the labour force before mar-riage and childbearing cements a permanently strong labour force attachment. The magnitude of the other children variables should be seen in this light: Beyond the first child, the marginal impact of an additional child is negative and increasing. Education and health: Given the cut-off at 50 the negative effect of education is due to later entry. Poor health is important mainly if the problem was sufficiently serious to necessitate leaving a job – reentry presumably is then harder. Occupa-tion: The frequency of changing jobs leads to a lower expected length (reentry problems). Later entry presumably accounts for shorter careers in public admini-stration (corrected by a positive sign for being a civil servant). Owning a business has an effect on length of career, as is being eligible for a pension before 50.
Context variables: A high minimum wage relative to the average leads to re-ductions in careers, as returns to the labour market after an interval of absence are more difficult. Social protection expenditure on family policies and the replace-ment rate of maternity allowance have an influence. Unemployment has a negative effect (as it did in participation), implying that high unemployment prevented la-bour entry and reduced careers. The EPI index appears only to affect participation and to have no effect on career length.
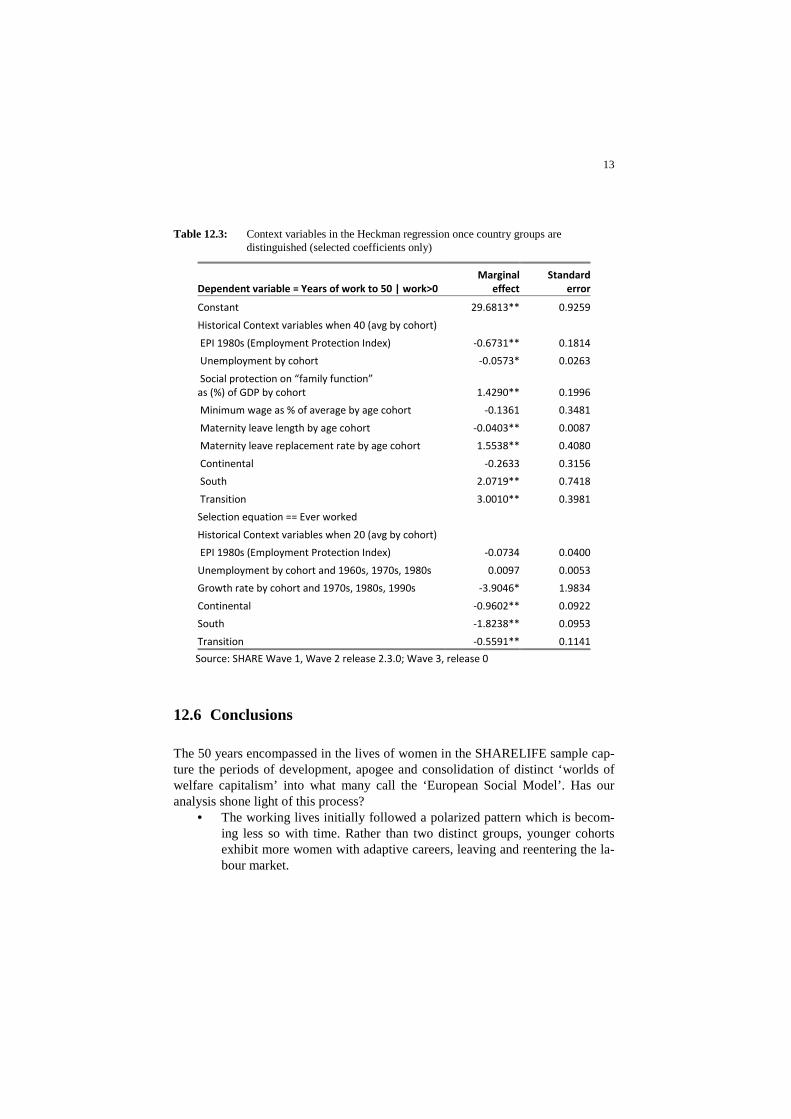
However, once the same specification is run with country group dummies, the influence of social policy context variables is completely transformed. The key differences must be due to the differences of the ‘Mediterranean welfare states’ (to follow Ferrera rather than Esping-Andersen). Once the southern European factor is allowed for, virtually all context variables become significant and have the ex-pected signs, meaning that they explain differences within groups, whereas differ-ences between groups must be due to more diffuse systemic differences which in-teract with our simple variables. For instance, the EPI index is large and negative, while social protection on the family function becomes large and positive. Indeed, in the typologies of Welfare states, the Mediterranean state is supposed to stand out by placing all emphasis on pensions and none at all on the family function. During the working life of the SHARELIFE sample, in the Mediterranean both social protection family policy would have been absent, while employment protec-tion would not be extended to women.
Given that most of our context variables essentially capture social policy effort, the transformation of the effects once a generalized ‘Southern’ effect is allowed for, implies that the same effort in different parts of Europe had different effects. This can be taken as a strong indication that – in the period when our sample were still young – the workings of the welfare systems and the way those related to the economy were to a large extent distinct – at least as between North and South.
13
Table 12.3: Context variables in the Heckman regression once country groups are distinguished (selected coefficients only)
Dependent variable = Years of work to 50 | work>0
Marginal
effect
Standard
error
Constant 29.6813** 0.9259
Historical Context variables when 40 (avg by cohort)
EPI 1980s (Employment Protection Index) -0.6731** 0.1814
Unemployment by cohort -0.0573* 0.0263
Social protection on “family function”
as (%) of GDP by cohort 1.4290** 0.1996
Minimum wage as % of average by age cohort -0.1361 0.3481
Maternity leave length by age cohort -0.0403** 0.0087
Maternity leave replacement rate by age cohort 1.5538** 0.4080
Continental -0.2633 0.3156
South 2.0719** 0.7418
Transition 3.0010** 0.3981
Selection equation == Ever worked
Historical Context variables when 20 (avg by cohort)
EPI 1980s (Employment Protection Index) -0.0734 0.0400
Unemployment by cohort and 1960s, 1970s, 1980s 0.0097 0.0053
Growth rate by cohort and 1970s, 1980s, 1990s -3.9046* 1.9834
Continental -0.9602** 0.0922
South -1.8238** 0.0953
Transition -0.5591** 0.1141
Source: SHARE Wave 1, Wave 2 release 2.3.0; Wave 3, release 0
12.6 Conclusions
The 50 years encompassed in the lives of women in the SHARELIFE sample cap-ture the periods of development, apogee and consolidation of distinct ‘worlds of welfare capitalism’ into what many call the ‘European Social Model’. Has our analysis shone light of this process?
• The working lives initially followed a polarized pattern which is becom-ing less so with time. Rather than two distinct groups, younger cohorts exhibit more women with adaptive careers, leaving and reentering the la-bour market.

14
• This process is visible everywhere, but it is very uneven still in its geo-graphical and social spread.
• The econometric evidence finds some evidence for convergence. Social policy matters more for the length of career, rather than for participation – which was taken earlier and on the basis of the situation pertaining be-fore the 1980s.
• There appear two large fissures in Europe: one regarding the transition countries, and another regarding the Mediterranean. Indeed social policy parameters seem to change their meaning and significance once we allow for a generalized ‘Mediterranean’ effect.
Do policies matter? Our verdict is ‘undoubtedly yes’. However, the same policies may produce very different outcomes, while similar outcomes may correspond to very different policies (Daly, 2002). It is interesting to hypothesize on “functional equivalents”, i.e. factors Y that in country A produced results brought about by policy X in country B. In this case, Y is a de facto functional equivalent of X. Lack of public social infrastructure may be compensated by the market for such services or even by quiet grannies. The European welfare state encompasses the formal social policy apparatus in the North, and an informal family-based support system in the South.
The big story the researchers should not lose out on is the steady but sure con-vergence of family and work patterns. This convergence still leaves much ground uncovered. Much of the differentiation in older women is the result of older dis-crimination and cumulated inequities which necessitate special attention.
References
Barr, N. (ed) 2005. Labour markets and social policy in Central and Eastern Europe: The acces-sion and beyond, World Bank, Washington DC
Bettio, F. & P. Villa, 1998. “A Mediterranean Perspective on the Breakdown of the Relationship between Participation and Fertility”. Cambridge Journal of Economics, Vol. 22, pp. 137-171.
Boeri, T., 2003. “Women on the ‘low equilibrium’”, mimeo. Boeri, T., D. Del Boca & Ch. Pissarides (eds.), 2005. Women at Work: an economic perspective,
Fondazione Rodolfo DeBenedetti, Oxford University Press. Crompton, R. & C. Lyonette, 2006. “Some Issues in Cross-National Comparative Research
Methods: a comparison of attitudes to promotion and women’s employment in Britain and Portugal”: Work, Employment and Society, Vol. 20(2), pp. 389-400.
Daly, M., 2002. “A Fine Balance: Women’s Labor Market Participation in International Com-parison”, in Scharpf & Schmidt (eds.), Welfare and Work in the Open Economy, Vol. II, pp. 467-510.
Goldin, C.. 2006. "The quiet revolution that transformed women's employment, education and family", The American Economic Review, Vol. 96, no. 2, (May) pp. 1-21.
Hakim, K., 2000. Work-Lifestyle Choices in the 21st Century: Preference Theory, Oxford: Ox-ford University Press.

15
Hakim, K., 2004. Key Issues in Women’s Work: Female Diversity and the Polarisation of Women’s Employment, London: Glasshouse Press.
Hobson, B., 2004. “The Individualised Worker, the Gender Participation and the Gender Equity Models in Sweden”. Social Policy and Society, Vol. 3(1), pp. 75-83.
Lewis, J., 2001. “The Decline of the Male-Breadwinner Model: the Implications for Work and Care”. Social Politics, Vol. 8(2), pp. 152-70.
Lewis, J., M. Campbell & C. Huerta, 2008. “Patterns of paid and unpaid work in Western Europe: gender, commodification, preferences and the implications for policy”. Journal of European Social Policy, Vol. 18(21), pp. 21-37.
Maddala, G.S. 1983, Limited dependent and qualititative veariables in Econometrics, CUP, Cambridge.