Embed Size (px)
Citation preview

Proc. Natl. Acad. Sci. USA 76 (1979) 3039
Correction. In the article "Conformation of uncomplexednatural antamanide crystallized from CH3CN/H20" by Isa-bella L. Karle, T. Wieland, D. Schermer, and H. C. Ottenheym,-
which appeared in the April 1979 issue of Proc. Natl. Acad. Sci.USA (76,1532-1536), Figs. 1, 3, and 4 were not printed well.The figures and their legends are reprinted here.
FIG. 1. Stereodiagram of natural anta-manide drawn by computer from experimentallydetermined coordinates. The peptide backboneis outlined by heavy bonds and the Ca atoms arelabeled 1 to 10. Four H20 molecules are indicatedby Roman numerals.
FIG. 3. Channel formation in the crystal of [Phe4,Val6]anta-manide. Three water molecules closely associated with eachpeptide molecule are indicated by darkened circles. The axial di-rections are c t, b A, and a directed up from the page.
FIG. 4. Stereodiagram of thepacking in the crystal of natural an-tamanide. Water molecules are indi-cated by darkened circles and hydro-gen bonds are denoted by light lines.The axial directions are a i, b -, and( directed up from the page.
Correction. In the article "Growth and morphology of coloniesof Chinese hamster ovary cells growing on agar is affected byinsulin" by Bruce D. Aidells, Michael W. Konrad, and DonaldA. Glaser, which appeared in the April 1979 issue of Proc. Natl.Acad. Sci. USA (76, 1863-1867), Fig. 4 failed to show all thedetails of the original. The figure and its legend are reproducedbelow.
Correction. In the article "Repair of O6-methylguanine inadapted Escherichia coli" by Paul F. Schendel and Peter E.Robins, which appeared in the December 1978 issue of Proc.Natl. Acad. Sci. USA (75,6017-6020), the authors request thefollowing change. The units given for the left vertical axis ofFig. 2 should be cpm in O6MeGua/3 X 107 cells.
Correction. In the article "Modification of the blood-brainbarrier: Increased concentration and fate of enzymes enteringthe brain" by John A. Barranger, Stanley I. Rapoport, WendyR. Fredericks, Peter G. Pentchev, Kaye D. MacDermot, Jan K.Steusing, and Roscoe O. Brady, which appeared in the January1979 issue of the Proc. Natl. Acad. Sci. USA (76, 481-485), theauthors wish the following correction to be made. On page 485,line 1 of the left-hand column, ref. 18 should be deleted andadded on page 484 to the end of line 8 from the bottom of theright-hand column so that the references in these parentheseswill be "(18, 20)."
/ J3mm
FIG. 4. Determination of mounding index. By dividing the radiusof each colony into thirds, we can quantitate morphological differ-
ences, using a parameter we call the mounding index, defined as loglo[(B/C)/(A/B)J, in which A, B, and C are the amounts of light scatteredby the corresponding zones of the colony. On the bottom are com-puter-drawn topological contours of a typical colony grown in 10%FCS on day 14 (mounding index <0) (Left) and another colony withthe addition of insulin at 50 ng/ml (mounding index > 0) (Right). Thevertical axis is exaggerated.
Corrections

Proc. Nati. Acad. Sci. USAVol. 76, No. 4, pp. 1863-1867, April 1979Cell Biology
Growth and morphology of colonies of Chinese hamster ovary cellsgrowing on agar is affected by insulin
(quantitative assay for hormones/automated cell biology)
BRUCE D. AIDELLS, MICHAEL W. KONRAD, AND DONALD A. GLASERMolecular Biology and Virus Laboratory, Stanley Hall, University of California, Berkeley, California 94720
Contributed by Donald A. Claser, January 18,1979
ABSTRACT As a model for the effect of hormones andgrowth factors on three-dimensional growth of mammaliancells, we have analyzed the effect of insulin on the three-di-mensional growth and morphology of Chinese hamster ovary(CHO) colonies grown on the surface of agar. Sequential pho-tographs in dark-field illumination of growing colonies havebeen analyzed with computer-assisted techniques. In thisanalysis the entire shape of each colony in a sizeable population(up to 105 colonies per experiment) can be measured and dis-tributions of parameters derived from these measurements canbe studied. In fetal calf serum (FCS), insulin has a dose-relatedstimulatory effect on cell growth that is most pronounced whengrowth has slowed down. In 10% FCS, insulin has a similar butdiminished effect. When CHO cells are grown conventionallyon plastic substrata or in suspension, insulin has little effect oncell growth at 4% serum concentration. Computer analysis ofchanges in the distribution of colony morphology proved to bea sensitive, dose-dependent, and reproducible assay of a hor-monal effect. As little as 5 ng of insulin per ml added to 10%FCS causes a shift in the distribution of colony morphologies.In 4% FCS, 50 ng of insulin per ml is required to produce a de-tectable change in the colony morphology distribution. Com-puter analysis of cells grown three-dimensionally on agar pro-vides a powerful approach to studying the effects of hormonesand provides observations not available when cells are grownon plastic substrata.
Since the pioneering work of Puck and his coworkers (1, 2), ithas been evident that both the clonal growth and the colonymorphology of mammalian cells are sensitive to the conditionsof culture as well as to the origin and state of the cells used toseed the clones. Under well-controlled conditions, measure-ments of the growth of clones and the morphology of the re-sulting colonies can be the basis for useful bioassays of hormones(3). While the scoring of growth or no growth by simplycounting colonies has led to its extensive applications in nutri-tional, genetic, and other studies (4), quantitative study ofcolony growth or morphology has not been exploited similarly.The primary obstacle to the use of such data is the instrumen-tation necessary for objective, quantitative determination ofcolony size and shape for any appreciable number of colonies.We have constructed a facility for making such measurementsthat allows analysis of time-sequential photographs of more than105 colonies per day.There are many documented effects of hormones on cells
grown in vitro. The list includes effects on proliferation, dif-ferentiation, metabolism, and other biochemical changes (5,6). One important in vivo effect of hormones is on morpho-genesis. Alveolar development in the mammary gland duringpregnancy (7), cyclic changes in the uterus and vagina duringthe estrus cycle (8), and embryologic effect of hormone onurogenital development (9) are all prominent examples of ef-fects of hormones on morphogenesis. Few in vitro mammalian
systems exist, however, for the study of the role of hormonesin three-dimensional morphogenesis. Rtkently it was shown thatboth transformed (10-12) and sown nontransformed cells(13-15) could be grown on top of led medium at the gasinterface. This allows growth in Environment where thesupporting substratum does not dom te the interaction amongthe cells, and where the anticonvection properties of the gelenable each clone to develop in its own self-defined microen-vironment. This allows three-dimensional forms of growth (12)to develop that may express more of the intrinsic attributes ofthe cells than growth in liquid suspension or on more adhesivesolid substrate under liquid (16).
Chinese hamster ovary (CHO) is a cell line highly adaptedto the artificial environment of the tissue culture vessel. It hasbeen cultured almost continuously for over 20 years (1), displaystransformed properties such as growth in suspension and softagar, and grows at a rapid rate (15-hr doubling time). Using thissystem, we have shown that cells grown on agar demonstratea quantitative, proliferative, and morphogenic response to in-sulin that is dose dependent in the physiological range. Pre-liminary results with fibroblast growth factor show differentchanges and indicate that these changes in morphology andgrowth rate may be sensitive to a variety of growth factors, eachproducing a different set of effects.
METHODSCells. CHO-S cells were obtained from L. Thompson
(Lawrence Livermore Laboratories) and were adapted tospinner culture. The two clones used in this study are called SCIand SC3. [SC1 has been studied in previous reports (12). In thosepublications SCI was called clone 2. We wish to use the newnomenclature in this and later publications.]
All clonal stocks were stored in liquid nitrogen. When anexperiment was to be undertaken, frozen stocks were thawed,placed in T-flasks for 2-3 days, and then seeded into spinnerflasks at 104 cells/ml in a minimal essential medium plus 10%fetal calf serum (FCS). The cells were then used for an experi-ment within 2 weeks. For experiments reported here cells weregrown on the surface of 0.5% Noble agar containing a minimalessential medium and serum.Hormones. Porcine insulin was obtained from Sigma. Stocks
were made up fresh for each experiment in 5 mM HCl andstored at 4VC. The final concentrations of insulin used in thestudy reported here were 5, 50, 500, and 5000 ng/ml.
Facility for Automated Experiments in Cell Biology(FAECB). The facility centers on an instrument named "Cy-clops," which is housed in its own environmentally controlledbuilding. Cyclops is a semi-automated system for sorting andinoculating cells for clonal growth and for incubating andphotographically recording the growth of the resultant colonies.It is a large-scale (about 9000 100-mm dishes can be incubatedat one time) versatile system, in which some components are
Abbreviations: FCS, fetal calf serum; CHO, Chinese hamster ovary.
1863
The publication costs of this article were defrayed in part by pagecharge payment. This article must therefore be hereby marked "ad-vertisement" in accordance with 18 U. S. C. §1734 solely to indicatethis fact.

Proc. Natl. Acad. Sci. USA 76 (1979)
fully automated and computer controlled for ease and repro-ducibility of operation (e.g., photography).The general scheme for using Cyclops is as follows: A cell
sorter/inoculator (modified Becton-Dickinson cell sorter) is usedto inoculate cells. To do this, the sorter/inoculator mounted overthe Cyclops movable x-y stage is used to drip uniformly spacedrows of selected single cells onto a tray of 32 dishes. The dishescontain culture medium solidified with a gel, so that growth ofthe resulting clones is at the gel/gas interface. This convec-tion-limited mode of growth ensures that no daughter satelliteclones will be seeded during the course of an experiment.
Incubators can be set at any temperature from 15'C to 450Cwithin ±0.100C at controlled humidity, and using any of anumber of gas mixtures. In our experiments cells were main-tained at 370C, 100% relative humidity, and 71/2% C02/air. TheCyclops clean room provides access to seven independentlyregulated incubators with a total storage space of 280 trays.
As desired, trays of dishes can be removed from the incu-bators, mounted on the Cyclops stage, and photographed byan automated camera system. The system includes two lightsources, an on-axis source for bright-field photography and anoff-axis source, used in our experiments for dark-field pho-tography. Photography uses black-and-white film only, but thespectrum of the light source can be varied by the use of a seriesof color filters mounted on a rotating wheel. Different types ofcolonies have different photographic requirements. In ourexperiments, animal cell colonies growing on a gel are photo-graphed through a red filter to avoid interference by the phenolred absorption of the medium. In this case the image of a colonyis formed by scattered light, and the intensity of the image isproportional to the mass of the colony. The camera's lens systemis flexible and a number of magnifications from XO.24 to X4.8are possible (100 X 100 and 5 X 5 mm field of views, respec-tively).The film is analyzed with a Digital Equipment Corporation
(DEC) PDP-KL10 computer interfaced with a flying spot graylevel scanner, specifically designed and built for the analysisof film from Cyclops photography experiments. The DECSystem-10 facility is further equipped with numerous auxiliaryinput/output devices to facilitate the image analysis and patternrecognition phase of the work. The flying spot scanner acts asan optical microdensitometer with a resolution of 50,um andmeasures the amount of light scattered at each point of eachcolony. A condensed but essentially complete 3-dimensionaldescription of each colony in an active experiment is thenwritten on a high-speed magnetic disc. This information canbe accessed by the computer to produce the statistical distri-bution of any of a number of desired colony characteristics (seeFig. 2C). These characteristics include diameter, total lightscattered (optical mass), thickness of a colony at the center, and3-dimensional shape. By using sequential photographs takenat various times, growth changes in the characteristics of eachclone can be determined. In this way each clone can be ob-served in quantitative detail and in time lapse. This quantifi-cation can be done for a large population of clones, so that verysmall changes in behavior can be observed at a statisticallymeaningful level. Such differences could be unnoticed by thenaked eye or if only a few clones were examined. Correlationsamong colony characteristics can be established and isolationof new variants can be carried out with the computer, becausethe physical location of each colony is also recorded.
RESULTSDescription of CHO Clones. The two clones of CHO cells
used for quantitative measurements in these studies are desig-nated SCi and SC3 (Fig. 1). SC3 is flat, while SCI showsmounding in the center of the colony. In Fig. 1 are illustrated
pictorially the two effects of insulin: (i) with as little as 50ng/ml, insulin stimulated growth in both clones on day 14 ofculture; (ii) insulin caused distinct changes in morphology inclone SCI but not SC3.
Effects of Insulin on Growth. The effect of insulin on thegrowth of colonies on agar was measured and was found to bemost pronounced for clone SC3. Growth curves and dose-re-sponse curves for this clone are illustrated in Fig. 2. On the yaxis each unit represents a doubling in optical mass. During therapid phase of growth, insulin had little effect on growth in 4%FCS (Fig. 2A), but as growth slowed, the effect of insulin be-came significant; it was most pronounced on the 20th day ofculture. When the effect of insulin is plotted as a dose-responsecurve (Fig. 2B), there is found a roughly linear relationshipbetween log of colony mass and log of insulin dose in which a12-fold increase in colony optical mass is observed over therange of insulin studied for growth in 4% FCS. In 10% FCS thestimulatory effect of insulin is not as pronounced, probablybecause the cells are growing nearly maximally in this serumconcentration. Colony mass values in 4% FCS with higher dosesof insulin are equivalent to those in 10% FCS without insulin.The significance of this observation will be discussed later.
Using the PDP-10 computer, the flying spot scanner, and thedata analysis system, we prepared population profiles of growthfor the entire clonal population at each of the five doses of in-sulin (Fig. 2C). This type of analysis demonstrates a distinctadvantage of the automated system because the entire distri-bution of the population can be examined and distinct sub-populations in each population can be detected. From Fig. 2C
FIG. 1. Photographs of the two clones of CHO cells used in ourstudy. (A and C) Clone SC3; (B and D) clone SC1. All the colonieswere photographed on the 14th day of culture. Colonies in A and Bwere grown in 10% FCS without insulin, while for colonies in C andD insulin was present in the medium at 50 ng/ml during the wholeexperiment. (X7.)
1864, Cell Biology: Aidells et al.

Cell Biology: Aidells et al.
20.0
E 17.5
* 15.00v.12.50
10.0
7.5CL
22
E 201.20.
c00o
0 5
Proc. Natl. Acad. Sci. USA 76 (1979) 1865
20 2
50 500 5000Insulin, ng/ml
10 12 14 16 18 20Optical mass of colony
U4U
ii
CL
5
22 24
FIG. 2. Effect of insulin on growth of clone SC3 cells. (A) Growthcurve for clone SC3 grown in 4% FCS plus insulin. Each unit on they axis represents a doubling in mass. (B) Dose-response curve drawnfrom the 20th day of culture from A. The lower curve is for 4% FCS;the upper curve is for 10% FCS on the same day of culture. In allcurves each point is the median value of 200-300 colonies. (C) Pop-ulation profile for different insulin doses on the 20th day of culturein 4% FCS (these data were used to compute medians plotted in thelower curve of B). The x axis is increasing colony optical mass and they axis is the percent of the population in each 0.5 mass interval.
we can see that at each dose of insulin there were only a fewcolonies that failed to respond (those at the left of the graph).Insulin did not cause a significant change in the shape of thedistribution curve, but it did cause a shift in the median colonysize to larger sizes.When SC3 cells were grown clonally on plastic tissue culture
dishes under liquid media, insulin at 500 ng/ml had little or noeffect on growth even after growth had slowed down (Fig. 3A).By growing cells as 3-dimensional colonies on agar, we wereable to measure a growth effect not observed with traditionalplastic tissue culture technology.
Cells from clone SC3 were also grown in suspension culturein plastic bacteriological dishes. Very few cells stick to thesedishes and most remain in suspension. Cells were grown in ei-ther 4% FCS or 4% FCS plus insulin at 500 ng/ml. Fig. 3Bshows the growth curve for this experiment. During the expo-nential phase insulin had no effect on growth. After the growthhad slowed down, insulin had its maximal effect on the 10th dayof culture, causing only a 2-fold increase in cell number.
8 10 0 2Time, days
FIG. 3. Growth curve of clone SC3 cells grown on plastic or insuspension culture in 4% FCS (0) or on 4% FCS plus insulin at 500ng/ml (0). (A) Six-centimeter tissue culture dishes were seeded with1000 cells and observed for the next 10 days. Cells on the dish wereremoved with trypsin and those released into the medium werecounted with a particle counter and the values were combined. Themedium was not changed during the experiment. Each point is theaverage of duplicate plates. (B) Two thousand cells were seeded into6-cm bacteriological dishes. Cells remained in suspension for the next11 days and duplicate dishes were counted with a particle counter.
Effect of Insulin on Colony Morphology. Another andpossibly more sensitive way to monitor the effect of insulin isby means of its effect on CHO colony morphology. For thisstudy, our clone SCI was employed. With as little insulin as 5ng/ml in 10% FCS, there was a striking and reproduciblechange in colony morphology. There was no longer a large flatledge surrounding a central mound and the mounded centralarea became larger. When the insulin dose was increased, therewas a decrease in the flat peripheral ledge and an increase inthe mounded central portion, as will become apparent in thenext section on quantitation of the change in morphology.The striking effect of insulin on SCI morphology is depicted
in Fig. 4, which includes two computer-drawn topological mapsrepresenting light-scattering information. The left figure is a
( A 'B'CX
\ '\'1 'iA BiC
I
1mm
3mm
FIG. 4. Determination of mounding index. By dividing the radiusof each colony into thirds, we can quantitate morphological differ-ences, using a parameter we call the mounding index, defined as logloI(B/(C)/(A/B)J, in which A, B, and C are the amounts of light scat-tered by the corresponding zones of the colony. On the bottom are
computer-drawn topological contours of a typical colony grown in 10%FCS on day 14 (mounding index <0) (Left) and another colony withthe addition of insulin at 50 ng/ml (mounding index >0) (Right). Thevertical axis is exaggerated.
A
) 5 10 15Time, days
B10% FCS
4% FCS
18iA
c
.° 20
° 15
0
r 10
In
5
cl0 1CL
C .-~5 500:. A
0: 50050 50
01lI i
Pi I
F /j
\
A1'\I~I,, -s,~~~~~~~~~~~~~~~~~~..K
Proc. Nati. Acad. Sci. USA 76 (1979)
typical colony of SCi grown in 10% FCS without insulin; theright figure shows a colony grown in 10% FCS plus insulin at50 ng/ml.
In order to quantitate the effects of insulin on morphologywe have divided the radius of each colony into three equal partsdefining regions A, B, and C as shown in Fig. 4. From theamounts of light scattered by the three regions, we can computea quantity we call the "mounding index." The miounding indexis defined as logjo[(B/C)/(A/B)]. This definition of themounding index was chosen because it distinguishes well be-tween flat and mounded colonies, corresponds with intuitionby having a large value for mounded colonies and a small valuefor flat ones, and is easily computed and displayed by using thecolony measurements (Fig. 5).
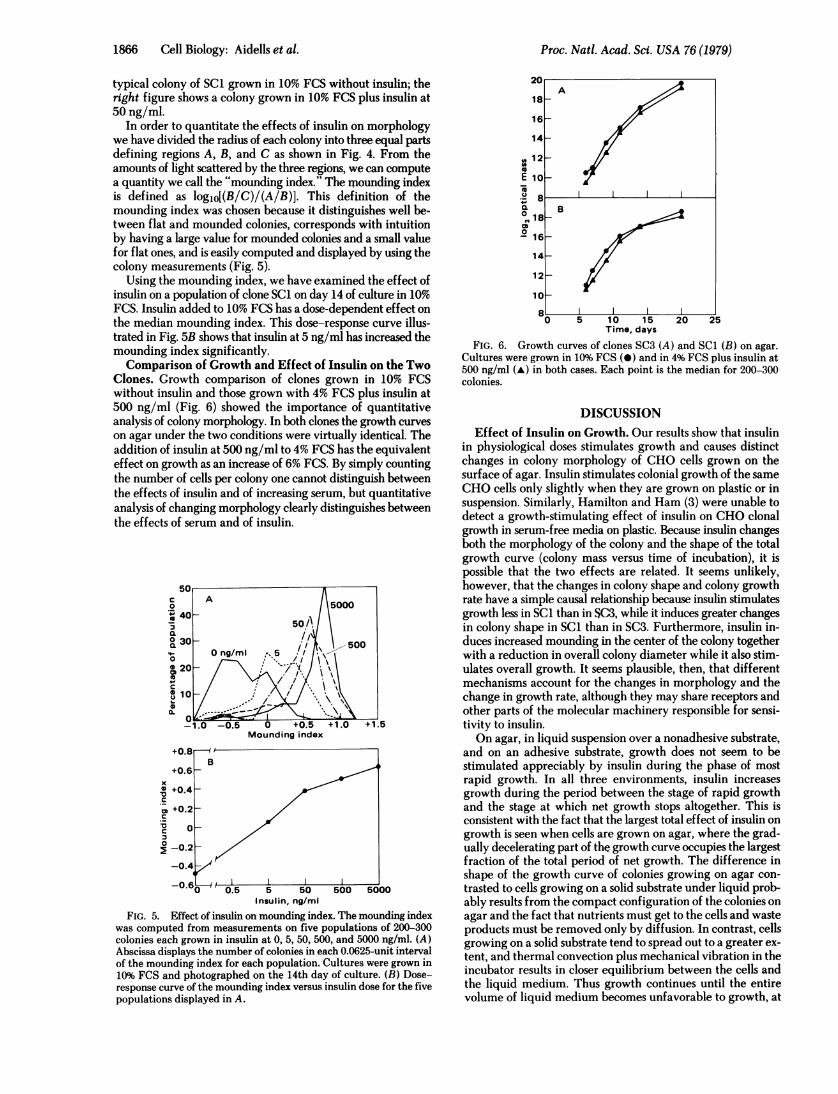
Using the mounding index, we have examined the effect ofinsulin on a population of clone SCi on day 14 of culture in 10%FCS. Insulin added to 10% FCS has a dose-dependent effect onthe median mounding index. This dose-response curve illus-trated in Fig. 5B shows that insulin at 5 ng/ml has increased themounding index significantly.Comparison of Growth and Effect of Insulin on the Two
Clones. Growth comparison of clones grown in 10% FCSwithout insulin and those grown with 4% FCS plus insulin at500 ng/ml (Fig. 6) showed the importance of quantitativeanalysis of colony morphology. In both clones the growth curveson agar under the two conditions were virtually identical. Theaddition of insulin at 500 ng/ml to 4% FCS has the equivalenteffect on growth as an increase of 6% FCS. By simply countingthe number of cells per colony one cannot distinguish betweenthe effects of insulin and of increasing serum, but quantitativeanalysis of changing morphology clearly distinguishes betweenthe effects of serum and of insulin.
+0.8
+0.6x0 +0.4vCa, +0.2._-* 0
-0.2
-0.4
- D'0.5 5 50 500 5000
Insulin, ng/ml
FIG. 5. Effect of insulin on mounding index. The mounding indexwas computed from measurements on five populations of 200-300colonies each grown in insulin at 0, 5, 50, 500, and 5000 ng/ml. (A)Abscissa displays the number of colonies in each 0.0625-unit intervalof the mounding index for each population. Cultures were grown in10% FCS and photographed on the 14th day of culture. (B) Dose-response curve of the mounding index versus insulin dose for the fivepopulations displayed in A.
A
16
14-
12
E10/u
CL B0°"18_° 16
14-
12-
10
80 5 10 15 20 25
Time, daysFIG. 6. Growth curves of clones SC3 (A) and SC1 (B) on agar.
Cultures were grown in 10% FCS (0) and in 4% FCS plus insulin at500 ng/ml (A) in both cases. Each point is the median for 200-300colonies.
DISCUSSIONEffect of Insulin on Growth. Our results show that insulin
in physiological doses stimulates growth and causes distinctchanges in colony morphology of CHO cells grown on thesurface of agar. Insulin stimulates colonial growth of the sameCHO cells only slightly when they are grown on plastic or insuspension. Similarly, Hamilton and Ham (3) were unable todetect a growth-stimulating effect of insulin on CHO clonalgrowth in serum-free media on plastic. Because insulin changesboth the morphology of the colony and the shape of the totalgrowth curve (colony mass versus time of incubation), it ispossible that the two effects are related. It seems unlikely,however, that the changes in colony shape and colony growthrate have a simple causal relationship because insulin stimulatesgrowth less in SC1 than in SC3, while it induces greater changesin colony shape in SCI than in SC3. Furthermore, insulin in-duces increased mounding in the center of the colony togetherwith a reduction in overall colony diameter while it also stim-ulates overall growth. It seems plausible, then, that differentmechanisms account for the changes in morphology and thechange in growth rate, although they may share receptors andother parts of the molecular machinery responsible for sensi-tivity to insulin.On agar, in liquid suspension over a nonadhesive substrate,
and on an adhesive substrate, growth does not seem to bestimulated appreciably by insulin during the phase of mostrapid growth. In all three environments, insulin increasesgrowth during the period between the stage of rapid growthand the stage at which net growth stops altogether. This isconsistent with the fact that the largest total effect of insulin ongrowth is seen when cells are grown on agar, where the grad-ually decelerating part of the growth curve occupies the largestfraction of the total period of net growth. The difference inshape of the growth curve of colonies growing on agar con-trasted to cells growing on a solid substrate under liquid prob-ably results from the compact configuration of the colonies onagar and the fact that nutrients must get to the cells and wasteproducts must be removed only by diffusion. In contrast, cellsgrowing on a solid substrate tend to spread out to a greater ex-tent, and thermal convection plus mechanical vibration in theincubator results in closer equilibrium between the cells andthe liquid medium. Thus growth continues until the entirevolume of liquid medium becomes unfavorable to growth, at
B
1,
1866 Cell Biology: Aidells et al.

Proc. Natl. Acad. Sci. USA 76 (1979) 1867
which time a more abrupt halt is seen than for growth onagar.
It is also possible that the substrate itself may be responsiblefor the difference in response to hormones. Androgen-depen-dent mammary tumor cells show enhanced growth responseto androgens when grown in suspension culture or in agar ascompared to growth on plastic (17). Corneal endothelial cellsfailed to respond to epidermal growth factor when grown onplastic, but the cells were stimulated when grown on collagen(18). The effect of the various substrates may be to change thegeometry of the cells, in turn affecting their responses. This maybe the case with the corneal endothelial cells (18). Folkman (19)has clearly shown that one effect of substrate on growth is re-lated to the cell shape.
Similarly, the shape of a CHO colony on agar is correlatedwith the growth of that colony. Clone SC3, which is a flattercolony than SC1, was able to grow for a longer period, and forother colony types we have also found that, the more moundedthe clone, the shorter the growth phase. This diminished growthis related to the cell thickness of the colony, the availability ofnutrients, and the extent of necrotic regions. Studying growthof spheroids in agar, Sutherland et al. (20) have shown that thereis a finite limit to the size a spheroid can reach that is deter-mined in part by necrosis of cells in the center of thespheroid.
Effect on Colony Morphology. The effect of insulin at aconcentration of 50 ng/ml on the morphology of CHO SC1colonies growing on agar is obvious to the eye. To be precise,what the eye sees, and what the computer-controlled densi-tometer also measures on the photographs, is the thickness ofthe colony perpendicular to the plane of the agar surface. Be-cause colonies grow down into the agar as well as up from theagar surface, these data do not specify completely their three-dimensional shape. Computer-assisted analysis allows quanti-tative measurements to be made and statistics to be obtainedon the shapes of hundreds or thousands of colonies. From thesequantitative measurements a dose-response curve can beconstructed, and the measured responses can be averaged overmany colonies to allow detection of subtle effects by dimin-ishing the influence of heterogeneity in colony shape.
Analysis and use of the shapes of hundreds or thousands ofcolonies as a measure of the biological action of a substance suchas a hormone can be a complex problem. The informationneeded to specify the-shape of even one colony at one stage ofgrowth is large, being approximately proportional to the squareof the linear resolution of the system. In the system used here,the resolution is better than 1/30th of the diameter of a typicalcolony, so that about 1000 numbers are required. The fact thatmost colonies are approximately cylindrically symmetric and,more importantly, that we consider the information of bio-logical interest to be preserved after the shape is averaged overall angles around the center of the colony, reduces the numberto about 30. Visual observation of the shape changes caused byinsulin suggests to us that the ratio of colony thicknesses overa few zones of the colony can be used to quantitate this effect,and led to the partially arbitrary definition of the "moundingindex" used in this report. It should be emphasized, however,that the reduction of the shape to one parameter results in agreat loss of information in general. Thus, while "moundingindex" is clearly of use in these experiments, it may not be inothers, in which the shape of colonies may be altered, but notin a way to produce a monotomic change in the "moundingindex," or even necessarily in a way to produce any dramaticchange in this derived parameter. One of the advantages of oursystem is that essentially all the data characterizing colonyshape, for up to 100,000 colonies at several stages of growth, canbe stored on high-speed magnetic discs. This allows the appli-
cation of the quantitative techniques of pattern recognition,as well as more intuitive searches for meaning, to be conductedrepeatedly, if necessary, in a few minutes per pass.The general usefulness of observations of colony shape in cell
biology will be greatly increased when it can be interpreted interms of other more fundamental cellular parameters of directbiological interest. Although we do not yet have a compre-hensive, quantitative model of colony morphogenesis, wepropose that colony mounding is driven by the force of cell-celladhesion and opposed by the force of cell-agar adhesion, themechanical rigidity of the agar, and the surface tension of theair interface of the medium that wets the surface of the agarand the cells. At least in some cases, the observed colony shapedoes not seemn to be in equilibrium with respect to these forces,cell movement being retarded by effective cell-cell viscosity.This viscosity, that is the inhibition of the movement of cellsover each other, is in turn likely to be the result of a balanceamong still more fundamental processes, including cell mo-bility, cell surface movement, and cell-cell attachment for-mation and breakage. At present then, we can only suggest thatinsulin might be modifying colony shape by increasing cell-celladhesion, decreasing cell-agar adhesion, or decreasing cell-cellviscosity. Direct measurements of these parameters and theeffects of insulin on them in this system should give furtherinsight into the action of insulin and the morphogenesis of an-imal cell colonies. We feel that this is a promising system tostudy the effect of hormones on colony morphology and growth.By observing the effects of a number of hormones and growthfactors on colony morphology and by analyzing them in termsof internal and external molecular responses of sensitive cells,we hope to develop a list of mechanisms that may play a rolein morphogenesis in vivo as well as in cultured cells.
This work was partly supported by National Institutes of HealthGrant GM 22021 and LBL 7109500.
1. Puck, T. T., Marcus, P. E. & Creciura, S. J. (1955) J. Exp. Med.103,273-283.
2. Puck, T. T. & Marcus, P. E. (1956) J. Exp. Med. 104, 653-666.
3. Hamilton, W. G. & Ham, R. G. (1977) In Vitro 13,537-548.4. Puck, T. T. (1972) The Mammalian Cell as a Microorganism:
Genetic and Biochemical Studies In Vitro (Holden-Day, SanFrancisco).
5. Gospodarowicz, D. & Moran, J. S. (1976) Annu. Rev. Biochem.45,531-558.
6. Wigley, C. B. (1975) Differentiation 4,25-55.7. Nandi, S. (1959) Hormonal Control of Mammogenesis and
Lactogenesis in the C3H/He Crgl Mouse, University of Cali-fornia Publication 2001 (Univ. of California, Berkeley, CA), Vol.65, pp. 1-128.
8. Martin, L., Finn, C. & Trindu, G. (1973) J. Endocrinol. 56,133-144.
9. Cunha, G. R. (1978) In Vitro 14, 333 (abstr.).10. Kuroki, T. (1973) Exp. Cell Res. 80, 55-62.11. Kuroki, T. (1975) in Methods in Cell Biology, ed. Prescott, D.
(Academic, New York), Vol. 9, pp. 157-178.12. Konfad, M. W., Storrie, B., Glaser, D. A. & Thompson, L. H.
(1977) Cell 10,305-312.13. Elsdale, T. & Bard, J. (1972) J. Cell Biol. 54, 626-637.14. Elsdale, T. & Bard, J. (1972) Nature (London) 236, 152-155.15. Michalopoulos, G. & Pitot, H. C. (1975) Exp. Cell Res. 94, 70-
78.16. Aidells, B. D., Konrad, M. W. & Glaser, D. A. (1978) In Vitro 14,
352 (abstr.).17. Stanley, E. R., Palmer, R. E. & Sohn, U. (1977) Cell 10, 35-44.18. Gospodarowicz, D., Greenberg, G. & Birdwell, C. R. (1978)
Cancer Res. 38, 4155-4171.19. Folkman, J. (1978) Nature (London) 273,345-349.20. Sutherland, R. M., McCredie, J. A. & Inch, W. R. (1971) J. Natl.
Cancer Inst. 46, 113-120.
Cell Biology: Aidells et al.