Embed Size (px)
Citation preview

California State University, San Bernardino California State University, San Bernardino
CSUSB ScholarWorks CSUSB ScholarWorks
Theses Digitization Project John M. Pfau Library
1993
A two and three dimensional high school geometry unit A two and three dimensional high school geometry unit
implementing recommendations in the National Council of implementing recommendations in the National Council of
Teachers of Mathematics curriculum and evaluation standards Teachers of Mathematics curriculum and evaluation standards
Stella Sloan
Follow this and additional works at: https://scholarworks.lib.csusb.edu/etd-project
Part of the Science and Mathematics Education Commons
Recommended Citation Recommended Citation Sloan, Stella, "A two and three dimensional high school geometry unit implementing recommendations in the National Council of Teachers of Mathematics curriculum and evaluation standards" (1993). Theses Digitization Project. 647. https://scholarworks.lib.csusb.edu/etd-project/647
This Project is brought to you for free and open access by the John M. Pfau Library at CSUSB ScholarWorks. It has been accepted for inclusion in Theses Digitization Project by an authorized administrator of CSUSB ScholarWorks. For more information, please contact [email protected].

ATWOANDTHREE DIMENSIONAL HIGHSCHOOLGEOMETRY UNIT
IMPLEMENTING
RECOMMENDATIONS IN THE NATIONALCOUNCILOFTEACHERSOF
MATHEMATICSCURRICULUM AND EVALUATION STANDARDS
A Project
Presented to the
Faculty of
California State University,
San Bernardino
In Partial Fulfillment
of the Requirement for the Degree
Master of Arts
in
Education
by
Stella Sloan
June 1993

A TWO AND THREE DIMENSIONAL HIGH SCHOOL GEOMETRY UNIT
IMPLEMENTING
RECOMMENDATIONS IN THE NATIONAL COUNCIL OF TEACHERS OF
MATHEMATICS CURRICULUM AND EVALUATION STANDARDS
A Project
Presented to the
Faculty of
California State University,
San Bernardino
by
Stella Sloan
June 1993
Approved by:
s'-ajrDateF. F%fp Chair, Educationhyli lund
Bonnie^ >BrulTkhorst
Herbert K. Bru-nkhorst

ABSTRACT
The following was a project on spatial visualization and high
school geometry. The current geometry curriculum problems
addressed were that of students' inability to see the usefulness of
geometry in the their lives, in professions, and their inability to see
relevance to reality. Other curriculum problems addressed included
teaching methods, textbook approaches used, and the failure rate of
high school geometry students. The problems with spatial
visualization included the presentation of problems in textbooks
assuming students were able to spatially visualize and the neglect
of spatial visualization exercises.
The goals of this unit were to implement the National Council
of Teachers of Mathematics Curriculum and Evaluation Standards
(NCTM Standards) in a field tested unit as they related to spatial
visualization and real world applications with a hands-on approach
of two and three dimensional geometry.
The research design objectives were to develop a high school
geometry unit that would focus on the applicable skills and
pedagogical strategies from the NCTM Standards. Another design
objective was to improve student attitudes toward geometry and its
application.
The research design of this unit was to develop and assess a
curriculum using hands-on and direct application skills,
incorporating pedagogical strategies from the NCTM Standards, and
1 1 1
addressing attitudlnat outcomes through the relevance of the topic
to the students' world.
The literature regarding mathematics and geometry
achievement was related to spatial visualization, cognitive
structure related to learning geometry, spatial visualization
development skills, and the use of manipulatives. The field tested
unit was designed based upon the literature and the NCTM Standards.
Upon completion, the data from each lesson was analyzed. The
student assessment was analyzed. The assessment included a
spatial visualization test and student journal entries.
1 V

TABLEOFCONTENTS
ABSTRACT.......... ....... .... ...........iii
INTRODUCTION......... ....................1
RESEARCH QUESTION AND RESEARCH DESIGN..........^............ .......4
Problems in Current Geometry Currieulum...... 4
Problem with Student Ability to Picture Three Dimensional Figures.. .................................................6
Project Goals...;.. ......................7
Research Design Objective....................... .7
Research Design ... ..........8
REVIEW OFTHE LITERATURE................... ..„...........12
Mathematics Achievement Related to
Spatial Visualization..... 12
Geometry Achievement Related to
Lesson on the Need for Developing Spatial
Spatial Visualization................w.. ......15
Cognitive Structure in Learning Geometry ...................................17
Developing Spatial Visualization Skills........ ......................20
Manipulatives............................... 21
PROJECT DESIGN ANDPROCEDURE 23
Visualization Skills. 23
LeSsons on Developing Spatial Visualization Skills.. 24

Lessons on Perimeter and Area of Triangles and Quadrilaterals 41
Lesson VII - X: Lessons on Area and Perimeter
Report on Researcher's Observations on the
Lessons on Volume and Surface Area of Polyhedra. ..55
Overall Assessment .........61
ANALYSISOF DATA..... 62
Lesson I: The Need for Spatial Visualization Skills 62
Lesson II; Polygons 63
Lesson III: Polyhedra..... ......64
Lesson IV and V: Euler's Formula and Platonic Solids.... 65
of Triangles and Quadrilaterals 65
Lesson XI: Applications and Assessment... 66
Lesson XII: Volume and Surface Area 67
Lesson XIII: Applications and Assessment. .....68
ASSESSMENT ANALYSIS....... 70
Description of Assessment....... 70
Journal Entries 71
Implementation of Project Design ..72
CONCLUSION... 74
APPENDIX A:Project Outline 76
V 1

.81 APPENDIX B:Tables
Table 1: Geometry Student Journal Responses.... 81
Table 2: A Southern California High School Geometry Enrollment 1991/1992 .82
Table 3: Professions and Activities Requiring Spatial Visualization Skills 83
Table 4: Results of Spatial Visualization Multiple Choice Eight- Problem Test...... 84
Table 5: Results of Survey on Usefulness of Geometry 85
APPENDIXC .........86
Mechanical Aptitude and Spatial Relations Test 86
Copyright Permission 88
REFERENCES 89
VI

INTRODUCTION
The National Council of Teachers of Mathematics (NCTM) has
long provided leadership in curriculum, instruction, and teacher
education (Crosswhite, 1990). History of school mathematics in
this country has been characterized by movements to extremes, such
as "basic skills or concepts, the concrete or the abstract, intuition
or formalism, structure or problem solving, and induction or
deduction" (Crosswhite, 1990). According to Crosswhite, there
should be a reasonable balance between these elements.
Motivated by this need for a balance, in 1980, the NCTM
developed a set of recommendations for school mathematics that
became An Agenda for Action. The Agenda was written at a level of
generality that was difficult to translate into criteria for program
evaluation. An attempt to evaluate the NCTM Agenda was a
motivation for development of the NCTM Curriculum and Evaluation
Standards for School Mathematics (NCTM Standards). The Standards
were intended to define criteria of excellence.
Thomas A, Romberg cites two sources of concern and evidence
that the current system is not working. First is the bleak national
performance data. The National Assessment of Educational Progress
results show that most students are proficient in computational
skills, but are unable to apply those skills. Secondly, our schools
are failing to educate students to be productive employees in the
current work place. The industrial era has ended and our school
mathematics curriculum still reflects the industrial needs of the
1
1920's (Romberg, 1990). According to John B. Walsh, the objectives
found in the NCTM Standards address inadequacies in the teaching of
mathematics which result in problems such as, 1) a nation of
mathematical illiterates, 2) early childhood interest in mathematics
disappears and 3) bright students are not nurtured. Walsh states
that these problems are serious to our industry and our nation as a
whole (Walsh, 1990).
In the development of the NCTM Standards, the commission of
standards for school mathematics had two tasks in mind. The first
was to create a coherent vision of what it means to be
mathematically literate in a world where mathematics is rapidly
growing and is extensively being applied in diverse fields. The
second was to create a set of standards to guide the revision of the
school mathematics curriculum toward the above mentioned vision.
The commission was also concerned that the "final product
represent a consensus of the mathematical science education
community on what students in American schools should know and be
able to do as a result of their study of school mathematics" (Dossey,
1989). NCTM indicated that ensuring quality, indicating goals, and
promoting change were three important reasons to formally adopt a
set of standards. A past president of NCTM referred to the NCTM
Standards as the completion of a task that culminated five years of
planning and development (Crosswhite, 1989).
The NCTM Standards describe a vision for school mathematics,
but they do not prescribe a curriculum (Crosswhite, 1989). The

researcher of this unit proposes to implement the NCTM Standards
related to problems identified in the high school geometry
classroom. Geometry has always been an important strand of school
mathematics. The NCTM Standards focus on making sense of real
world situations and problems and emphasize that geometry not be
addressed as a collection of abstract ideas and procedures to be
memorized (Hirsch, 1990).
One of the standards in the 9th through 12th grade section (p.
157) deals with geometry from a synthetic perspective. Synthetic
geometry is based on segments, angles, triangles, quadrilaterals,
polyhedra, and so on. This standard focuses on providing experiences
that deepen the students' understanding of shapes and their
properties. According to the standards examples should be provided
on how geometry is used in recreation, practical tasks, sciences, and
the arts. Activities to develop spatial skill are mentioned in the
standards as fundamental to everyday life.

RESEARCHQUESTION AND RESEARCH DESIGN
Problems in Current Geometry Curriculum
Many high school students drop out of mathematics when they
reach geometry. Students are turned off to mathematics because
they do not see the usefulness of geometry in their everyday life or
in the professional careers they are contemplating in pursuing.
Teaching methods in most high school geometry classes consist of
lecture and independent practice in textbooks that give little or no
attention to spatial visualization skills.
During October 1992, at the beginning of a yeai" long geometry
course in a Southern California high school, the author of this study
surveyed two geometry classes. Fifty four students were asked to
cpmplete the following phrase, " I feel that geometry is ...." (Refer to
table 1). Of the fifty four students that responded, six percent
responded that geometry is necessary for college. They saw the
course as one of many prerequisites necessary to reach their goal.
There were fifteen percent who responded that they enjoyed
geometry and found it useful. Eight percent were already turned off
to geometry. The students responded by stating that they didn't like
geometry, they didn't understand it and they didn't care. The
majority of the students, sixty three percent, did not respond that
they liked or disliked the subject: they simply expressed their
feelings of frustration, confusion, lack of understanding, and
inability to see the relevance of geometry to real world situations.

These surveys suggested that the NGTM Standard focusing on wide
applicability of geometry in human activity was a neglected area in
these students experience.
The NCTM Standards recommend that instructional methods
such as proofs (p. 127), receive decreased attention at the high
school level. This type of instructional method is still in practice in
most of our high school geometry classes. The teacher and textbook
are exclusive sources of knowledge. Students are still required to
memorize theorems, postulates, and definitions. Individual seat
work practicing routine proofs is still found in the geometry
classroom. The teacher still does most of the instructing in the form
of lecture, and testing is still the preferred method used to give a
grade. Under these current methods the NCTIVI Standards refers to
the teacher as "director" and "one who dispenses information". The
Standards stress that by using alternative methods of instruction,
students can approach learning more creatively and independentiy
which will strengthen their confidence and skill in doing
mathematics (p. 128).
During the 1991-92 school year at a Southern California high
school, located in a rural area in Riverside County, California, with a
student population of approximately three-thousand students, one
hundred-eighty- three signed up for geometry. Of those one-
hundred-eighty-three students in geometry one-hundred-seventeen
completed the course, of those one- hundred-seventeen that finished
the course, twenty-four failed and seventeen received a grade of "D"

(Refer to table 2). Of the one-hundred-eighty-three students that
took the course, approximately forty-one percent completed it
successfully, suggesting too many students were being lost at this
level of mathematics.
Problem with Student Abilitv to Picture Three Dimensional Figures
Current textbooks such as Geometry by Houghton Mifflin and
Geometrv bv Merrill have lessons on area, surface area and volume of
geometrical solids with the assumption that students can mentally
picture the object at different angles. The Merrill book has three
sections (pp. 387-398) on finding areas and volumes of spheres,
pyramids, prisms, cylinders, cones, pyramids within prisms and
cones within cylinders. All of these are interesting and very useful
for the student in the future and in future mathematics courses.
However, the text does not address the spatial visualization skills
necessary for the student to be successful in these sections
involving areas and volumes. The Houghton Mifflin book devotes
chapter 10 (pp. 422-459) to areas and volumes of usual and unusual
three dimensional solids. By teaching students to memorize a
formula, the subject matter is reduced to a lower cognitive level
and understanding does not occur. Students need to fully understand
what they are doing and why they are using the formulas provided by
the textbooks. The student needs to apply his/her knowledge of
finding areas and volumes to many other situations such as finding

the volume of an unusual solid where the direct application of a
formula does not suffice.
Project Goals
The NCTM Standards directly address the need to provide
students with mathematical experiences that are applicable to
human activity and that provide opportunities with three
dimensional objects to develop spatial visualization skills (p. 157).
The goals of this project are, 1) to implement the National
Standards as they relate to spatial visualization and hands on real
world applications in geometry, and 2) to develop a field tested high
school geometry unit focused on developing spatial visualization
skills in the context of real world applications with a hands on
approach of two and three dimensional geometry.
Research Design Objective
The research design objectives of this project are to develop
a field tested unit that will improve the students' spatial
visualization skills and focus on other applicable skills and
pedagogical strategies found in the National Standards. The
Standards refer to the development of spatial skills as fundamental
to everyday life and careers (p.157). Developing the students' skill
to solve problems in their environment is another skill that will be a
focus of this field-tested unit. The Standards indicate that the
work involved in the students solving problems in their own
7
environment enables them to approach learning independently and
creatively (p.128). Other applicable National Standards that will be
addressed are active involvement of the students in the construction
and application of geometrical ideas (p. 129), and interpreting and
drawing three dimensional objects.
Traditionally, learning has been conceived as passive
absorption of information. Skills are taught as a precursor to
solving problems. The NGTM Standards state that students approach
a new task with prior learning and if the problem is presented first
the student will recognize the need to apply a concept or procedure
(p. 10). One of the research design objectives of this project makes
use of a variety of pedagogical strategies such as small group work
(cooperative learning), project work, and active involvement of
students constructing and applying geometry.
The attitudinal objectives are, 1) to empower the student to
break from inappropriate mind sets through the development of
spatial visualization skills, 2) to make students comfortable in
taking risks when attempting to solve problems, 3) to show students
the importance of geometry in a variety of professional fields, and
4) to improve the students attitude toward geometry.
Research Design
In focusing on the active involvement of students in
constructions and applications of geometrical ideas this field tested
unit will include, construction of two dimensional polygons with
8

compass and straight-edge and paper folding activities to verify and
review geometrical Concepts. Students will move from two
dimensions to three dimensions by using previously constructed two
dimensional polygons to make three dimensional polyhedra. The
polyhedra models created by the students will be used to verify
and/or discover properties of three dimensional solids. Students
will also use their own solids to sketch two dimensional
representations of the models on isometric paper. Students will use
isometric and orthogonal representations to create three
dimensional models. Using dot paper, students will move back to
two dimensional geometry through discovery learning of perimeter
and area of triangles and quadrilaterals. Surface area and volume of
polyhedra will be determined through the use of two dimensional
isometric drawings and construction of three dimensional models
with plastic cubes.
Students inquire naturally when they are puzzled. Puzzles
directly related to spatial visualization and real world applications
will be used as introductions throughout this unit. Students will be
allowed to discover new properties or concepts on their own through
their constructions or models. Gooperative learning groups will be
used to give students the opportunity to discuss, formulate and
compare ideas. Curriculum textbook authors agree that learners
need to apply what they learn. Kinesthetic hands on and minds on
learning is important. Daniel Tanner and Laurel N. Tanner (1980) say
that , "there is no mastery without intelligent application"(p. 640).

Bruce Joyce and Marsha Weil (1986) put it this way, "it is the
learner's activity that results in the learning. Practice is important
for the learner to make the necessary connection" (p.430). This
field tested unit will focus on kinesthetic hands on learning.
Cooperative learning groups will be used for the students to create
projects.
Emotional effects of certain kinds of experiences and direct
intellectual processes affect student attitudes. The hands-on
activities of constructing and working with blocks in this unit will
give the students the opportunity to develop their ability to
spatially visualize. Developing this skill could provide the students
with the ability to break from an jnappropriate mind set when
presented with a problem related to area and volume. Satisfying
experiences in a particular connection improves attitudes. A
satisfying experience can come from success. In turn, success can
make the students more comfortable in taking risks. The activities
Of this field-tested unit wilt provide students with opportunities to
succeed.
This project will focus on applying the topics to the students'
world by connecting their interest and creativity to the concepts and
procedures. Students will develop an understanding of the need for
spatial visualization in their own world and in a variety of
professional fields. The Standards make reference to the
importance of relating topics to situations in the students' world
and encouraging them to explore, formulate, prove, antf discuss.
10

According to the Standards, this allows the students to approach
learning mathematics creatively and independently. This, in turn,
strengthens the students' confidence in doing mathematics (p. 128).
Student attitudes improve when they develop an understanding.
At the conclusion of this field tested unit, the researcher will
determine student outcomes by giving students a spatial
visualization test. The same test will be given to a control group
and the results compared between groups. Attitudinal outcomes will
be measured through reporting in student journals. Students will be
asked to react to the need and uses of geometry in their own life and
in professions/careers. The field tested unit and each lesson will be
analyzed as to its effectiveness in accomplishing goals and
objectives. The effectiveness in accomplishing the goals of thi^
unit will be analyzed by the student journal responses on the
usefulness of geometry in their every day life and in
professions/careers.
1 1

REVIEW OFTHE LITERATURE
Mathematics Achievement Related to Spatial Visualization
Spatial visualization and mathematics achievement have been
shown to correlate (Bishop, 1980). Researchers like Fennema and
Tartre (1985) disagree on the reasons for this correlation. They
point out that studies showing a relationship between spatial
visualization and problem solving use spatial components to
establish that relationship. This reinforces the concept that there
is a direct relationship between spatial visualization and
mathematics that involves spatial components such as measurement
and geometry. Fennema and Tartre claim that the relationship of
spatial visualization and a broader spectrum of mathematics (such
as functions, statistics, algebra, probability, and discrete
mathematics) is unclear.
According to Werdelin (1961), an individual who is able to
attack a mathematical problem verbally or spatially is more apt to
solve it than an individual who has low spatial or verbal skills. In
their study, Fennema and Tartre (1985) addressed five concerns in
students with discrepant spatial visualization and verbal skill: 1)
Ability to solve mathematical problems; 2) Ability to verbalize
relevant information; 3) Ability to translate symbols into pictorial
representation; 4) Ability to use spatial visualization skills overtly
during mathematical problem solving; and, 5) Ability to use pictorial
representations during mathematical problem solving. Their study
1 2

involved using a problem-solving process emphasizing the use of
spatial visualization skills. Between students with high verbal
skills and students with high spatial skills, the researchers found
there was no statistically significant difference in their ability to
solve mathematical problems. In verbalizing relevant data, the
students with high verbal skills outperformed students with high
spatial visualization. The students with high spatial visualization
were able to translate symbols into pictures better than the
students with high verbal skills. They also used more mental
movement than the students with high verbal skills. Students with
high spatial visualization were better able to draw and use pictorial
representations. As a conclusion to their study, Fennema and Tartre
suggested that emphasizing spatial visualization may not be an
effective way to get correct solutions.
Five years later Tartre (1990) made a distinction in the
different types of spatial skills. She named three spatial abilities
as identified by Linn and Peterson (1985). The three spatial skills
were spatial perception, mental rotation, and spatial visualization.
Tartre's study focused on the relationship between spatial
orientation (rather than spatial visualization) and mathematics.
Any mental movement of the object was considered to be spatial
visualization. Spatial orientation described the tasks necessary for
the individual to mentally readjust his or her perspective, such as
seeing the object from a different angle. Tartre referred to spatial
orientation as an "intuitive or insightful spatial organizational
13
process". Her study identified ways in which students with high or
low spatial orientation skills behave differently when solving
mathematic ofproblems. Tartre gave students ten mathematical
problems to solve. Seven of the problems concerned geometric
content. She used the Gestalt Completion Test to measure spatial
orientation skill. Estimate error and drew relation were two coded
categories that Tartre hypothesized to be related to Spatial
orientation skill. Estimate error was used to indicate the difference
between the correct answer and the student's estimate. A zero
would indicate that the student's estimate was the exact answer.
Drew relation indicated that the student used mairkings or drawings
to show a mathematical relation. The mean for the high spatial
orientation group was lower than the mean for the low spatial
orientation group for estimate error. This meant that the group
with high spatial orientation was better able to estimate. There
was a significant difference favoring the high spatial orientation
group in drew relation.
Tartre concluded that students with low spatial orientation
skills are not flexible in changing a formed perceptual mind set. The
students with high spatial orientation skills could demonstrate a
way to analyze a problem by adding marks or drawing. Students with
high spatial orientation skill were better able to estimate answers
in geometry by breaking up the big picture into little parts.
1 4

Geometry Achievement Related To Spatial Visualization
Studies that contradict Bishop's (1980) research have shown
there may not be a direct relationship between spatial visualization
and mathematics achievement (Fennema and Tarte, 1985). However,
when studying geometry, high school students with high spatial
visualization skills tended to do better than those geometry
students with low spatial visualization skills (Battista, 1990).
Spatial visualization is defined as the ability to mentally
manipulate a pictorially presented object related to mathematics.
Battista (1990) reported on a study that investigated the role
that spatial visualization plays in the performance in high school
geometry. His study involved one-hundred-forty-five high school
students. Tests were given in spatial visualization, logical
reasoning, geometry knowledge, and geometric problem solving
strategies. Scores were recorded for each of the following nine
areas; spatial visualization (SV), logical reasoning (LR), geometry
achievement (GEOM), geometric problem solving (PS), drawing
strategy (D), visualization without drawing (V), nonspatial strategy
(N), correct drawings (DRAW), and discrepancy between a students'
spatial score and logical reasoning score (DISCREP).
intercorrelations between scores were calculated to determine
relationships. Battista found that spatial visualization and logical
reasoning were significantly related to geometry achievement and
geometric problem solving. Spatial visualization was significantly
related to D, V, N, and DRAW. Battista's (1990) study also showed
15

that males scored significantly higher than females on spatial
visualization, geometry achievement, and geometric problem
solving.
Fennema and Sherman (1977) disagreed with findings that
indicated males score higher than females in mathematics
achievement. They found that such studies had not controlled for the
individuars previous study of mathematics. They gathered
information for mathematics achievement, verbal ability, and
spatial visualization. They also gathered information on eight
affective variables as well as the number of mathematics related
courses taken, number of space related courses taken, and the
amount of time spent outside of school in mathematics related
activities. Fennema and Sherman found that by covarying out the
differences in affective measures eliminated the sex-related
differences in mathematics achievement. They found that spatial
visualization was as important to achievement as verbal ability.
When spatial visualization was covaried out, it eliminated existing
sex-related differences. However, when the difference between the
sexes in the number of space related courses taken was covaried
out, it eliminated the sex-related differencesMn spatial
visualization. The authors concluded that practice and relevant
experience are the factors in the differences between the sexes in
spatial visualization.
Cooper and Sweller (1989) examined the ability of students to
interpret different representations of three-dimensional solids. In
1 6

an earlier study Gaulin (1985) found that children represent three
dimensional solids in a variety of verbal, graphic, and mixed ways.
Cooper and Sweller gave seventh, nineth and eleventh grade students
eight different modes of instruction to assemble a three
dimensional solid. The eight modes were as follows; 1) layer plan
instructions, 2) coded plan instructions, 3) coordinates instructions,
4) elevation instructions, 5) verbal descriptions, 6) perspective
drawing, 7) verbal quasi-coordinate description instructions, and 8)
instruction card for a prototype. They found that students more
easily interpreted verbar descriptions, perspective drawings, and
actual solids. Perspective drawings and actual solids were more
easily interpreted than verbal instructions. There was no evidence
that students interpreted more easily prototypes than perspective
drawings. The authors suggested that teachers and textbook writers
needed to keep this in mind when choosing representations of three
dimensional solids. They did state that instruction and practice
should be considered for orthogonal (such as layer plan, coded plan,
and elevation instructions) representations of three-dimensional
solids since they are common.
Cognitive Structure In Learning Geometrv
Students structure geometric content differently. McDonald
(1989) determined the relationship between students' cognitive
development level and the way in which they structured geometric
content. Her study involved forty tenth grade geometry students.
Twenty were classified as formal operational students and the other
1 7

twenty as concrete operational students. Formal operators were
defined as those students who were "able to structure the abstract
principles within a given domain". The forty students were drawn
from a pool of one-hundred-sixty-one students who were given a
Piagetian formal reasoning test to determine their cognitive level.
To measure their cognitive structure they were given two tasks to
measure their understanding of similarity. The twenty students
with the highest combined score were identified as formal
operational and the twenty students with the lowest combined score
were identified as concrete operational. Five mathematics
educators were used as the expert group. The expert group was also
given the two tasks. To identify the way in which an individual
organizes subject matter, the results were recorded in map form
(matrices). The expert matrix was then compared to that of the
concrete and formal operational groups. The results of this study
showed significant differences in the way in which the students
organized subject matter. The concrete operational group showed
confusion with terms in similarity that could lead to confusion of
the concept. They also assumed that "relationships among terms
persist regardless of context". The formal operational group was
able to organize subject matter more like the expert group. As a
result of this study, McDonald warned that content may not be
properly assimilated if teaching occurs at a level beyond that of the
students. Teachers should look for ways to help students organize a
framework for the concepts and relationships.
1 8

Burger and Shaughnessy (1986) investigated the van Hieie
levels of development in geometry. The van Hiele levels include
level 0 (Visualization), 1 (Analysis), 2 (Abstraction), 3 (Deduction),
4 (Rigor). The researchers addressed three concerns, 1) whether the
van Hiele levels were useful in describing students' thinking process
on geometry tasks, 2) whether the levels could be characterized
operationally by student behavior, and 3) whether an interview
procedure could be developecl to reveal predominant levels of
reasoning on specific geometry tasks. Burger and Shaughnessy's
study involved forty-five students from three different states. They
ranged from early primary students to college mathematics majors.
The subjects of this study were interviewed in depth on triangle and
quadrilateral concepts. During the interviews the students were
asked to complete tasks which included drawing shapes, identifying
and defining shapes, sorting shapes, determining a mystery shape,
establishing properties of a parallelogram, and comparing
components pf the mathernatical system. The students were taped
during the interviews. Three researchers reviewed each tape and
assigned a van Hiele level from 0 to 3 for each task to each student.
The researchers then assigned a van Hiele level of reasoning to each
student. The researchers found that the levels were useful in
describing students' thinking process on poJygon tasks. They stated
that it would be necessary to investigate student responses on other
geometry tasks to determine if the van Hiele levels were useful in
19

other studies of geometry. Consistent behavior was found among
students assigned the same level on specific tasks.
Berger and Shaughnessy (1986) found that secondary students
were not grounded in basic geometry concepts. Students that were
at different levels used different problem solving approaches and
different language. According to the authors, if teachers were
teaching at a different level than that of a student, the result could
be a lack of understanding and consequently frustration and
discouragement. Senk(1989) agreed with Berger and Shaughnessy.
In her Study, Senk found that high school students' achievement on
standard nonproof geometry content was positively related to van
Hiele's levels of geometric thought. She also claimed that it was
possible for students, teacher, and textbook to be at different levels
in any one class.
Developing Soatial Visualization Skills
In their article, Talsma and Hersberger (1990) described a
course for geometry students, including instructional approaches
and exemplary materials. They found that even the brightest pre
geometry students lacked adequate background in geometry. They
stated that lack of geometry experiences was one reason that
students did not progress from one van Hiele level to the next. One
of their goals was to enhance the students' spatial ability. Their
curriculum outlined activities using work with rotational and
reflectional symmetry using paper folding and three dimensional
solids.
20
In their article on implementing the standards Senk and
Hirschhorn (1990) described how to teach similarity consistent with
the van Hiele model. They started with the visual model where
students drew figures and enlarged them by multiplying each side by
a constant. They also showed how to do this with coordinates. They
moved to the theoretical level, where similarity was done again by
enlarging but transformation and rotation was included. The authors
then showed how the lesson could move to show connections and
extensions. They modeled this by using the parabola.
Manipulatives
Friedman (1978) reported on the findings of several
researchers on the topic of manipulatives in the learning of
mathematics. Most of the results reported no significant
differences between scores of students instructed with
manipulatives and scores of students instructed with a non-
manipulative approach. These studies involved the use of
manipulatives in the learning of algorithms such as multiplication.
The only studies that showed a significant difference in favor of the
manipulatives approach were those involving children in the first
grade or younger. Friedman stated that educators should not careen
after the latest trend. However, he did mention that we should
continue efforts to determine the situations in which manipulatives
used was most effective.
Sowell (1989) compared the results of several studies to
determine the effects of using manipulatives in the learning of
21

mathematics. He found that there was a significant difference in
favor of the group using manipulatives when the use of
manipulatives lasted the entire year. He also found that studies
where the use of manipulatives were favored were taught by
teachers with extensive training or college professors. Cooper and
Sweller (1989) found that "perspective drawings of three
dimensional objects are internalized in the same way as the objects
themselves. "
22

PROJECTDESIGN ANDPROCEDURE
Lesson On The Need For Developing Spatial Visualization
Skills
LESSON I: THE NEED FOR SPATIAL VISUALIZATION SKILLS
Objective: Through group and class discussion, students will
determine the need for spatial visualization and spatial orientation
ski l ls.
1. Through class discussion, the definition of spatial
visualization as the ability to mentally manipulate an object will be
determined.
2. In their groups students will have the task of determining as
many professions or activities that use spatial visualization.
Students will be asked to explain why the chosen professions or
activities involve spatial visualization and spatial orientation
ski l ls.
3. As a class, the results will be put on the board and discussed.
23

Lessons on Developing Spatial Visualization Skills
LESSON II: POLYGONS
Objective: Students will discover the sum of the interior angles of
any n sided polygon and the measure of each interior angle when the
polygon is regular.
1. Review: Practice of previously learned material will
include using only a straight edge and a compass to construct
congruent segments, congruent angles, and perpendicular bisectors.
2. Expiorino sum of the measures of the angles in various
trianoles: Students will be given the task of constructing several
different triangles, acute, obtuse, isosceles, right, equilateral and
scalene. Using a protractor, students will be asked to determine the
sum of the angles of each triangle.
3. Verifvino the sum of the measures of the ancles in a triangle:
The teacher will ask students what other geometrical figures have
180°. Students will be guided to discuss the straight line and
supplementary angles. Students will be asked to conclude from their
experiments, what the sum of the angles in a triangle is. Teacher
will verify that the sum of the measures of the angles of a triangle
appear to be 180°. In their groups, students will be given task of
24

verifying the sum of the angles in a triangle through paper folcling.
Students will do this with several different types of triangles. See
figure 1 for example of paper folding.
4. Students will verifv and explain the formulas for the sum of
all the angles In any convex polygon and the measure of each interior
angle of a regular polygoh. Students will determine that the sum of
the measures of the angles of any n sided convex polygon is (n
2)180 and each angle of a regular polygon is [(n-2)180]/n by
completing worksheet 1 (See worksheet 1). Teacher will guide
students with the first 2 (or 3).
5. Extension (Student exercisesT
a. Students will be asked to make a model of as many
regular polygons as they can using only a straight edge and compass.
b. Students will construct six congruent squares and four
congruent regular triangles using only a compass, a straight-edge,
and a pair of scissors.
6. AoDlication: Students will be given the task of noting the
different road signs along their way home. These signs will be
discussed in class the following day. In their groups, students will
determine the measure of each angle of some of the signs and
25

discuss the possible reasons for selecting a particular sign for a
particular purpose.
7. Evaluation: Students will be asked to complete a log. The
log will contain three parts. In part 1, the student will express
what he/she has learned (Today I learned...). In part 2, the student
will express what puzzles or seems unclear to him/her (Something
that puzzles me is...). In part 3, the student will write what new
questions he/she has concerning the lesson (Something I would like
to know more about is...).
8. Teacher Recommendations: In order to connect this lesson to
the students' world an application problem and/or question should
precede the lesson. The problem and/or question should relate to the
students' world and the objective of this lesson. One such question
could be as follows:
What types of polygons are a part of our everyday life?
26

A"
/
A'
FIGURE 1
27

WORKSHEET1
#OF NAME SKETCH #0F SUM OF (REGULAB) (REGULAR) SIDES ■ '"'As., ALL EACH INT. EACH EXT.
INT ANGLE ANGLE
ANGLES
3
5
6
v... 8:
10
12 ■/ '■/ ■ ' ■
u ,

LESSON III: POLYHEDRA
Objective: Students will practice their spatial visualization skills.
1. Review from lesson I: Students will have the task of creating
three dimensional solids with the six squares and four triangles
from lesson I. The teacher will point out to students that the
tetrahedron and the hexahedron (cube) are referred to as platonic
solids or regular pGlyhedra because their faces are all congruent
regular polygons and their poiyhedral angles are all congruent.
2. Explorino the Collapsed Cube: In their groups, students will
sketch pattern layouts of the collapsed cube on orthogonal paper for
the cube. The class will discuss some examples of pattern layouts
that are the same, but flipped and/or rotated. Students will be
asked to make as many different layouts as possible. (See figure 2)
4. Exercising visualization with two dimensional sketches of
cube: Students will sketch the cube on isometric paper. Students
will be asked to:
A. label their vertices R, S, T, U, V, W,X , and Y on the cube.
B. imagine a cut through the midpoints of RS, ST, and SX
(See Figure 3).
C. describe the shape of the intersection and sketch the new
cut solid on isometric paper.
29
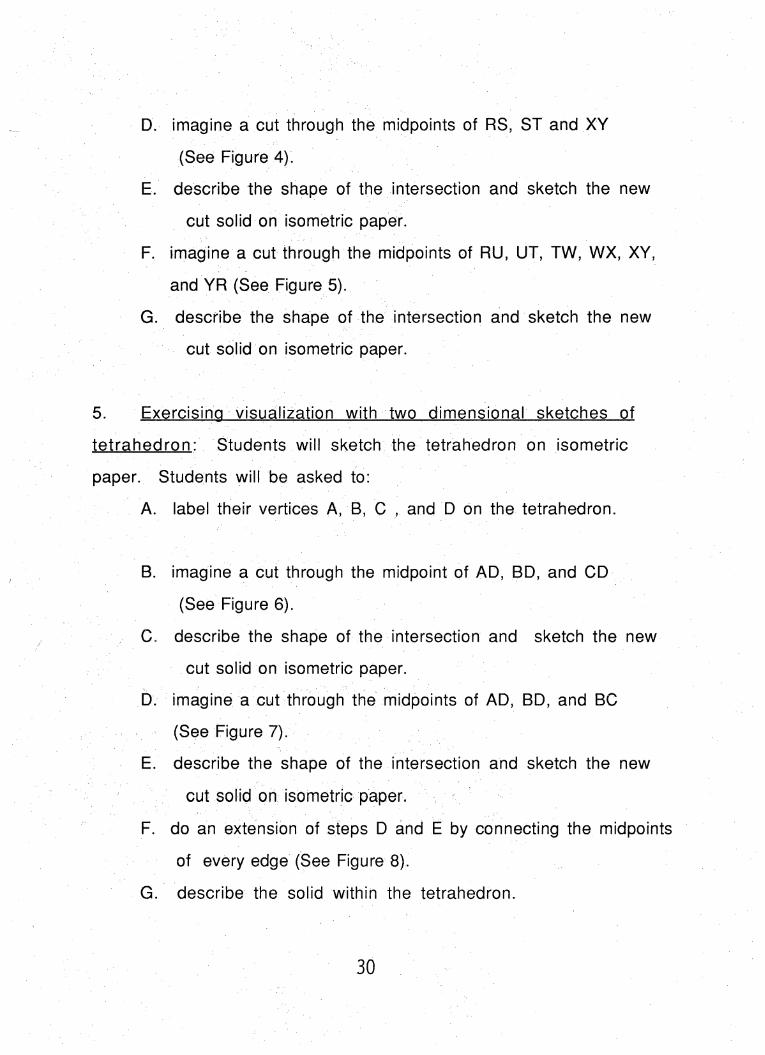
D. imagine a cut through the midpoints of RS, ST and XY
(See Figure 4).
E. describe the shape of the intersection and sketch the new
cut solid on isometric paper.
F. imagine a cut through the midpoints of RU, UT, TW,WX, XY,
and YR(See Figure 5).
G. describe the shape of the intersection and sketch the new
cut solid on isometric paper.
5. Exercising visualization with two dimensional sketches of
tetrahedron: Students will sketch the tetrahedron on isometric
paper. Students will be asked to:
A. label their vertices A, B, C , and D on the tetrahedron.
B. imagine a cut through the midpoint of AD, BD, and CD
(See Figure 6).
0. describe the shape of the intersection and sketch the new
cut solid on isometric paper.
D. imagine a cut through the midpoints of AD, BD, and BG
(See Figure 7).
E. describe the shape of the intersection and sketch the new
cut solid on isomethc paper.
F. do an extension of steps D and E by connecting the midpoints
of every edge(See Figure 8).
G. describe the solid within the tetrahedron.
30

6. Teacher Recommendations: Connect the students' world with
the objective of this lesson. The following are two suggestions for
lesson questions-
Name geometrical solids that are a part of our everyday
life from the moment that we wake up to the moment we go to
sleep.
As a class or in cooperative groups discuss and list
geometrical solids in our world that appear to be cubes
with vertices cut off.
31

• • • • • • • • • • • • • • •
• • •
• • • • •
• • •
• • • • • • •
FIGURE 2
32

"V
• X • FIGURE 3
FIGURE
\
FIGURt 5
33

A B
FIGURE 6
fc::
• FIGURE 7
/
FIGURE 8
34

LESSON IV:EULERSFORMULA
Objective: Students will discover Euler's formula for convex
polyhedra.
1. From lesson II: Reference will be made to the isometric
sketches they did in lesson II. Students will count vertices, edges
and faces on the two dimensional sketches they made of
tetrahedrons and hexahedrons with cuts made through different
midpoints. A list of V, E, and F will be made on the board. Students
will be asked to check for any possible pattern.
2. Exploring Euler's formula: Students should make their own
three dimensional models of the pyramids and prisms listed in
Worksheet 2. Using these models, students will start entering data
on Worksheet 2 by counting faces, edges, and vertices. Students
will be asked to come up with and make three other polyhedra of
their own and complete the table using the information obtained
from their own polyhedra.
3. Explain: Students will explain their conclusion from the data
they gathered in the above table.
4. Extension and verification with spatial visualization:
Students will be asked to use their cubes from lesson II and imagine
35

a small piece cut off of each of the corners. Students will then
count the number of vertices, edges, and faces and determine that
the results support Euler's formula.
5. Evaluation: Students will be asked to add to their student log,
addressing each of the three parts, (1) Today I learned... , (2)
Something that puzzles me is... , (3) Something I would like to know
more about is...
6. Teacher Recommendations: If time is short, this lesson could
be considered optional. This lesson will help students consider and
recognize the various parts of polyhedra but the overall goals and
objectives of this unit can be met without this lesson.
36

WORKSHEET
EULER'SFORMULA
Number of Number of
Number of
Polyhedron Faces Edges Vertices
Square Prism
Square Pyramid
Hexagonal Pyramid
37

LESSON V:PLATONICSOLIDS
1. From lesson II: Reference will be made to the original cube
and tetrahedron constructed by the students. The teacher will point
out that there are three other platonic solids besides the cube and
the tetrahedron.
2. Exploring and explaining the number of faces and the shapes of
the faces in the remaining platonic solidS: Teacher will inform the
students of the names of the remaining three platonic solids,
octahedron, dodecahedron and icosahedron. Students will determine
the number of faces of each by their name. Worksheet 3 will be
completed by the class through discussion;
3. Extension: In their groups, students will be asked to construct
the octahedron, icosahedron and dodecahedron by developing the best
possible layouts of them, cutting them and taping them together.
4. Evaluate: Students will be asked to add to their logs.
5. Teacher Recommendations: If time is short, this lesson could
be considered optional. This lesson can help students identify uses
of the platonic solids in the future. For example, Platonic solids are
used to describe the shape of some matter. However, the goals and
objectives of this unit can be met without this lesson.
38

WORKSHEETS
PLATONIC SOLIDS
Regular Number of Shapes of Polyhedra Faces Faces
Tetrahedron
Hexahedron (Cube)
Octahedron
Dodecahedron
Icosahedron
39

LESSON VI: APPLICATION AND ASSESSMENT
The Geodesic Dome is a network of triangles joined together to form
an enclosed space resembling a sphere. Spheres hold a greater
volume than other containers with the same surface area, but they
are also stronger even though they have no internal support. The
Geodesic Dome was patented by R. Buckminster in 1947 (Jugenson,
Brown & Jugenson, p.450-451).
Question for discussion: If Geodesic domes are stronger
without internal support and they hold a greater volume, why are
they not as popular as homes?
ASSESSMENT: In their groups, students will complete the following
project:
1. Using the octahedron from lesson V, make an isometric
drawing of it.
2. On the drawing cut each of the six corners off, as if a plane
were driven through each corner.
3. Make a three dimensional representation of your new solid.
4. Have students discuss the name of the solid created.
40

Lessons on perimeter and area of triangles and
quadrilaterals
LESSON VII:PERIMETER AND AREAOFSQUARESAND RECTANGLES
Objective: Students will discover how to find the area and
perimeter of triangles and four sided polygons such as squares,
rectangles, parallelograms, and trapezoids. Students will learn the
meaning of area and perimeter.
1. Review: In class discussion, students will review the
following:
or or
Length = 1 unit =^2 units Length = V5
11 102
= 1 sq Area = 1/2 sq unit Area = 1 sq unit
2. Students will explore the length of the sides, perimeter and
area on Worksheet 4. They will record their findings on Worksheet 5.
41

3. Students will explain their findings and discover formulas for
area and perimeter of a square and rectangle from the above
exploration.
LESSON VIII: PERIMETER AND AREAOFTRIANGLES
1. Students will explore the length of each side, height, perimeter,
and area for each triangle on worksheet 6. They will record their
findings on Worksheet 7.
5. Students will explain their findings and discover formulas for
area and perimeter of a triangle from the figures on worksheet 6.
LESSON IX:PERIMETER AND AREA OFPARALLELOGRAMS
1. Students will explore the length of each side, height, perimeter,
and area for each parallelogram on worksheet 8. They will record
their findings on worksheet 9.
2. Students will explain their findings and discover formulas for the
area and perimeter of a parallelogram for the figures on worksheet
8.
42

LESSON X:PERIMETER AND AREA OFTRAPEZOIDS
1. Students will explore the length of each side, height, perimeter,
and area of each trapezoid on worksheet 10. They will record their
findings on worksheet 11.
2. Students will explain their findings and discover formulas for the
area and perimeter of trapezoids from the figures on worksheet 10.
3. Extension: Students will find the perimeters and areas of unusual
figures. See worksheet 12.
7. Evaluation: Students will write in their learning logs.
8. Teacher Recommendations: Prior to starting this lesson on
areas and perimeter ask a question that will connect this lesson to
the students' world. One such question could be as follows:
What is area? Why do we need to know what area is? Discuss
in your groups four different things that take up area and
determine how many of them you would need to cover the back
wall of this classroom.
43

• • •
• • •
2)
) a
5)
aa
7)
WORKSHEET 4
44

WORKSHEET 5
Length Length ' Length Length Perimeter Area
of a of b of c of d
FIGURE#1
FIGURE#2
FIGURE#3
FIGURE#4
FIGURE#5
FIGURE#6
FIGURE#?
' ' . ■ ■ ■ .
Formula for perimeter of square. .,of rectangle.
Formula for area of square of rectangle.
45

5
7
9)
8)
WORKSHEET 6
46

WORKSHEET?
PERIMEl"ER AND AREAOFA TRIANGLE
Length , Length Length Perimeter Height Area
of a of b of0 to a
TRIANGLE #i
TRIANGLE #2
TRIANGLE #3
TRIANGLE #4
TRIANGLE #5
TRIANGLE #6
TRIANGLE #7
TRIANGLE #8
TRIANGLE #9
Formula for
perimeter of a trianale area of a trianale

c
1) 2)• • » ■ll.r , • • ■
d c,
6)
5)
WORKSHEET 8
48

WORKSHEETS
PERIMETER AND AREAOFPARALLELOGRAMS
Length of a & b
Length of c & d
Perimeter Height to a
' Area
PARALLELOGRAM #1
PARALLELOGRAM #2
PARALLELOGRAM #3
PARALLELOGRAM #4
PARALLELOGRAM #5
PARALLELOGRAM #6
Formula for perimeter of a parallelogram
Formula for area of a
parallelogram
49

•'
• '
•
•
bJ h7f
bft
hi
3
hi
bl
4
bl
bl
,b2
b2» b2
WORKSHEET 10
50

WORKSHEET 11
PERIMETER AND AREAOFTRAPEZOIDS
Length Length Length Length Perimeter Height Area
of a of c of b1 ofb2 to b1
#1
#2
#3
#4
#5
#6
#7
Formula for perimeter of a trapezoid
Formula for area of a
trapezoid
51

WORKSHEET 12
52

WORKSHEET12
Perimeter Area
Figure 1
Figure 2
Figure 3
Figure 4
53

LESSON XI:APPLICATIONS AND ASSESSMENT
Office space is leased by square foot. An art gallery on a limited
budget would want to rent space with the greatest possible
perimeter without increasing the square footage to display art on
the wall.
Question for discussion: If the art gallery could only afford
600 square feet, what would be the ideal layout for a maximum
perirheter?
In their groups, students will determine other applications. These
be put on the board and discussed as a class.
ASSESSMENT: You have found the perfect paint for your roorh. It
sells for $18.95 per gallon, each gallon paints 400 square feet. Make
an isometric sketch of your bedroom with all dimensions. Make a
separate sketch for the closet. Determine how much it would cost
you to paint your bedroom (& closet). Students will work in their
groups, but each student will turn in a project.
54

Lessons on volume and surface area of polyhedra
LESSON XII: VOLUME ANDSURFACE AREA WITH MORESPATIAL
VISUALIZATION
Objective: Students will learn the meaning of volume and how to
make two dimensional representations of three dimensional
rectangular objects with a given volume.
Lesson Question: Our school doesn't have any lockers. Where in our
school is there unused space (volume) that could be used for
lockers? How many lockers could we fit in that space? How big is
each locker? How much wall space would it take? How much floor
space would it take? How much would it cost the district?
1. Review: Students will use their cubes from lesson II to review
the area of each face, the total surface area and the volume of the
cube if each side had a measure of 1 unit.
!2. Explore: In their groups (groups of 4), using plastic cubes,
students will build three dimensional representations of the
isometric drawings from Worksheet 13. After building, students
will draw a duplicate isometric representation of the solid. ■ /
Students will make net layouts of each figure to verify surface area.
55

Students will log surfaGe area and volume for each (See worksheets
13 & 14).
3. Explain: Each group will log their findings on the board. Class
will discuss the relationship (or lack thereof) pf surface area with
volume.
4. Extension: Each group will be given a different volume. Each
group will make a three dimensional model of the given volume by
using plastic cubes. Each group will log volume and surface area of
their model on the board. They will be instructed to double every
dimension (length, width, and height). Students will then log their
new surface area and volume. The class will discuss the effects of
doubling the dimensions on the surface area and volume.
5. Evaluation: Students will complete their learning logs.
56

WORKSHEET 13
57

5)
.6)
WORKSHEET 13
58

WORKSHEETS
SURFACEAREA AND VOLUMEOFSOLIDS
Figure Perimeter Height Lateral Area Total Volume
of Base Area of Base Area
1
2
3
4
5
6
59
LESSON XIII: APPLICATIONS AND ASSESSMENT
A six foot man weighs 175 pounds (volume) and a cross section of
his leg bone is approximately .75 square inch (area). If he were
twice as large, how much would he weigh and what would be the
area of the cross section of his leg bone?
Question for discussion: What kinds of physical problems
would giants have?
In their groups, students will discuss and record other applications
of surface area and volume. These will be put on the board and
discussed.
ASSESSMENT: In their groups, students will discuss what would be
an ideal swimming pool. They will make an isometric drawing with
all dimensions, determine how many gallons of water it would hold
and how much it would cost to fill it.
60

Overall Assessment
1. A short spatial visualization test will be given to the students
in four high school geometry classes (See table 3). Two of the
classes will be students with whom this field-tested unit was
taught and two classes will be control groups.
2. Students will be asked to complete the same phrase they
completed earlier in the year (4 months prior to this field tested
unit). That phrase is; "I feel that geometry is..."
61

ANALYSIS OF DATA
This field-tested unit was taught in two high school geometry
classes in a Southern California high school in a rural area of
Riverside County, California during four weeks of the spring
semester of the 1992/93 school year. The high schooi had a student
population of approximately three-thousand students. The total
number of students In the two geometry classes was sixty-seven.
Lesson I: The Need for Spatial Visualization Skills
The objective of lesson I was for students to deterrnine
activities and professions/careers that make use of spatial
visualization skills. The class started with a discussion of spatial
visualization. Some students expressed spatial visualization as the
ability to change one's visual angle. They pointed to posters of
visual illusions in the room. Students in the class who were also
enrolled in drafting were able to explain that spatial visualization
was also the ability to move objects and picture them in your mind.
This supported one of the conclusions made by Fennema and Sherman
(1977). Students enrolled in other classes that involve spatial
visualization do better in activities involving spatial visualization.
In determining the activities and professions/careers that make use
of spatial visualization, students started by listing applications
such as architecture and careers such as geometry teaching. It did
not take long for students to pick up ideas from each other. They
realized on their own the many applications of spatial visualization
in professions/careers and in their everyday life activities such as
62

video games and driving. (See Table 4). This lesson was effective in
achieving the objective because the need for spatial visualization
was determined by the students themselves.
Lesson II: Polvoons
The objective of this lesson was to have students discover on
their own the formula for finding the sum of the measures of the
interior angles of any convex polygon, the measure of each interior
angle of a regular polygon and the measure of each exterior angle of
a regular polygon. Students had the opportunity to do some hands-on
activities. They measured angles and verified the sum of the angles
of a triangle through paper folding. Traditionally, sum of angles in a
triangle was taught by presenting it verbally or written as a
theorem. In doing so, we deprived the students of geometry
experiences (Talsma and Hersberger, 1990). Most of the students
were already aware that the sum of the angles in a triangle is 180°.
After doing the actual measuring and paper folding students were
confident and were eager to help each other in determining how to
fold the obtuse triangles. They used these verified facts and
Worksheet 1 to determine the equations for angles of polygons.
Since they were confident in the Sum of the measure of the angles in
a triangle, they were able to easily apply that knowledge to
determine facts of any polygon. See Worksheet 1. Students were
able to note applications of this by making note of road signs, their
shapes, and their angles.
63
Lesson III: Polvhedra
The objective of this lesson was to have the students practice
their spatial visualization skills. Students created three
dimensional solids and sketched two dimensional representations of
the solids on isometric dot paper. Students practiced visualizing
planes cutting into the solids. Once again two dimensional
representations were drawn of the cut solids. Students created
three dimensional solids of the sketched cut solids. Cooper and
Sweller (1989) stated in their study that students more easily
interpreted perspective drawings and actual solids. Students did a
great deal of interacting and helping each other in their groups
during this lesson. Some students were better at visualizing three
dimensional objects and sketching representations of them. Most of
the students that were better at this were also enrolled in drafting
or art. This supported findings by Fennema and Sherman (1977) that
students that tend to do better at spatial visualization tasks have
had other classes or experiences that involve spatial visualization.
In their learning logs, students reported that they learned and
enjoyed practicing spatially visualizing. Some students questioned
(in their journals) why the beginning of geometry could not be more
"like this". The first semester of this geometry course emphasized
definitions, theorems and formal proofs. This lesson appeared to be
successful in achieving the objective based on the student journal
entries. Students experienced geometry by direct hands-on
constructing and sketching.
64

Lesson IV and V: Euler's Formula and Platonic Solids
The objectives of these lesSons were to have students
discover Euler's formula (vertices + faces = edges + 2) and to have
them determine the number of faces, edges and vertices of the five
platonic solids. After making the table of vertices, faces, and edges
students were able to determine that v + f = e + 2. See worksheet 2.
Students were then given the opportunity to create a three
dimensional solid of their own to verify the formula. Students
applied this to determine the number of faces, edges and vertices in
the octahedron, dodecahedron, and icosahedron. Students formulated
on their owtl. They also constructed three dimensional solids.
According to the NCTM Standards, students Can approach learning
creatively and independently through these methods of instruction
(p. 128). The students expressed that they enjoyed learning by
"making things". One question asked by several students was, "Can
we do things like this for the rest of the year?"
Lesson VII - X: Lessons on area and perimeter of trianales and
0uad rilaterats
Students were given worksheets with triangles, squares,
rectangles, parallelograms and trapezoids on dot paper. Students
had to determine perimeters by counting along the edges and areas
by counting Squares within the polygon. The developing of formulas
was left up to the students. Students were at different cognitive
levels. Some students were still at the first van Hiele level of
visualization. These students were not sure what it was they were
65

suppose to be counting to determine area. Some students wanted to
count the dots while other students wanted to count the segments
connecting the dots. There was a great deal of interaction during
these lessons. Students were helping each other. Traditionally,
lessons on area and perimeter were taught by introducing and then
applying a formula. Students that were not sure what area meant
imay have been able to apply a formula and not learn what it was they
were doing. After completing this lesson, all students were able to
explain the difference between area and length. They understood
that square units referred to area because it described the number
of squares it took to fill in the polygon. See worksheets 4 through
12. These lessons appeared to be successful in achieving the
objectives based on entries in student learning logs where students
were able to express their understanding of area and perimeter.
They also served as a review and an application of the pythagorean
theorem.
Lesson XI: Applications and Assessment
The objective of this lesson was to have the students apply
what they had learned and to assess what they had learned through a
project. Students were given the task of determining how many
square feet would heed to be painted in their bedroom, make a
Sketch, and determine the cost in paint. The next day students came
in with their sketches. Most of the students had everything already
calculated, square footage and cost of paint. Some students wanted
to know how to determine square footage on walls where there was
66

a window or a permanent bookcase. Students worked in groups to
help each other answer these questions. Based on the number of
students who completed this project, this lesson appeared to be
successful in achieving the objective. All students eventually
completed the assignment. Students applied finding area to
something in their own world and they were successful in
completing a project that they would actually have to carry out
someday.
Lesson XII: Volume and Surface Area
The objective of this lesson was for students to learn the
meaning of volume and surface area. This lesson was started with a
problem that directly related to the students world. The high school
didn't have any lockers. Students were asked where in the school
could lockers be placed and take up unused space (volume). They
were asked questions relating to the problem such as: a) How many
lockers could fit in that space? b) How much wall and floor space
would they take? and, c) How much would it cost? This problem
started a class discussion and generated other questions. Measuring
tapes and the trundle wheel were taken out within minutes in an
attempt to get more information. The discussion in the classroom
turned from a hypothetical geometry problem to one which was real
and could be solved.
Students determined surface area and volume of sketched
three dimensional solids (See worksheet 13). Students who
struggled were given plastic cubes to build the solid. Once they
67

built the solid, they were easily able to complete the task of
determining surface area and volume. Some students who were able
to determine the surface area and volume without the cubes wanted
to use the cubes to verify their numbers. This supported the
findings by Cooper and Sweller (1989) that actual solids were
interpreted more easily by students. This lesson appeared to be
successful at meeting the objective based on the number of students
on task and the number of students that completed the project.
Through some practice, students were able to determine the
difference between surface area and volume. This lesson also made
the connection between their world and geometry through the
applied projects.
Lesson XIII: Applications and Assessment
The objective of this lesson was for the students to apply
what they had learned throughout the unit and assess this learning
through a project. Students were given the task of designing their
ideal swimming pool, determining the cost of plastering or painting
the walls, and determining the cost of filling the pool with water.
Some students still did not dare to explore and they created a
rectangular pool with one depth throughout the entire pool. Most
students wanted to create something different. There were
rectangular pools with lap pools extending from them. There were
multi-level pools. One student created a pool to form a dollar sign.
There was a triangular pool. Students were coming into the
classroom during lunch wanting help in creating an idea still in their
68

mind. Questions were generated that were discussed as a class.
Examples of some of those questions were; What is the cost of
water?, How do we convert gallons to cubic feet?, What is the cost
of plaster?. What is the cost of pool paint?. What if I want an
Olympic size pool?. What are the dimensions of an Olympic size
pool? Students were asking questions of their parents, the science
teachers, and the swimming coaches.
This lesson was successful in connecting the material learned
throughout this unit with the students world through application in
the project.
69

ASSESSMENT ANALYSIS
Description of Assessment
The unit developed for this study was taught to two high
school geometry classes and was assessed with a multiple choice
spatial visualization test (See table 3) /Mechanical Aptitude and
Spatial Relations Test. Joan U. Levy and Norman Levy, pp. 72-73).
The test was used with permission from Simon and Schuster (See
appendix B). The test consisted of eight box unfolding exercises
administered to both the intervention classes and to two other
geometry classes from the same high school as a control. Fifty-one
students were tested from the intervention group. Forty-five
students were tested from the control group. (See table 5). Fifty-
two percent of the students in the control group and thirty-five
percent of the students who received the intervention had a perfect
score on the test. However, eighty percent of the students in the
control group and eighty-two percent of the students from the
intervention group responded incorrectly to two or less of the
problems. Based on the number of students who answered two or
less problems incorrectly there appeared to be no difference
between the control group and the students taught from this unit.
However, the students taught from this unit and the control group
were not matched demographically and the results were not tested
for significance. The findings provided a preliminary indication that
there is no apparent difference in spatial visualization skills
between a traditionally
70

taught high school geometry class and a class taught with this
NCTM-based unit. These findings should be verified with further
study using larger matched samples, longer NCTM-based
Interventions, and analyzed for statistical significance.
Journal Entries
Students were asked to write In their journals and express
their opinion as to whether or not geometry Is useful. The control
group was asked to complete the same journal writing assignment.
A total of fifty-three students responded from the group that
received Intervention and a total of fifty-two students responded
from the control group (See table 6). The responses were grouped
Into one of three categories. Those categories were, 1) yes,
geometry Is useful In everyday life, 2) geometry Is useful only in
certain professions, and 3) no, georhetry Is not useful at all.
From the control group twenty-five percent responded that
geometry Is useful In everyday life. Most of these students were
able to cite experiences such as helping their father lay cement or
helping build a barn. Fifty-four percent responded that geometry Is
useful only If you plan to be an architect or a geometry teacher.
Nineteen percent responded that geometry is a waste of time and
there Is no need for It. One student responded that he/she was not
sure as to whether It Is useful or not. From the intervention group
of students, sixty-four percent responded that geometry is useful in
their everyday life. Twenty-five percent responded that geometry is
71

only useful for certain professions, and eleven percent responded
that geometry was not useful at all.
These preliminary findings in journal entries appear to
indicate that the unit was successful in helping students see the
usefulness of geometry in their lives. One student that responded
positively to the usefulness of geometry expressed that she liked
geometry because she liked the environment in which she lives.
These preliminary findings that indicate positive results in student
attitudes toward geometry were not tested for significance.
However, they do suggest that further research be done to determine
if there is a significant difference in student attitudes toward
geometry when the learning is student centered as suggested by the
NCTM Standards.
Report on Researcher's Observations on the Implementation of
Proiect Desion
The most often asked student question did not come up in
mathematics class during this unit; "When are we ever going to use
this?!" It was also observed that students did a lot of interacting
with each other. The most feared problem of being off task was not
present when the learning was connected to the students' world. In
observing the students doing and experiencing geometry, it was
evident that students often apply formulas without knowing what
they were doing. Student responses, such as "I like this" or "This is
fun", to learning that traditionaily had been greeted with
complaining, verified that learning can be connected to the students'
72

world and accomplish the goals of knowledge and skills traditionally
associated with a geometry course.
73
CONCLUSIONS
The preliminary findings in the assessment of this field-
tested unit indicated that there was no difference in spatial
visualization skills as measured by a multiple choice spatial test
between classes taught geometry concepts using the traditional
method and classes taught with this field- tested unit. However,
there are three factors that need to be addressed. First, this field
tested unit was only four weeks long. It is possible that there could
have been a significant improvement in spatial visualization skills
if students were taught with an emphasis on the NCTM Standards
throughout the year. Second, the test used for assessment was box
unfolding. There is more to spatial visualization than the ability to
mentally fold or unfold a box. Last, the results from this study were
not tested for significance. These are preliminary findings with
preliminary indications to be studied further.
The student journals indicated a difference in student
attitudes toward geometry and its usefulness. A greater percentage
of the students who received the intervention expressed opinions
that geometry was relevant to their lives than did the students in
the control group. A difference in student attitude could mean a
difference in a choice of careers or in electing future mathematics
classes. According to the NCTM Standards, businesses are no longer
looking for strong backs and hands. New jobs require that employees
see the applicability of mathematical ideas to common problems and
that they believe in the utility and value of mathematics (pp. 3-4).
74

The goal of this study was to field-test a geometry unit based
on the NCTM Standards. Preliminary findings of this study suggest
positive results in student attitude toward geometry. Other findings
suggest that there is no difference in spatial visualization skills
when compared to a control. Further study to confirm these findings
and establish statistically significant differences are recommended.
This research suggest two questions to be studied further.
First, do students taught geometry skills with an emphasis on the
NCTM Standards (three-dimensional geometry and real world
applications) improve significantly in spatial visualization skills
compared to students taught traditionally? Secondly, is there a
significant improvement in student attitude toward the usefulness
of geometry when the course is taught with an emphasis in real-
world applications and student-centered instruction as suggested by
the NCTM Standards?
75
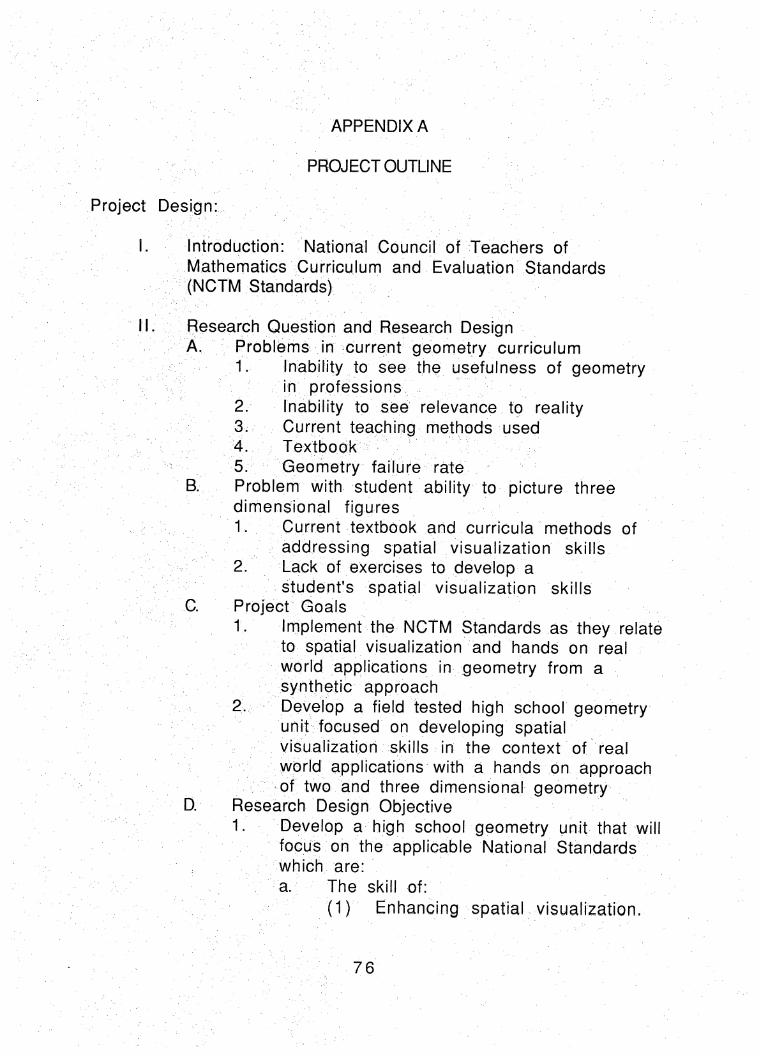
APPENDIX A
PROJECTOUTLINE
Project Design:
I. Introduction: National Gouncit of Teachers of
Mathematics Curriculuni and Evaluatidn Standards (NCTM Standards)
II. Research Question and Research Design A. Problems in current geometry curriculum
1. rnabllity to see the usefulness of geometry in professions
2. Inability to see relevance to reality 3. Current teaching methods used 4. Textbobk
5. Geometry failure rate B. Problem with student ability to picture three
dimensional figures 1. Current textbook and curricula methods of
addressing spatial visualization skills 2. Lack of exercises to develop a
student's spatial visualization skills C. Project Goals
1. Implement the NCTM Standards as they relate to spatial visualization and hands on real
world applications in geometry from a synthetic approach
2. Develop a field tested high school geometry unit focused on developing spatial viSualizatioh skills in the context of real world applications with a hands on approach of two and three dimensional geometry
D. Research Design Objective 1 • Develop a high school geometry unit that will
focus on the applicable National Standards which are:
a. The skill of:
(1) Enhancing spatial visualization.
76

(2) Improving ability to solve problems in their environment
(3) Interpreting and drawing three dimensional objects
b. Make use of a variety of pedagogical strategies, specific reference to: (1) Small groups (2) Project work (3) Active involvement of students in
constructions and applications of geometrical ideas
2. Improve student attitudes which include: a. Empowering the student to break from
inappropriate mind sets as a result of developing spatial visualization skills
b. Making student comfortable in taking risks when attempting to solve problems
c. Showing students the importance of geometry in a variety of professional fields
d. Improving the students attitude toward geometry
E Research Design: To Develop and Assess a Curriculum using the following criteria: 1. Mathematical Skills
a. Construction of two dimensional
polygons with compass and straight edge
b. Creating three dimensional models c. Making two dimensional sketches from
three dimensidnal models d. Constructing three dimensional models
from two dimensional sketches e. Discovering area and perimeter
formulas for triangles and quadrilaterals
f. Discovering formulas for surface area and volume of rectangular solids
77

2. Pedagogical Strategies a. Cooperative Learning: Small groups b. Kinesthetic: Hands on Minds on active
involvement of students in
constructions and applications of geometrical ideas
c. Project work 3. Attitudinal Outcomes
a. Empower students to break from inappropriate mind sets
b. Emotional effects from experiences: Making students comfortable in taking risks
c. Connecting student interest and creativity to spatial visualization: Showing students the importance of geometry in a variety of professional fields
d. Improving student attitudes toward geometry
4. Student Assessment
a. Student Outcomes
(1) Spatial Visualization Test (2) Attitudinal results through
journal b. Analysis of Lessons
(1) Each lesson (2) Overall unit
Review of the Literature
A. Mathematics achievement related to spatial visualization
B. Geometry achievement related to spatial visualization
C. Cognitive structure in learning geometry D. Developing spatial visualization skills E Manipulatives
78

IV. Project Design and Procedure A. Lesson on the need for developing spatial
visualization skills
B. Lessons on developing spatial visualization skills 1. Polygons
a. Properties of polygons b. Constructing polygons
2. Polyhedra a. Constructing a model of a cube and a
tetrahedron
b. Sketching pattern layouts of the collapsed cube and collapsed tetrahedron
c. Making two dimensional isometric sketches of models
3. Euler's Formula
4. Platonic Solids
5. Application 6. Assessment
C. Lessons on perimeter and area of triangles and quadrilaterals 1. Perimeter and area of squares and rectangles
using dot paper 2. Perimeter and area of triangles and
parallelograms using dot paper 3. Perimeter and area of trapezoids. 4. Application 5. Assessment
D. Lessons on volume and surface area of polyhedra 1. Drawing two dimensional sketches on
isometric paper of different three dimensional models.
a. Sketching net patterns of models to represent surface area
b. Determining volume from models and surface area from net patterns
2. Application 3. Assessment
79

E Overall Assessment
1. Spatial Visualization Test 2. Attitudinal results through journal
V. Analysis of Data A. Lesson I: The need for spatial visualization skills B. Lessons II: Polygons C. Lessons III: Polyhedra D. Lesson IV and V: Euler's formula and platonic solids E Lesson VII - X: Lessons on area and perimeter of
triangles and quadrilaterals R Lesson XI: Applications and assessment G Lesson XII: Volume and surface area H. Lesson XIII: Applications and assessment
VI. Assessment Analysis A. Description of assessment B. Journal entries
C. Report on researcher's observations on thE implementation of project design
VI I. Conclusion
80

APPENDIX B
Table 1
Geometry Student Journal Responses
Student Completion of the statement: "I feel geometry is ."
Necessary for College 3
Enjoyable and Useful 8
Useless 4
Frustrating and Difficult 34
Other Responses 5
Total Number of Students Surveyed 54*
^Number of Students Differ in Tables According to Daily Attendance
81

Table 2
A Southern California High School Geometry Enrollment 1991/1992
Number of students
enrolled in Geometry in September 1991 183
Number of students that
dropped Geometry in January 1992 66
Number of students
remaining in Geometry in February 1992 117
Number of "D"s issued in
Geometry in June 1992 17
Number of "F"s issued in
Geometry in June 1992 24
82
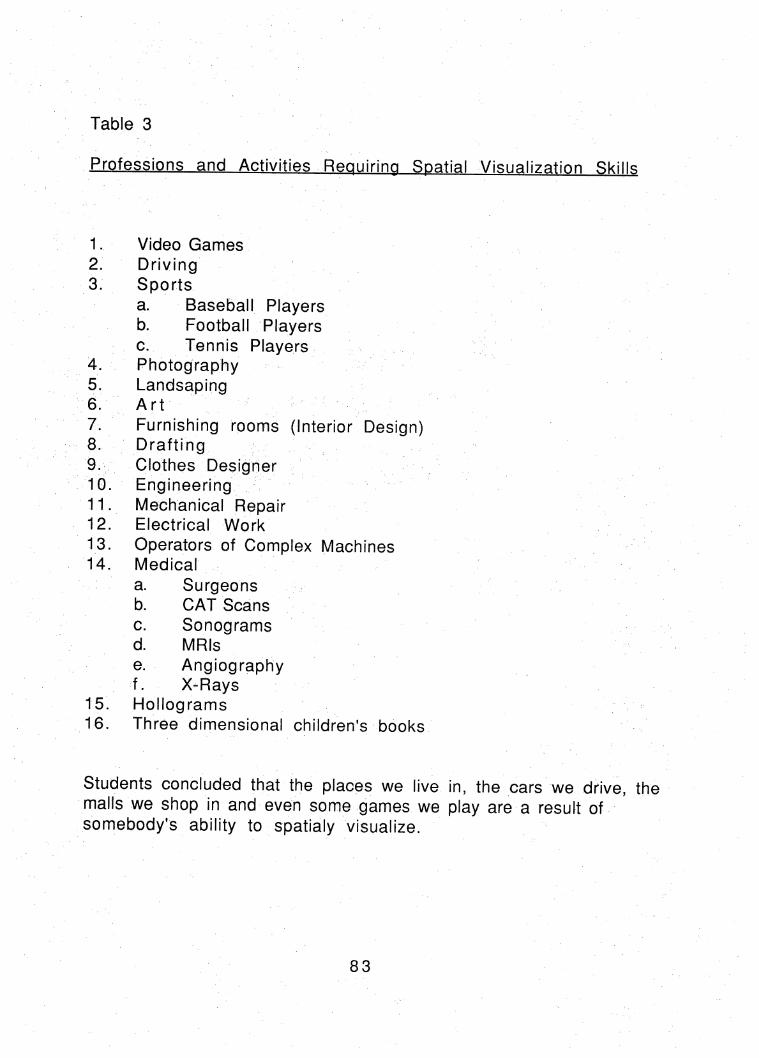
Table 3
Professions and Activities Requiring SDatial Visualization RkillR
1. Video Games
2. Driving 3. Sports
a. Baseball Players b. Football Players c. Tennis Players
4. Photography 5. Landsaping 6. Art
7. Furnishing rooms (Interior Design) 8. Drafting 9. Clothes Desigher 10. Engineering 11. Mechanical Repair 12. Electrical Work
13. Operators of Complex Machines 14. Medical
a. Surgeons b. CAT Scans
c. Sonograms d. MRIs
e. Angiography f. X^Rays
15. Hollograms 16. Three dimensional children's books
Students concluded that the places we live in, the cars we drive, the malls we shop in and even some games we play are a result of somebody's ability to spatialy visualize.
83

Table 4 •
Results of Spatial Visualization Multiple Choice Einht-Probiem Test
Number of Incorrect
0
1
6
Total Number of Students*
Group taught with field-tested unit
18
3
1
0
5
Control group
24
,'/■ 8 ■ ; -v 4. ./vy
3
: • 3
2
45
*Number of Students Differ in Tables According to Daily Attendance
84

Table 5
Results of Survey on Usefulness of Genmfttrv
Response Group Taught From Control Group
Field-Tested Unit
Useful in everyday life 34 13
Useful only in certain professions/careers 13 28
Not useful at all 6 10
Don't Know
1
Total Number of Students* 53 52
'Number of Students Differ in Table According to Daily Attendance
85

APPENDIX C
» /
©
j;peih/Atotoy Icffil
''KTIV.box UNFOLOING
.•»*thomb,̂tortSTblTi?
"****^ Wato« fonr^u^r^SZ - - - ww^j>. wwrr Jftrfir
©
♦ « « »
*
© « «
» »
«
86

I
:
oi
♦0
I :
a
o
U
r!0
Z| O
:
0
OQ
OQ
ca
r-
oo
O
O
D
©
0
0

April 15, 1993
Ms Alice Gorring,
Per our phone conversation on April 15, 1993 at approx.6:45 a.m. pacific time, I would like to request permission to copy the following:
Title 01 Book, nechamcal Aptitude and Spatial Relations Tests
Authors: Levy,Joan U. and Levy,Norman
Pages to copy. Pages 72 and 73
Purpose: Give test to four high school geometry classes of 36 students each at a Southern California high school. The
results of the test and a copy of the test will be published in a Masters'thesis at California State University,San
Bernardino.
Date Needed: i would appreciate it if 1 could get this permission as soon as possible. I am willing to pay a fee to e,xped1te.
Thank you and Sincerely,
Stella Sloan
11972 Kingston Grand Terrace,California 92324 Phone(9091763~0650
Fax (.909)763-6714
HS. SLOAN:
Permission is granted for above use.
Al » I tty Contracts Administrator. Arco Publlshing-A Division of Slinon A Schuster April 15. 1993
'moma cinw noow annc
88
REFERENCES
Battista, Michael T. (1990). "Spatial Visualization and Gender Differences in High School Geometry". Journal For Research in Mathematics Education. January 1990, pp 47-60.
Bishop, A.J. (1980). "Spatial Abilities and Mathematics Education: A Review". Educational Studies in Mathematics. 11, 257-269.
Branca, Nicholas A. (1980). "Communication of Mathematical Structure and Its Relationship to Achievement". Journal For Research in Mathematics Education. January 1980, pp 37-49.
Burger, William F. and Shaughnessy, J. Michael (1986). "Characterizing the Van Hiele Levels of Development in Geometry". Journal for Research in Mathematics Education. 7, 31-48.
Cooper, Martin and Sweller, John (1989). "Secondary School Students' Representation of Solids". Journal for Research in Mathematics Education. 20, 202-212.
Crosswhite, Joe, F. (1990). "National Standards: A New Dimension in Professional Leadership". School Science and Mathematics. 90 (6), 454-465.
Crosswhite, Joe F., Dossey, John A., Frye, Shirley M.(1989). "NCTM Standards for School Mathematics: Vision for Implementation". Mathematics Teacher. November 1989, pp 664-671.
Fennema, Elizabeth and Sherman, Julia (1977). "Sex-Related Differences in Mathematics Achievement, Spatial Visualization and Affective Factors". American Educational
Research Journal. 14 Y1V 51-71.
Fennema, Elizabeth and Tartre, Lindsay A. (1985). "The Use of Spatial Visualization in Mathematics by Girls and Boys". Journal for Research in Mathematics Education. 16, 184-206.
89

Foster, Alan G., Cummins, Jerry J. and Yunder, Lee E. (1984). Geometry. Columbus: Merrill Publishing Co.
Friedman, Morton (1978). "The Manipulative Materials Strategy: The Last Pied Piper?". Journal for Research in Mathematics Education. 1978, pp 78-80.
Hatfield, Larry L. (1994). Investigating Mathematics. New York: Glenco.
Hirsch, Christian R. (Ed.) (1991). Curriculum and Evaluation Standards for School Mathematics: Geometry from Multiple Perspectives. Reston, VA: NCTM.
Hirsch, Christian R. (1990). "Understanding and Implementing the NCTM Curriculum Standards for Grades 9-12". School Science
and Mathematics. 90 /6V. 494-503.
Joyce, Bruce and Weil, Marsha (1986). Models of Teaching. Englewoods Cliffs, N.J.: Prentice Hall.
Jurgensen, Ray C., Brown, Richard G. and Jurgensen, John W.(1988). Geometry. Boston: Houghton Mifflin Co.
Levy, Joan U. and Levy, Norman (1989). Mechanincal Aptitude and Spatial Relations Tests. N Y. :Simon & Schuster, Inc.
Lindquist, Mary Montgomery & Shulte, Albert P. (Eds.) (1987). Learning and Teaching Geometrv. K-12: 1987 Yearbook. Reston,Va: NCTM
Linn, M.C. & Peterson, A.C. (1985). "Emergence and Characterization of Gender Differences in Spatial Ability: A Meta Analysis". Child Development. 56, 1479-1498.
McDonald, Janet L. (1989). "Cognitive Development and the Structuring of Geometric Content". Journal for Research in Mathematics Education. 20 (1), 76-94.
90

National Council of Teachers of Mathematics. (1989). Curriculum and Evaluation Standards for School Mathematics. Reston, Va: NCTM.
Romberg, Thomas A.(1990). "Evidence Which Supports NCTM's Curriculum and Evaluation Standards for School Mathematics". School Science and Mathematics. 90 (6), 466-479.
Senk, Sharon L. (1989). "Van Hiele Levels and Achievement in Writing Geometry Proofs". Journal for Research in Mathematics Education. 20 (3), 309-321.
Senk, Sharon L. and Hirschhorn, Daniel B. (1990). "Multiple Approaches to Geometry: Teaching Similarity". Mathematics Teacher. 83(4), 274-280.
Sowell, Evelyn J. (1989). "Effects of Manipulative Materials in Mathematics Instruction". Journal for Research in
Mathematics Education. 20 (5), 498-505.
Talsma, Gary and Hersberger, Jim (1990). "Star Experimental Geometry; Working with Mathematically Gifted Middle School Students". Mathematics Teacher. 83f5'>. 351-357.
Tanner, Daniel and Tanner, Laurel N.(1980). Curriculum Development:Theorv Into Practice, New York- MacMillan.
Tarte, Lindsay Anne (1990). "Spatial Orientation Skill and Mathematical Problem Solving". Journal for Research in Mathematics Education. 21 (3), 216-229.
Walsh, John B. (1990). "The NCTM Curriculum and Evaluation Standards for School Mathematics: A Business Perspective". School Science and Mathematics. 90 (6), 568-570.
Werdelin, I. (1961). Geometrical Abilitv and The Space Factors in Bovs and Girls. Lund, Sweden: Gleerup.
Woodward, Ernest and Hamel, Thomas.(1990). Visualized Geometrv: A Van Hiele Level Approach. Portland, Mn: J. Weston Walch
91