Embed Size (px)
Citation preview
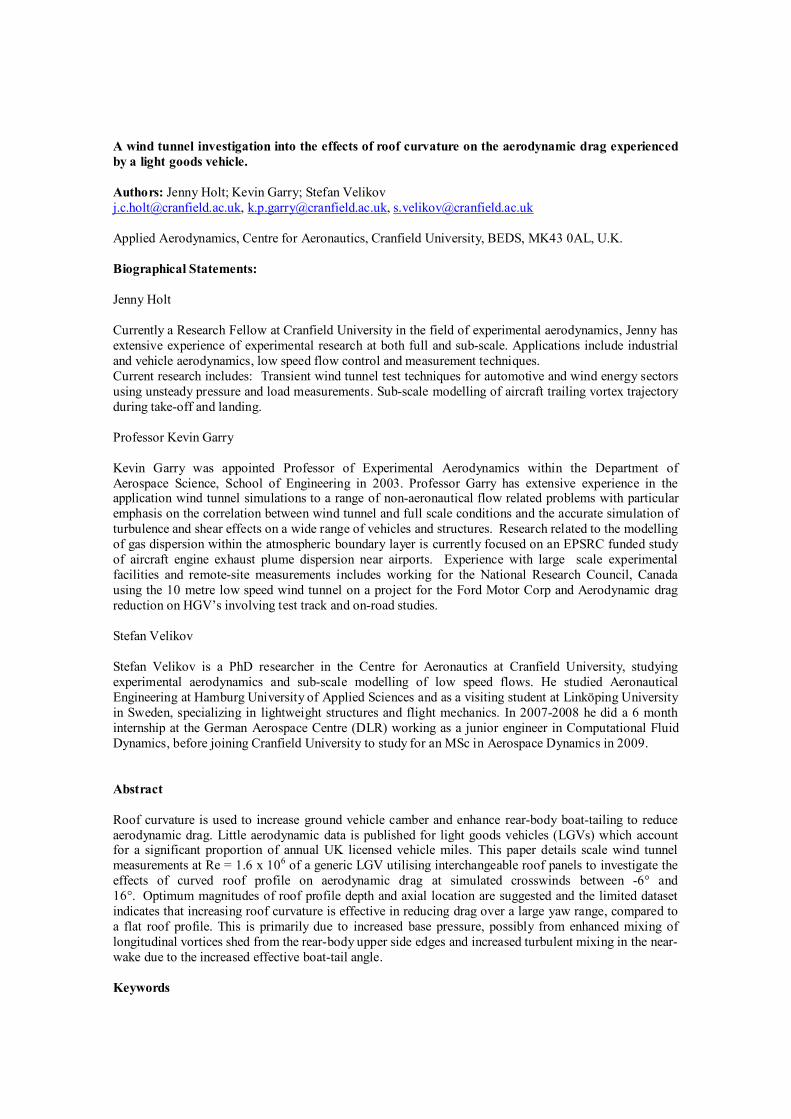
A wind tunnel investigation into the effects of roof curvature on the aerodynamic drag experiencedby a light goods vehicle.
Authors: Jenny Holt; Kevin Garry; Stefan [email protected], [email protected], [email protected]
Applied Aerodynamics, Centre for Aeronautics, Cranfield University, BEDS, MK43 0AL, U.K.
Biographical Statements:
Jenny Holt
Currently a Research Fellow at Cranfield University in the field of experimental aerodynamics, Jenny hasextensive experience of experimental research at both full and sub-scale. Applications include industrialand vehicle aerodynamics, low speed flow control and measurement techniques.Current research includes: Transient wind tunnel test techniques for automotive and wind energy sectorsusing unsteady pressure and load measurements. Sub-scale modelling of aircraft trailing vortex trajectoryduring take-off and landing.
Professor Kevin Garry
Kevin Garry was appointed Professor of Experimental Aerodynamics within the Department ofAerospace Science, School of Engineering in 2003. Professor Garry has extensive experience in theapplication wind tunnel simulations to a range of non-aeronautical flow related problems with particularemphasis on the correlation between wind tunnel and full scale conditions and the accurate simulation ofturbulence and shear effects on a wide range of vehicles and structures. Research related to the modellingof gas dispersion within the atmospheric boundary layer is currently focused on an EPSRC funded studyof aircraft engine exhaust plume dispersion near airports. Experience with large scale experimentalfacilities and remote-site measurements includes working for the National Research Council, Canadausing the 10 metre low speed wind tunnel on a project for the Ford Motor Corp and Aerodynamic dragreduction on HGV’s involving test track and on-road studies.
Stefan Velikov
Stefan Velikov is a PhD researcher in the Centre for Aeronautics at Cranfield University, studyingexperimental aerodynamics and sub-scale modelling of low speed flows. He studied AeronauticalEngineering at Hamburg University of Applied Sciences and as a visiting student at Linköping Universityin Sweden, specializing in lightweight structures and flight mechanics. In 2007-2008 he did a 6 monthinternship at the German Aerospace Centre (DLR) working as a junior engineer in Computational FluidDynamics, before joining Cranfield University to study for an MSc in Aerospace Dynamics in 2009.
Abstract
Roof curvature is used to increase ground vehicle camber and enhance rear-body boat-tailing to reduceaerodynamic drag. Little aerodynamic data is published for light goods vehicles (LGVs) which accountfor a significant proportion of annual UK licensed vehicle miles. This paper details scale wind tunnelmeasurements at Re = 1.6 x 10⁶ of a generic LGV utilising interchangeable roof panels to investigate theeffects of curved roof profile on aerodynamic drag at simulated crosswinds between -6° and16°. Optimum magnitudes of roof profile depth and axial location are suggested and the limited datasetindicates that increasing roof curvature is effective in reducing drag over a large yaw range, compared toa flat roof profile. This is primarily due to increased base pressure, possibly from enhanced mixing oflongitudinal vortices shed from the rear-body upper side edges and increased turbulent mixing in the near-wake due to the increased effective boat-tail angle.
Keywords

Aerodynamic drag reduction, roof curvature, wind tunnel, light goods vehicle, wind averaged drag, yaw,boat tail
1. Introduction.
Aerodynamic drag represents one of the primary factors influencing the fuel consumption of commercialvehicles, along with rolling resistance and drive/transmission losses, Hucho (1987)Pressure to reduce carbon emissions has resulted in the commercial vehicle sector seeking ways ofreducing aerodynamic drag. Within this sector, 13.6% of UK vehicle related carbon emissions have beenidentified by the Department of Transport as being from Light Goods Vehicles (LGV) and this specificgroup has shown a 21.5% rise in vehicle numbers during the past 10 years. Department of Transport(2013)
A significant proportion of the aerodynamic drag of a ground vehicle can be attributed to the largeseparated wake region behind the vehicle. Many low drag passenger car configurations (the Audi A2 andthe Honda Insight are particularly good examples) have attempted to reduce the size of the wake regionthrough the introduction of roof curvature. This particular feature, which can be considered, in sideelevation, as positive camber, has previously been shown to reduce the aerodynamic drag of streamlinedbodies in ground proximity. Scibor-Rylski (1975) gives an optimum maximum camber to be between 2%and 5% for simple passenger car shapes. However, it should be noted that these data relate to relativelystreamlined ground vehicles rather than the more aerodynamically bluff configurations associated withHeavy good Vehicles (HGV) and LGV’s. The criteria adopted by Morelli at al. (1976) to minimise draginclude; a total net lift of zero to reduce vortex drag, zero pitching moment, minimum wetted area andgradual variation of the shape and the area of the transverse sections to minimise the profile and skinfriction drag.
A related and perhaps more generic method of reducing bluff body drag is boat-tailing, using thetechnique presented by Mair (1969). This approach has the effect of reducing the base surface area overwhich the reduced pressure in the near wake of the body acts. There is also a potential effect due to theadverse pressure gradient induced by the boat-tail on the surface boundary layers upstream of the baseand the subsequent impact on both the magnitude of the base pressure and structure of the near wakeregion.
The curved roof approach to aerodynamic drag reduction has been adopted in the HGV sector throughapplication to articulated trailer units (in combination with other drag reducing devices such as cab roofdeflectors and trailer side skirts), showing significant improvements in fuel efficiency. Design examplesof both passenger cars and HGVs such as this indicate that the drag characteristics could be improved byapplying curvature to the roof. However, it is unclear how much of the achieved drag reduction is solelydue to modifying the roof shape, since other geometry changes are made at the same time. Velikov (2009)uses the example of the DON-BUR trailer shape and information available on their website (Don-Bur2013) which suggests that streamlining and a reduced turbulent wake region behind the vehicle delivers adrag reduction. The reduced wake suggests an increased base pressure as a possible mechanism for thereduction in drag. Inspection of the available images of the DON-BUR trailer give the maximum roofcurvature profile depth of the curved roof to be estimated as 6.7% of the trailer length located at 60% ofthe trailer length measured from the base. Whilst direct application from an HGV to an LGV may belimited, the orientation of maximum roof curvature profile depth is in agreement with the criteria adoptedby Morelli (1983) for a region of adverse pressure gradient extending over more than half of the length.Unfortunately, in view of the inevitable compromises that will be necessary in relation to practicalconsiderations, such as load space and access, when adopting this approach to aerodynamic dragreduction for commercial vehicles, there is little data available to support a shape optimisation study. Thisis particularly the case for light goods vehicles, however the ‘one box’ type layout could potentiallyexploit the aerodynamic benefits of optimum roof curvature, more than for other vehicles in this sector.
This paper therefore presents the results of a series of measurements on a generic, but representative,LGV configuration in which the key shape variables associated specifically with roof curvature weresystematically varied and the aerodynamic loads compared. The aim of the study was to identify optimumdesign guidelines and to quantify the aerodynamic drag reduction possible through this approach.
2. Experimental Methodology
In order to investigate the potential effectiveness of roof curvature on the aerodynamic drag of a typicalLGV configuration, a series of wind tunnel tests using sub-scale models was carried out. Overallaerodynamic loads, together with some surface static pressures, were measured over a range of simulatedcrosswind angles.
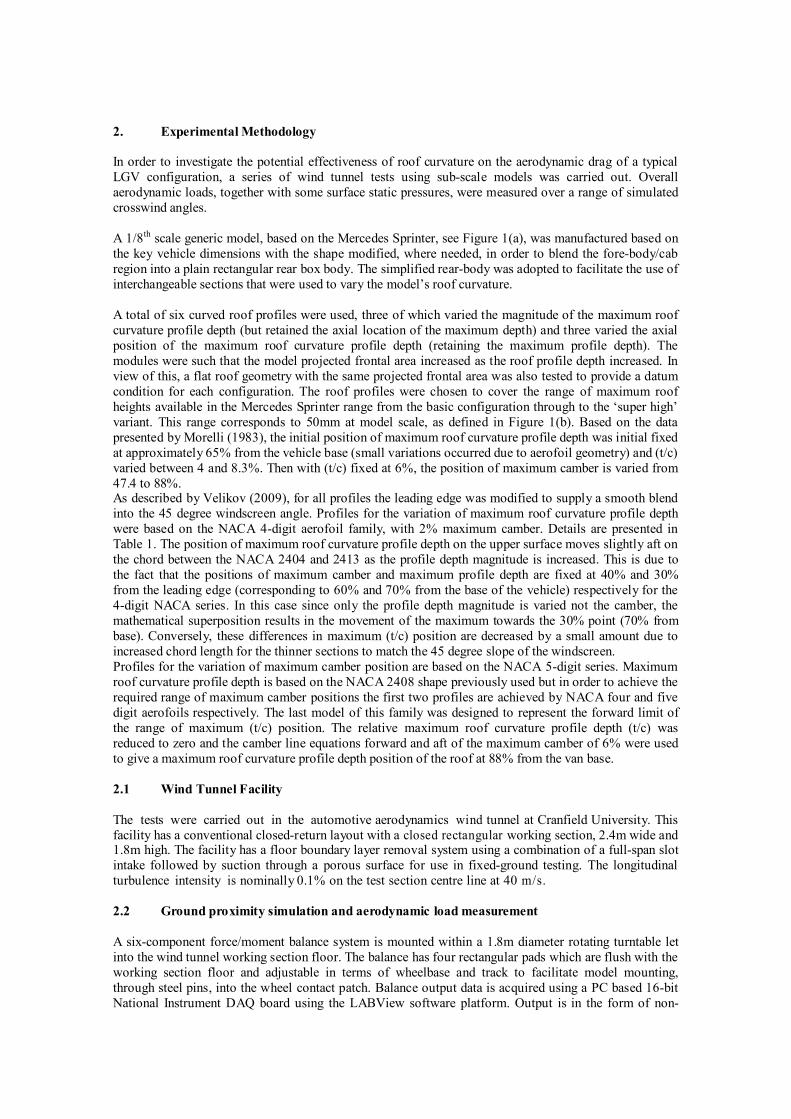
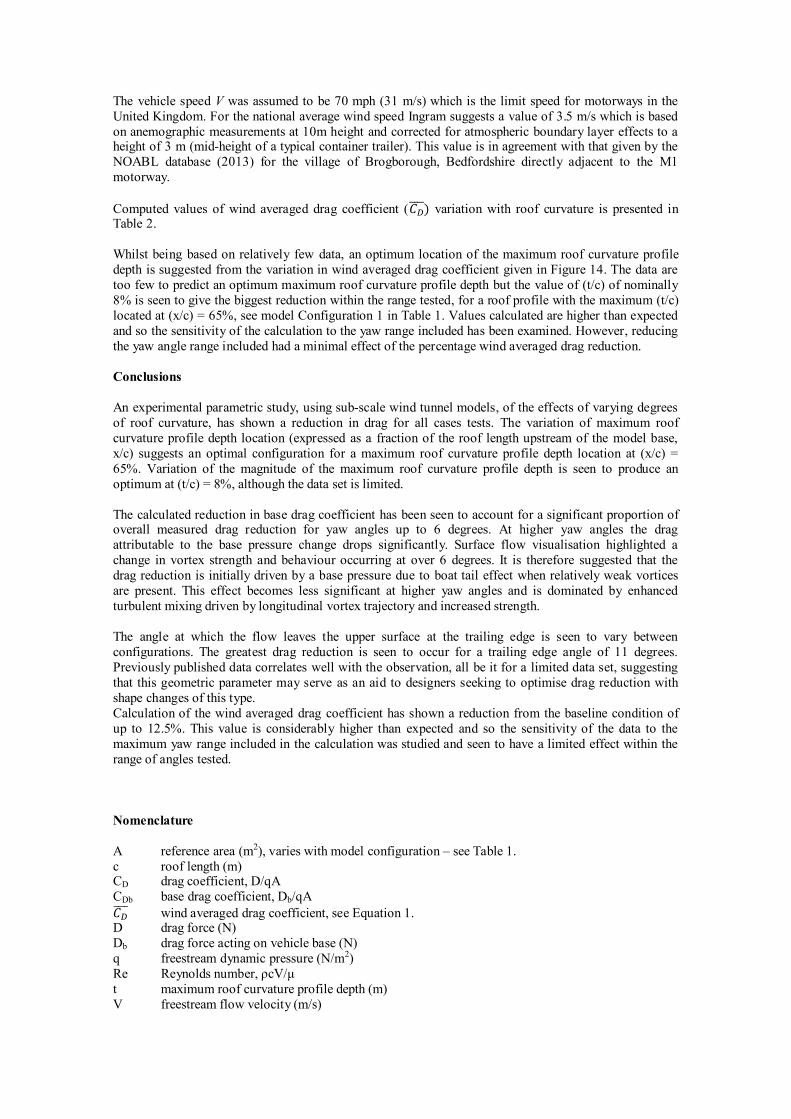
A 1/8th scale generic model, based on the Mercedes Sprinter, see Figure 1(a), was manufactured based onthe key vehicle dimensions with the shape modified, where needed, in order to blend the fore-body/cabregion into a plain rectangular rear box body. The simplified rear-body was adopted to facilitate the use ofinterchangeable sections that were used to vary the model’s roof curvature.
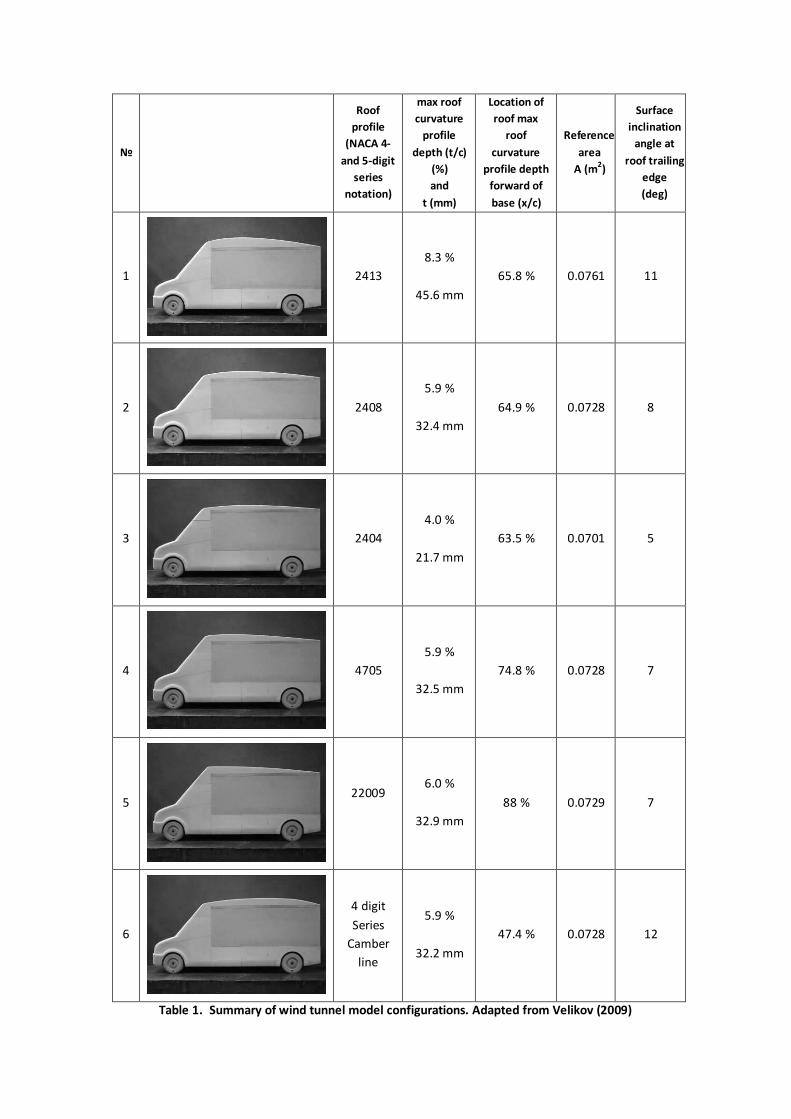
A total of six curved roof profiles were used, three of which varied the magnitude of the maximum roofcurvature profile depth (but retained the axial location of the maximum depth) and three varied the axialposition of the maximum roof curvature profile depth (retaining the maximum profile depth). Themodules were such that the model projected frontal area increased as the roof profile depth increased. Inview of this, a flat roof geometry with the same projected frontal area was also tested to provide a datumcondition for each configuration. The roof profiles were chosen to cover the range of maximum roofheights available in the Mercedes Sprinter range from the basic configuration through to the ‘super high’variant. This range corresponds to 50mm at model scale, as defined in Figure 1(b). Based on the datapresented by Morelli (1983), the initial position of maximum roof curvature profile depth was initial fixedat approximately 65% from the vehicle base (small variations occurred due to aerofoil geometry) and (t/c)varied between 4 and 8.3%. Then with (t/c) fixed at 6%, the position of maximum camber is varied from47.4 to 88%.As described by Velikov (2009), for all profiles the leading edge was modified to supply a smooth blendinto the 45 degree windscreen angle. Profiles for the variation of maximum roof curvature profile depthwere based on the NACA 4-digit aerofoil family, with 2% maximum camber. Details are presented inTable 1. The position of maximum roof curvature profile depth on the upper surface moves slightly aft onthe chord between the NACA 2404 and 2413 as the profile depth magnitude is increased. This is due tothe fact that the positions of maximum camber and maximum profile depth are fixed at 40% and 30%from the leading edge (corresponding to 60% and 70% from the base of the vehicle) respectively for the4-digit NACA series. In this case since only the profile depth magnitude is varied not the camber, themathematical superposition results in the movement of the maximum towards the 30% point (70% frombase). Conversely, these differences in maximum (t/c) position are decreased by a small amount due toincreased chord length for the thinner sections to match the 45 degree slope of the windscreen.Profiles for the variation of maximum camber position are based on the NACA 5-digit series. Maximumroof curvature profile depth is based on the NACA 2408 shape previously used but in order to achieve therequired range of maximum camber positions the first two profiles are achieved by NACA four and fivedigit aerofoils respectively. The last model of this family was designed to represent the forward limit ofthe range of maximum (t/c) position. The relative maximum roof curvature profile depth (t/c) wasreduced to zero and the camber line equations forward and aft of the maximum camber of 6% were usedto give a maximum roof curvature profile depth position of the roof at 88% from the van base.
2.1 Wind Tunnel Facility
The tests were carried out in the automotive aerodynamics wind tunnel at Cranfield University. Thisfacility has a conventional closed-return layout with a closed rectangular working section, 2.4m wide and1.8m high. The facility has a floor boundary layer removal system using a combination of a full-span slotintake followed by suction through a porous surface for use in fixed-ground testing. The longitudinalturbulence intensity is nominally 0.1% on the test section centre line at 40 m/s.
2.2 Ground proximity simulation and aerodynamic load measurement
A six-component force/moment balance system is mounted within a 1.8m diameter rotating turntable letinto the wind tunnel working section floor. The balance has four rectangular pads which are flush with theworking section floor and adjustable in terms of wheelbase and track to facilitate model mounting,through steel pins, into the wheel contact patch. Balance output data is acquired using a PC based 16-bitNational Instrument DAQ board using the LABView software platform. Output is in the form of non-
dimensional coefficients based on working section freestream conditions and corrected for the effects ofworking section blockage using the method given in SAE (1996).
2.3 Test Technique
All the tests were carried out between -6 and +16 degrees yaw relative to the wind tunnel centreline at anindicted flow velocity of 40 m/s giving a nominal test Reynolds number, based on roof length (c), of 1.5x10⁶.This simulation is fixed ground and therefore is not fully representative of on road conditions; thetechnique was chosen in order to achieve higher yaw angles to the flow which were not possible over themoving ground plane. Upstream boundary layer suction is used to thin the boundary layer as far aspossible. The underside of the model is flat and does not include any physical geometry, this was deemedacceptable, for this preliminary study, in order to study drag increments given the configuration changesare exclusively to the upper surface.
3. Analysis of Results
3.1 General vehicle aerodynamic characteristics.
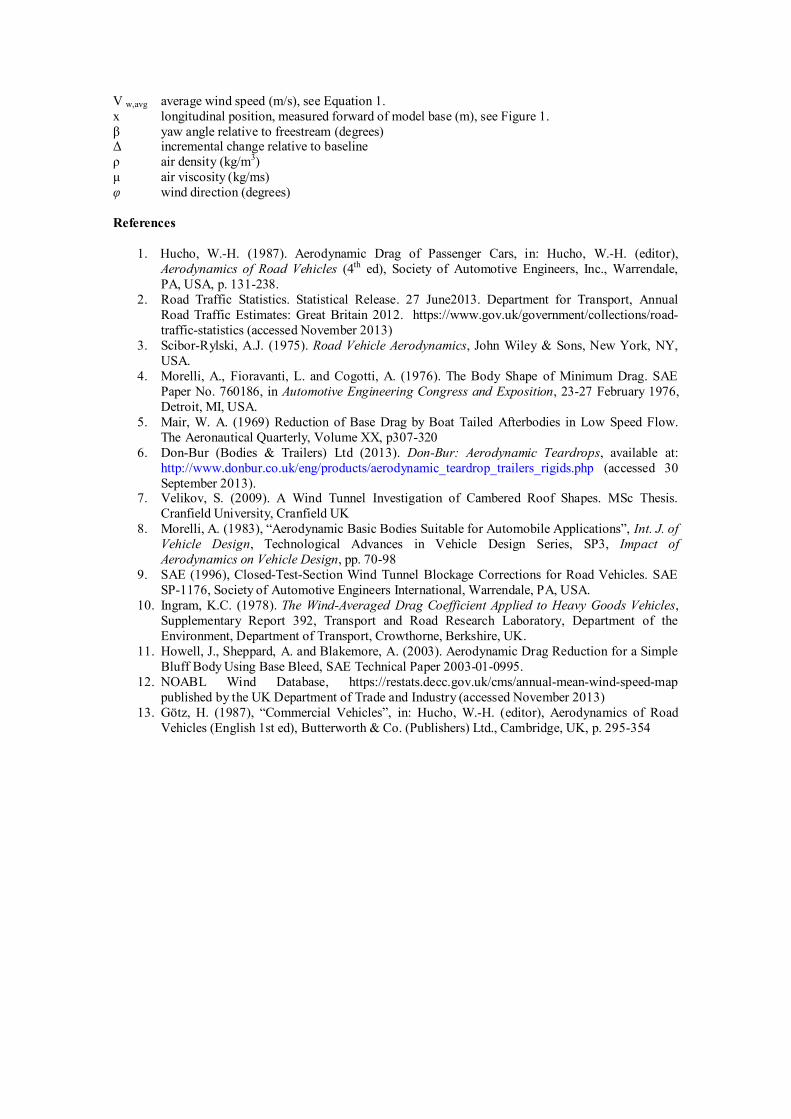
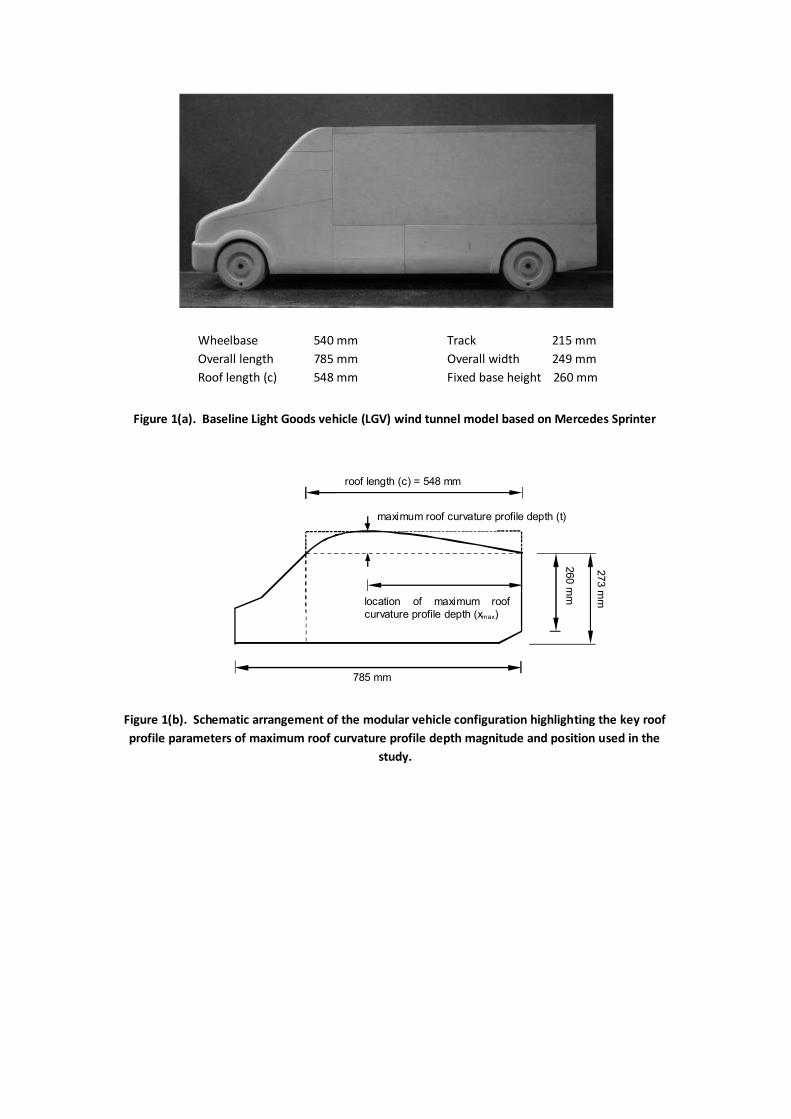
The effect of increasing roof curvature, in terms of changing the magnitude of the maximum roofcurvature profile depth (t/c) at a fixed axial location, on the variation of drag coefficient with yaw angle,is shown in Figure 2. All configurations exhibit a characteristic increase in CD with increasing yaw angle,from a minimum value at zero yaw to a local maxima at nominally 16 degrees yaw. Applying roofcurvature to the baseline (flat roof) is seen to reduce drag coefficient in every case, at all the yaw anglestested. An illustration of the corresponding variation in CDA (an indicator of actual aerodynamic load onthe vehicle) is given in Figure 3. The addition of roof curvature is seen to offset the increase in CDAcaused by the increased frontal area with values of CDA being nominally constant for the range of (t/c)values tested.
The effect of increasing roof curvature, in terms of changing the axial location of the maximum roofcurvature profile depth (for a fixed (t/c)), on the variation of drag coefficient with yaw angle, is shown inFigure 4. This data includes examples of the typical repeatability error experienced during the testprogramme, which is seen to be smaller than the differences observed as a result in changes of roofcurvature.
The primary scaling factor for this type of wind tunnel test is Reynolds number (Re). A series ofmeasurements were made on the curved roof configurations at varying wind tunnel speeds to assess thepossible impact of changing Reynolds number. This data is presented in Figure 5 where the dragcoefficient for each configuration is seen to decrease slightly as Reynolds number is increased to themaximum possible in this facility, nominally 1.6 x 10⁶. Given that a full-scale Reynolds number wouldtypically be 7.3 x 10⁶, it is not possible to extrapolate to full-scale conditions based on this wind tunneldata. This needs to be considered when attempting to predict the likely impact of these geometry changeson fuel consumption for a similar vehicle on the road. However, experience suggests that the trendsobserved are likely to be replicated at full scale.
Through the test programme a number of repeatability checks were undertaken to insure data integrity,the maximum relative error in CD recorded at any data point was 0.5% at 16 degrees yaw angle for thebaseline condition.To calculate the relative errors for the drag coefficient, measurement errors for q∞ (freestream dynamicpressure), reference area, balance output and data acquisition are considered, The error in wind tunnelcalibration the constant of proportionality k (determined by measuring a static pressure difference in thecontraction and the dynamic pressure with a Pitot-tube in the working section) is also considered. Givinga relative error in drag coefficient of 1.41%. Maximum positional error in yaw angle is seen to be +/-0.25% from repeatability tests. Figure 4 uses error bars to depict the magnitude of the error relative to themagnitude of the drag coefficient.
3.2 The effect of varying roof curvature profile depth, (t/c)
In order to understand the reductions in drag coefficient as a result of changing roof curvature, the changein drag coefficient between the curved roof configuration and the corresponding flat roof vehicle with thesame overall height (referred to in each case as a baseline) needs to be considered. The variation ofincremental drag coefficient (ΔCD) with yaw angle for each of the three different roof profiles (t/c) isshown in Figure 6.In each case the reduction in drag coefficient is largest at zero yaw and at yaw angles in the range -6<β<6 degrees, similar trends are observed for each configuration. At higher simulated crosswind angles (greaterthan 6 degrees), the trends in ΔCD are different for each (t/c) profile. It was assumed that these differenceswere associated with a change in the flow development along the upper longitudinal edges of the rear-body as the yaw angle increases. In order to confirm this, a series of flow visualisation measurements,using surface mounted wool tufts, were carried out, see Figure 7. These showed that, at low angles ofyaw (β < 6 degrees) there is evidence of weak longitudinal vortex development on the windward upper surface of the roof which decreases in strength towards the rear of the roof downstream of the maximumprofile depth. At higher yaw angles (β > 6 degrees) the longitudinal vortex in this region appears to be stronger. There was no obvious difference in the roof flow structure, depicted by the tuft flowvisualisation, to account for the significant difference in the behaviour of ΔCD above 6 degrees yaw forroof configurations with (t/c) values of 5.9% and 8.3% as shown in Figure 6.
As both the maximum roof curvature profile depth and the axial location of the maximum vary so doesthe angle made by the roof at the trailing edge (relative to the horizontal datum). This angle is given, foreach configuration, in Table 1. The greatest drag reduction is seen to occur for a configuration with atrailing edge angle of 11 degrees. Data published by Howell et al (2003) gives an optimum drag reductionfor an upper surface boat tail angle of 12 degrees. This near-correlation would suggest that this anglecould be used as an indicator for designers seeking to optimise drag reduction for shapes of this type.
3.3 Effect of varying the axial location of the maximum roof curvature profile depth (t/c)
The variation of incremental drag coefficient (ΔCD) with yaw angle for each of the four different roofprofiles with the same (t/c), but at different axial locations (x/c), is shown in Figure 8.All the roof profiles tested demonstrate a reduction in drag coefficient compared to the correspondingflat-roof datum configuration, across the yaw angle range tested. The trend, in terms of the variation ofΔCD with yaw angle, is similar for each maximum roof curvature profile depth location. The roof profilewith a maximum curvature profile depth position at (x/c) of 64.9% gives the largest drag reduction forthis yaw angle range.
Flow visualisation with surface mounted tufts exhibited the same basic flow structure with embeddedlongitudinal vortices as seen previously. In addition, for the roof profile with a maximum roof curvatureprofile depth at (x/c) = 88% a region of local flow separation was identified on the leading edge of theroof. This is assumed to be due to the rapid change in surface curvature in that area (see modelConfiguration 4 in Table 1) and may account for the reduced effectiveness of this particular roof profile.Such a separation region is very likely to be sensitive to changes in Reynolds number and may not beapparent at full scale.
3.4 Assessment of roof profile changes on base drag coefficient (CDb)
A significant proportion of the drag reduction due to roof curvature was believed to be due to an increasein the base pressure. In order to quantify this effect, measurements of local static pressure were made atfive locations on the vehicle base as shown in Figure 9. The base area of the baseline configuration is splitinto four equal areas and a tapping placed at the centre of each area. An additional tapping is also added atthe geometric centre of the total base area. The pressure at each tapping is pneumatically averaged andassumed to act over the whole base area. The resulting force on the base can be expressed as a base dragcoefficient (CDb) based on the vehicle reference area. This approach assumes that local pressure variationsare small over the base region. If the change in base pressure due to roof curvature were to be localised,particularly near the base edges, then the true effect may not be fully reflected in the base dragmeasurements. This should be considered when analysing the base drag coefficient data.
The variation of the change in base drag coefficient (ΔCDb), compared to the corresponding ‘flat roof’baseline configuration, with yaw angle (β) for different roof maximum roof curvature profile depths (t/c), is shown in Figure 10. It can be seen that roof curvature increases base pressure and therefore reducesbase drag coefficient. This is the case for all (t/c) values and at all yaw angles tested. The largestreduction in base drag is for the (t/c) = 8.3% case.
The relationship between the calculated change in base drag coefficient (ΔCDb) and the measured changein total drag coefficient (ΔCD), is shown in Figure 11. It can be seen that the base drag coefficientreduction accounts for more than 40% of the reduction in total drag, for all (t/c) values investigated, atyaw angles in the range -6 < β < +6 degrees. At higher yaw angles the contribution to the drag coefficient reduction from base drag reduces significantly, particularly for (t/c) values of 4% and 5.9%. At thesehigher yaw angles, surface mounted tuft flow visualisation indicated a weakening of the longitudinalvortex on the roof, downstream of the point of maximum roof curvature profile depth. It is thereforeassumed that this vortex has a beneficial effect (in terms of drag) on the vehicle base flow.
The variation of the change in base drag coefficient (ΔCDb), compared to the corresponding ‘flat roof’configuration, with yaw angle (β) for various axial locations of maximum roof curvature profile depth (x/c), is shown in Figure 12. It can be seen that the base drag coefficient is reduced for all configurationsand all yaw angles. The variation of this reduction with yaw angle is very similar for all theconfigurations but noticeably smaller for the model with the most rearward maximum roof curvatureprofile depth location (Configuration 6, x/c = 47.4%). This may be due to the fact that, for a rearwardlocation of the maximum roof curvature profile depth, the local surface inclination at the roof trailingedge is greater (12 degrees when (x/c) = 47.4%, see Table 1) than for a forward location. If the effect ofthis geometry change can be considered analogous to boat-tailing then this trend is consistent withprevious work indicating an optimum boat-tail angle for base drag reduction.
The contribution of the reduction in base drag coefficient to the overall reduction in drag coefficient isseen to progressively increase as the position of maximum roof curvature profile depth is moved furtherforward on the roof, see Figure 13.
3.5 Assessment in terms of changes in Wind Averaged Drag Coefficient (തതതത)
It is often advantageous to assess the aerodynamic performance of a vehicle subjected to crosswind
conditions using a wind averaged drag coefficient .(തതതതܥ) Götz (1987) presents a formula for evaluation of
a Wind-Averaged Drag Coefficient. This takes into account the influence of crosswinds by considering
the velocity of the air relative to the vehicle. This is shown below where p(Vw, φ) is the probability that
the wind speed Vw is at an angle φ relative to the vehicle (road speed V) resulting in a yaw angle β.
wwww
V
DD dVdVpVVVVCCw
,cos/2/12
0
π2
0
max,
Equation 1
Ingram (1978), uses data from various Meteorological Office anemograph stations throughout Britain toobtain the probability distribution p(Vw, φ) for the direction of the relative wind vector. Even if this is known Eq. (1) requires complex numerical integration, therefore Ingram proposes simplifying equation 1and replacing Vw with a (constant) national average speed Vw, avg , and assumes the probability is equalin all directions, and takes the vehicle to be fully symmetric about a plane along its longitudinal axis. Datapresented by Ingram indicates an estimated relative error of -0.5% for this simplified method compared tothe full integration, which shows it is a very good approximation and justifies its application in this work.Taking all assumptions into account Eq. (1) can be rewritten as
dVVVVCC avgwavgwDD cos/2/11
,
2
,
π
0
Equation 2
The vehicle speed V was assumed to be 70 mph (31 m/s) which is the limit speed for motorways in theUnited Kingdom. For the national average wind speed Ingram suggests a value of 3.5 m/s which is basedon anemographic measurements at 10m height and corrected for atmospheric boundary layer effects to aheight of 3 m (mid-height of a typical container trailer). This value is in agreement with that given by theNOABL database (2013) for the village of Brogborough, Bedfordshire directly adjacent to the M1motorway.
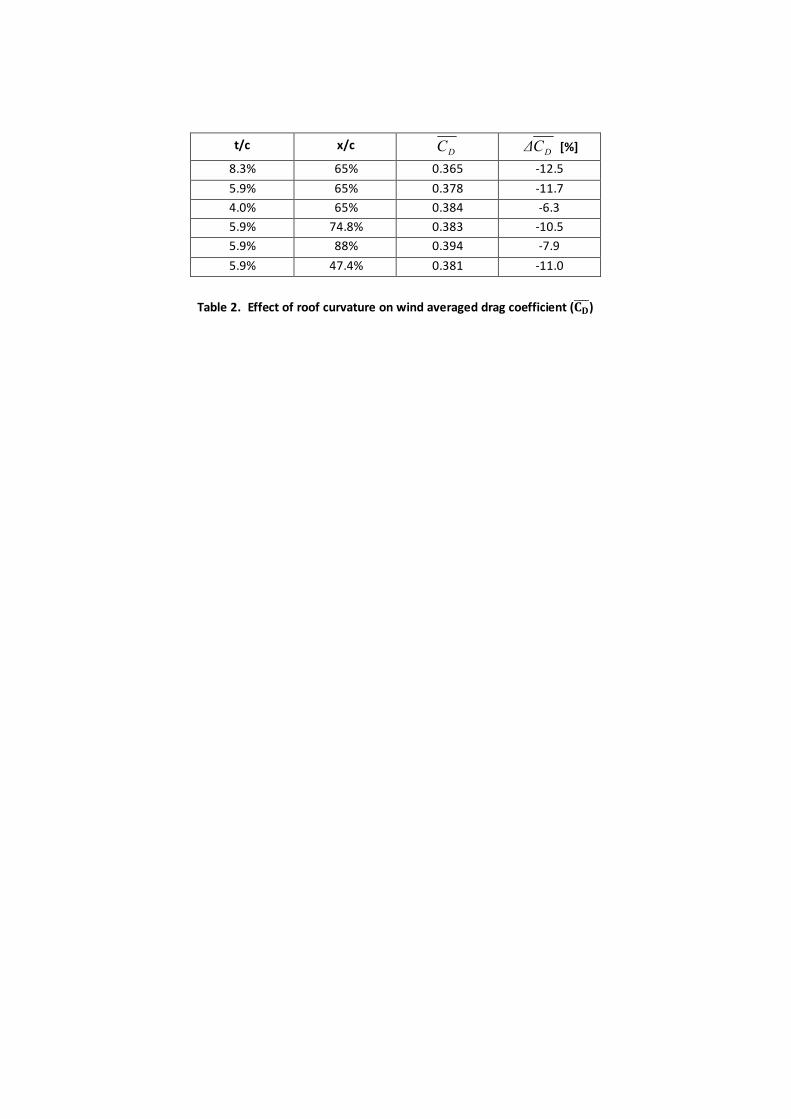
Computed values of wind averaged drag coefficient (തതതതܥ) variation with roof curvature is presented inTable 2.
Whilst being based on relatively few data, an optimum location of the maximum roof curvature profiledepth is suggested from the variation in wind averaged drag coefficient given in Figure 14. The data aretoo few to predict an optimum maximum roof curvature profile depth but the value of (t/c) of nominally8% is seen to give the biggest reduction within the range tested, for a roof profile with the maximum (t/c)located at (x/c) = 65%, see model Configuration 1 in Table 1. Values calculated are higher than expectedand so the sensitivity of the calculation to the yaw range included has been examined. However, reducingthe yaw angle range included had a minimal effect of the percentage wind averaged drag reduction.
Conclusions
An experimental parametric study, using sub-scale wind tunnel models, of the effects of varying degreesof roof curvature, has shown a reduction in drag for all cases tests. The variation of maximum roofcurvature profile depth location (expressed as a fraction of the roof length upstream of the model base,x/c) suggests an optimal configuration for a maximum roof curvature profile depth location at (x/c) =65%. Variation of the magnitude of the maximum roof curvature profile depth is seen to produce anoptimum at (t/c) = 8%, although the data set is limited.
The calculated reduction in base drag coefficient has been seen to account for a significant proportion ofoverall measured drag reduction for yaw angles up to 6 degrees. At higher yaw angles the dragattributable to the base pressure change drops significantly. Surface flow visualisation highlighted achange in vortex strength and behaviour occurring at over 6 degrees. It is therefore suggested that thedrag reduction is initially driven by a base pressure due to boat tail effect when relatively weak vorticesare present. This effect becomes less significant at higher yaw angles and is dominated by enhancedturbulent mixing driven by longitudinal vortex trajectory and increased strength.
The angle at which the flow leaves the upper surface at the trailing edge is seen to vary betweenconfigurations. The greatest drag reduction is seen to occur for a trailing edge angle of 11 degrees.Previously published data correlates well with the observation, all be it for a limited data set, suggestingthat this geometric parameter may serve as an aid to designers seeking to optimise drag reduction withshape changes of this type.Calculation of the wind averaged drag coefficient has shown a reduction from the baseline condition ofup to 12.5%. This value is considerably higher than expected and so the sensitivity of the data to themaximum yaw range included in the calculation was studied and seen to have a limited effect within therange of angles tested.
Nomenclature
A reference area (m2), varies with model configuration – see Table 1.c roof length (m)CD drag coefficient, D/qACDb base drag coefficient, Db/qAതതതതܥ wind averaged drag coefficient, see Equation 1.D drag force (N)Db drag force acting on vehicle base (N)q freestream dynamic pressure (N/m2)Re Reynolds number, ρcV/μ t maximum roof curvature profile depth (m)V freestream flow velocity (m/s)
V w,avg average wind speed (m/s), see Equation 1.x longitudinal position, measured forward of model base (m), see Figure 1.β yaw angle relative to freestream (degrees) Δ incremental change relative to baseline ρ air density (kg/m3)μ air viscosity (kg/ms) φ wind direction (degrees)
References
1. Hucho, W.-H. (1987). Aerodynamic Drag of Passenger Cars, in: Hucho, W.-H. (editor),Aerodynamics of Road Vehicles (4th ed), Society of Automotive Engineers, Inc., Warrendale,PA, USA, p. 131-238.
2. Road Traffic Statistics. Statistical Release. 27 June2013. Department for Transport, AnnualRoad Traffic Estimates: Great Britain 2012. https://www.gov.uk/government/collections/road-traffic-statistics (accessed November 2013)
3. Scibor-Rylski, A.J. (1975). Road Vehicle Aerodynamics, John Wiley & Sons, New York, NY,USA.
4. Morelli, A., Fioravanti, L. and Cogotti, A. (1976). The Body Shape of Minimum Drag. SAEPaper No. 760186, in Automotive Engineering Congress and Exposition, 23-27 February 1976,Detroit, MI, USA.
5. Mair, W. A. (1969) Reduction of Base Drag by Boat Tailed Afterbodies in Low Speed Flow.The Aeronautical Quarterly, Volume XX, p307-320
6. Don-Bur (Bodies & Trailers) Ltd (2013). Don-Bur: Aerodynamic Teardrops, available at:http://www.donbur.co.uk/eng/products/aerodynamic_teardrop_trailers_rigids.php (accessed 30September 2013).
7. Velikov, S. (2009). A Wind Tunnel Investigation of Cambered Roof Shapes. MSc Thesis.Cranfield University, Cranfield UK
8. Morelli, A. (1983), “Aerodynamic Basic Bodies Suitable for Automobile Applications”, Int. J. ofVehicle Design, Technological Advances in Vehicle Design Series, SP3, Impact ofAerodynamics on Vehicle Design, pp. 70-98
9. SAE (1996), Closed-Test-Section Wind Tunnel Blockage Corrections for Road Vehicles. SAESP-1176, Society of Automotive Engineers International, Warrendale, PA, USA.
10. Ingram, K.C. (1978). The Wind-Averaged Drag Coefficient Applied to Heavy Goods Vehicles,Supplementary Report 392, Transport and Road Research Laboratory, Department of theEnvironment, Department of Transport, Crowthorne, Berkshire, UK.
11. Howell, J., Sheppard, A. and Blakemore, A. (2003). Aerodynamic Drag Reduction for a SimpleBluff Body Using Base Bleed, SAE Technical Paper 2003-01-0995.
12. NOABL Wind Database, https://restats.decc.gov.uk/cms/annual-mean-wind-speed-mappublished by the UK Department of Trade and Industry (accessed November 2013)
13. Götz, H. (1987), “Commercial Vehicles”, in: Hucho, W.-H. (editor), Aerodynamics of RoadVehicles (English 1st ed), Butterworth & Co. (Publishers) Ltd., Cambridge, UK, p. 295-354
Wheelbase 540 mm Track 215 mm
Overall length 785 mm Overall width 249 mm
Roof length (c) 548 mm Fixed base height 260 mm
Figure 1(a). Baseline Light Goods vehicle (LGV) wind tunnel model based on Mercedes Sprinter
Figure 1(b). Schematic arrangement of the modular vehicle configuration highlighting the key roof
profile parameters of maximum roof curvature profile depth magnitude and position used in the
study.
273
mm
785 mm
roof length (c) = 548 mm
maximum roof curvature profile depth (t)
260
mm
location of maximum roofcurvature profile depth (xmax)
Figure 2. The effect of introducing roof curvature (location of maximum roof curvature profile depth
fixed) on the variation of drag coefficient with yaw angle.
Figure 3. Comparison between the baseline and curved roof configurations in terms of drag
coefficient area (CDA) for each roof profile (t/c)
0.2
0.25
0.3
0.35
0.4
0.45
0.5
0.55
-10 -5 0 5 10 15 20
dra
gco
effi
cien
t,C
D
yaw angle, β (deg)
t/c=4% Baseline
t/c=5.9% Baseline
t/c=8.3% Baseline
t/c=4%
t/c=5.9%
t/c=8.3%
0
0.005
0.01
0.015
0.02
0.025
0.03
0.035
0 2 4 6 8 10
dra
gco
effi
cien
t.a
rea
(CDA
)
(t/c)
baseline
curved roof

Figure 4. The effect of introducing roof curvature (magnitude of maximum roof curvature profile
depth fixed) on the variation of drag coefficient with yaw angle.
Figure 5. The effect of changes in Reynolds number (as a result of varying the wind tunnel test speed)
on measured drag coefficient for three vehicle roof profiles (t/c).
0.3
0.35
0.4
0.45
0.5
0.55
-10 -5 0 5 10 15 20
CD
Yaw Angle, β (deg)
Baseline
x/c=47.4%
x/c=64.9%
x/c=74.8%
x/c=88%
0
0.05
0.1
0.15
0.2
0.25
0.3
0.35
0.4
0 500000 1000000 1500000 2000000
CD
Reynolds Number
t/c=8.3% t/c=5.9% t/c=4%
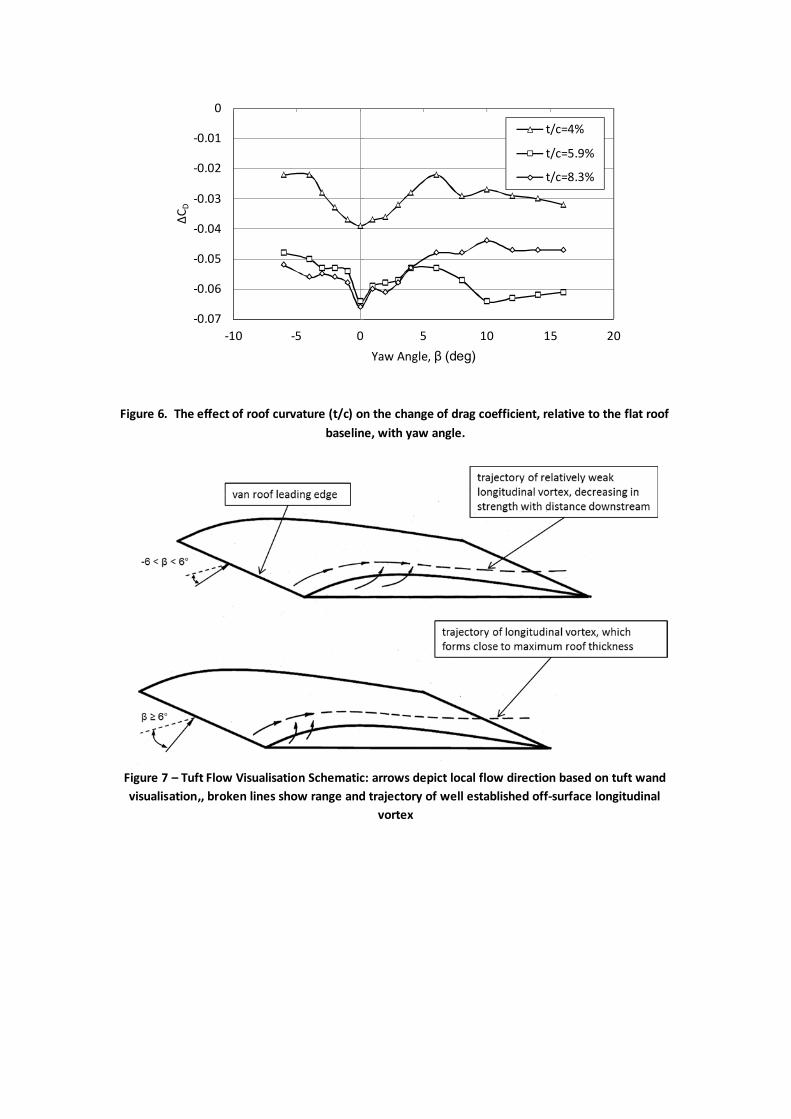
Figure 6. The effect of roof curvature (t/c) on the change of drag coefficient, relative to the flat roof
baseline, with yaw angle.
Figure 7 – Tuft Flow Visualisation Schematic: arrows depict local flow direction based on tuft wand
visualisation,, broken lines show range and trajectory of well established off-surface longitudinal
vortex
-0.07
-0.06
-0.05
-0.04
-0.03
-0.02
-0.01
0
-10 -5 0 5 10 15 20
ΔC
D
Yaw Angle, β (deg)
t/c=4%
t/c=5.9%
t/c=8.3%

Figure 8. The effect of changing the axial location (x/c) of the maximum roof curvature profile depth
(t/c) on the change of drag coefficient, relative to a flat roof baseline, with yaw angle.
Figure 9. Schematic location of the surface static pressure tappings used to evaluate base pressure on
the vehicle. Adapted from Velikov (2009)
-0.07
-0.06
-0.05
-0.04
-0.03
-0.02
-0.01
0
-10 -5 0 5 10 15 20
ΔC
D
Yaw Angle, β (deg)
x/c=47.4%
x/c=64.9%
x/c=74.8%
x/c=88%
13
0m
m6
5m
m
125 mm62 mm

Figure 10. Variation of incremental base drag coefficient with yaw angle for each of the roof
curvature profiles tested.
Figure 11. Contribution of the change in calculated base drag coefficient due to roof curvature (ΔCDB)
to the change in overall drag coefficient (ΔCD), throughout the yaw angle range.
-0.07
-0.06
-0.05
-0.04
-0.03
-0.02
-0.01
0
-10 -5 0 5 10 15 20
ΔC
Db
Yaw Angle, β (deg)
t/c=4%
t/c=5.9%
t/c=8.3%
0.0
0.2
0.4
0.6
0.8
1.0
1.2
-10 -5 0 5 10 15 20
ΔC
Db/Δ
CD
Yaw Angle, β (deg)
t/c=4%
t/c=5.9%
t/c=8.3%

Figure 12. Variation of incremental base drag coefficient with yaw angle for each location of
maximum roof maximum roof curvature profile depth tested.
Figure 13. The influence of roof maximum roof curvature profile depth axial position (x/c) on the
variation of non-dimensional incremental base drag coefficient with yaw angle.
-0.07
-0.06
-0.05
-0.04
-0.03
-0.02
-0.01
0
-10 -5 0 5 10 15 20
ΔC
Db
Yaw Angle, β (deg)
x/c=47.4%
x/c=64.9%
x/c=74.8%
x/c=88%
0.0
0.2
0.4
0.6
0.8
1.0
1.2
-10 -5 0 5 10 15 20
ΔC
Db/Δ
CD
Yaw Angle, β (deg)
x/c=47.4%
x/c=64.9%
x/c=74.8%
x/c=88%
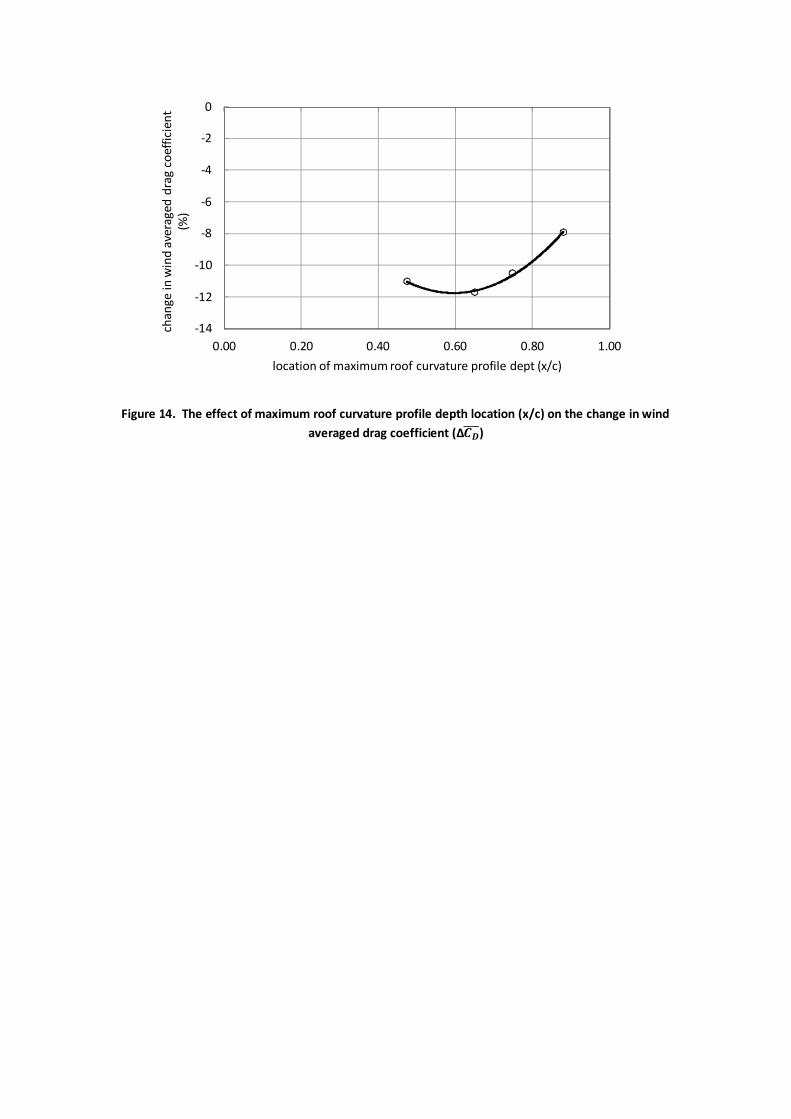
Figure 14. The effect of maximum roof curvature profile depth location (x/c) on the change in wind
averaged drag coefficient (Δതതതത)
-14
-12
-10
-8
-6
-4
-2
0
0.00 0.20 0.40 0.60 0.80 1.00
chan
gein
win
dav
erag
edd
rag
coef
fici
ent
(%)
location of maximum roof curvature profile dept (x/c)
№
Roof
profile
(NACA 4-
and 5-digit
series
notation)
max roof
curvature
profile
depth (t/c)
(%)
and
t (mm)
Location of
roof max
roof
curvature
profile depth
forward of
base (x/c)
Reference
area
A (m2)
Surface
inclination
angle at
roof trailing
edge
(deg)
1 2413
8.3 %
45.6 mm
65.8 % 0.0761 11
2 2408
5.9 %
32.4 mm
64.9 % 0.0728 8
3 2404
4.0 %
21.7 mm
63.5 % 0.0701 5
4 4705
5.9 %
32.5 mm
74.8 % 0.0728 7
522009
6.0 %
32.9 mm
88 % 0.0729 7
6
4 digit
Series
Camber
line
5.9 %
32.2 mm
47.4 % 0.0728 12
Table 1. Summary of wind tunnel model configurations. Adapted from Velikov (2009)
t/c x/cDC DCΔ [%]
8.3% 65% 0.365 -12.5
5.9% 65% 0.378 -11.7
4.0% 65% 0.384 -6.3
5.9% 74.8% 0.383 -10.5
5.9% 88% 0.394 -7.9
5.9% 47.4% 0.381 -11.0
Table 2. Effect of roof curvature on wind averaged drag coefficient (۱۲തതതത)