Embed Size (px)
Citation preview

Hindawi Publishing CorporationThe Scientific World JournalVolume 2013, Article ID 396936, 11 pageshttp://dx.doi.org/10.1155/2013/396936
Research ArticleWind Tunnel Tests for Wind Pressure Distribution onGable Roof Buildings
Xiao-kun Jing1 and Yuan-qi Li1,2
1 Department of Building Engineering, Tongji University, Shanghai 200092, China2 State Key Laboratory for Disaster Reduction in Civil Engineering, Tongji University, Shanghai 200092, China
Correspondence should be addressed to Xiao-kun Jing; [email protected]
Received 22 May 2013; Accepted 28 July 2013
Academic Editors: D. Choudhury and J. Mander
Copyright © 2013 X.-k. Jing and Y.-q. Li. This is an open access article distributed under the Creative Commons AttributionLicense, which permits unrestricted use, distribution, and reproduction in any medium, provided the original work is properlycited.
Gable roof buildings are widely used in industrial buildings. Based on wind tunnel tests with rigid models, wind pressuredistributions on gable roof buildings with different aspect ratios were measured simultaneously. Some characteristics of themeasuredwind pressure field on the surfaces of themodels were analyzed, includingmeanwind pressure, fluctuatingwind pressure,peak negative wind pressure, and characteristics of proper orthogonal decomposition results of the measured wind pressure field.The results show that extremely high local suctions often occur in the leading edges of longitudinal wall and windward roof, roofcorner, and roof ridge which are the severe damaged locations under strong wind. The aspect ratio of building has a certain effecton the mean wind pressure coefficients, and the effect relates to wind attack angle. Compared with experimental results, the regiondivision of roof corner and roof ridge from AIJ2004 is more reasonable than those from CECS102:2002 and MBMA2006. Thecontributions of the first several eigenvectors to the overall wind pressure distributions become much bigger. The investigation canoffer some basic understanding for estimating wind load distribution on gable roof buildings and facilitate wind-resistant designof cladding components and their connections considering wind load path.
1. Introduction
Light-weight buildings with gable roof have been widelyused in low-rise industrial buildings due to high degree ofindustrialization and rapid speed of construction; however,their relatively light dead load and flexibilitymake themmostvulnerable to wind load which becomes a very importantload type in structural design. In recent years, light-weightbuildings with gable roof were usually damaged severelyunder strong wind, which caused huge economic losses.
An accurate knowledge of wind pressure or their coeffi-cients on the walls and roofs of buildings is essential to thewind-resistant design of structures. Holmes [1] investigatedthe characteristics of wind pressure acting on the walls androofs of gable-roofed tropical houses considering the effectsof elevation, roof pitch, and grouping of buildings on theexternal pressures. Kanda and Maruta [2] investigated thecharacteristics of long low-rise building with gable roof forthe case of large aspect ratio. Case and Isyumov [3] showed
that the suburban exposure produces lower wind loads thanthose experienced in the open country exposure by thecomparisons of local pressures and selected structural loadson low buildings with 4 : 12 gable roof.
It is well known that the structural systems of such light-weight buildings with gable roof consist of portal or pin-jointed frames. The metal sheathings are attached to the roofpurlins and the wall girts by the fasteners, which are fixedto these frames. Wind load path has significant effect on theeffective wind loaded area of cladding components which aredefinitely not mentioned in current wind-resistant design,especially for the fasteners. The long-term objective of thisstudy is to investigate how actual wind load is equivalent toextreme wind load on main structure, cladding components,and fasteners of light-weight steel structure considering thespatial correlation of wind pressure and wind load path inwind-resistant design.
The present study, however, is only a preliminary study ongable roof buildings with emphasis on the understanding of

2 The Scientific World Journal
wind pressure on gable roof buildings, through comparisonswith existing results and relative wind load codes, to facilitatewind-resistant design of cladding components and theirconnections considering wind load path.
2. Experimental Technique
Thewind tunnel tests were carried out in the Boundary LayerWind Tunnel at State Key Laboratory for Disaster Reductionin Civil Engineering at Tongji University. This wind tunnelhas a working section of 15m length, 3m width, and 2.5mheight.
A 1 : 40 scale model of natural wind was developed inthe wind tunnel to simulate the natural wind over terraincategory B defined in Load Code for the Design of BuildingStructures (GB50009-2001) of China [4] by using spires andan array of blocks on the tunnel floor. The mean windspeed profile measured in the tunnel was in good agreementwith the power law of an exponent of 0.16. The mean windspeed was 8m/s, and the longitudinal turbulence was 0.22measured at the mean roof heights of the building modelswhich are taken as the reference heights in analyzing pressurecoefficients. It should be pointed out that thewind tunnel testswere completed before Load Code for the Design of BuildingStructures (GB50009-2012) of China [5] was published. InGB50009-2012, the exponent of power law of the mean windspeed profile in terrain category B is 0.15 instead of 0.16, whichproperly decreases mean wind load in terrain category B. Ithas almost no effect on the analysis of characteristics of windpressure in this paper.
The prototype buildings are of two different lengths withconstant width, height, and roof pitch, as shown in Figure 1.𝐻, 𝑊, and 𝐿 represent the eave height, width, and lengthof building, respectively. Table 1 summarizes the buildingdimensions. For a convenient description, the gable roofbuilding model with length to width aspect ratios (𝐿/𝑊) 1.0is designated as M1, and the gable roof building model withlength to width aspect ratios (𝐿/𝑊) 2.0 is designated as M2.The roof pitches of M1 and M2 are 10∘. Figure 2 shows twopictures of M1 and M2 in wind tunnel tests.
A total of 152 taps for M1 and 210 taps for M2 werearranged on the roofs and longitudinal walls, as shown inFigure 3. Particular attention was paid to the number andpositions of the taps near the roof corner, roof edge, and roofridge. The layout of pressure taps for western half part of M2is the same as that for M1. Each model was tested at a 45∘increment from 0∘ to 360∘.
The pressures at all taps were measured simultaneouslyand sampled at a sampling rate of 312.5Hz. For each runwindpressuresmeasured on themodels were expressed in the formof a nondimensional pressure coefficient, 𝐶
𝑝(𝑡), defined as
follows:
𝐶𝑝(𝑡) =𝑝 (𝑡) − 𝑝
𝑜
0.5𝜌𝑈2, (1)
where 𝑝(𝑡) is the measured wind pressure on the surface ofmodel, 𝑝
𝑜is the static pressure at the reference height, 𝑈 is
the mean wind speed at the reference height, and 𝜌 is the airdensity.
Table 1: Summary of building dimensions.
ModelFull scale building Modeldimensions (m) dimensions (mm)𝐻 𝑊 𝐿 𝐻 𝑊 𝐿
M1 9 18 18 225 450 450M2 9 18 36 225 450 900
M2
M1
W
L
L
H
Figure 1: Gable roof buildings.
The mean pressure coefficient, standard deviation pres-sure coefficient, and maximum and minimum pressure coef-ficients were calculated from each wind attack angle. Thesign of the wind pressure coefficient indicates the directionof wind pressure on the surface of building model; positivevalue indicates wind pressure acting towards the surface andnegative value indicates wind pressure acting away from thesurface (suction).
3. Mean Wind Pressure
3.1. Experimental Results. In consideration of the symmetricconditions of the building models, Figure 4 shows the mea-sured results of mean wind pressure coefficients on M1 andM2 with wind attack angles 0∘, 45∘, and 90∘, respectively.
The magnitude and distribution of mean wind pressurecoefficients on M1 can be drawn from Figure 4(a). In the0∘ wind direction, namely the wind direction normal to theroof ridge, the windward wall experiences positive pressuresand higher positive pressure is about 0.6 in the middle ofthe windward wall. High mean suctions occur on the leadingedge of the windward roof and leeward roof ridge with meanwind pressures coefficients of −1.5 (the leading edge) and−1.1 (the leeward roof ridge). The occurrence of these highmean suctions is believed to be caused by the separationbubbles when the air flow is probably separated from theleading edge of the windward roof and the windward roofridge. The mean suctions are uniformly distributed over theleeward wall, and the corresponding mean wind pressurecoefficient is about −0.2. In the 45∘ wind direction, namely,the wind direction oblique to the roof ridge, the windwardwall experiences smaller positive pressure mostly comparedwith the wind direction of 0∘.The formation of conical vortexin two sides of separation region, due to the separation of air

The Scientific World Journal 3
(a) M1
(b) M2
Figure 2: Pictures of M1 and M2 in wind tunnel tests.
M1 M20∘
90∘
45∘
Figure 3: Layout of pressure taps on gable roof building models.
flow from the leading edge of the roof, results in higher suc-tion near the roof corner, and the corresponding maximumsuction coefficient is up to −1.4.The leeward wall experiencessuction between the wind directions of 0∘ and 90∘. In the90∘ wind direction, namely, the wind direction parallel tothe roof ridge, the windward region of walls experienceshigh suctions due to the separation of air flow from theleading edges of walls, and the corresponding maximumsuction coefficient is up to−1.0.Themean suction coefficientson the longitudinal walls decrease with the increase of thedistance to the leading edges of two longitude walls. Highsuctions appear in the leading edge of the windward roofresulting from the formation of the separation bubble, andthe correspondingmaximum suction coefficient is up to−1.2.The mean suction coefficients on the roof decrease with theincrease of the distance to the leading edge of the roof.
Figure 4(b) shows that, in general, the distribution ofmeanwind pressure coefficientswith the samewind directionon M2 is similar to that on M1. In the 0∘ wind direction, themean wind pressure coefficients on the roof and leeward wallof M2 are larger than those of M1. In the 45∘ wind direction,the mean wind pressure coefficients on the windward walland roof of M2 are approximate to those of M1. The meanpressure coefficients on the end region of leeward wall of M2are larger than those ofM1, which is in agreement with Kandaand Maruta’s results [2] that an increase in the aspect ratio isshown to slightly increase the mean suction on the leewardwall for wind direction of 45∘. In the 90∘ wind direction, themean pressure coefficients on the walls and roof of M2 aresignificantly smaller than those of M1. It is concluded thatthe aspect ratio has a certain effect on mean wind pressurecoefficients and the effect relates to wind attack angle.
3.2. Comparative Analysis
3.2.1. Comparison with Holmes’ Work. Holmes carried outa series of wind tunnel study on wind pressure on gableroof buildings. Figure 5 shows his results on the magnitudeand distribution of mean wind pressure coefficients on gableroof buildings with different eave heights for 0∘, 60∘, and90∘ wind directions, respectively. It can be seen that theroof pressure coefficients are invariably negative for all winddirections, and the walls and roof pressure coefficients aresignificantly higher for the elevated building [1]. AlthoughHolmes’ results give mean wind pressure coefficients for 60∘wind direction, the formation of conical vortex still occurs inthe small separation region of roof corner and generates highsuction, and only the shape of conical vortex is different from45∘ wind direction in thesewind tunnel tests.Thedistributionof mean wind pressure coefficients on the walls and roof inthese wind tunnel tests is basically consistent with Holmes’results.The eave heights ofM1 andM2 are 9m.Mean pressurecoefficients onM1 andM2 are remarkably larger than those inFigure 5(b) of Holmes’ results apart from positive pressure onthe windward wall for 0∘ wind direction. It is concluded thatmean pressure coefficients on the walls and the roof increasewith the increase of building height combined with Holmes’results.

4 The Scientific World Journal
(a) M1
(b) M2
Figure 4: Mean wind pressure coefficients on M1 and M2.
3.2.2. Comparison with TPU’s Work. Tokyo Polytechnic Uni-versity (TPU) performed comprehensive wind tunnel tests ofwind pressure on buildings and established database whichhave been published on the website, including the charac-teristics of wind pressure on low-rise buildings [6]. Table 2shows selected full scale gable roof building dimensions ofTPU for comparative analysis. The model scale is 1 : 100. Thetaps are uniformly arranged on the surfaces of selected TPUmodels. Figure 6 shows the magnitude and distribution ofmean wind pressure coefficients on selected TPU models.
In the same wind direction, the distributions of meanwindpressure coefficients on selectedTPUmodels are similarand have no variations with the variation of aspect ratio. Inthe 0∘ wind direction, there is an increase in mean windpressure coefficients on the roofs and leeward walls with theincrease of the aspect ratio; particularly, the increase in meanwind pressure coefficients on the leading edge of windwardroof is significant. In the 45∘ wind direction, mean windpressure coefficients on the leewardwall increase as the aspectratio increases, while mean wind pressure coefficients on thewindward wall and roof have mostly no variations. In the
Table 2: Selected full scale gable roof building dimensions of TPU.
Model Eave height(m) Width (m) Length (m) Roof pitch
(∘)TPU1 8 16 16 10TPU2 8 16 24 10TPU3 8 16 40 10
90∘ wind direction, an increase in the aspect ratio is shownto decrease mean wind pressure coefficients on the wallssignificantly and roofs slightly. The above TPU’s results aresimilar to the experimental results in this paper.
In the same wind direction, the distributions of meanwind pressure coefficients on M1 and TPU1 are similar, andmean wind pressure coefficients on TPU1 are close to M1.In the same wind direction, the distributions of mean windpressure coefficients on TPU2, M2, and TPU3 are similarand have no variations with the variation of aspect ratio. Inthe 0∘ wind direction, mean wind pressure coefficients onM2 are between TPU2 and TPU3. High local suction andhigh positive pressure occur on the roof ridge and windward

The Scientific World Journal 5
Wind
Win
d
Win
d
(a) Eave height = 3m
Wind
Win
d
Win
d
(b) Eave height = 5.1m
Figure 5: Mean wind pressure coefficients on gable roof buildings with roof pitch 10∘ (Holmes’ results).
wall of M2. In the 45∘ wind direction, mean wind pressurecoefficients on TPU2, M2, and TPU3 are very close; howeversuctions caused by the formation of conical vortex on M2are a little larger than those on TPU2 and TPU3 due to thedifferent turbulence intensities. In the 90∘ wind direction,mean wind pressure coefficients on M2 are between TPU2and TPU3. Suctions on the leading edge of windward roof ofM2 are smaller, which is in accordance with the laws that statethatmeanwind pressure coefficients on the longitudinal wallsand roof decrease as the aspect ratio increases.
4. Fluctuating Wind Pressure
The fluctuating level of wind pressure occurring at a par-ticular point and for a particular wind direction can beestimated by the standard deviation pressure coefficient. Inconsideration of the symmetric conditions of the buildingmodels, Figure 7 shows the measured results of fluctuatingwind pressure coefficients on M1 and M2 with wind attackangles 0∘, 45∘, and 90∘, respectively.
Figure 7(a) shows the distributions of fluctuating windpressure coefficient are similar to the distributions of meanwind pressure coefficients on M1 in the same wind direction.The locations with higher fluctuating wind pressure coeffi-cients are also with higher mean wind pressure coefficients.In the 0∘ wind direction, the maximum fluctuating windpressure is 0.5 that appeared in the leading edges of windwardroof and the leeward roof ridge. In the 45∘ wind direction,due to the formation of conical vortex, the distributions of
fluctuating wind pressure appear tapered and nonuniform,and the maximum value is up to 0.7 near the windward roofcorner. In the 90∘ wind direction, the maximum fluctuatingwind pressure is 0.5 that appeared in the leading edges ofwindward roof. For the majority of low-rise buildings withlarger rigidity, fluctuating wind pressures on buildings aremainly derived from two factors [7]: (1) natural turbulenceor gustiness in the free stream flow and (2) unsteady flowgenerated by the body itself, by the phenomena such asseparations, reattachments, and vortex shedding. Fluctuatingwind pressures are mainly generated by the first factor forno separation on windward region. While fluctuating windpressures on the leading edges of the roof, the roof ridgeand the leading edges of the longitudinal walls are mainlygenerated by the second factor.
Figure 7(b) shows that the distributions of fluctuatingwind pressure coefficient are similar to the distributionsof mean wind pressure coefficients on M2 in the samewind direction. The locations with higher fluctuating windpressure coefficients are also with higher mean wind pressurecoefficients.Themaximumfluctuating wind pressures are 0.6in the 0∘ wind direction, 0.8 in the 45∘ wind direction, and 0.4in the 90∘ wind direction, respectively. The fluctuating windpressure coefficients onM2 are relatively close to those onM1.
5. Peak Negative Wind Pressure
5.1. Experimental Results. Postdisaster investigations haveprovided direct evidence that failure of cladding accountsfor much of the initial damage, such as the roof sheathings,

6 The Scientific World Journal
(a) TPU1
(b) TPU2
(c) TPU3
Figure 6: Mean wind pressure coefficients on gable roof buildings with roof pitch 10∘ (TPU’s results).
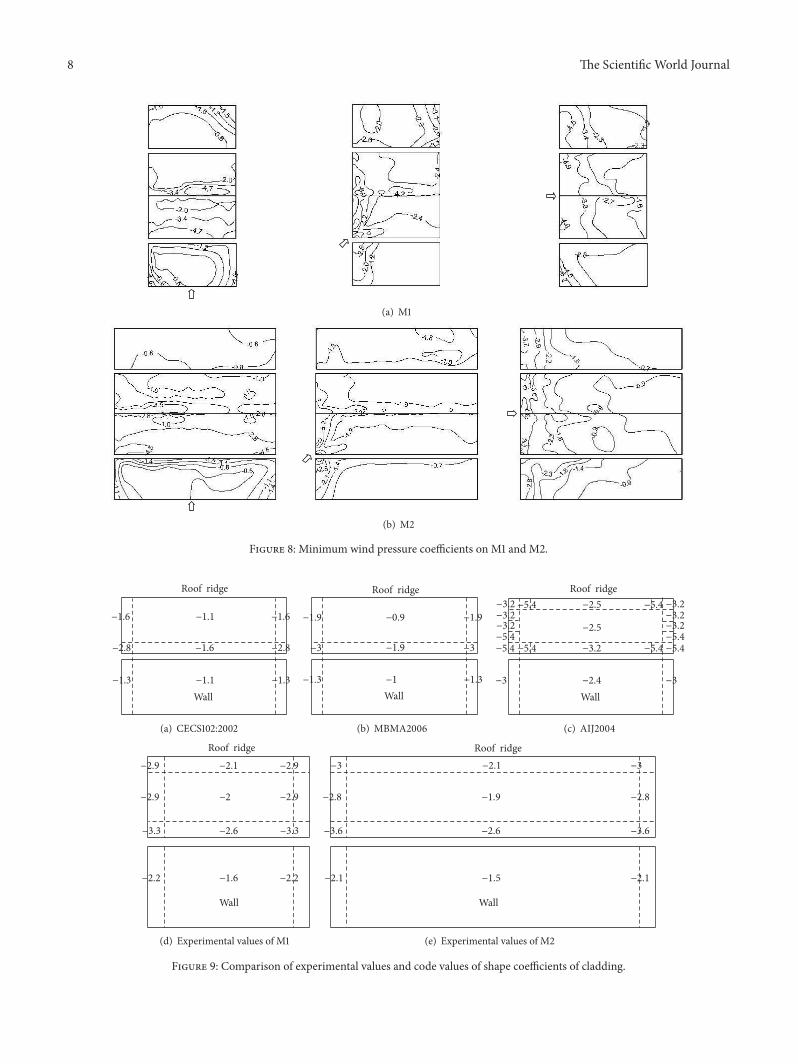
the wall sheathings, doors, and windows. It is the presenceof the local instantaneous peak negative pressures that pri-marily affects cladding elements and immediately supportingmembers [8]. In consideration of the symmetric conditionsof the building models, Figure 8 shows the measured resultsof minimum wind pressure coefficients on M1 and M2 withwind attack angles 0∘, 45∘, and 90∘, respectively.
Figure 8(a) shows that, in the 0∘ wind direction, thelargest absolute values of peak negative wind pressure takeplace on the edges of windward wall, the leading edges ofwindward roof, and the leeward roof ridge of M1. In the 45∘wind direction, the largest absolute values of peak negativewind pressure occur on the corner and edge of the windwardwall, the windward roof corner, and the leeward roof ridge.In the 90∘ wind direction, the largest absolute values of peaknegative wind pressure are present on the windward edges
of two longitudinal walls and the leading edges of windwardroof.
Figure 8(b) shows the similar distributions of minimumwind pressure coefficients on M2. In the 0∘ wind direction,the leading edge of windward roof and the leeward roof ridgeare the worst loaded regions. In the 45∘ wind direction, thewindward roof corner and the leeward roof ridge are theworst loaded regions. In the 90∘ wind direction, the leadingedge of windward roof is the worst loaded region. It canbe noticed that the contour patterns of the minimum windpressure coefficients are similar to those of the mean windpressure coefficients shown in Figure 4.This indicates that thelargestmagnitude peakwindpressures are associatedwith thelargest magnitude mean wind pressures, particularly withinseparation bubble regions.

The Scientific World Journal 7
(a) M1
(b) M2
Figure 7: Fluctuating wind pressure coefficients on M1 and M2.
5.2. Comparative Analysis of Shape Coefficients of Cladding.Larger elements and primary structural systems tend to aver-age the local instantaneous pressures and reduce the dynamiccomponent of the wind load [8]. Design wind pressure ofcladding should be the worst peak wind pressure in all kindsof cases [9]. Figure 9 shows the comparison of experimentalpeak negative pressure coefficients on half of M1 and M2 inconsideration of the symmetry of the building irrespective ofwind direction and the current code values for the design ofcladding, including Technical Specification for Steed Structureof Light-weight Buildings with Gabled Frames (CECS102:2002)[10], Metal Building Systems Manual (MBMA2006) [11], andArchitectural Institute of Japan Recommendations for Loadson Buildings (AIJ2004) [12]. The determination method ofthe edge width from three codes is similar. The edge widthsare all 1.8m. The shape coefficients of cladding in codestake gust effect into account and imply peak negative valuesirrespective of wind direction. The gust effect factor usedin experimental results refers to GB50009-2001. The shapecoefficients given by CECS102:2002 refer to MBMA2006.Thus shape coefficients given by CECS102:2002 are closer toMBMA2006. Interior pressure is not considered here.
The presence of high local suctions on the wall edgesand roof edges specified in CECS102:2002, MBMA2006, andAIJ2004 is well consistent with experimental results of M1andM2; however, the experimental values appear higher than
code values given by CECS102:2002 and MBMA2006, andrelatively close to code values given by AIJ2004. The highpeak suctions on roof ridge, due to the flow separation, arenot considered in CECS102:2002 andMBMA2006.The shapecoefficients from AIJ2004 are more close to experimentalresults. The edge width specified in code provisions shouldreveal the most reasonable locations of local high suctionsand avoid the spatial average of pressure fluctuations decreas-ing significantly the effective peak suction. Compared withexperimental results, the region division of roof corner androof ridge from AIJ2004 is more reasonable than those fromCECS102:2002 and MBMA2006.
6. Proper Orthogonal Decomposition of theMeasured Wind Pressure Field
Proper orthogonal decomposition (POD) is a method usedto derive the most efficient coordinate system for observingindividual phenomena [13]. It can be applied to the analysisof random phenomena, where its efficiency strongly dependson whether a global or a local structural response to windpressure loads is required. The POD method presents a fastconvergence rate for global response, while for local responsethe effective correlation length of the pressure process mustbe taken into consideration [14].
8 The Scientific World Journal
(a) M1
(b) M2
Figure 8: Minimum wind pressure coefficients on M1 and M2.
−1.3 −1.1 −1.3
−2.8 −1.6 −2.8
−1.6 −1.1 −1.6
Wall
Roof ridge
(a) CECS102:2002
−1.3 −1 −1.3
−3 −3
−1.9 −0.9
−1.9
−1.9
Wall
Roof ridge
(b) MBMA2006
−3 −2.4 −3
−5.4 −3.2−5.4−3.2
−5.4
−3.2−3.2 −5.4
−5.4−5.4−3.2
−5.4
−3.2−3.2−5.4
−2.5
−2.5
Wall
Roof ridge
(c) AIJ2004
−2.2 −1.6
−3.3 −2.6
−2.9 −2
−2.2
−3.3
−2.9
−2.9 −2.1 −2.9
Wall
Roof ridge
(d) Experimental values of M1
−2.1 −1.5
−3.6 −2.6
−2.8 −1.9
−2.1
−3.6
−2.8
−3 −2.1 −3
Wall
Roof ridge
(e) Experimental values of M2
Figure 9: Comparison of experimental values and code values of shape coefficients of cladding.
The Scientific World Journal 9
1st (24.48%) 2nd (14.49%) 3rd (9.15%) 4th (6.43%) 5th (4.4%)
6th (3.22%) 7th (2.69%) 8th (2.42%) 9th (1.98%) 10th (1.82%)
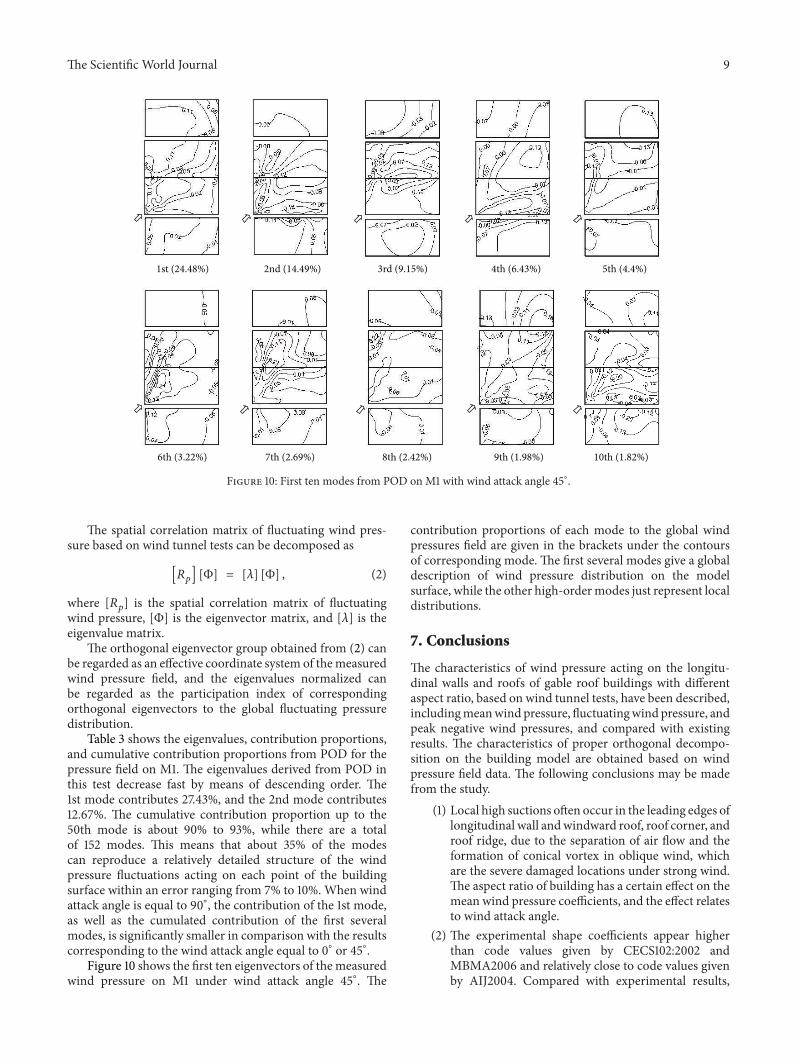
Figure 10: First ten modes from POD on M1 with wind attack angle 45∘.
The spatial correlation matrix of fluctuating wind pres-sure based on wind tunnel tests can be decomposed as
[𝑅𝑝] [Φ] = [𝜆] [Φ] , (2)
where [𝑅𝑝] is the spatial correlation matrix of fluctuating
wind pressure, [Φ] is the eigenvector matrix, and [𝜆] is theeigenvalue matrix.
The orthogonal eigenvector group obtained from (2) canbe regarded as an effective coordinate system of themeasuredwind pressure field, and the eigenvalues normalized canbe regarded as the participation index of correspondingorthogonal eigenvectors to the global fluctuating pressuredistribution.
Table 3 shows the eigenvalues, contribution proportions,and cumulative contribution proportions from POD for thepressure field on M1. The eigenvalues derived from POD inthis test decrease fast by means of descending order. The1st mode contributes 27.43%, and the 2nd mode contributes12.67%. The cumulative contribution proportion up to the50th mode is about 90% to 93%, while there are a totalof 152 modes. This means that about 35% of the modescan reproduce a relatively detailed structure of the windpressure fluctuations acting on each point of the buildingsurface within an error ranging from 7% to 10%. When windattack angle is equal to 90∘, the contribution of the 1st mode,as well as the cumulated contribution of the first severalmodes, is significantly smaller in comparison with the resultscorresponding to the wind attack angle equal to 0∘ or 45∘.
Figure 10 shows the first ten eigenvectors of the measuredwind pressure on M1 under wind attack angle 45∘. The
contribution proportions of each mode to the global windpressures field are given in the brackets under the contoursof corresponding mode. The first several modes give a globaldescription of wind pressure distribution on the modelsurface, while the other high-ordermodes just represent localdistributions.
7. Conclusions
The characteristics of wind pressure acting on the longitu-dinal walls and roofs of gable roof buildings with differentaspect ratio, based on wind tunnel tests, have been described,includingmeanwind pressure, fluctuatingwind pressure, andpeak negative wind pressures, and compared with existingresults. The characteristics of proper orthogonal decompo-sition on the building model are obtained based on windpressure field data. The following conclusions may be madefrom the study.
(1) Local high suctions often occur in the leading edges oflongitudinal wall andwindward roof, roof corner, androof ridge, due to the separation of air flow and theformation of conical vortex in oblique wind, whichare the severe damaged locations under strong wind.The aspect ratio of building has a certain effect on themean wind pressure coefficients, and the effect relatesto wind attack angle.
(2) The experimental shape coefficients appear higherthan code values given by CECS102:2002 andMBMA2006 and relatively close to code values givenby AIJ2004. Compared with experimental results,

10 The Scientific World Journal
Table 3: Eigenvalues, contribution proportions, and cumulative contribution proportions for the pressure field on M1.
Mode
0∘ 45∘ 90∘
EigenvalueContributionproportion
(%)
Cumulativecontributionproportion
(%)
EigenvalueContributionproportion
(%)
Cumulativecontributionproportion
(%)
EigenvalueContributionproportion
(%)
Cumulativecontributionproportion
(%)1st 41.69 27.43 27.43 37.75 24.84 24.84 34.22 22.51 22.512nd 19.25 12.67 40.10 22.02 14.49 39.33 14.23 9.36 31.873rd 15.01 9.88 49.97 13.90 9.15 48.47 11.12 7.32 39.194th 9.76 6.42 56.39 9.77 6.43 54.90 10.60 6.97 46.175th 7.16 4.71 61.10 6.69 4.40 59.31 7.40 4.87 51.036th 6.47 4.26 65.36 4.89 3.22 62.52 5.79 3.81 54.857th 4.11 2.70 68.06 4.09 2.69 65.22 4.93 3.25 58.098th 3.70 2.43 70.50 3.68 2.42 67.63 4.18 2.75 60.849th 2.49 1.63 72.13 3.01 1.98 69.61 3.52 2.32 63.1610th 2.37 1.56 73.69 2.76 1.82 71.43 3.40 2.23 65.3920th 0.98 0.65 82.91 1.11 0.73 82.15 1.37 0.90 77.7650th 0.27 0.18 93.05 0.29 0.19 93.29 0.39 0.26 90.83100th 0.09 0.06 98.37 0.08 0.06 98.50 0.12 0.08 97.84120th 0.06 0.04 99.35 0.05 0.03 99.37 0.07 0.05 99.17152th 0.00 0.00 100.00 0.01 0.00 100.00 0.00 0.00 100.00
the region division of roof corner and roof ridgefrom AIJ2004 is more reasonable than those fromCECS102:2002 and MBMA2006.
(3) Due to a good spatial correlation of wind pressureon the surface with edges and corners, the first modemakes a significant larger contribution to a globaldescription of wind pressure distribution, derivedfrom the proper orthogonal decomposition of themeasured wind pressure field on gable roof building.The first several modes give a global description ofwind pressure distribution on the model surface,while the other high-order modes just represent localdistributions.
Acknowledgments
The authors are grateful to the Research Fund of State KeyLaboratory of Disaster Reduction in Civil Engineering (no.SLDRCE09-B-01) and the Kwang-Hua Fund of College ofCivil Engineering, Tongji University.
References
[1] J. D. Holmes, “Wind pressures on tropical housing,” Journal ofWind Engineering and Industrial Aerodynamics, vol. 53, no. 1-2,pp. 105–123, 1994.
[2] M. Kanda and E. Maruta, “Characteristics of fluctuating windpressure on long low-rise buildings with gable roofs,” Journalof Wind Engineering and Industrial Aerodynamics, vol. 50, pp.173–182, 1993.
[3] P. C. Case and N. Isyumov, “Wind loads on low buildings with4:12 gable roofs in open country and suburban exposures,”
Journal of Wind Engineering and Industrial Aerodynamics, vol.77-78, pp. 107–118, 1998.
[4] Ministry of Construction of the People’s Republic of China,“Load code for the design of building structures,” Tech. Rep.GB50009-2001, China Architecture and Building Press, Beijing,China, 2006.
[5] Ministry of Construction of the People’s Republic of China,“Load code for the design of building structures,” Tech. Rep.GB50009-2012, China Architecture and Building Press, Beijing,China, 2012.
[6] http://61.121.247.28/system/eng/contents/code/tpu.
[7] J. D. Holmes, Wind Loading of Structure, Spon Press, London,UK, 2001.
[8] D. Meecham, D. Surry, and A. G. Davenport, “The magnitudeand distribution of wind-induced pressures on hip and gableroofs,” Journal of Wind Engineering and Industrial Aerodynam-ics, vol. 38, no. 2-3, pp. 257–272, 1991.
[9] H. Deng, F. Li, and X. Hu, “Study on wind resistant designof cladding based on wind tunnel tests,” Journal of TongjiUniversity, vol. 36, no. 8, pp. 1034–1039, 2008.
[10] China association for engineering construction standardiza-tion, “Technical specification for steel structure of light-weightbuildings with gabled frames,” CECS 102:2002, China PlanPress, Beijing, China, 2003.
[11] Metal Building Manufactures Association, Metal Building Sys-tems Manual, Metal Building Manufactures Association Incor-porated, Memphis, Tenn, USA, 2006.
[12] Architectural Institute of Japan, Recommendations for Loads onBuildings, Architectural Institute of Japan, Tokyo, Japan, 2004.
[13] Y. Tamura, S. Suganuma, H. Kikuchi, and K. Hibi, “Properorthogonal decomposition of random wind pressure field,”

The Scientific World Journal 11
Journal of Fluids and Structures, vol. 13, no. 7-8, pp. 1069–1095,1999.
[14] M. M. Rocha, S. V. S. Cabral, and J. D. Riera, “A comparison ofproper orthogonal decomposition and Monte Carlo simulationof wind pressure data,” Journal of Wind Engineering and Indus-trial Aerodynamics, vol. 84, no. 3, pp. 329–344, 2000.

International Journal of
AerospaceEngineeringHindawi Publishing Corporationhttp://www.hindawi.com Volume 2014
RoboticsJournal of
Hindawi Publishing Corporationhttp://www.hindawi.com Volume 2014
Hindawi Publishing Corporationhttp://www.hindawi.com Volume 2014
Active and Passive Electronic Components
Control Scienceand Engineering
Journal of
Hindawi Publishing Corporationhttp://www.hindawi.com Volume 2014
International Journal of
RotatingMachinery
Hindawi Publishing Corporationhttp://www.hindawi.com Volume 2014
Hindawi Publishing Corporation http://www.hindawi.com
Journal ofEngineeringVolume 2014
Submit your manuscripts athttp://www.hindawi.com
VLSI Design
Hindawi Publishing Corporationhttp://www.hindawi.com Volume 2014
Hindawi Publishing Corporationhttp://www.hindawi.com Volume 2014
Shock and Vibration
Hindawi Publishing Corporationhttp://www.hindawi.com Volume 2014
Civil EngineeringAdvances in
Acoustics and VibrationAdvances in
Hindawi Publishing Corporationhttp://www.hindawi.com Volume 2014
Hindawi Publishing Corporationhttp://www.hindawi.com Volume 2014
Electrical and Computer Engineering
Journal of
Advances inOptoElectronics
Hindawi Publishing Corporation http://www.hindawi.com
Volume 2014
The Scientific World JournalHindawi Publishing Corporation http://www.hindawi.com Volume 2014
SensorsJournal of
Hindawi Publishing Corporationhttp://www.hindawi.com Volume 2014
Modelling & Simulation in EngineeringHindawi Publishing Corporation http://www.hindawi.com Volume 2014
Hindawi Publishing Corporationhttp://www.hindawi.com Volume 2014
Chemical EngineeringInternational Journal of Antennas and
Propagation
International Journal of
Hindawi Publishing Corporationhttp://www.hindawi.com Volume 2014
Hindawi Publishing Corporationhttp://www.hindawi.com Volume 2014
Navigation and Observation
International Journal of
Hindawi Publishing Corporationhttp://www.hindawi.com Volume 2014
DistributedSensor Networks
International Journal of