Embed Size (px)
Citation preview
Diversity 2012, 4, 334-362; doi:10.3390/d4030334
diversity ISSN 1424-2818
www.mdpi.com/journal/diversity
Article
Abiotic and Biotic Soil Characteristics in Old Growth Forests and Thinned or Unthinned Mature Stands in Three Regions of Oregon
David A. Perry 1, *, Robert P. Griffiths 1, Andrew R. Moldenke 2 and Stephanie L. Madson 1
1 Department of Forest Ecosystems and Society, Oregon State University, Corvallis, OR 97331, USA;
E-Mail: [email protected] (R.P.G.) 2 Department of Botany and Plant Pathology, Oregon State University, Corvallis, OR 97331, USA;
E-Mail: [email protected]
* Author to whom correspondence should be addressed; E-Mail: [email protected];
Tel.: +1-541-441-1428.
Received: 1 August 2012; in revised form: 30 August 2012 / Accepted: 30 August 2012 /
Published: 20 September 2012
Abstract: We compared forest floor depth, soil organic matter, soil moisture, anaerobic
mineralizable nitrogen (a measure of microbial biomass), denitrification potential, and
soil/litter arthropod communities among old growth, unthinned mature stands, and thinned
mature stands at nine sites (each with all three stand types) distributed among three regions
of Oregon. Mineral soil measurements were restricted to the top 10 cm. Data were
analyzed with both multivariate and univariate analyses of variance. Multivariate analyses
were conducted with and without soil mesofauna or forest floor mesofauna, as data for
those taxa were not collected on some sites. In multivariate analysis with soil mesofauna,
the model giving the strongest separation among stand types (P = 0.019) included
abundance and richness of soil mesofauna and anaerobic mineralizable nitrogen. The best
model with forest floor mesofauna (P = 0.010) included anaerobic mineralizable nitrogen,
soil moisture content, and richness of forest floor mesofauna. Old growth had the highest
mean values for all variables, and in both models differed significantly from mature stands,
while the latter did not differ. Old growth also averaged higher percent soil organic matter,
and analysis including that variable was significant but not as strong as without it. Results
of the multivariate analyses were mostly supported by univariate analyses, but there were
some differences. In univariate analysis, the difference in percent soil organic matter
between old growth and thinned mature was due to a single site in which the old growth
had exceptionally high soil organic matter; without that site, percent soil organic matter did
OPEN ACCESS
Diversity 2012, 4
335
not differ between old growth and thinned mature, and a multivariate model containing soil
organic matter was not statistically significant. In univariate analyses soil mesofauna had to
be compared nonparametrically (because of heavy left-tails) and differed only in the
Siskiyou Mountains, where they were most abundant and species rich in old growth forests.
Species richness of mineral soil mesofauna correlated significantly (+) with percent soil
organic matter and soil moisture, while richness of forest floor mesofauna correlated (+) with
depth of the forest floor. Composition of forest floor and soil mesofauna suggest the two
groups represent a single community. Soil moisture correlated highly with percent soil
organic matter, with no evidence for drying in sites that were sampled relatively late in the
summer drought, suggesting losses of surface soil moisture were at least partially replaced
by hydraulic lift (which has been demonstrated in other forests of the region).
Keywords: soil organic matter; soil nitrogen; soil moisture; soil arthropods; thinning;
disturbance; forest management
Abbreviation:
df degrees of freedom CV coefficient of variation
OG old growth forest FF forest floor depth (mm)
TM thinned mature forest AMN anaerobic mineralizable nitrogen (µg·gdw −1)
UM unthinned mature forest MAP mean annual precipitation (mm)
BD bulk density (g·mL−1) MAT mean annual temperature (°C)
DP denitrification potential (nmol N·g dry mass−1·h−1)
1. Introduction
More than 70% of the original old-growth forest (OG) in the United States Pacific Northwest has
been lost since EuroAmerican settlement [1]. Wildfire has been and continues to be a factor, but the
major source of loss in the 20th century was clearcutting and plantation establishment. Conversion of
complex older to relatively uniform younger forests is known to have endangered at least two bird
species, and is thought to have put numerous OG-associated species at risk [2]. Near-term impacts of
clearcutting on soil nutrients and some aspects of soil biology have a long history of research; however
uncertainty remains concerning significant issues. Although soils store 67% of forest carbon (C) [3], the
effect of disturbance on mineral soil C in forests is poorly understood [4,5]. Studies have found that
impacts of both wildfire and logging on soil organic matter are highly variable, largely related to
disturbance severity but also varying geographically and with soil order [4,6–11]. Fire-related losses of
carbon from mineral soil are greater in the Pacific Northwest than in other regions of the USA [11],
and carbon losses related to logging are greater on Ultisols and Inceptisols [10], both of which occur
extensively in the Northwest [12].
Research on the resilience of forest soils following disturbance has largely focused on carbon (C).
A meta-analysis of logging impacts found that mineral soils had recovered C losses within 20 years [10].
In their extensive summary of the published literature, Pregitzer and Euskirchen [13] found higher
Diversity 2012, 4
336
median soil C in older than in younger temperate forests, however all age classes and older forests in
particular were highly variable and age-related differences not statistically significant. An accurate
picture of resilience must constrain variability, either by following single sites over time, the desired
approach but with severe practical limitations, or by narrowing environmental differences among age
classes to the extent possible. Griffiths and Swanson [14] took the latter approach in the central
Oregon Cascade Mountains, finding that differences between OG and 5 year-old stands in various
microbiological and chemical properties had largely disappeared by age 40. It is unclear how those
findings may apply to other areas or other soil attributes. In Alberta some litter dwelling beetle species
have been shown to occur only in older forests [15,16]. But other studies have found that sensitive
ground-dwelling beetles benefit from partial harvesting [17,18].
In this study we compared soil organic matter (SOM), soil moisture, two measures of nitrogen, and
mineral soil/forest floor arthropods among 27 OG and either thinned or unthinned younger stands in
three regions of Oregon. Thinning younger stands has been proposed as a way to accelerate the
development of OG characteristics and improve habitat for species that depend on structurally
complex forests [19]. A number of studies have dealt with how thinning affects aboveground
components of ecosystems, including understory vegetation [20,21], forest structure [22], and
vertebrate habitat [23–27]. Effects on soils and soil/litter fauna, vital components of ecosystems, are
less well researched. Our primary objectives address three basic questions.
● Do unthinned mature stands differ from OG in any of the variables we measured?
● Are thinned stands more or less similar to OG than unthinned stands?
● Are differences among stand types, if they exist, consistent among regions?
Based on [10,14], we hypothesize that unthinned mature stands in the age ranges of the study have
recovered any forest floor or soil organic matter losses and do not differ from OG with respect to those
variables. Because of the central importance of organic matter in soil structure and processes [28], we
expect that other variables we measured will also not differ from OG. With regard to regional variation,
if any stand type differences do occur we would expect the greatest likelihood to be in the Siskiyou
Mountains, the driest and least productive region of the study.
The net effect of thinning on soils and soil fauna, or even if effects are generalizable, are difficult to
predict. Thinning has multiple potential effects on the soil and forest floor. It is a physical disturbance
superimposed on a forest that is in some stage of recovery from an earlier stand-initiating disturbance.
By altering the structure of the forest, thinning has both microclimatic and biological effects, changing
insolation and wind speed at the forest floor and altering the total amount and diversity of plant carbon
inputs to soils and litter layers.
A secondary objective was to examine relationships among the variables. We hypothesized that
depth of the forest floor and soil organic matter would correlate positively with mean annual
precipitation (a crude proxy for primary productivity), and that soil moisture at the time of sampling
would correlate positively with levels of soil organic matter and mean annual precipitation, specific
curves varying with regions because of different sampling dates. We expected soil microbial biomass
(measured by anaerobic mineralizable nitrogen) and the abundance of soil arthropods to correlate
positively with levels of soil organic matter, microbial biomass being sufficiently responsive to also
correlate positively with soil moisture at the time of sampling. We expected the abundance of soil
Diversity 2012, 4
337
arthropods to correlate with microbial biomass, a food web effect, and the abundance of forest floor
arthropods to correlate positively with depth of the forest floor, a food web and habitat volume effect.
Many studies have dealt with biotic and abiotic characteristics of soils in the Pacific Northwest,
however ours is the first of which we are aware that systematically compared soil and forest floor
variables among OG and thinned or unthinned mature stands across three climatically distinct regions.
2. Methods
We sampled nine stands in each of three regions: the Cascade Mountains, the Coast Range, and the
Siskiyou Mountains. In each region, three stands were sampled in each of three stand types:
old-growth (OG) (>180 years old) unthinned mature stands, and thinned mature stands. Selected stands
had to meet several criteria. First, thinned and unthinned mature stands were required to be adjacent
wherever possible and of the same age—i.e., the same mature stand that contained both thinned and
unthinned portions. Second, thinning could not have occurred in the recent past; one stand was thinned
5 years prior to our study, but all others had been thinned at least 11 years previously (range 11 to
23 years). Third, each thinned-unthinned pair had to have an intact OG either adjacent or nearby and in
a similar environmental setting (elevation, aspect, slope steepness, and soils), and sufficiently large to
provide an adequate buffer for samples (discussed below). This last requirement was the most difficult
to satisfy, as intact OG in close proximity to managed mature stands are not common. Throughout the
paper we refer to these groups of three stand types as triads and their physical location as a site. Mature
stands ranged in age from 50 to 120 years, with 6 of the 9 sites less than 100 years, and originated
from either wildfire or clearcutting. Mature stands in the Siskiyous dated from severe wildfires during
the late 1800’s, probably set intentionally by miners [29]. In the Cascades and Coast Range, mature
stands at 5 of the 6 sites were less than 70 years old and most likely established following clearcutting,
while the 90 year old mature stand at the remaining locale could have resulted from either early
logging or wildfire. Stand structure and vegetative composition were studied at eight of our nine
locales by Bailey et al. [21] and Bailey and Tappeiner [22].
Climatic regimes and elevation ranges are shown in Table 1. Mean annual precipitation (MAP) and
mean annual temperature (MAT) were obtained as 1961–1990 averages from ClimateWNA
Version 4.60 [30,31]. Climatic data were determined individually for each old-growth stand and for
each thinned-unthinned pair. Of the three regions, the Siskiyous are the driest, while Coast Range sites
average the wettest but overlap considerably with sites in the Cascades. Temperature regimes are
similar in the three regions. Coast Range sites are lowest in elevation. Soils typical of our sites in the
Cascades are moderately deep and well drained stony, cobbly, or gravelly loams formed in material
weathered from basic igneous rock with varying amounts of volcanic ash [32]. Coast Range soils are
moderately deep and well-drained loams, gravely loams, and silt loams formed from either sandstones
(two sites) or basic igneous rock (one site) [32]. In the Siskiyous, landscape positions typical of our
sites have moderately deep and well-drained silt loam soils formed in colluvium derived from altered
sedimentary and volcanic rock [33].
Diversity 2012, 4
338
Table 1. Mean and ranges of mean annual precipitation (MAP), mean annual temperature
(MAT), mean temperature of warmest month (MTWM), mean temperature of coldest
month (MTCM), and elevation ranges for sampled sites, by region. Climatic data are
means for 1961–1990 [30,31].
Region MAP (mm) MAT (°C) MTWM (°C) MTCM (°C) Elevation (m)
Cascades 1714 (1379–2261) 9.6 (7.6–10.4) 17.6 (15.8–18.3) 3.0 (0.8–4.0) 682–1111 Coast Range 2269 (1881–3367) 10.7 (9.0–11.3) 18.3 (16.0–19.3) 4.4 (3.4–4.9) 263–546 Siskiyous 869 (686–1159) 10.1 (8.5–10.8) 19.4 (17.6–20.2) 2.4 (0.9–3.5) 780–1032
Sampling began on 12 June 1994, and was conducted sequentially according to regional MAP, i.e., the
Siskyous (the driest region) were sampled first, followed by the Cascades, and finally the Coast Range.
Each triad was sampled over a three day period, one stand type per day. Stand types at a given site were
sampled in random order. Samples from each site were returned to the lab and processed before the next
site was sampled. Each region was sampled and samples processed over a three to four week period.
Soil organic matter (SOM), soil moisture, anaerobically mineralizable nitrogen, and denitrification
potential were determined from 40 to 50 samples in each stand, excepting 2 stands in the Siskiyou
Mountains where there were 13 and 25 samples. Samples were arrayed every 5 m along either one or
two transects whose termini were at least 30 m from the stand edge. After measuring its depth, the
forest floor was scraped away and mineral soil samples extracted to 10 cm depth, taking care to
maintain an equal sample area throughout the depth. No visible decaying logs were sampled. Soils
were stored at 15 °C until analyses, which were initiated within 16 h of their receipt in the laboratory.
After sieving through a 2 mm sieve and oven drying at 100 °C, SOM was measured by loss-on-ignition at
550 °C for 6 h. Moisture content was determined by difference following oven drying at 100 °C. Soil bulk
density (BD) was calculated on eight by ten cm cores collected every 10 m along the same transects used
for SOM samples, yielding 22 to 26 samples per stand. SOM percent was multiplied by BD to yield
SOM content.
We measured mineralizable nitrogen anaerobically [34], a measure of labile nitrogen that largely
reflects microbial biomass [35]. Ten g of field-moist soil was added to 53 mL of distilled water in a
20 mm × 125 mm screw cap test tube and incubated at 40 °C. After 7 days, 53 mL of 4 M KCl was
added to the slurry, NH4+ concentration determined with an ammonium electrode, and mineralization
calculated from the difference between initial and final NH4+ concentrations. Denitrification potential
was measured by the method of Groffman and Tiedje [36] as modified by Griffiths et al. [37]. Each
reaction vessel (25 mL Erlenmeyer flask) contained 5 g of field-moist soil particles <2 mm. Flasks
were sealed with rubber serum bottle stoppers and purged with Ar to displace O2 in the headspace gas.
After purging, 2 mL of a 1 mM solution of glucose and NO3− was added to each flask. Flasks were
preincubated at 25 °C for 1 h. This preincubation period was used because previous time-series
experiments showed a lag in N2O production during this period, followed by linear N2O production
rates during the following 2–4 h (unpublished data). After preincubation, 0.5 mL of headspace gas was
removed from the reaction vessel and injected into a gas chromatograph (GC) fitted with an electron
capture detector (Hewlett-Packard model 5890 GC, connected to a Hewlett-Packard model 3396
integrator; Hewlett Packard, Palo Alto, CA, USA). The integrator was calibrated by the external
calibration method with known gas standards. The stainless steel column (2 m × 3 mm) was packed with
Diversity 2012, 4
339
Poropak-N. The carrier was oxygen-free N. Oven temperature was 55 °C; injection temperature was
125 °C. A second headspace N2O analysis was made after an additional 2 h incubation at 25 °C. The net
N2O released over these 2 h was used to estimate N2O production rates. Denitrification potential
measures the presence of denitrifying organisms, which has been found to correlate positively with soil
nitrate levels [14].
We used three techniques to sample arthropods [38,39]. Macrofauna (e.g., millipedes, beetles, camel
crickets, and ants) were sampled in twenty-five pitfall traps set 10 m apart at each site. A 1100 mL
container was buried with its rim level with the soil surface, and a cup containing 25 mL of 50%
diluted ethylene glycol placed at the bottom. A metal funnel connected the rim of the larger container
with the cup. Traps were installed in late Spring and samples collected three weeks later. Soil
mesofauna (e.g., Acari and Collembola) were measured in twenty-five soil samples spaced 10 m apart
in each stand, using the same technique as described above for SOM. Soil cores were placed in sealed
plastic bags and stored at 2–5 °C until heat extraction using Tullgren funnels. Mesofauna associated
with litter (e.g., Acari, Collembola, small insects) were determined from ten samples per stand spaced
25 m apart. A 25 cm × 25 cm 3-sided square corer was inserted through the litter layer and driven by a
hammer into the mineral soil to a depth of 2.5–3.0 cm. The litter layer and topsoil were removed with a
hand trowel from the open side of the corer, and a square metal shovel with a diameter just exceeding
the corer was inserted under the sample and the sample then removed to a plastic ziplock baggie.
Within this sample the depth of the litter layer and topsoil/humus was somewhat variable. However in
all cases all of the litter (highly variable volume) was removed together with approximately 1719 cm3
of humus/topsoil. Arthropods were extracted using a Tullgren funnel.
Statistical analyses were done with Systat [40]. Univariate differences among stand types were
analyzed by ANCOVA using a random effects model, i.e., Standtype X Region as the error term.
Mean annual precipitation and mean annual temperature were included as covariates. Normality of
variables and residuals were assessed using the Shapiro-Wilk and Anderson-Darling tests and data
transformed as necessary. In most cases log transformations normalized data and residuals (exceptions
discussed below). We also transformed percent SOM using arcsin square root, however residuals were
not normal and analyses were done using the log transformed data. Tukey’s honestly significant
difference (HSD) was used to assess probabilities of difference between stand types and regions.
Additionally, we examined multivariate differences among stand types using MANCOVA, again with
mean annual precipitation and mean annual temperature as covariates. Differing combinations of
variables were explored and the best set determined using Hotelling-Lawley’s trace for stand type
differences [40], which was also used for multivariate pairwise comparisons of stand types. Multivariate
normality was assessed using Mardia’s Skewness, Mardia’s Kurtosis, and the Henze Zirkler test [40].
Relationships among variables were analyzed with regression. Within-stand distributions of SOM were
tested against either normal, lognormal, or Pareto distributions using the chi-squared statistic.
A few variables were not distributed normally or lognormally in all stand types, the deviations
occurring in either thinned or unthinned mature stands and usually because of heavy left tails. Soil
organic matter and soil moisture were distributed log-normally for OG and thinned mature stands, but
not for unthinned mature. Numbers of individuals of all arthropod groups were log-normally distributed
among OG, but in mature stands soil numbers were not distributed normally or log-normally in thinned
mature stands and soil species were not distributed normally or log-normally in unthinned mature
Diversity 2012, 4
340
stands, departures that were due to heavy left tails. ANOVA is robust to these violations so long as the
sample sizes are equal [41], which in our data include all variables except numbers of soil and litter
arthropods. To account for this, we dropped locales with uneven sample sizes from the analyses of
those two arthropod groups.
3. Results
3.1. Univariate Analyses
3.1.1. Mineral Soil Organic Matter and Forest Floor
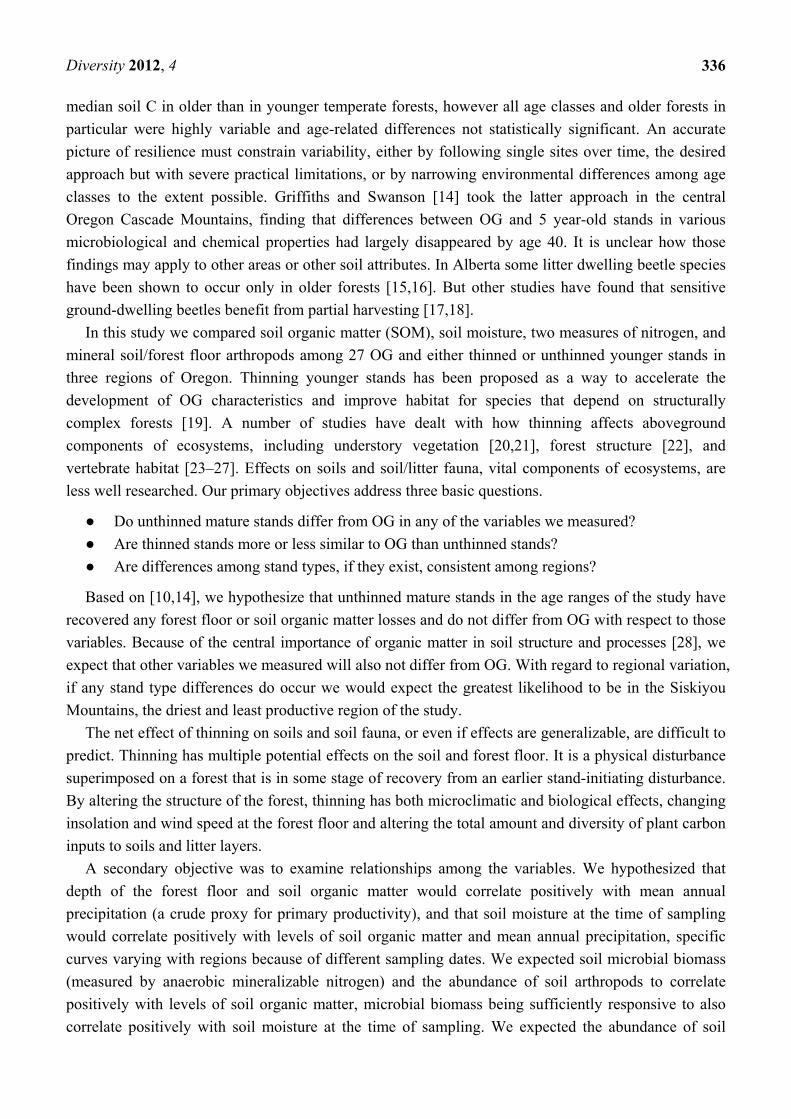
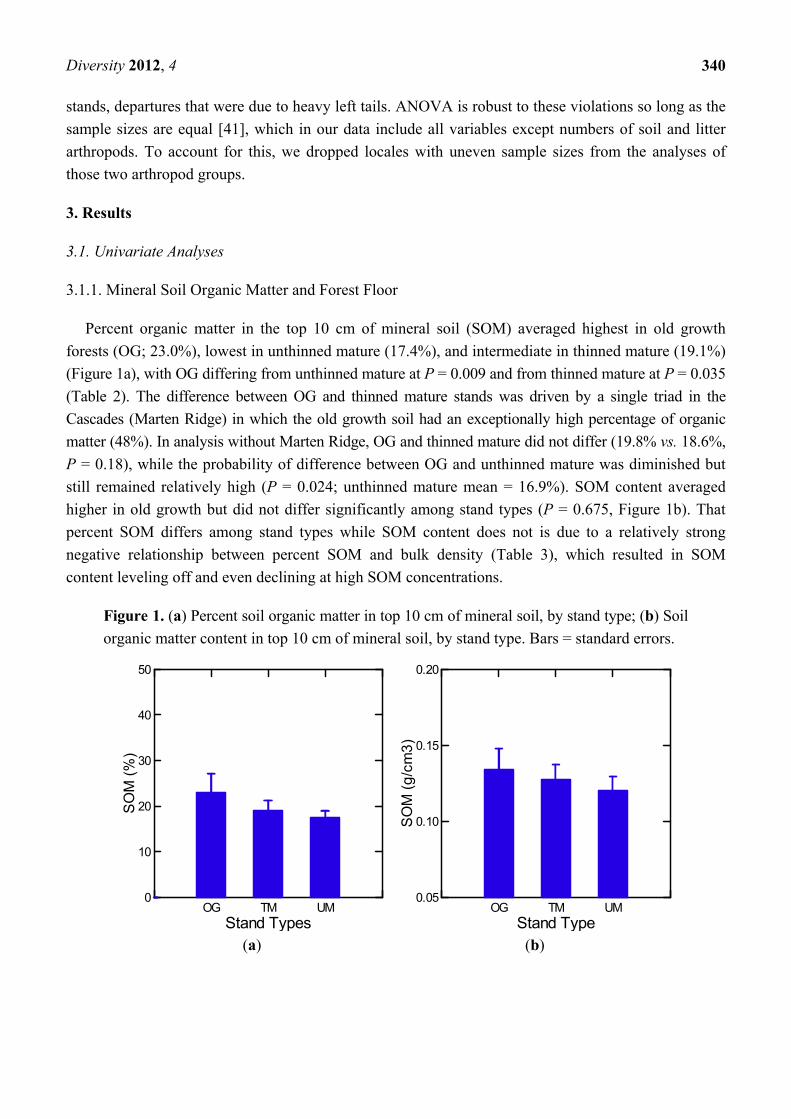
Percent organic matter in the top 10 cm of mineral soil (SOM) averaged highest in old growth
forests (OG; 23.0%), lowest in unthinned mature (17.4%), and intermediate in thinned mature (19.1%)
(Figure 1a), with OG differing from unthinned mature at P = 0.009 and from thinned mature at P = 0.035
(Table 2). The difference between OG and thinned mature stands was driven by a single triad in the
Cascades (Marten Ridge) in which the old growth soil had an exceptionally high percentage of organic
matter (48%). In analysis without Marten Ridge, OG and thinned mature did not differ (19.8% vs. 18.6%,
P = 0.18), while the probability of difference between OG and unthinned mature was diminished but
still remained relatively high (P = 0.024; unthinned mature mean = 16.9%). SOM content averaged
higher in old growth but did not differ significantly among stand types (P = 0.675, Figure 1b). That
percent SOM differs among stand types while SOM content does not is due to a relatively strong
negative relationship between percent SOM and bulk density (Table 3), which resulted in SOM
content leveling off and even declining at high SOM concentrations.
Figure 1. (a) Percent soil organic matter in top 10 cm of mineral soil, by stand type; (b) Soil
organic matter content in top 10 cm of mineral soil, by stand type. Bars = standard errors.
(a) (b)
OG TM UMStand Types
0
10
20
30
40
50
SO
M (
%)
OG TM UMStand Type
0.05
0.10
0.15
0.20
SO
M (
g/c
m3
)
Diversity 2012, 4
341
Table 2. Summary of ANCOVA results. df = 2, 4 in all cases. SOM = soil organic matter;
AMN = anaerobic mineralizable nitrogen; MR = Marten Ridge Site; TC = Taylor Creek site.
Response Variable Factor F P
SOM % Stand Types 17.7 0.01 SOM % Stand Types w/o MR 10.0 0.03 SOM (g/cm3) Stand Types 1.2 0.38 Soil Moisture (%) Stand Types 15.7 0.01 Soil Moisture (%) Stand Types w/o MR 7.2 0.05 Soil Moisture (g/cm3) Stand Types 9.5 0.03 Soil Moisture (g/cm3) Stand Types w/o MR 5.0 0.08 AMN Stand Types 1.6 0.31 AMN Stand Types w/o TC 16.5 0.01 Epigeic Macrofauna Richness Stand Types 9.8 0.03
Regional differences were highly significant, due solely to the Siskiyous, which averaged slightly
over one-half the SOM percent and three-quarters the SOM content as the more northerly regions (the
latter two not differing from one another). Across all sites and stand types, the best regression model
explained 58% of the variation in SOM percent and included forest floor depth (P = 0.000, positive)
and elevation (Table 3). Forest floor depth and elevation were not correlated. Mean annual temperature
was a significant factor only in the Coast Range, where it correlated strongly and negatively with SOM
percent (Table 3). Stand types differed in the strength of the relationship between SOM percent and
forest floor depth. In OG and thinned mature stands, only forest floor depth was selected in step wise
models, but it explained considerably less of the variance in the SOM percent of OG than it did for that
of thinned mature (R2 = 41% and 79%, respectively; Table 3). In unthinned mature stands, forest floor
depth was also the most significant independent variable, explaining 56% of the variation, but in
contrast to the other stand types elevation was a significant factor, increasing the model R2 to 0.74.
The mean depth of forest floor was higher in OG than in unthinned or thinned mature stands
(47 mm vs. 39 mm and 35 mm, respectively), however differences were not statistically significant
(P for stand type differences in ANCOVA = 0.25). As was the case with SOM and forest floor, stand
types differed appreciably in the relation between forest floor depth and climatic variables (mean
annual precipitation and mean annual temperature) as proxies for potential site productivity [42]. For
OG, there was no relation (R2 = 0.12) and for thinned mature stands there was a weak relationship with
mean annual precipitation (R2 = 0.32, P = 0.11) and none with mean annual temperature. Only
unthinned mature stands produced a significant model, and that only with mean annual precipitation
(Table 3). Regionally, forest floor was significantly deeper in the more mesic regions than in the
Siskiyous, averaging 51, 44, and 26 mm in the Cascades, Coast Range, and Siskiyous, respectively. Not
surprisingly, regional differences were significantly related to climate. In ANCOVA with mean annual
precipitation and mean annual temperature as covariates the three regions did not differ significantly.
Mean annual precipitation was the principle climatic influence, explaining 25% of the variation
(P = 0.008, F = 8.45, df = 1, 25). Mean annual temperature had essentially no influence, but unlike
precipitation varied little among the regions.
Diversity 2012, 4
342
Table 3. Summary of significant regression models for soil organic matter (SOM), bulk
density (BD), forest floor depth (FF), soil moisture, anaerobic mineralizable nitrogen (AMN),
and denitrification potential (DP). OG = old growth; TM = thinned mature; UM = unthinned
mature; MAP= mean annual precipitation; MAT = mean annual temperature; TCM = Taylor
Creek mature stands.
Dependent Variable Data Base Independent Variable(s)
(sign of coefficient) R2 F df P
Log [SOM (%)] All Log [FF] (+) Log [elevation] (−)
0.58 16.2 2, 24 0.000
SOM (%) Coast Range MAT (−) 0.82 34.0 1, 7 0.001Log [SOM (%)] All OG Log [FF] (+) 0.41 4.92 1, 7 0.062Log [SOM (%)] All TM Log [FF ](+) 0.79 27.0 1, 7 0.001Log [SOM (%)] All UM Log [FF] (+)
Log [elevation] (−) 0.74 8.64 2, 6 0.017
BD All SOM % (−) 0.59 36.3 1, 25 0.000
Log [FF] All UM Log [MAP] (+) 0.62 11.2 1, 7 0.012
Log [Soil Moisture(%)] All Log [SOM(%)] (+) 0.89 194.0 1, 25 0.000Soil Moisture (g/cm3) All SOM (%) 0.80 102.0 1, 25 0.000
AMN w/o TCM soil moisture (g/cm3)(+) MAP (−) 0.41 7.69 2, 22 0.003
Log [DP] TM Log [AMN] (+) Log [soil moisture (g/cm3)] (+)
0.61 4.7 2, 6 0.06
Log [DP] UM Log [AMN] (+) 0.49 6.7 1, 7 0.04 Log [DP} OG Log [soil mesofauna (abundance)] (−)
Log [soil moisture (g/cm3)] (+) 0.94 33.5 2, 4 0.003
3.1.2. Among and within Stand Distribution of Soil Organic Matter
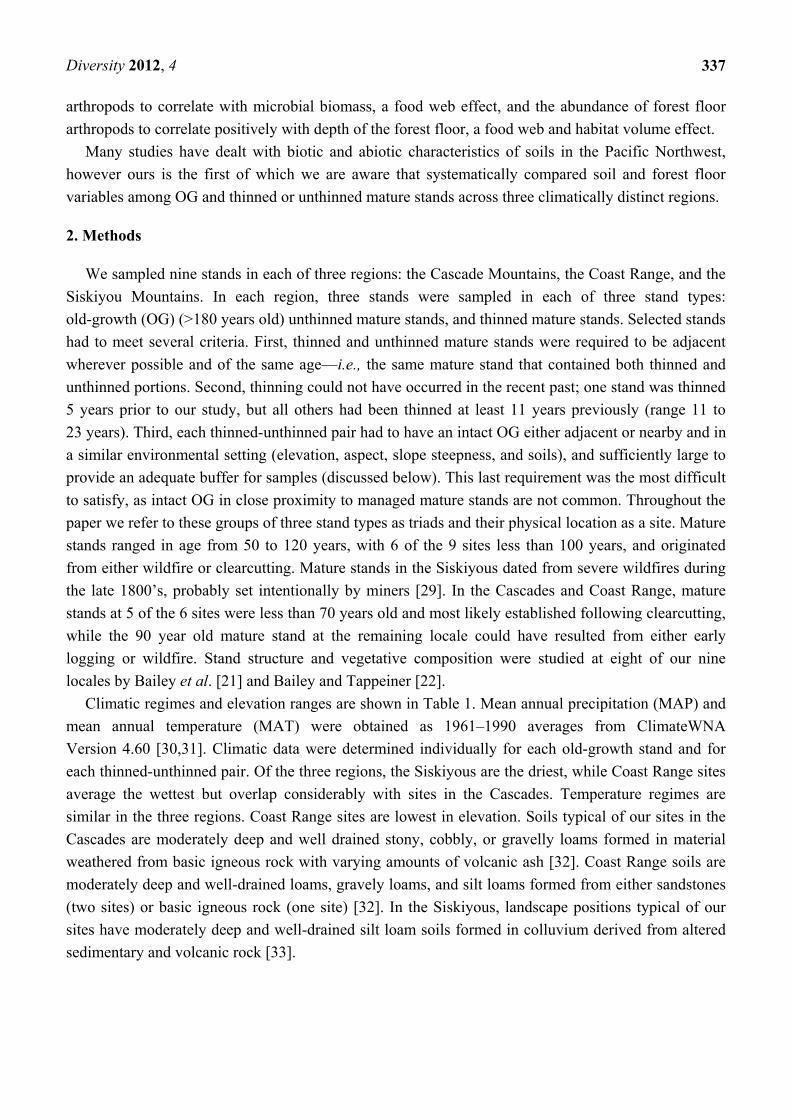
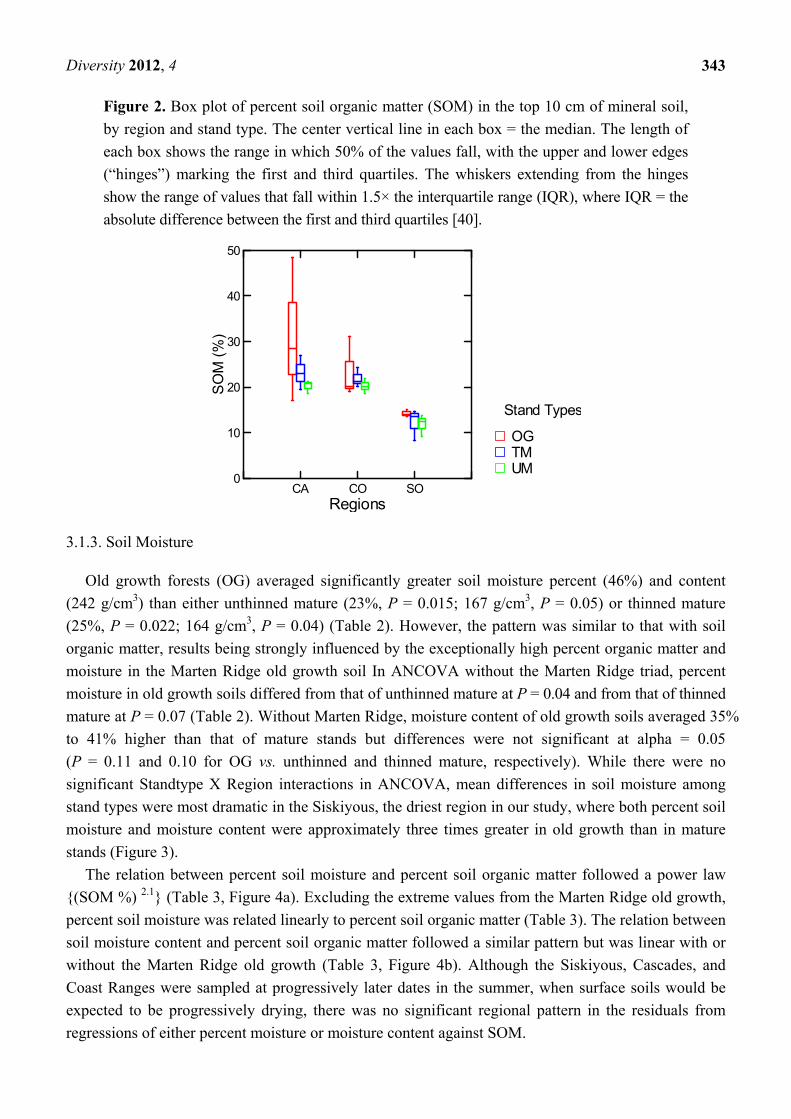
The structure of among-stand heterogeneity in percent soil organic matter differed strikingly
between the Siskiyous and the more northerly regions (Figure 2). The three OG stands in the Cascades
varied widely among themselves (CV = 0.68), while those in the Siskiyous were highly uniform
(CV = 0.06) and those in the Coast Range intermediate (CV = 0.29). In contrast, mature stands in the
Siskiyou’s were more variable that in the other regions (Figure 2). Consequently, when compared to
the OG within their respective regions, mature stands were relatively uniform in the Cascades and
Coast Range but more diverse in the Siskiyous.
Within stands, percent SOM had heavy-tailed distributions (either Pareto or lognormal) in all but
two OG stands, one of which had a normal and the other—the aforementioned Marten Ridge—a
distinct U-shaped distribution. Percent SOM was heavy-tailed (lognormal) in six unthinned mature
stands and distributed normally in three, while in thinned mature stands that ratio was reversed, with
normal distributions characterizing six of the nine stands and heavy-tails the other three.
Diversity 2012, 4
343
Figure 2. Box plot of percent soil organic matter (SOM) in the top 10 cm of mineral soil,
by region and stand type. The center vertical line in each box = the median. The length of
each box shows the range in which 50% of the values fall, with the upper and lower edges
(“hinges”) marking the first and third quartiles. The whiskers extending from the hinges
show the range of values that fall within 1.5× the interquartile range (IQR), where IQR = the
absolute difference between the first and third quartiles [40].
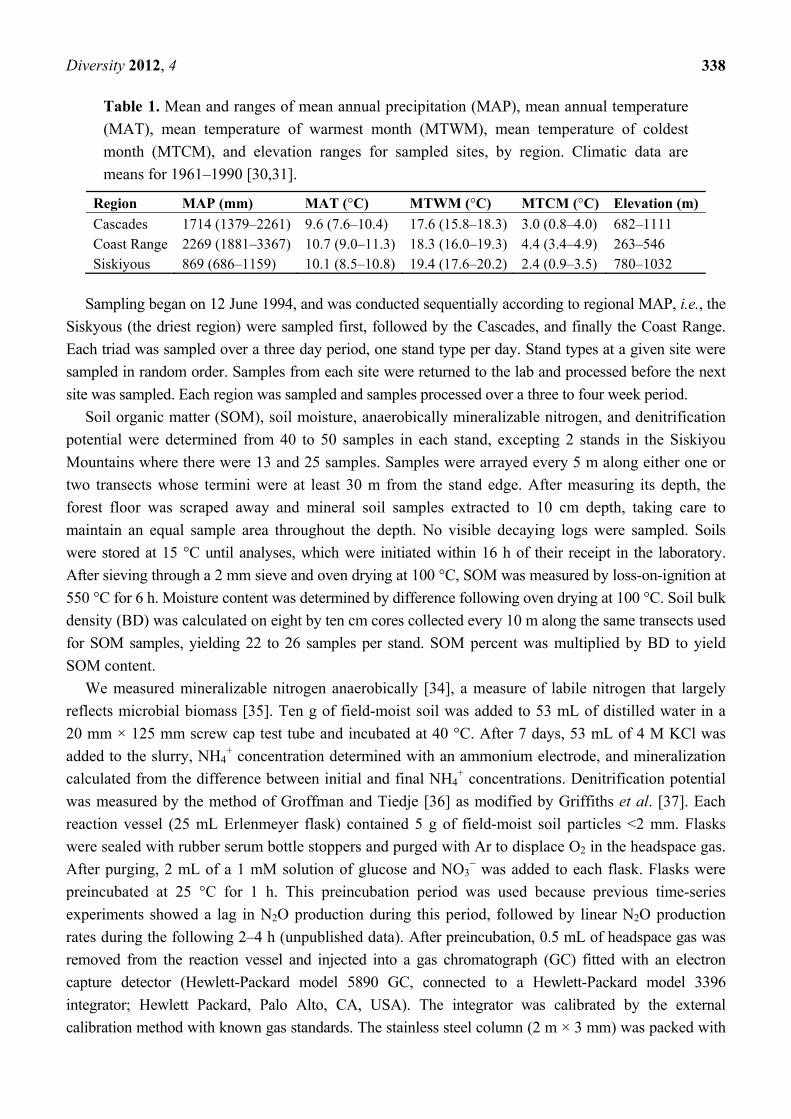
3.1.3. Soil Moisture
Old growth forests (OG) averaged significantly greater soil moisture percent (46%) and content
(242 g/cm3) than either unthinned mature (23%, P = 0.015; 167 g/cm3, P = 0.05) or thinned mature
(25%, P = 0.022; 164 g/cm3, P = 0.04) (Table 2). However, the pattern was similar to that with soil
organic matter, results being strongly influenced by the exceptionally high percent organic matter and
moisture in the Marten Ridge old growth soil In ANCOVA without the Marten Ridge triad, percent
moisture in old growth soils differed from that of unthinned mature at P = 0.04 and from that of thinned
mature at P = 0.07 (Table 2). Without Marten Ridge, moisture content of old growth soils averaged 35%
to 41% higher than that of mature stands but differences were not significant at alpha = 0.05
(P = 0.11 and 0.10 for OG vs. unthinned and thinned mature, respectively). While there were no
significant Standtype X Region interactions in ANCOVA, mean differences in soil moisture among
stand types were most dramatic in the Siskiyous, the driest region in our study, where both percent soil
moisture and moisture content were approximately three times greater in old growth than in mature
stands (Figure 3).
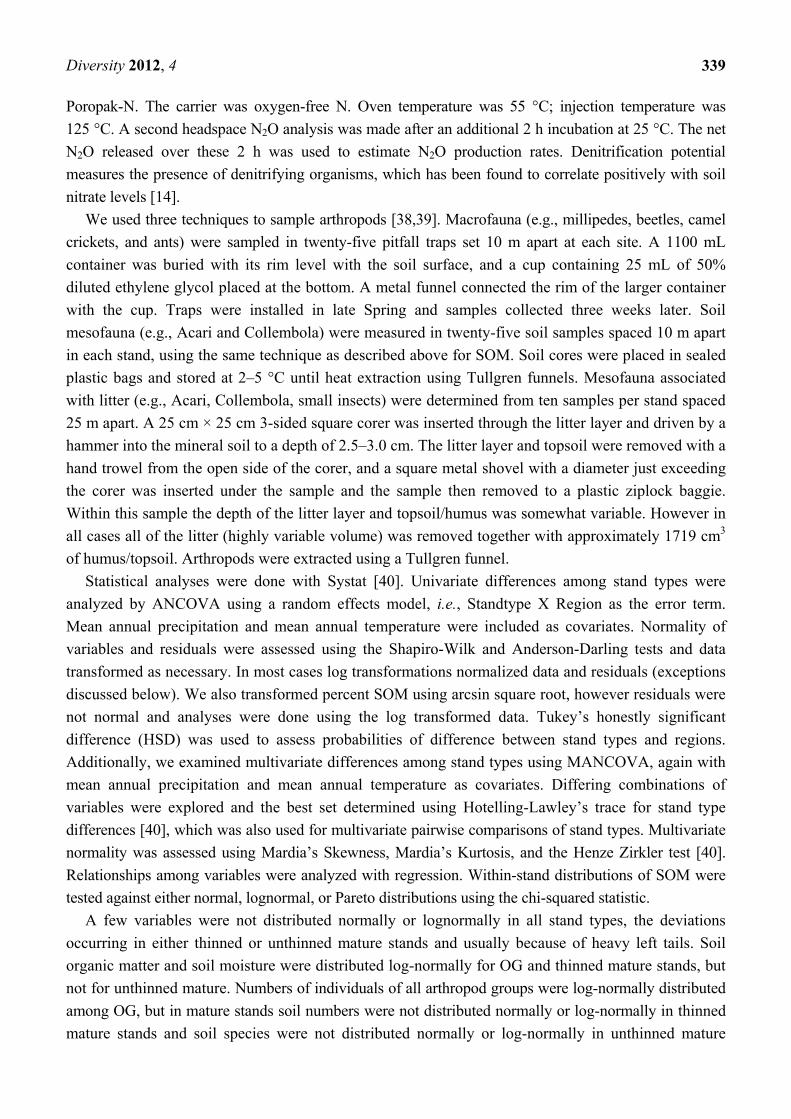
The relation between percent soil moisture and percent soil organic matter followed a power law
{(SOM %) 2.1} (Table 3, Figure 4a). Excluding the extreme values from the Marten Ridge old growth,
percent soil moisture was related linearly to percent soil organic matter (Table 3). The relation between
soil moisture content and percent soil organic matter followed a similar pattern but was linear with or
without the Marten Ridge old growth (Table 3, Figure 4b). Although the Siskiyous, Cascades, and
Coast Ranges were sampled at progressively later dates in the summer, when surface soils would be
expected to be progressively drying, there was no significant regional pattern in the residuals from
regressions of either percent moisture or moisture content against SOM.
UMTMOG
Stand Types
CA CO SORegions
0
10
20
30
40
50
SO
M (
%)
Diversity 2012, 4
344
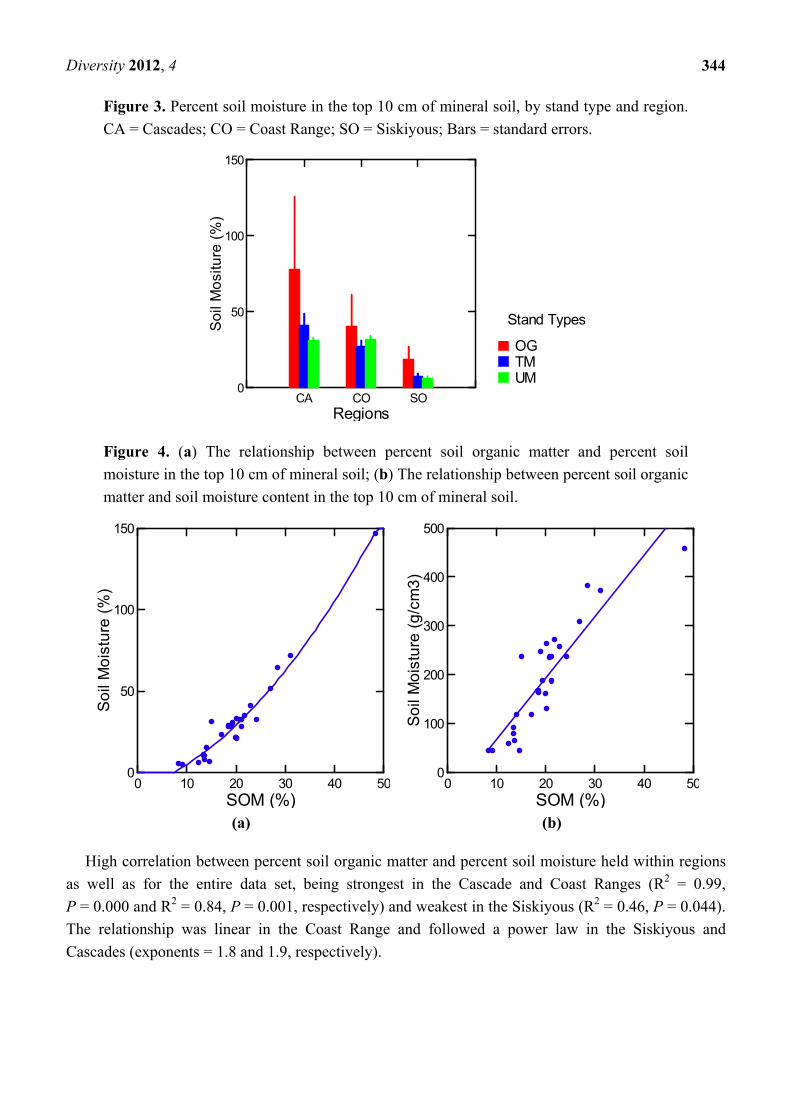
Figure 3. Percent soil moisture in the top 10 cm of mineral soil, by stand type and region.
CA = Cascades; CO = Coast Range; SO = Siskiyous; Bars = standard errors.
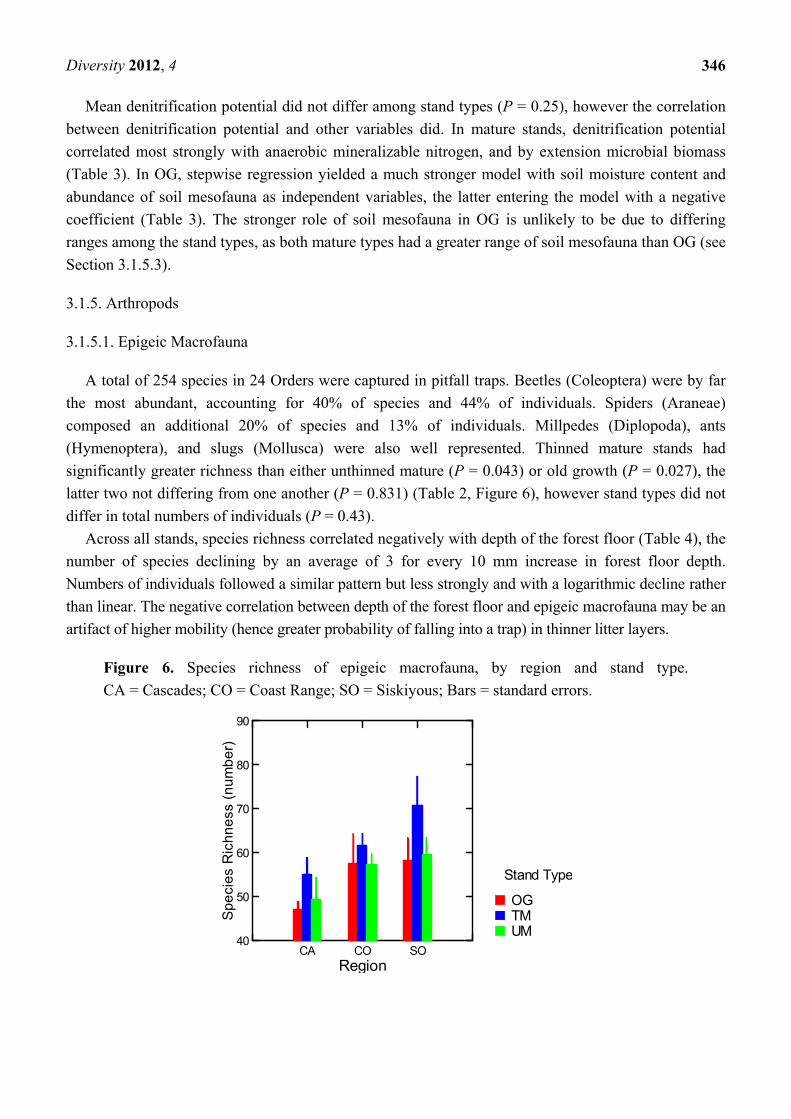
Figure 4. (a) The relationship between percent soil organic matter and percent soil
moisture in the top 10 cm of mineral soil; (b) The relationship between percent soil organic
matter and soil moisture content in the top 10 cm of mineral soil.
(a) (b)
High correlation between percent soil organic matter and percent soil moisture held within regions
as well as for the entire data set, being strongest in the Cascade and Coast Ranges (R2 = 0.99,
P = 0.000 and R2 = 0.84, P = 0.001, respectively) and weakest in the Siskiyous (R2 = 0.46, P = 0.044).
The relationship was linear in the Coast Range and followed a power law in the Siskiyous and
Cascades (exponents = 1.8 and 1.9, respectively).
UMTMOG
Stand Types
CA CO SORegions
0
50
100
150
So
il M
osi
ture
(%
)
0 10 20 30 40 50SOM (%)
0
50
100
150
So
il M
ois
ture
(%
)
0 10 20 30 40 50SOM (%)
0
100
200
300
400
500
So
il M
ois
ture
(g
/cm
3)

Diversity 2012, 4
345
3.1.4. Nitrogen
Anaerobically mineralizable nitrogen (AMN) did not differ among stand types when using the full
data set, however that was due to a single site in the Siskiyous (Thompson Creek) in which both
mature stands but not the old growth had exceptionally high levels. In ANCOVA without that site, OG
had significantly higher mineralizable nitrogen than either mature stand (P = 0.015 for unthinned and
0.018 for thinned) (Table 2, Figure 5a). Because anaerobically mineralizable nitrogen largely reflects
microbial biomass [18], we tested the hypothesis that differences between OG and mature stands were
influenced by higher quality soil organic matter (SOM) in the former, a phenomenon seen in other
studies (see discussion). We used two approaches, regression of AMN vs. SOM by stand type and
ANCOVA of the ratio AMN/SOM. Neither was satisfactory. Regression was statistically insignificant
in all stand types, as was ANCOVA for stand type differences (P = 0.66). In summary, we could
demonstrate no difference among stand types in the quality of soil organic matter, however our
methods may not have been sensitive enough to detect differences.
Figure 5. (a) Anaerobic mineralizable nitrogen (AMN) by regions and stand types within
regions. One outlying triad in the Siskiyous is excluded. CA = Cascades, CO = Coast
Range, SO = Siskiyous. Bars = standard errors; (b) The relationship between anaerobic
mineralizable nitrogen (AMN) and percent soil organic matter (all sites included).
(a) (b)
In a stepwise model (not including the two outlying Thompson Creek stands), 41% of the variation
in anaerobically mineralizable nitrogen was explained by soil moisture content (P = 0.001) and mean
annual precipitation (P = 0.056), the latter entering the model with a negative coefficient (Table 3).
The negative effect of mean annual precipitation could reflect declining microbial activity as the
summer progressed (regions with higher precipitation being sampled later in the season), however
there was no regional pattern in the residuals from a model that included only soil moisture. The
relation of AMN with soil organic matter (SOM) is shown in Figure 5a. Ignoring the two outlying sites
from the Siskiyous (upper left in the graph). AMN increased with SOM up to 20%–25% SOM, then
leveled off.
UMTMOG
STANDTYPE$
CA CO SO
Region
0
50
100
150
AM
N (
µg
/gd
w)
0 10 20 30 40 50
Soil Organic Matter (%)
0
50
100
150
200
AM
N (
µg
/gd
w)
Diversity 2012, 4
346
Mean denitrification potential did not differ among stand types (P = 0.25), however the correlation
between denitrification potential and other variables did. In mature stands, denitrification potential
correlated most strongly with anaerobic mineralizable nitrogen, and by extension microbial biomass
(Table 3). In OG, stepwise regression yielded a much stronger model with soil moisture content and
abundance of soil mesofauna as independent variables, the latter entering the model with a negative
coefficient (Table 3). The stronger role of soil mesofauna in OG is unlikely to be due to differing
ranges among the stand types, as both mature types had a greater range of soil mesofauna than OG (see
Section 3.1.5.3).
3.1.5. Arthropods
3.1.5.1. Epigeic Macrofauna
A total of 254 species in 24 Orders were captured in pitfall traps. Beetles (Coleoptera) were by far
the most abundant, accounting for 40% of species and 44% of individuals. Spiders (Araneae)
composed an additional 20% of species and 13% of individuals. Millpedes (Diplopoda), ants
(Hymenoptera), and slugs (Mollusca) were also well represented. Thinned mature stands had
significantly greater richness than either unthinned mature (P = 0.043) or old growth (P = 0.027), the
latter two not differing from one another (P = 0.831) (Table 2, Figure 6), however stand types did not
differ in total numbers of individuals (P = 0.43).
Across all stands, species richness correlated negatively with depth of the forest floor (Table 4), the
number of species declining by an average of 3 for every 10 mm increase in forest floor depth.
Numbers of individuals followed a similar pattern but less strongly and with a logarithmic decline rather
than linear. The negative correlation between depth of the forest floor and epigeic macrofauna may be an
artifact of higher mobility (hence greater probability of falling into a trap) in thinner litter layers.
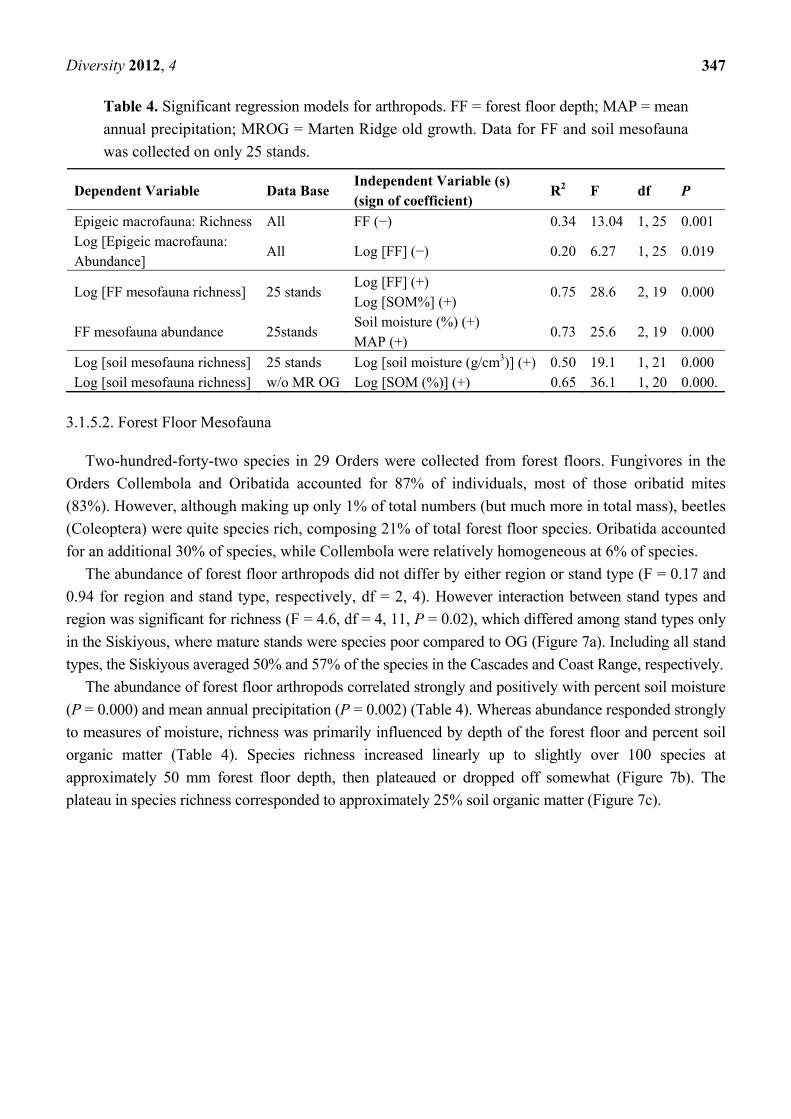
Figure 6. Species richness of epigeic macrofauna, by region and stand type.
CA = Cascades; CO = Coast Range; SO = Siskiyous; Bars = standard errors.
UMTMOG
Stand Type
CA CO SORegion
40
50
60
70
80
90
Sp
eci
es
Ric
hn
ess
(n
um
be
r)
Diversity 2012, 4
347
Table 4. Significant regression models for arthropods. FF = forest floor depth; MAP = mean
annual precipitation; MROG = Marten Ridge old growth. Data for FF and soil mesofauna
was collected on only 25 stands.
Dependent Variable Data Base Independent Variable (s) (sign of coefficient)
R2 F df P
Epigeic macrofauna: Richness All FF (−) 0.34 13.04 1, 25 0.001Log [Epigeic macrofauna: Abundance]
All Log [FF] (−) 0.20 6.27 1, 25 0.019
Log [FF mesofauna richness] 25 stands Log [FF] (+) Log [SOM%] (+)
0.75 28.6 2, 19 0.000
FF mesofauna abundance 25stands Soil moisture (%) (+) MAP (+)
0.73 25.6 2, 19 0.000
Log [soil mesofauna richness] 25 stands Log [soil moisture (g/cm3)] (+) 0.50 19.1 1, 21 0.000Log [soil mesofauna richness] w/o MR OG Log [SOM (%)] (+) 0.65 36.1 1, 20 0.000.
3.1.5.2. Forest Floor Mesofauna
Two-hundred-forty-two species in 29 Orders were collected from forest floors. Fungivores in the
Orders Collembola and Oribatida accounted for 87% of individuals, most of those oribatid mites
(83%). However, although making up only 1% of total numbers (but much more in total mass), beetles
(Coleoptera) were quite species rich, composing 21% of total forest floor species. Oribatida accounted
for an additional 30% of species, while Collembola were relatively homogeneous at 6% of species.
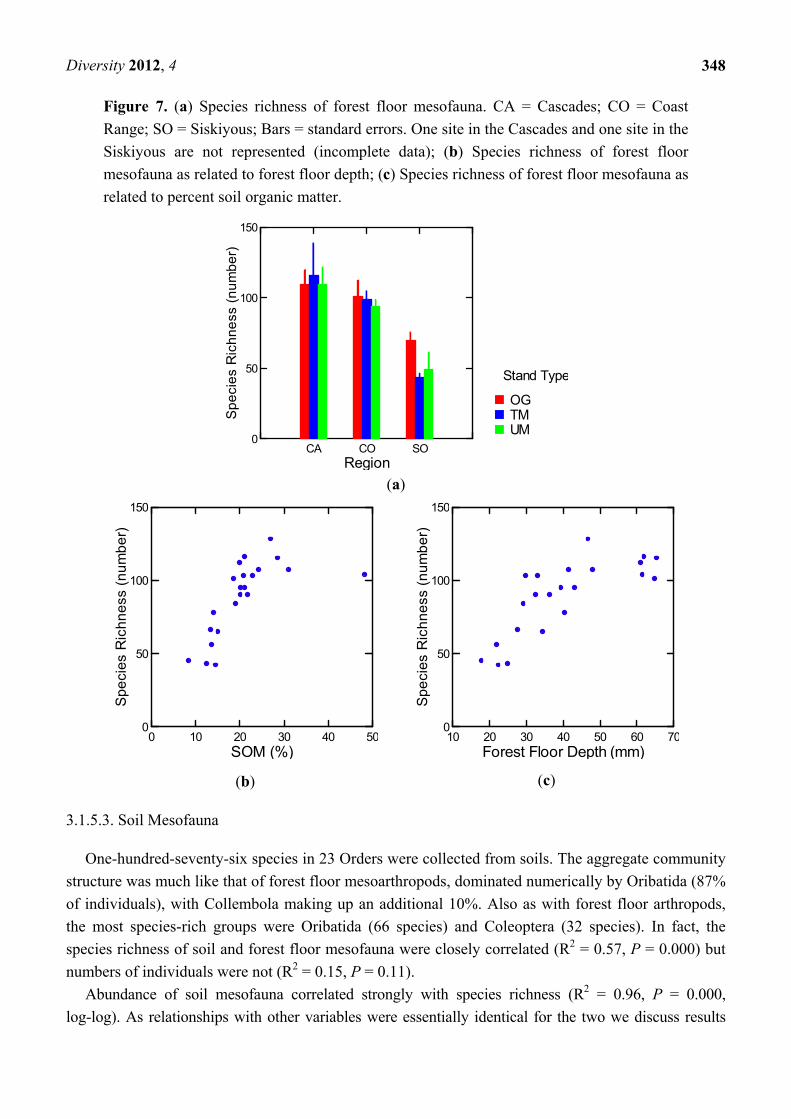
The abundance of forest floor arthropods did not differ by either region or stand type (F = 0.17 and
0.94 for region and stand type, respectively, df = 2, 4). However interaction between stand types and
region was significant for richness (F = 4.6, df = 4, 11, P = 0.02), which differed among stand types only
in the Siskiyous, where mature stands were species poor compared to OG (Figure 7a). Including all stand
types, the Siskiyous averaged 50% and 57% of the species in the Cascades and Coast Range, respectively.
The abundance of forest floor arthropods correlated strongly and positively with percent soil moisture
(P = 0.000) and mean annual precipitation (P = 0.002) (Table 4). Whereas abundance responded strongly
to measures of moisture, richness was primarily influenced by depth of the forest floor and percent soil
organic matter (Table 4). Species richness increased linearly up to slightly over 100 species at
approximately 50 mm forest floor depth, then plateaued or dropped off somewhat (Figure 7b). The
plateau in species richness corresponded to approximately 25% soil organic matter (Figure 7c).
Diversity 2012, 4
348
Figure 7. (a) Species richness of forest floor mesofauna. CA = Cascades; CO = Coast
Range; SO = Siskiyous; Bars = standard errors. One site in the Cascades and one site in the
Siskiyous are not represented (incomplete data); (b) Species richness of forest floor
mesofauna as related to forest floor depth; (c) Species richness of forest floor mesofauna as
related to percent soil organic matter.
(a)
(b) (c)
3.1.5.3. Soil Mesofauna
One-hundred-seventy-six species in 23 Orders were collected from soils. The aggregate community
structure was much like that of forest floor mesoarthropods, dominated numerically by Oribatida (87%
of individuals), with Collembola making up an additional 10%. Also as with forest floor arthropods,
the most species-rich groups were Oribatida (66 species) and Coleoptera (32 species). In fact, the
species richness of soil and forest floor mesofauna were closely correlated (R2 = 0.57, P = 0.000) but
numbers of individuals were not (R2 = 0.15, P = 0.11).
Abundance of soil mesofauna correlated strongly with species richness (R2 = 0.96, P = 0.000,
log-log). As relationships with other variables were essentially identical for the two we discuss results
UMTMOG
Stand Type
CA CO SORegion
0
50
100
150S
pe
cie
s R
ich
ne
ss (
nu
mb
er)
0 10 20 30 40 50SOM (%)
0
50
100
150
Sp
eci
es
Ric
hn
ess
(n
um
be
r)
10 20 30 40 50 60 70Forest Floor Depth (mm)
0
50
100
150
Sp
eci
es
Ric
hn
ess
(n
um
be
r)
Diversity 2012, 4
349
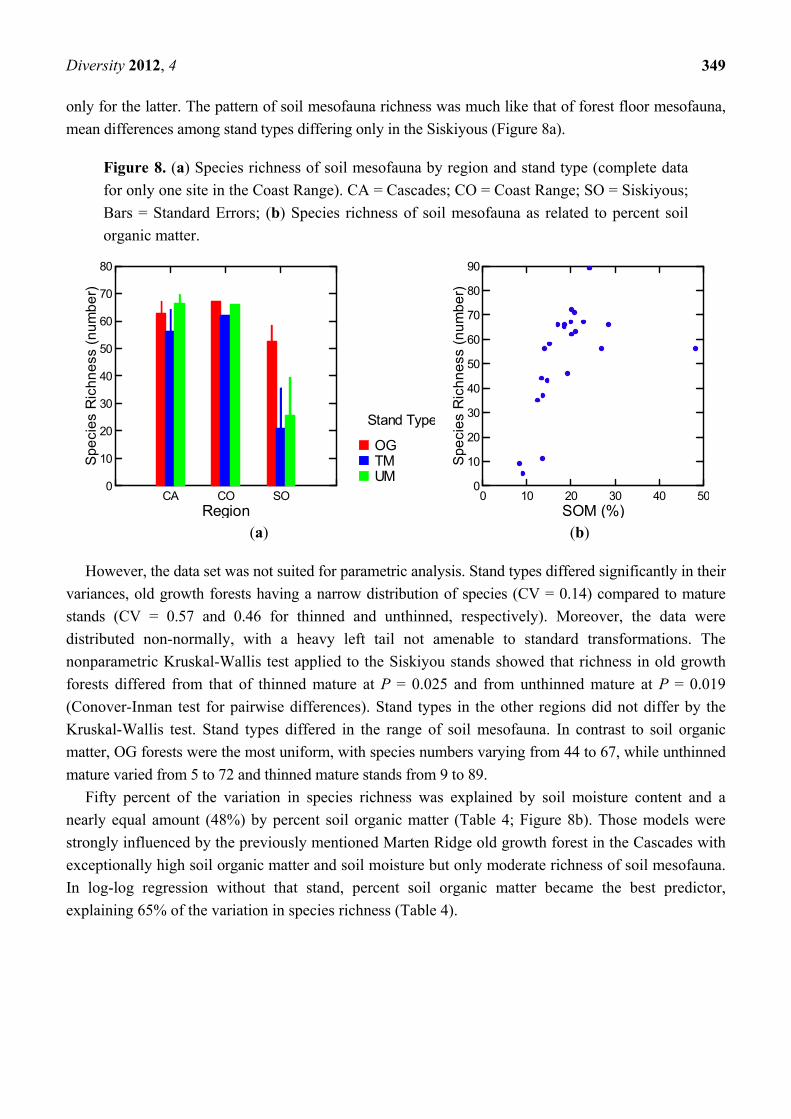
only for the latter. The pattern of soil mesofauna richness was much like that of forest floor mesofauna,
mean differences among stand types differing only in the Siskiyous (Figure 8a).
Figure 8. (a) Species richness of soil mesofauna by region and stand type (complete data
for only one site in the Coast Range). CA = Cascades; CO = Coast Range; SO = Siskiyous;
Bars = Standard Errors; (b) Species richness of soil mesofauna as related to percent soil
organic matter.
(a) (b)
However, the data set was not suited for parametric analysis. Stand types differed significantly in their
variances, old growth forests having a narrow distribution of species (CV = 0.14) compared to mature
stands (CV = 0.57 and 0.46 for thinned and unthinned, respectively). Moreover, the data were
distributed non-normally, with a heavy left tail not amenable to standard transformations. The
nonparametric Kruskal-Wallis test applied to the Siskiyou stands showed that richness in old growth
forests differed from that of thinned mature at P = 0.025 and from unthinned mature at P = 0.019
(Conover-Inman test for pairwise differences). Stand types in the other regions did not differ by the
Kruskal-Wallis test. Stand types differed in the range of soil mesofauna. In contrast to soil organic
matter, OG forests were the most uniform, with species numbers varying from 44 to 67, while unthinned
mature varied from 5 to 72 and thinned mature stands from 9 to 89.
Fifty percent of the variation in species richness was explained by soil moisture content and a
nearly equal amount (48%) by percent soil organic matter (Table 4; Figure 8b). Those models were
strongly influenced by the previously mentioned Marten Ridge old growth forest in the Cascades with
exceptionally high soil organic matter and soil moisture but only moderate richness of soil mesofauna.
In log-log regression without that stand, percent soil organic matter became the best predictor,
explaining 65% of the variation in species richness (Table 4).
UMTMOG
Stand Type
CA CO SORegion
0
10
20
30
40
50
60
70
80
Sp
eci
es
Ric
hn
ess
(n
um
be
r)
0 10 20 30 40 50SOM (%)
0
10
20
30
40
50
60
70
80
90
Sp
eci
es
Ric
hn
ess
(n
um
be
r)
Diversity 2012, 4
350
3.2. Multivariate Analysis of Variance
3.2.1. With Soil Mesofauna
Two sites in the Coast Range had either no or incomplete data on soil mesofauna, so analyses in
this section include only seven of the nine sites. The best multivariate model included anaerobic
mineralizable nitrogen and richness and abundance of soil mesofauna (Table 5, Model 1), with old
growth differing from both unthinned and thinned mature stands at P = 0.004 and the two mature stand
types not differing (P = 0.46). All variables had the highest mean values in old growth.
Table 5. Significant multivariate models of stand type differences. AMN = anaerobic
mineralizable nitrogen; FF = forest floor; H-L Trace = Hotelling-Lawley Trace.
Models H-L Trace F df OG vs. TM OG vs. UM UM vs. TM
With Soil Mesofauna (7 sites) Model 1 0.019 3.79 6, 14 0.004 0.004 0.460
Without Soil Mesofauna, with
FF mesofauna (7 sites)
Model 2 0.010 4.42 6, 14 0.0012 0.010 0.626
Model 3 0.047 2.90 8, 12 0.006 0.029 0.710
Without soil or FF mesofauna
(9 sites) Model 4 0.012 4.1 4, 28 0.009 0.048 0.076
Note: Model 1: Log (AMN), Log (Soil Mesofauna: Richness), Log (Soil Mesofauna: Abundance);
Model 2: Log (AMN), Log (Moisture Content), Log (FF Mesofauna: Richness); Model 3: Log (SOM),
Log (AMN), Log (Moisture Content), Log (FF Mesofauna: Richness); Model 4: Log (Moisture Content),
Epigeic Macrofauna: Richness.
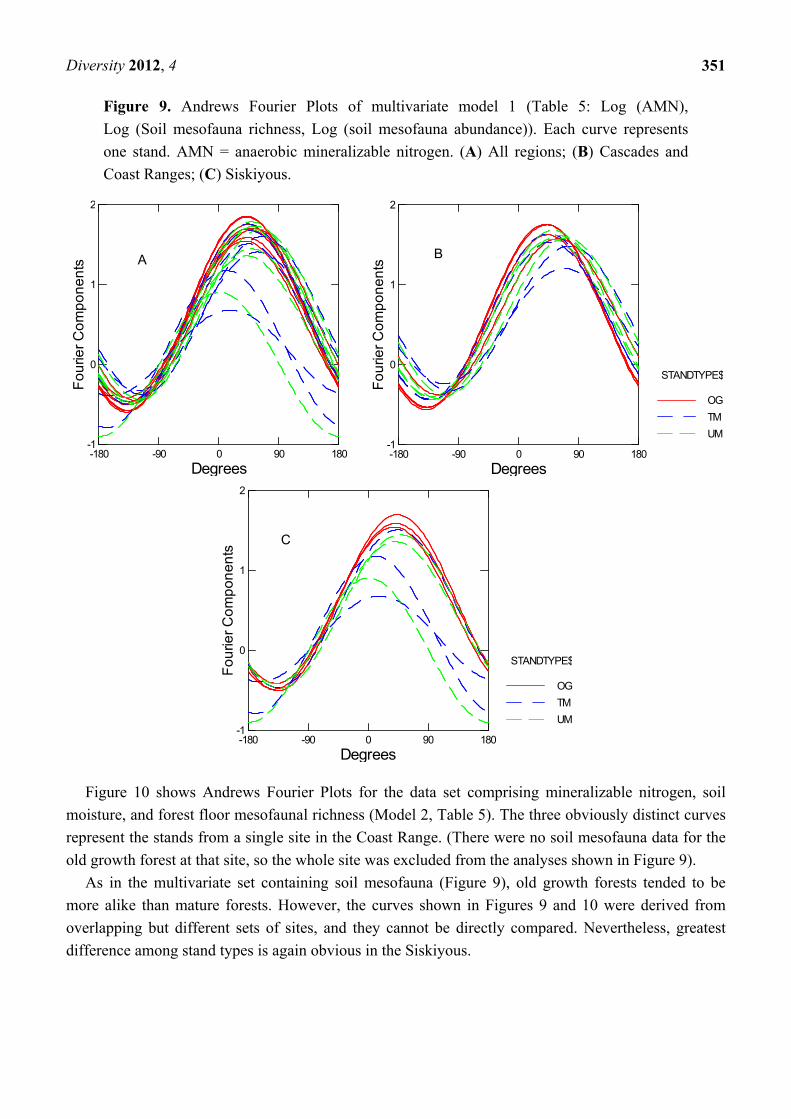
Figure 9 shows Andrews Fourier Plots [43] for model 1, with all regions together and for the
Siskiyous separate from the two more mesic regions (Coast Range and Cascades). Andrews Fourier
Plots are a powerful tool for showing clustering in multivariate data sets [40]. Each curve represents
the Fourier components for an individual stand of the above multivariate data set (standardized).
Curves for old growth are clearly more clustered than those for the two mature stand types, in the
regions as a whole and in each region. Relatively loose clustering among mature stands is most
dramatic in the Siskiyous, but also evident in the more mesic regions. For this particular multivariate
set, old growth forests across the region were more uniform than mature stands.
3.2.2. Without Soil Mesofauna, with Forest Floor Mesofauna
Two sites were not included because of incomplete data for forest floor mesofauna (not the same two
as with soil mesofauna). The best model on the remaining subset of seven sites included anaerobic
mineralizable nitrogen, soil moisture content, and richness of forest floor mesofauna (Table 5). Old
growth differed from both mature stand types (P = 0.012 and 0.010 for thinned and unthinned mature,
respectively) while the two mature stand types did not differ (P = 0.63). Adding soil organic matter
reduced the strength but the model retained statistical significance (Model 3, Table 5), old growth
differing from thinned mature stands at P = 0.006 and from unthinned mature at P = 0.029), while the
two mature stand types did not differ (P = 0.710).
Diversity 2012, 4
351
Figure 9. Andrews Fourier Plots of multivariate model 1 (Table 5: Log (AMN),
Log (Soil mesofauna richness, Log (soil mesofauna abundance)). Each curve represents
one stand. AMN = anaerobic mineralizable nitrogen. (A) All regions; (B) Cascades and
Coast Ranges; (C) Siskiyous.
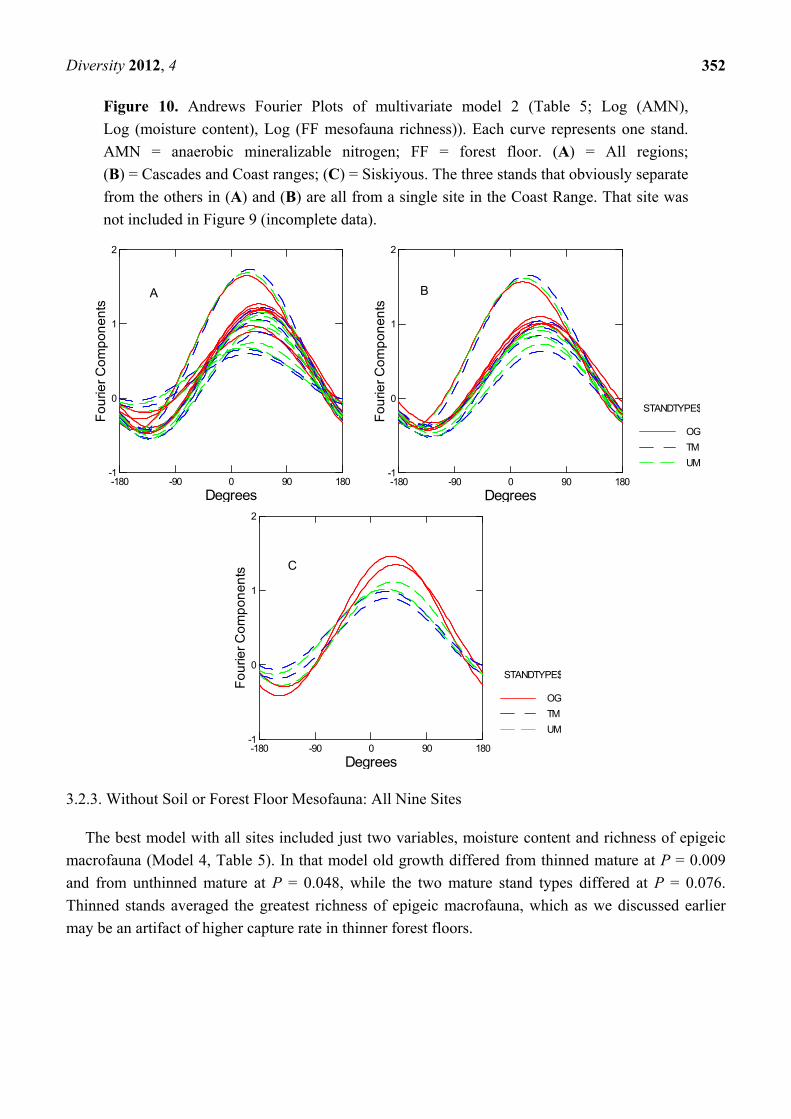
Figure 10 shows Andrews Fourier Plots for the data set comprising mineralizable nitrogen, soil
moisture, and forest floor mesofaunal richness (Model 2, Table 5). The three obviously distinct curves
represent the stands from a single site in the Coast Range. (There were no soil mesofauna data for the
old growth forest at that site, so the whole site was excluded from the analyses shown in Figure 9).
As in the multivariate set containing soil mesofauna (Figure 9), old growth forests tended to be
more alike than mature forests. However, the curves shown in Figures 9 and 10 were derived from
overlapping but different sets of sites, and they cannot be directly compared. Nevertheless, greatest
difference among stand types is again obvious in the Siskiyous.
-180 -90 0 90 180
Degrees
-1
0
1
2
Fo
urie
r C
om
po
ne
nts A
UM
TM
OG
STANDTYPE$
-180 -90 0 90 180
Degrees
-1
0
1
2
Fo
urie
r C
om
po
ne
nts
B
UM
TM
OG
STANDTYPE$
-180 -90 0 90 180
Degrees
-1
0
1
2
Fo
urie
r C
om
po
ne
nts
C
Diversity 2012, 4
352
Figure 10. Andrews Fourier Plots of multivariate model 2 (Table 5; Log (AMN),
Log (moisture content), Log (FF mesofauna richness)). Each curve represents one stand.
AMN = anaerobic mineralizable nitrogen; FF = forest floor. (A) = All regions;
(B) = Cascades and Coast ranges; (C) = Siskiyous. The three stands that obviously separate
from the others in (A) and (B) are all from a single site in the Coast Range. That site was
not included in Figure 9 (incomplete data).
3.2.3. Without Soil or Forest Floor Mesofauna: All Nine Sites
The best model with all sites included just two variables, moisture content and richness of epigeic
macrofauna (Model 4, Table 5). In that model old growth differed from thinned mature at P = 0.009
and from unthinned mature at P = 0.048, while the two mature stand types differed at P = 0.076.
Thinned stands averaged the greatest richness of epigeic macrofauna, which as we discussed earlier
may be an artifact of higher capture rate in thinner forest floors.
-180 -90 0 90 180
Degrees
-1
0
1
2
Fo
urie
r C
om
po
ne
nts
A
UM
TM
OG
STANDTYPE$
-180 -90 0 90 180
Degrees
-1
0
1
2
Fo
urie
r C
om
po
ne
nts
B
UM
TM
OG
STANDTYPE$
-180 -90 0 90 180
Degrees
-1
0
1
2
Fo
urie
r C
om
po
ne
nts C
Diversity 2012, 4
353
4. Discussion
4.1. Differences in Stand Types
In multivariate analysis, old growth forests were distinguished from mature stands by greater levels
of soil moisture, anaerobic mineralizable nitrogen (hence microbial biomass), and mesofaunal species
richness in the upper layer of mineral soil and forest floor (Figure 11). All statistically significant
multivariate models included richness of one of the arthropod groups (mineral soil, forest floor, or
epigeal) and either soil moisture or anaerobic mineralizable nitrogen (a measure of microbial biomass),
or both. We cannot exclude the possibility that both mesofaunal and soil moisture contributions to the
models were driven by the strong stand-type differences in the Siskiyous. However, Andrews Fourier
Plots of models containing soil or forest floor mesofauna indicate greater similarity among old growth
than mature stands across all three regions, which suggests that the Siskiyous are an extreme example
of a more general pattern. Moreover, there were no significant interactions between stand-type and
region in multivariate models, indicating that relative rankings of stand types were consistent across
regions in all models. Finally, whereas the univariate distribution of soil mesofauna was strongly
left-skewed and not normalizable by standard transformations, the residuals from multivariate models
containing soil mesofauna were multivariate normal (this was true of all the multivariate models
shown), which emphasizes that a multivariate model cannot be viewed as an additive sum of its
individual variables. Nevertheless, it is clear that both moisture and mesofaunal differences between
old growth and mature stands were manifested most strongly in the Siskiyou Mountains, the most arid
of the three regions, but also the only region where mature stands were established by wildfires that in
all likelihood were more intense than the historic norm for that area. We return to this point later in
the discussion.
Water and nitrogen are the two most limiting resources in Pacific Northwest forests [44,45], and
anaerobic mineralizable nitrogen has been correlated with growth response to fertilization in the
Pacific Northwest [46,47]. Mesofauna, primarily fungivores, are well known to be critical links in the
nutrient cycle, although studies have found that species richness is more important in low diversity
than high diversity faunal communities [48]. A relatively high availability of essential resources, and
of biotic richness that may contribute to that availability, could explain why many OG forests tend to
remain C sinks despite a buildup of respiratory biomass [49]. Although soil organic matter did not
enter the strongest models, it played a central role in the set of variables that distinguished stand types
(Figure 11). Percent soil organic matter explained 80% of the variation in soil moisture content at the
time of sampling, and soil moisture content, either alone or in conjunction with percent soil organic
matter, correlated significantly with anaerobic mineralizable nitrogen and both the richness and
abundance of soil arthropods.
In a multivariate context, there was no evidence that thinned stands were more similar to old growth
than unthinned. Analyzed as a single variable, however, the significant difference in percent soil
organic matter (SOM) between old growth and thinned stands was driven by the exceptionally high
levels of SOM in the Marten Ridge old growth. Thinning might increase SOM in top layers of mineral
soil for several reasons. Fine residues from thinning along with fine roots from harvested trees may
have decayed sufficiently to intermingle with the mineral soil, especially on the more mesic sites,
where fine branches can decay at rates as high as 0.2 per year [50] and fine roots even faster [51].
Diversity 2012, 4
354
Trees that experience an increase in light have been shown to increase allocation of carbon to roots and
mycorrhizal fungi [52], which would lead to increased input of dead fine roots and hyphae, and greater
understory biomass in thinned than unthinned stands [21] would likely include relatively
shallow-rooted species. In any event, it seems likely that the relatively weak contribution of SOM to
our multivariate models stemmed in part at least from mean SOM values in thinned stands that were
intermediate between old growth and unthinned mature, something that was not true for the variables
that contributed most significantly to the multivariate models.
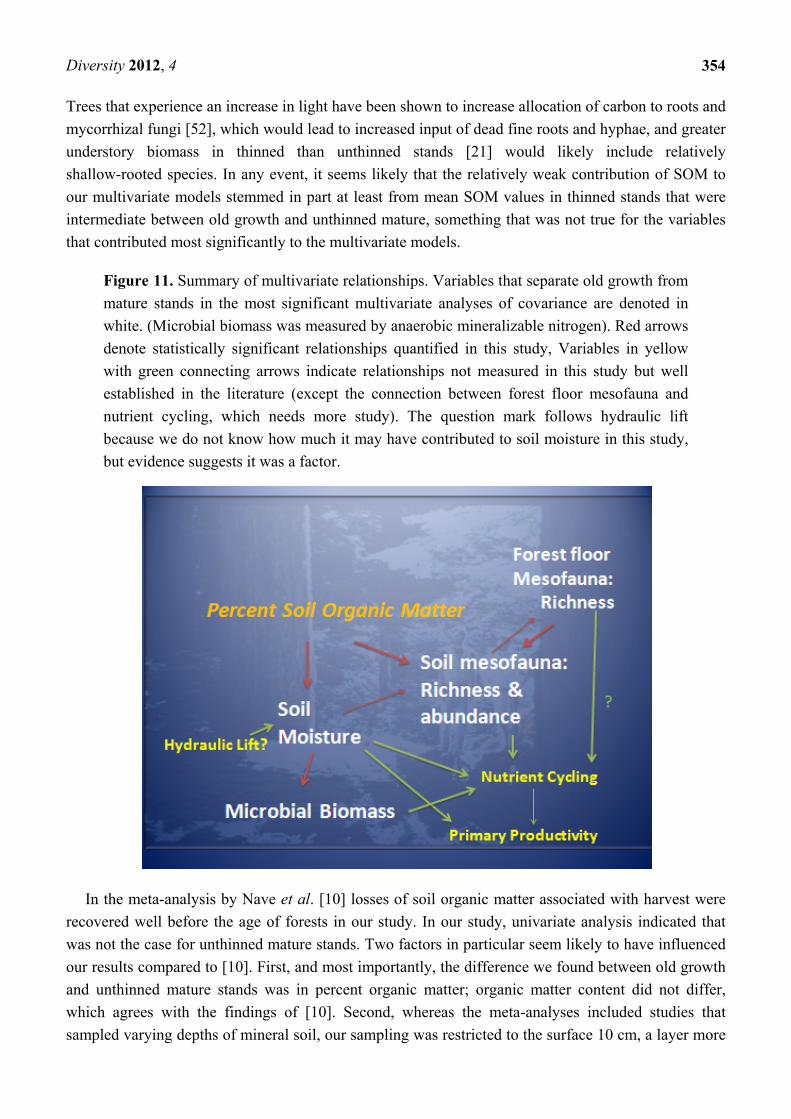
Figure 11. Summary of multivariate relationships. Variables that separate old growth from
mature stands in the most significant multivariate analyses of covariance are denoted in
white. (Microbial biomass was measured by anaerobic mineralizable nitrogen). Red arrows
denote statistically significant relationships quantified in this study, Variables in yellow
with green connecting arrows indicate relationships not measured in this study but well
established in the literature (except the connection between forest floor mesofauna and
nutrient cycling, which needs more study). The question mark follows hydraulic lift
because we do not know how much it may have contributed to soil moisture in this study,
but evidence suggests it was a factor.
In the meta-analysis by Nave et al. [10] losses of soil organic matter associated with harvest were
recovered well before the age of forests in our study. In our study, univariate analysis indicated that
was not the case for unthinned mature stands. Two factors in particular seem likely to have influenced
our results compared to [10]. First, and most importantly, the difference we found between old growth
and unthinned mature stands was in percent organic matter; organic matter content did not differ,
which agrees with the findings of [10]. Second, whereas the meta-analyses included studies that
sampled varying depths of mineral soil, our sampling was restricted to the surface 10 cm, a layer more
Diversity 2012, 4
355
likely to manifest the dynamics of disturbance and recovery, both abiotic and biotic, than samples that
include deeper layers. We stress that comparing differences among stand types in total soil organic
matter storage would require comparisons of full soil profiles and was not our objective.
Our data suggest that at least some aspects of foodwebs differ between old growth and mature
stands. The high correlation in old growth between the primarily fungivorous soil mesofauna and
nitrate availability (as measured by denitrification potential), while no such correlation existed in
mature stands, suggests that fungi are more important in the nitrogen cycle of old growth than in that
of mature stands. That possibility is supported by evidence from other studies. C and N isotope
patterns in the forest age gradient studied by Bauhus et al. [53] indicated that fungi became more
prevalent in soils and litter as forests aged. Similarly, ectomycorrhizal mats are much more common in
OG than in young forests and, depending on species, significantly affect N cycling [14,54].
A second observation that may reflect differences in the organization or activity of foodwebs, this
time between thinned stands and the other stand types, is the much stronger relationship in the former
than in the latter between litter and soil organic matter. Depth of the forest floor explained a highly
significant 77% of the variation in percent soil organic matter of thinned forests, but only slightly more
than one-third of that in unthinned and old growth forests, which suggests that a higher proportion of
soil organic matter originated from forest floor in thinned than in the other stand types. There is no
particular reason to expect that forest floor depth and soil organic matter should be strongly correlated,
they are connected but also influenced by different factors, and a survey that included boreal,
temperate, and tropical forests found little relation between aboveground litter inputs and soil organic
matter [55]. It is unclear why thinned forests in our study would differ in this regard. A study of
understory plants at the majority of our sites found higher cover and greater richness of herbaceous
species in thinned stands than in unthinned or old growth [21]. A greater representation of herbaceous
litter with relatively low lignin concentration would accelerate litter decomposition and perhaps tie soil
organic matter more closely to inputs from forest floor [56], a dynamic that might also reflect the
relatively rich epigeic community of thinned stands (assuming the richness is not an artifact). It is also
possible that synergism among diverse litters would enhance decomposition of all litter types [57].
Whatever the mechanisms, thinning has altered the relationship between forest floor and soil organic
matter on our sites.
4.2. Soil Water and Extended Sampling
Our sampling spanned nearly three months during the summer, a period when, in these summer-dry
systems, soils would be expected to be progressively drying. In regression over the entire data set,
however, the high correlation between soil organic matter and soil moisture despite substantial
differences in sampling dates, and the lack of any regional pattern in the residuals, was unexpected.
Unless water was being replenished, progressive drying throughout the summer should have been
reflected in a regional pattern of residuals from the organic matter-moisture regression. It is unlikely
that losses would be replenished through precipitation, as summers are extremely dry in the Pacific
Northwest [58]. Studies of soil water dynamics in Pacific Northwest forests suggest two plausible
explanations for this pattern. First, as the summer progresses, trees draw an increasingly larger
proportion of water from deep soil layers. Warren et al. [59] found that the upper 20 cm of mineral soil
accounted for at most 20% of total uptake from upper 2m, declining to 4%–6% late in the summer.
Diversity 2012, 4
356
Nevertheless, there were undoubtedly some losses from the upper layers over the period spanned by
our study. Evidence from other studies suggests that at least some losses from upper soil layers were
replenished by hydraulic redistribution (HR). Brooks et al. [60] found that 28% of the water removed
from the upper 2 m of soil in late August by a young Douglas-fir plantation was replaced by HR. In
Warren et al.’s study of three Pacific Northwest forests [59], HR increased as the summer drought
progressed, eventually reaching approximately 0.15 mm/day in the upper 60 cm. There would be
several advantages to maintaining a relatively high water content in upper soil layers [61,62], some of
which are illustrated by the close correlation between soil moisture and biotic variables in our study.
Active microbial and mesofaunal populations, and therefore nutrient cycling processes, would be
maintained longer into the drought season. Additionally, Warren et al. [59] found that daily water
uptake from the entire 2 m profile depended strongly on water potential 20 cm, and speculated that fine
roots in the upper soil regulated water uptake through hydraulic effects on stomatal conductance.
4.3. Outliers, Stand History, and Biological Legacies
Our data contained outliers that we hypothesize reflect the legacies of past disturbances. One of the
three distinct outliers was the Marten Ridge old growth forest, with 48% mean soil organic matter and
an unusual U-shaped distribution with approximately equal numbers of points were below 20% and
above 80%. That pattern suggests a past disturbance severe enough to kill a significant number of trees,
and long enough in the past for those dead trees to be incorporated into mineral soil. More extensive
sampling of regional forests would be necessary to clarify whether the exceptionally high level of
SOM in the Marten Ridge old growth is an anomaly of this data set or represents a broader class of
forests in the region with exceptionally high SOM.
Various factors might cause islands with a high percent of organic matter within forest soils, but it
seems reasonable to hypothesize that old, buried logs account not only for patterns in the Marten Ridge
old growth but for some and perhaps most of the heavy tailed distribution of soil organic matter seen in
other old growth forests of this study. Logs in advanced stages of decay have a sponge-like ability to
absorb and retain water [63,64], increasing the probability that they would eventually be incorporated
into mineral soil rather than being consumed in the next fire. With k values of 0.004 to 0.007 [65],
Douglas-fir logs persist in soils for at least 700 to 1250 years [66], implying that death rates of old
trees are comparable to or greater than decay rates of downed logs. Therefore, unless consumed by fire
before decaying sufficiently to reduce flammability, which is more likely in frequent-fire regions such
as the Siskiyous than in the more mesic regions, old, decaying logs become a permanent and perhaps
even increasing presence within the mineral soil matrix of naturally-disturbed Douglas-fir forests,
persisting as legacies both of disturbances that established stands centuries in the past and of the
ongoing process of tree death in older stands. Coarse woody debris is a well-known feature of Pacific
Northwest forests [65], but is most commonly documented on the surface where it is readily observed.
Anyone who has sampled mineral soils in Pacific Northwest old growth forests can attest to the
ubiquitous presence of old, highly decayed logs. The tendency of unthinned mature stands to have
tailed distributions similar to old growth suggests that the initial logging, while reducing percent
organic matter in surface soils, did not necessarily disrupt the island nature of the soil organic matter
patterns, while the 2nd logging (thinning) tended to homogenize the island pattern, as evidenced by a
greater predominance of normal distributions. Either directly or indirectly, thinning has altered the
Diversity 2012, 4
357
distribution of soil organic matter in the top layers of mineral soil, which raises the question of whether
distribution of soil organic matter within a stand influences soil processes in ways not reflected by
average concentrations. We know of no studies that speak to that.
The other two distinct outliers in our study were the mature stands at the Thompson Creek site in
the Siskiyous, which had exceptionally high levels of anaerobic mineralizable nitrogen (AMN) (In
effect, as with most of our other thinned-unthinned pairs, this was a single stand with both thinned and
unthinned areas). High levels of AMN might be explained by an extended period of occupation by
symbiotic N-fixing plants, a hypothesis that could be tested by isotopic analyses. Occupation by
nitrogen-fixing plants is common in the Pacific Northwest following fire, and mature stands in the
Siskiyous were established by wildfire. However, that begs the question of why the other fire-established
stands in the Siskiyous did not also have high levels of mineralizable nitrogen compared to old growth.
Thompson Creek mature stands also had exceptionally low richness and abundance of soil mesofauna,
and it is conceivable that low grazing pressure allowed microbial populations to build. The Thompson
creek mature stands are clearly different, but the reason is unclear and may be lost to history.
4.4. Landscape Legacies
Historic patterns of natural disturbances create landscape-level legacies, and these form the basis for
contrast between the landscape patterns produced by natural and managed regimes. This subject has been
widely discussed with regard to vegetation patterns and implications for vertebrate habitat, e.g., [67]. Our
study provides evidence for landscape-level patterns belowground, but the nature of the patterns
depends on the variable(s) of interest. In the Cascades and Coast Ranges, mean percent soil organic
matter (SOM) in our study varied widely among old growth, almost certainly reflecting a variable
pattern of establishment history, hence age and both persistence and accumulation of SOM; perhaps
also reflecting a variable pattern of low intensity fires that reduced forest floors but killed few or no
mature trees [68]. In contrast, mature stands of those regions, originating from clear cuts, varied little
among themselves in percent SOM. On the other hand, the richness and abundance of soil mesofauna
were more uniform among old growth forest than mature stands, and, as can be seen in Figures 9 and 10,
OG were more uniform than mature stands in the set of variables that distinguished stand types in
multivariate analyses. With the exception of soil moisture content, variables contained in the
significant multivariate sets reached a plateau and did not increase above 20% to 25% SOM, hence
their high-end variability was constrained compared to the SOM of old growth forests, several of
which had SOM values well above that range.
The landscape pattern that characterized the Cascades and Coast Ranges was reversed in the portion
of the Siskiyous we sampled, where historic wildfires were characterized by frequent, low severity
burns [68] and old growth forests varied little among themselves in soil organic matter. Frequent,
gentle fires would consume litter, lower carbon inputs to soil, and, because of their frequency tend to
homogenize soil organic matter across landscapes by preventing large buildups of dead organic matter
aboveground. The high diversity among mature stands of the Siskiyous is not possible to relate to
management, as those stands originated from severe wild fires set by EuroAmercans, an unfortunate
combination of unnatural and unmanaged, and a situation that may not be uncommon if, as predicted,
climate change results in more frequent, severe wildfires [69].
Diversity 2012, 4
358
4.5. Resilience: Are Mature Stands on a Trajectory Toward Old Growth Conditions?
In the Siskiyous, the mature stands we studied are well over one-half way to the 175–200 years at
which forests in the PNW are considered as OG [70] yet they remain quite different. Unless some
developmental threshold is passed in the next few decades they seem likely to remain different. If
these stands are indeed on a different trajectory, the reason may lie in the combined effects of stand
origins from unusually severe wildfires and the relatively harsh environment of the Siskiyous. Mature
stands in the Cascades and Coast Ranges are younger than mature stands in the Siskiyous and,
depending on when and how they are harvested , may eventually develop many of the characteristics
of old growth forest soils. No stand originating from commercial harvest will develop the loading of
coarse woody debris and consequent soil patterns that characterize old growth forests in the mesic
regions. However harvesting that retains large green trees in perpetuity will move managed forests in
that direction [71]. Although thinned stands remained quite different from old growth in a multivariate
context, they were similar in percent soil organic matter, and that may speed the development of soil
moisture, microbial biomass, and mesofaunal communities that characterize old growth forests.
However, in our data only soil water increased monotonically with soil organic matter, other variables
reaching a plateau well before the maximum SOM values we measured. One of the challenges facing
ecology is to move beyond carbon storage and better define the relationships between levels of soil
organic matter and other processes that underpin primary productivity [72].
Acknowledgements
Funding was provided by the U.S. Bureau of Land Management and NSF’s Long-Term Ecological
Program. We are grateful to John Tappeiner for facilitating BLM funding. Data on faunal diversity and
abundance are from Stephanie Madson’s MS thesis [73]. We thank Shirley King, Jon King, Jennifer
Sibul-Weisberg, Jenni Dykstra, Wayne Wakeman, Sandra Shockley, and Alan Swanson for conducting
the field phase of this project and Jill Ondrey, and Bill Martin for their assistance with the soil analyses.
John Bailey, Marla Gilliam, David Russell of the Medford BLM, and personnel from the USFS Blue
River and Sweet Home Ranger Districts assisted with site selection. We thank three anonymous
reviewers for valuable suggestions that improved the manuscript.
References
1. Strittholt, J.R.; Dellasalla, D.A.; Jiang, H. Status of mature and old-growth forests in the Pacific Northwest. Cons. Biol. 2006, 20, 363–374.
2. FEMAT (Forest Ecosystem Assessment Team). Forest Ecosystem Management: An Ecological, Economic, and Social Assessment; Report of the FEMAT; U.S. Government Printing Office: Washington, DC, USA, 1993.
3. Sabine, C.L.; Heimann, M.; Artaxo, P.; Bakker, D.C.E.; Chen, C.T.A.; Field, C.B.; Gruber, N.; Le Quere, C.; Prinn, R.G.; Richey, J.E.; Lankao, P.R.; Sathaye, J.A.; Valentini, R. Current status and past trends on the global carbon cycle. In The Global Carbon Cycle SCOPE 62; Field, C.B., Raupach, M.R., Eds.; Island Press: Washington, DC, USA, 2004; pp. 17–44.
Diversity 2012, 4
359
4. Jandl, R.; Linder, M.; Vesterdal, L.; Bauwens, B.; Baritz, R.; Hagedorn, F.; Johnson, D.W.; Minkkinen, K.; Byrne, K.A. How strongly can management influence soil carbon sequestration? Geoderma 2007, 137, 253–268.
5. Bradford, J.D.; Kastendick, D.N. Age-related patterns of forest complexity and carbon storage in pine and aspen-birch ecosystems in northern Minnesota, USA. Can. J. For. Res. 2010, 40, 401–409.
6. Johnson, D.W.; Murphy, J.D.; Walker, R.F.; Glass, D.; Miller, W.W. Wildfire effects on forest carbon and nutrient budgets. Ecol. Eng. 2007, 31, 183–192.
7. Bormann, B.T.; Homann, P.S.; Darbyshire, R.L.; Morrissette, B.A. Intense wildfire sharply reduces mineral soil C and N: The first evidence. Can. J. For. Res. 2008, 38, 2771–2783.
8. Johnson, D.W.; Curtis, P.S. Effects of forest management on soil C and N storage: Meta analysis. For. Ecol. Manag. 2001, 140, 227–238.
9. Sanchez, F.G.; Tiarks, A.E.; Kranabetter, J.M.; Page-Dumroese, D.S.; Powers, R.F.; Sanborn, P.T.; Chapman, W.K. Effects of organic matter removal and soil compaction on fifth-year mineral soil carbon and nitrogen contents for sites across the United States and Canada. Can. J. For. Res. 2006, 36, 565–576.
10. Nave, L.E.; Vance, E.D.; Swanston, C.W.; Curtis, P.S. Harvest impacts on soil carbon storage in temperate forests. For. Ecol. Manag. 2010, 259, 857–866.
11. Nave, L.E.; Vance, E.D.; Swanston, C.W.; Curtis, P.S. Fire effects on temperate forest soil C and N storage. Ecol. Appl. 2011, 21, 1189–1201.
12. Natural Resources Conservation Service. Distribution Maps of Dominant Soil Orders, Available online: http://soils.usda.gov/technical/classification/orders/ (accessed on 6 September 2012).
13. Pregitzer, K.S.; Euskirchen, E.S. Carbon cycling and storage in world forests: Biome patterns related to forest age. Glob. Chang. Biol. 2004, 10, 2052–2077.
14. Griffiths, R.P.; Swanson, A.K. Forest soil characteristics in a chronosequence of harvested Douglas-fir forests. Can. J. For. Res. 2001, 31, 1871–1879.
15. Buddle, C.M.; Langor, D.W.; Pohl, G.R.; Spence, J.R. Arthropod responses to harvesting and wildfire: Implications for emulation of natural disturbance in forest management. Biol. Conserv. 2006, 128, 36–357.
16. Pohl, G.R.; Langor, D.W.; Spence, J.R. Rove beetles and ground beetles (Coleoptera: Staphylinidae, Carabidae) as indicators of harvest and regeneration practices in western Canadian foothills forests. Biol. Conserv. 2007, 137, 294–307.
17. Baker, S.C.; Grove, S.J.; Forster, L.; Bonham, K.J.; Bashford, D. Short-term tresponses of ground-active beetles to alternative silvicultural systems in the Warra Silvicultural Systems Trial, Tasmania, Australia. For. Ecol. Manag. 2009, 258, 444–459.
18. Légaré, J.-P.; Hébert, C.; Ruel, J.-C. Alternative silvicultural practices in irregular Boreal forests: Response of beetle assemblages. Silva Fenn. 2011, 45, 937–956.
19. Hayes, J.P.; Chan, S.S.; Emmingham, W.H.; Tappeiner, J.C.; Kellog, L.D.; Bailey, J.D. Wildlife response to thinning young forests in the Pacific Northwest. J. For. 1997, 95, 28–33.
20. Lindh, B.C.; Muir, P.S. Understory vegetation in young Douglas-fir forests: Does thinning help restore old-growth composition? For. Ecol. Manag. 2004, 192, 285–296.
21. Bailey, J.D.; Mayrsohn, C.; Doescher, P.S.; St. Pierre, E.; Tappeiner, J.C. Understory vegetation in old and young Douglas-fir forests of western Oregon. For. Ecol. Manag. 1998, 112, 289–302.
Diversity 2012, 4
360
22. Bailey, J.D.; Tappeiner, J.C. Effects of thinning on structural development in 40- to 100-year-old Douglas-fir stands in western Oregon. For. Ecol. Manag. 1998, 108, 99–113.
23. Hagar, J.C.; McComb, W.C.; Emmingham, W.H. Bird communities in commercially thinned and unthinned Douglas-fir stands of western Oregon. Wildl. Soc. Bull. 1996, 24, 353–366.
24. Hayes, J.P.; Weikel, J.M.; Huso, M.M.P. Response of birds to thinning in young Douglas-fir forests. Ecol. Appl. 2003, 13, 1222–1232.
25. Manning, T.; Hagar, J.C.; McComb, B.C. Thinning of young Douglas-fir forests decreases density of northern flying squirrels in the Oregon Cascades. For. Ecol. Manag. 2012, 264, 115–124.
26. Holloway, G.L.; Smith,W.P. A meta-analysis of forest age and structure effects on northern flying squirrel densities. J. Wildl. Manag. 2011, 75, 668–674.
27. Carey, A.B.; Johnson, M.L. Small mammals in managed, naturally young, and old-growth forests. Ecol. Appl. 1995, 5, 336–352.
28. Lorenz, K.; Lal, R. Carbon Sequestration in Forest Ecosystems; Springer: New York, NY, USA, 2010.
29. Main, M. Consulting Forester, Ashland, OR, USA. Personal Communication, March 2012. 30. Wang, T.; Hamann, A.; Spittlehouse, D. ClimateWNA: A Program to Generate High-Resolution
Climate Data for Climate Change Studies and Applications in Western North America; ClimateWNA v. 4.60.; University of British Columbia: Vancouver, Canada, 2010. Available online: http://www.genetics.forestry.ubc.ca/cfcg/ClimateWNA/ClimateWNA.html (accessed on 14 September, 2012).
31. Wang, T.; Hamann, A.; Spittlehouse, D.; Aitken, S.N. Development of scale-free climate data for western Canada for use in resource management. Int. J. Climatol. 2006, 26, 383–397.
32. Natural Resources Conservation Service. Soil Surveys for Oregon, Available online: http://www.or.nrcs.usda.gov/pnw_soil/or_data.html/ (accessed on 6 September 2012).
33. Natural Resources Conservation Service. Oregon Soil Surveys Data, Available online: http://www.or.nrcs.usda.gov/pnw_soil/or_data.html/ (accessed on 6 September 2012).
34. Keeny, D.; Bremner, J. A chemical index of soil nitrogen availability. Nature 1966, 211, 892–893. 35. Binkley, D.; Hart, S.C. The components of nitrogen availability assessments in forest soils. Adv.
Soil Sci. 1989, 10, 57–112. 36. Groffman, P.M.; Tiedje, J.M. Denitrification in north temperate forest soils: Relationships
between denitrification and environmental factors at the landscape scale. Soil Biol. Biochem. 1989, 21, 621–626.
37. Griffiths, R.P.; Homann, P.S.; Riley, R. Denitrification enzyme activity of Douglas-fir and red alder forest soils of the Pacific Northwest. Soil Biol. Biochem. 1998, 30, 1147–1157.
38. Spence, J.R.; Niemala, J.K. Sampling carabid assemblages with pitfall traps: The madness and the method. Can. Entomol. 1994, 126, 881–894.
39. Winter, J.P.; Voroney, R.P. Microarthropods in soil and litter. In Soil Sampling and Methods of Analysis; Carter, M.R., Ed.; Canadian Society of Soil Science, CRC Press: Boca Raton, FL, USA, 1993; pp. 333–340.
40. Systat Software, Version 13; Cranes Software International Ltd.: Bangalore, India, 2008. 41. Lowry, R. Concepts and Applications of Inferential Statistics, 2003. Available online:
http://vassarstats.net/textbook/ (accessed on 14 September 2012). 42. Latta, G.; Temesgen, H.; Adams, D.; Barret, T. Analysis o potential impacts of climate change on
forests of the United States Pacific Northwest. For. Ecol. Manag. 2010, 259, 720–729.
Diversity 2012, 4
361
43. Andrews, D.F. Plots of high dimensional data. Biometrics 1972, 28, 125–136. 44. Waring, R.H.; Franklin, J.F. The evergreen forests of the Pacific Northwest. Science 1979, 204,
1380–1386. 45. Edmonds, R.L.; Binkley, D.; Feller, M.C.; Sollins, P.; Abee, A.; Myrold, D.D. Nutrient cycling:
effects on productivity of Pacific Northwest forests. In Maintaining The Long-Term Productivity of Pacific Northwest Forest Ecosystems; Perry, D.A., Meurisse, R., Thomas, B., Miller, R., Boyle, J., Means, J., Perry, C.R., Powers, R.F., Eds.; Timber Press: Portland, OR, USA, 1989; pp. 17–35.
46. Shumway, J.; Atkinson, W.A. Predicting nitrogen fertilizer response in unthinned stands of Douglas-fir. Comm. Soil Sci. Plan. 1978, 9, 529–539.
47. Powers, R.F. Mineralizable nitrogen as an index of nitrogen availability to forest trees. Soil Sci. Soc. Am. J. 1980, 44, 1314–1320.
48. Nielsen, U.N.; Ayers, E.; Wall, D.H.; Bardgett, R.D. Soil biodiversity and carbon cycling: A review and synthesis of studies examining diversity-function relationships. Eur. J. Soil Sci. 2011, 62, 105–116.
49. Luyssaert, S.; Schulze, E.-D.; Börner, A.; Knohl, A.; Hessenmöller, D.; Law, B.E.; Ciais, P.; Grace, J. Old-growth forests as global carbon sinks. Nature 2008, 455, 213–215.
50. Fogel, R.; Cromack, K., Jr. Effect of habitat and substrate quality on Douglas-fir litter decomposition in western Oregon. Can. J. Bot. 1977, 55, 1632–1640.
51. Silver, W.L.; Miya, R.K. Global patterns in root decomposition: Comparisons of climate and litter quality effects. Oecologia 2001, 129, 407–419.
52. Palmroth, S.; Oren, R.; McCarthy, H.R.; Johnsen, K.H.; Finzi, A.C.; Butnor, J.R.; Ryan, M.G.; Schlesinger, W.H. Aboveground sink strength in forests controls the allocation of carbon belowground and its CO2-induced enhancement. Proc. Natl. Acad. Sci. USA 2006, 103, 19362–19367.
53. Bauhus, J.; Paré, D.; Côté, L. Effects of tree species, stand age, and soil type on soil microbial biomass and its activity in southern boreal forest. Soil Biol. Biochem. 1998, 30, 1077–1089.
54. Griffiths, R.P.; Bradshaw, G.A.; Marks, B.; Lienkaemper, G.W. Spatial distribution of ectomycorrhizal mats in coniferous forests of the Pacific Northwest, USA. Plant Soil 1996, 180, 147–158.
55. Vogt, K.; Vogt, D.L.; Brown, S.; Tilley, J.P.; Edmonds, R.; Silver, W.P.; Siccama, T.G. Dynamics of forest floor and soil organic matter accumulation in boreal, temperate, and tropical forests. In Soil Management and Greenhouse Effect; Lal, R., Kimble, J., Levine, E., Stewart, B.A., Eds.; CRC Press: New York, NY, USA, 1995; pp. 159–178.
56. Aber, J.D.; Melillo, J.M.; McClaugherty, C.A. Predicting long-term patterns of mass-loss, nitrogen dynamics, and soil organic matter formation from initial fine litter chemistry in temperate forest ecosystems. Can. J. Bot. 1990, 68, 2201–2208.
57. Hattenschiwiler , S.; Tiunov, A.V.; Scheu, S. Biodiversity and litter decomposition in terrestrial ecosystems. Annu. Rev. Ecol. Evol. Syst. 2005, 36, 191–218.
58. Climate Impacts Group. About Pacific Northwest Climate; Climate Impacts Group: Seattle, WA, USA, 2011. Available online: http://cses.washington.edu/cig/pnwc/pnwc.shtml (accessed on 6 September 2012).
59. Warren, J.M.; Meinzer, F.C.; Brooks, J.R.; Domec, J.C. Vertical stratification of soil water storage and release dynamics in Pacific Northwest coniferous forests. Agr. For. Meteorol. 2005, 130, 39–58.
Diversity 2012, 4
362
60. Brooks, J.R.; Meinzer, F.C.; Coulombe, R.; Gregg, J. Hydraulic redistribution of soil water during summer drought in two contrasting Pacific Northwest coniferous forests. Tree Physiol. 2002, 22, 1107–1117.
61. Prieto, I.; Armas, C.; Pugnaire, F.I. Water release through plant roots: New insights into its consequences at the plant and ecosystem level. New Phytol. 2012, 193, 830–841.
62. Neumann, R.B.; Cardon, Z.G. The magnitude of hydraulic redistribution by plant roots: A review and synthesis of empirical and modeling studies. New Phytol. 2012, 194, 337–352.
63. Sollins, P.; Cline, S.P.; Verhoeven, T.; Sachs, D.; Spycher, G. Patterns of log decay in old-growth Douglas-fir forests. Can. J. For. Res. 1987, 17, 1585–1595.
64. Amaranthus, M.P.; Parrish, D.; Perry, D.A. Decaying logs as moisture reservoirs following drought and wildfire. In Proceedings of Watershed 89: Stewardship of Soil, Water, and Air Resources, Juneau, AK, USA, 21–23 March 1989; Alexander, E.B., Ed.; U.S. Department of Agriculture Forest Service, Alaska Region: Juneau, AK, USA, 1989; RlO-MB-77.
65. Harmon, M.E.; Franklin, J.F.; Swanson, F.J.; Sollins, P.; Gregory, S.V.; Lattin, J.D.; Anderson, N.H.; Cline, S.P.; Aumen, N.G.; Sedell, J.R.; Lienkaemper, G.W.; Cromack, K., Jr.; Cummins, K.W. Ecology of coarse woody debris in temperate ecosystems. Adv. Ecol. Res. 1986, 15, 133–302.
66. Olson, J.S. Energy storage and the balance of producers and decomposers in ecological systems. Ecology 1966, 44, 322–331.
67. Perry, D.A.; Hessburg, P.F.; Skinner, C.N.; Spies, T.A.; Stephens, S.L.; Taylor, A.H.; Franklin, J.F.; McComb, B.; Riegel, G. The ecology of mixed severity fire regimes in Washington, Oregon, and Northern California. For. Ecol. Manag. 2011, 262, 703–717.
68. Agee, J.K. Fire Ecology of Pacific Northwest Forests; Island Press: Washington, DC, USA, 1993. 69. Moritz, M.A.; Pariesen, M.-A.; Batllori, E.; Krawchuk, M.A.; Van Doren, J.; Ganz, D.J.; Hayhoe, K.
Climate change and disruptions to global fire activity. Ecosphere 2012, 3, 1–22. 70. Spies, T.A.; Franklin, J.F. The structure of natural young, mature, and old-growth forests in
Oregon and Washington. In Wildlife and Vegetation of Unmanaged Douglas-fir Forests; General Technical Report PNW-GTR-285; USDA Forest Service, Pacific Northwest Research Station: Portland, OR, USA, 1991; pp. 91–110.
71. Lindenmeyer, D.B.; Franklin, J.F.; Lohmus, A.; Baker, S.C.; Bauhus, J.; Beese, W.; Brodie, A.; Kiehl, B.; Kouki, J.; Marinez Pastur, G.; et al. A major shift to the retention approach for forestry can help resolve some global forest sustainability issues. Conserv. Lett. 2012, doi: 10.1111/j. 1775–263X.2012.00257.x.
72. Hart, S.C. Email message. University of California, Merced, CA, USA. Personal Communication, August 2012.
73. Madson, S.L. Correlation between Structural Heterogeneity and Arthropod Biodiversity: Implications for Management of Pacific Northwest Forests. M.Sc. Thesis, Oregon State University, Corvallis, OR, USA, 1997; pp. 1–118.
© 2012 by the authors; licensee MDPI, Basel, Switzerland. This article is an open access article distributed under the terms and conditions of the Creative Commons Attribution license (http://creativecommons.org/licenses/by/3.0/).