Embed Size (px)
Citation preview

1
Journal of ICT, 15, No. 1 (June) 2016, pp: 1–31
THE PERFORMANCE COMPARISON OF THIRD GENERATION (3G) TECHNOLOGIES FOR INTERNET SERVICES IN BANGKOK
Sanon Chimmanee & Suttisak JantavongsoRangsit University, Thailand
[email protected]; [email protected]
ABSTRACT
Like other countries, users in Thailand demand to experience the highest possible level of quality of 3G services. In contrast, operators prefer to obtain maximum revenue. To facilitate these needs, this paper proposes two conceptual frameworks for (1) performance testing (QoS measurement) and (2) network optimization. The network optimization framework consists of KPI definition, network performance monitoring, parameter tuning, and optimized network processes; while the network performance monitoring process contains (1) traffic measurement (operator’s side) and (2) QoS measurement (user’s side). Operators need these information for the network performance monitoring to support the parameter tuning process and for user satisfactions. In this study, the latency tests, user data rates, and speed tests were the QoS measurements used to compare the performance of three Thai major 3G network operators; and 850/900MHz and 2100MHz bands in Bangkok. In terms of user satisfactions, the QoS measurements revealed that TrueMoveH offered the better performance in the user data rates; while AIS was the better in the latency tests. The speed tests were spitted between DTAC and TrueMoveH. Finally, the study identified that 3G services on 2100MHz performed better than 850/900MHz.
Keywords: 3G, Network Optimization, Network Performance Monitoring, Parameter Tuning, QoS.
INTRODUCTION
For Thailand, the Third Generation (3G) technologies have broadband capabilities to offer Internet with multimedia services. Thus, 3G is envisioned as the potential solution for the Thailand’s lagged behind others countries
http
://jic
t.uum
.edu
.my

Journal of ICT, 15, No. 1 (June) 2016, pp: 1–31
2
in the region. Thailand was one of the last few countries in Southeast Asia to introduce 3G services. The 3G on 2100MHz (2.1GHz) spectrum auction concluded in 2012 was the first milestone towards transforming Thailand’s mobile telecommunication industry (Malisuwan, Teppayayon, Madan, Sivaraks, & Kaewphanuekrungsi, 2013). AIS, DTAC, and TrueMove are three major operators in Thailand. They have occupied Second Generation (2G) and 3G networks to serve both 3G capable and Global System for Mobile Communications (GSM) devices (NBTC, 2014).
While Thailand begins to deploy the Fourth Generation Long Term Evolution (4G LTE), it is important to study and understand the characteristics of the current 3G technologies to maximize the potential benefits. For Thailand, 3G networks will continue to be the dominant technologies for the foreseeable future with approximately 55 million 3G numbers (NBTC, 2014). 3G technologies offer Internet services with rapid data access to support the prolific growth of smartphones and tablets to Thai users. The usage of the Internet in Thailand through mobile devices has steadily increased due to the portability, on-the-move connectivity, and user convenient. According to the Electronic Transactions Development Agency or ETDA (2013), the hours that Thais spent on the Internet in 2013 was almost 100% increased from 2001. This finding is in line with the National Broadcasting and Telecommunications Commission or NBTC (2013).
PROBLEM STATEMENT
The 3G industry is still growing, while Thailand is preparing for 4G networks. Rapid increase in the demand for data services has pushed operators to optimize their networks. At the same time, operators must ensure that satisfactory services are provided to the users. Users are expected to experience the highest possible level of service quality. Efficient resource allocation is a vital contributor to economic growth and success in telecommunications industry management of Thailand (Malisuwan, Kaewphanuekrungsi, Madan, & Sivaraks, 2015). Network resource become scarce due to the increase in demand for wireless services (Ramli et al., 2013).This in turn leads to network optimization which is the continuous process that keeps on increasing the quality of the network (Saxena & Jadon, 2013). Furthermore, network quality can be viewed from two different perspectives, one is the user and other is the operator. While there is no single universal measure of performance for a telecommunications system (Sköld, Lundevall, Parkvall, & Sundelin, 2005), an optimized network could improve perceived Quality of Service (QoS) and system performance.
http
://jic
t.uum
.edu
.my
3
Journal of ICT, 15, No. 1 (June) 2016, pp: 1–31
Traditionally, 3G services can be implemented of multiband antennas at 900MHz, 1800MHz and 2100MHz (Cela, Kamo, Cakaj, Muka, & Mitrushi, 2013). Multiband operation offers significant gains by bandwidth extension. According to Lachowski, Maternia, & Gorzynski (2011), operators may consider to reuse 900MHz (occupied by the GSM networks) to enhance experience of the growing number of 3G users. The usage of 900MHz expands bandwidth available for transmission. This brings significant gains in coverage in terms of the cell edge users, who often suffer from heavy interference conditions. Despite this, load imbalance often results in ineffective utilization of network resource. As a result, network bandwidths have become important and need to be efficiently assigned to potential and demanding operators. Thus, this paper also describes the effects of utilizing available bands other than 2100MHz in a multiband operation mode.
RESEARCH OBJECTIVES
Two objectives of the research are presented in this paper. The first (A), is the development of conceptual frameworks for (A1) performance testing and (A2) network optimization that would enable operators in Thailand to optimize their network performance. The second (B), is to evaluate the performance comparison of (B1) 3G operators and (B2) 3G services on 850/900MHz and 2100MHz bands in Thailand.
In relation to the first objective, namely the performance testing, it involves the QoS measurements of the services (1) by the 3G operators (Objectives B1) and (2) on 850/900MHz and 2100MHz bands (Objectives B2) respectively. The acquired knowledge from the QoS measurements are needed for the parameter tuning process. The details of parameter tuning process are described in a later section.
The paper makes both theoretical and practical contributions. In terms of theoretical contributions to the context of radio network planning and optimization, this paper contributes to enriching body of knowledge on radio network planning and optimization. It emphasizes especially on load sharing between bands. From a practical perspective, this paper provides some directions to Thai users about the performance of services provided by the operators. This would benefit users in Thailand in selecting their operators without a commercial bias intention.
http
://jic
t.uum
.edu
.my

Journal of ICT, 15, No. 1 (June) 2016, pp: 1–31
4
RESEARCH CONTEXT
Evolution of 3G/4G Technologies
Prior to 3G technologies, Internet services on mobile devices is possible via General Packet Radio Service (GPRS). GPRS (2.5G) enables packet-switched functionality to a GSM network (circuit-switched). According to the European Telecommunications Standards Institute or ETSI (2014b, “Overview”, para. 2), it supports a download data rate of up to 171kbps. The maximum data rates achievable would be between 15 and 40kbps. Enhanced Data GSM Evolution (EDGE) is a 2.75G network by ETSI (2014a, “Introduction”, para. 2). While, EDGE has some characteristics of a 3G network, it does not fully satisfy the specification. The increase in data speeds to 384kbps placed EDGE as an early state of 3G (3GPP, 2014, “EDGE… almost 3G”, para. 3). 3G network equipped with download speed of up to 3.1Mbps and was expected to deliver quality multimedia to mobile devices.
Although, there is no single official body that sets requirements for 2.5G, 3G, 3.5G, or 4G technologies, the Universal Mobile Telecommunications Service (UMTS), 3G standards developed by the 3rd Generation Partnership Project (3GPP) is widely adopted (Kurose & Ross, 2013). In 2002, 3GPP release 5 presented High Speed Downlink Packet Access (HSDPA), which is based on a 3G network and an enhancement to 3G. Download speed is up to 14Mbps, known as 3.5G. The first High Speed Packet Access (HSPA) specifications supported increased peak data rates of up to 14Mbps in the downlink (DL) and 5.76Mbps in the uplink (UL), which is a combination of HSDPA and High Speed Uplink Packet Access (HSUPA) that is 3GPP release 6 in 2005. In 2007, 3GPP release 7 presented High Speed Packet Access Plus (HSPA+), which provides an evolution of HSPA referred to as 3.75G. It provides data rates up to 168Mbps in the DL and 22Mbps in the UL.
3GPP release 8 in 2008 and release 9 in 2010 introduce LTE referred to as 3.9G, which provides for peak user data rates of up to 300Mbps in the DL, UL rates up to 75.4Mbps, and latency as low as 10ms. It is named as a Pre 4G technology. However, it is commonly known as 4G LTE. The specified peak speed in the specifications for 4G services are 100Mbps for high mobility communication, and 1Gbps for low mobility communication. 4G with LTE-Advanced release 10 was designed to meet all International Mobile Telecommunications-Advanced (IMT-Advanced) requirements including data rates of up to 1Gbps in the DL and 500Mbps in the UL in 2011 (Abdullah, Abdullah, Yonis, & Ghanim, 2011). Table 1 presents the evolution of 3GPP specifications.
http
://jic
t.uum
.edu
.my

5
Journal of ICT, 15, No. 1 (June) 2016, pp: 1–31
Table 1
Evolution of 3GPP Specifications According to Nakamura (2011)
Freeze Date
3GPP Release Technologies
Peak Rates in DownlinkHSPA Evolution LTE Evolution
June 2002 – March 2005
Release 5-6 HSPA (HSDPA + HSUPA)
14Mbps Not Applicable
December 2007
Release 7 HSPA+ 21-28Mbps (2x2 MIMO*)
Not Applicable
December 2008
Release 8 LTE 42Mbps (2x2 MIMO),
10MHz Bandwidth
300Mbps (4x4 MIMO),20MHz
BandwidthDecember
2009Release 9 84Mbps
(2x2 MIMO), 10MHz Bandwidth
March 2011 Release 10 LTE-Advanced 168Mbps (2x2 MIMO),
20MHz Bandwidth
3Gbps (8x8 MIMO),
100MHz Bandwidth
Release 11 366Mbps (2x2 MIMO),
40MHz BandwidthNote. *Multiple-Input and Multiple-Output
QoS Requirements and Measurements of 3G/4G Networks
Operators need to make business decisions related to the ‘Quality of Service’ (QoS). Planning networks, collecting information, processing of raw data, analyzing and distributing information, optimizing network capacity and quality, and measuring traffic are the tasks of network management. The term QoS has multiple meanings (Laiho, Wacker, & Novosad, 2006). For example, requirements of user, planned by operator, delivered by operator, and perceived by user. QoS is related to acceptable delays and throughput as listed in Tables 1 and 2. Estimation of existing delays in the network planning phase requires good knowledge of user behavior and understanding of the functions of the packet scheduler.
However, QoS measurements for end-to-end service quality should be provided from the viewpoint of the users as well as the operators. Hence, it is the users who make a decision about the satisfaction of services (Laiho
http
://jic
t.uum
.edu
.my

Journal of ICT, 15, No. 1 (June) 2016, pp: 1–31
6
et al., 2006). There are many QoS measurement methods of the Internet services provided by network operators (Darst & Ramanathan, 1999; Haryadi & Andina, 2012; Hu, Liu, & Tan, 2010). Examples of these are latency, user data rates, and speed test measurements.
Table 2
QoS Requirements (KPI) and Measurements in U-Plane Latency (RTT) for Ping Tests (32 bytes Payload Used)
TechnologiesRound Trip Time (RTT) for U-Plane
KPI RTT Testing3G 220ms
(Ranta, 2004)348.02ms
/ 362.37ms (Chen, Towsley, Nahum, Gibbens, &
Lim, 2012)HSDPA /
Release’9990ms
(Tapia, Liu, Karimli, & Feuerstein, 2009)
/ 100ms(Tarun, 2014) (Person, 2008)
-
HSPA 50ms (Person, 2008)
/ 60ms (Fricke et al., 2012)
/ 70ms (Tapia et al., 2009)
99ms / 112ms
(Jørgensen, Rodriguez Larrad, Elling, & Mogensen, 2014)
HSPA+ 40ms(Fricke et al., 2012)
/ 50ms (Person, 2008)
115.32ms (Chen et al., 2012)
HSPA Release 8 /
Release 910 MHz BW
25ms (Real Wireless Ltd, 2012)
42ms (Laner et al., 2012)
/ 38ms(Mohan, Kapoor, & Mohanty, 2011)
LTE 20ms(Fricke et al., 2012)
16ms (Person, 2008)
36ms (Laner et al., 2012)
/ 32ms (Mohan et al., 2011)
/ 141.62ms / 65.84ms / 124.64ms
77.31ms (Chen et al., 2012)
LTE-Advanced 10ms (Vacirca, Ricciato, & Pilz, 2005)
-
Haryadi and Andina (2012) studied the QoS measurement of File Transfer Protocol (FTP) services in 3G networks. Almutairi, Al-Jame, and A-Buraikan (2009) evaluated the QoS with Round Trip Time (RTT), FTP, and World Wide
http
://jic
t.uum
.edu
.my

7
Journal of ICT, 15, No. 1 (June) 2016, pp: 1–31
Web (WWW). RTT was used to measure the time it takes for a packet to travel from a source across a network to a destination and back. RTT examined the average throughput reachable by GPRS, EDGE, 3G, and HSDPA network for the two operators. The FTP was used to download a single file. Thus, WWW browsing was a popular application of the Internet in the State of Kuwait. User data rates and latency are methods of QoS testing which are to Key Performance Indicator (KPI) measurement.
Latency is one of major KPI in mobile communication. Lower average latency enables delay sensitive services such as video telephony and Voice over IP (VoIP) based applications to obtain a lower quality of service. End-to-end average ping’s time or RTT is used widely to be latency (Mohan et al., 2011; Person, 2008; Tapia et al., 2009). The RTT or latency of existing systems is based on laboratory measurements using 32 byte ping (Mohan et al., 2011; Tapia et al., 2009). The 3GPP specifications define two types of latency, control-plane latency and user-plane (Laner et al., 2012). Whereas control-plane latency is the time required by the call-setup procedure, user-plane latency describes the one-way transmit time of a data packet at the Internet Protocol (IP) layer from the user equipment to the Radio Access Network (RAN) edge-node or vice versa.
Call setup latency determines how quickly the user can start to receive service, while user-plane latency is important since the performance of applications such as web browsing is sensitive to the RTT to the server (Mohan et al., 2011). Furthermore, there are specific KPIs. Under ideal conditions, the RTT should be closed to 90ms for HSDPA/Release’99 DCH, and 70ms for HSDPA/HSUPA. In practice, this RTT will be increased by the transport delay depending on the location. RTT longer than 150ms indicates an issue to troubleshoot. LTE technology provides a value of 20ms roundtrip time, which is suitable for real-time applications (Fricke et al., 2012). Table 2 lists the KPI in the latency specifications and latency measurements.
LITERATURE REVIEW
Comparison of 900MHZ and 2100MHz Networks
Lodhi, Hathi, Gkekas, and Nahi (2008) studied a coverage comparison between UMTS900MHz and UMTS2100MHz bands in the island of Jersey. There was a growing demand in deploying 900MHz bands because a better coverage when compared with 2100MHz, especially in rural and new areas.
http
://jic
t.uum
.edu
.my

Journal of ICT, 15, No. 1 (June) 2016, pp: 1–31
8
Their findings indicated that the lower bands provide better radio wave propagation, improved indoor coverage, cost efficient electronic devices, and enormous cost savings benefits. In their studies, (a) the Received Signal Code Power (RSCP), (b) received chip energy relative to the total received power spectral density (Ec/Io), and (c) Signal to Interference Ratio (SIR) had been used as the three key KPIs.
The studies by Lodhi et al. (2008) also revealed that in addition to the capital expenditures (CAPEX) savings in deploying less number of sites, other benefits of UMTS900 were due to the lower carrier band which allows the signal to propagate further than its equivalent at 2100MHz. The required number of sites in UMTS900 was reduced by 60% compared to UMTS2100 technology. This better propagation environment helps in manufacturing cost effective electronic devices thereby reducing cost for transmit power. Lodhi et al. (2008) then made a conclusion remark stating that UMTS900 provided a perfect replacement of GSM in 900MHz band.
Figure 1. 900MHZ and 2100MHz comparison toward 3G 900MHZ
Furthermore, Simba, Trojer, Mwinyiwiwa, Mvungi, and Mjema (2012) also provided a comparison between UMTS900 and UMTS2100 using a techno-economic analysis to identify the economic feasibility and a cost-effective option between these two bands. The cost analysis results indicated that capital and operational costs of UMTS900 technology was lower than UMTS2100. Cost saving on UMTS900 was due to its implementation strategy of re-using the existing GSM network infrastructure. Re-using the existing infrastructure reduced down costs of the civil work, site rental, administration and maintenances. In addition, UMTS900 had a wider coverage compared to the coverage achieved by UMTS2100.
3G 850/900 MHz
3G 2100 MHz
Lodhi et al (2008)· Coverage KPIs
· Pilot RSCP· Pilot Ec/Ic· Pilot SIR
· Propagation Model
Simba et al (2012)· Radio network dimensioning· Techno-economic analysis
· CAPEX, OPEX, Revenue Cals· NPV, Payback, IRR · Sensitivity Analysis
http
://jic
t.uum
.edu
.my

9
Journal of ICT, 15, No. 1 (June) 2016, pp: 1–31
UMTS900 operated at a lower band, 900MHZ. This had resulted into a longer cell radius compared to a higher frequency technology of 2100MHz. the number of sites for UMTS900 required were less than UMTS2100 to cover the same geographical area. Therefore, fewer sites led to a cost reduction in the CAPEX. Simba et al. (2012) concluded using their techno-economic analysis that to provide a coverage for Tanzania, a connectivity model built from re-using the existing GSM infrastructure to implement 3G network at 900MHZ technology was a feasible option and a cost effective preference. Thus, UMTS at 900MHZ was the better solution in providing broadband access networks for the developing countries, see Figure 1.
Radio Network Optimization
Radio Network Optimization (RNO) is a complicated process consisting of several phases. The final target for the network optimization is to optimize the network performance. Network optimization contains four processes as shown in Figure 2: KPI definition, network performance monitoring, parameter tuning, and optimized network. Defining KPI is the most important part of the process because it relates to the methodology of optimization (Mishra, 2004). The KPI parameters are responsible directly for the coverage, capacity, and quality of the network. Following this, the network performance monitoring is required to ensure the user satisfaction. Mishra (2004) stated that real time data transfer delay is the critical aspect to be monitored. The quality of a network is viewed from the perspective of users. The parameter tuning includes parameters affecting handover control, packet scheduling, power control, and call admission control. The optimization process is focusing more on performance optimization by configuration changes than on launching. It required the existing network data as an input to the process.
Figure 2. Radio network optimisation by Mishra (2004)
KPI Definition
NetworkPerformanceMonitoring
ParameterTuning
OptimizedNetwork
NetworkPlanningProcess
QoSRT/NRT
http
://jic
t.uum
.edu
.my

Journal of ICT, 15, No. 1 (June) 2016, pp: 1–31
10
Moreover, Radio Resource Management (RRM) is responsible for supplying optimum coverage, offering the maximum planned capacity, guaranteeing the required QoS and ensuring efficient use of physical and transport resources. The performance of network can be tuned by finding appropriate parameters settings to achieve a high level of harmony between various functions (Laiho et al., 2006). The network performance tuning is based on the measured data from network elements. Optimization is realized by tuning the configuration parameter settings. Whilst in service, operator needs to react to short term incidents such as traffic load requirements that are different from current network capabilities, network resources need to be reconfigured, and parameters need to be adapted to follow the day-to-day requirements (Laiho et al., 2006).
In addition, Klessig & Fettweis (2014) presented adaptive admission control which is able to exploit trade-offs between blocking of request and throughput. This was one of the effective network planning and optimization tool set. Finally, Oseni, Popoola, Enumah, & Gordian (2014) monitored the GSM radio network on 900MHZ and 1800MHz by using a drive test based on Transmission Evaluation and Monitoring System (TEMS) in Abeokuta City, Nigeria. The data collected were analyzed in post-processing software tools to identify the causes of problem.
Traffic Engineering
Effective use of the network resource can optimized the network performance. Thus, a goal of Internet Traffic Engineering (TE) is to use the network resources effectively. Traffic engineering is a task of mapping traffic flows onto an existing physical topology using intelligent routing or/and load-balancing algorithm for avoiding congested path. This results in providing a better throughput and service quality. Furthermore, traffic classing is a task in the QoS management within UMTS to support translating user’s services to an actual physical channel (Laiho et al., 2006).
Recently in Thailand, “TriNet” (a service offered by DTAC) is the network to operate on three different bands: 1800MHz, 850MHz, and 2100MHz, enabling the largest possible bandwidth available (Total Access Communication PLC, 2014, “What is TriNet”, para. 1). 3G users are being served between 850MHz and 2100MHz bands. While 1800MHz is dedicated for voice calling, 850MHz provides wide-range coverage. Thus, TriNet is an example of the traffic engineering to utilize the available bands effectively. Added to this, Chimmaee, et al. (2005) proposed an intelligent adaptive load balancer based on hybrid neuro-fuzzy to distribute application traffic between two links. The
http
://jic
t.uum
.edu
.my

11
Journal of ICT, 15, No. 1 (June) 2016, pp: 1–31
knowledge of application characteristic is needed to train the intelligent load balancer. On the same way, the intelligent radio resource management in the parameter tuning process is acquired knowledge to train in order to tune parameters and map traffic on the physical channel properly.
CONCEPTUAL FRAMEWORKS
Having laid the groundwork for the development of the conceptual frameworks, this section discusses the proposed performance testing framework and network optimization framework. On the one hand, the network optimization framework consists of KPI definition, network performance monitoring, parameter tuning, and optimized network processes. On the other hand, the performance testing framework deals with the QoS measurements and in particular, the latency, user data rates, and speed tests. As indicated earlier, the network performance monitoring process is needed to support parameter tuning for user’s satisfactions. Therefore, an estimation of user experience has been conducted. In this paper, the proposed performance testing framework for operators in Thailand is referred to as “Concept I” (Figure 3). Concept I consists of two obtained knowledge. The first knowledge is for users. The second is knowledge for operators. While the first knowledge is interested by users, the other knowledge is more important for operators. Operators need these information for the network performance monitoring to tune the parameters (Mishra, 2004).
Figure 3. Conceptual framework for performance testing for Thai operators (Concept I) by the Authors
3GPP QoS architecture describes the way network elements participate to support service performance (end-to-end service quality). It is able to
Performance Tests: Ping FTP Speed Test
Experiment Tests: 850/900 MHz Mar - Apr 2013(Sricharoen & Chimmanee, 2013) 2100 MHz Dec 2013 - Jan 2014(Chingchit & Chimmanee, 2014)
Throughput among Mobile Operators: AIS DTAC TRUE
Throughput between 850/900 MHz & 2100 MHz: Latency Data Rates
1Knowledge for Mobile Customers
2Knowledge for 850/900 & 2100 MHz�s Throughput
Mobile Operators: AIS DTAC TRUE
Frequency Bands: 850/900 MHz 2100 MHz
Congested Areas: AIS Tower Central Plaza Pantip Plaza Siam Paragon QSNCC
http
://jic
t.uum
.edu
.my

Journal of ICT, 15, No. 1 (June) 2016, pp: 1–31
12
negotiate service quality support mechanisms and map service performance to the support mechanisms (Laiho et al., 2006). This study focuses on the measurement of the service performance to assist the intelligent support mechanisms. This in turn leads to the proposed conceptual framework of network optimization for operators in Thailand referred to as “Concept II” in Figure 4.
Figure 4. Conceptual framework for network optimization for Thai operators (Concept II) by the authors.
Concept II follows the network optimization process in Mishra (2004) contained four processes. The first process is defined earlier. The third and fourth processes have to be implemented by the operators. Hence, there is only the second process (network performance monitoring) that can be implemented from the user’s side, which involves the end-to-end service. It typically requires a certain QoS, which is provided for the user (Laiho et al., 2006). Operator needs to make business decisions depended to the QoS (Laiho et al., 2006). Additionally, this paper presents the implementation of network performance monitoring for operators. The frameworks were develop upon the authors’ previous publications. Three publications in particular are of note: (a) “Comparison the efficiency of internet services by 3G technology in Thailand” (Sricharoen & Chimmanee, 2013); (b) “Performance comparison of internet services using 3G 2100MHz technologies in Bangkok” (Chingchit & Chimmanee, 2014); (c) “Hybrid neuro-fuzzy based adaptive load balancing for delay-sensitive internet application” (Chimmaee et al., 2005).
KPI DefinitionNetwork
Performance Monitoring
Parameter Tuning Optimized Network
KPI (Defined by 3GPP and others) Latency: Delay &
Round Trip Time (RTT) Data Rates (Mbps)
Traffic Measurement: Incoming CallsSubscribers (Collected by the Operators)
2Knowledge for 850/900 & 2100 MHz�s Throughput
3Knowledge to Train Intelligent RRM
Configuration Change:Improving Coverage by Antenna
Radio Resource Management (RRM) for QoS Management: Traffic Distribution on
Frequency Bands: 850/900, 2100 MHz
Diffserv (Priority Queuing)
Etc.
QoS Measurement is Perceived by the Customers: Ping FTP Speed Test(Experiment Test)
http
://jic
t.uum
.edu
.my

13
Journal of ICT, 15, No. 1 (June) 2016, pp: 1–31
The first process (KPI definition) consists of (1) data rate transfer and (2) latency (RTT). Since Thai operators have been implemented HSPA+ on both 850/900MHz and 2100MHz, KPI in the peak data rate in downlink should be about 21 to 28Mbps as listed in Table 1; and KPI in the latency (RTT) should be during 40 to 50ms as listed in Table 2. In the second process (network performance monitoring), there are two major parameters: traffic measurement and QoS measurement. The first measurement includes number of concurrent calls, and number of subscribers, which are provided by the network management system of operators (Laiho et al., 2006). QoS measurement contains two such factors: data rate transfer and latency (RTT) according to KPI definitions in first process. The 3GPP specifications define two types of latency, control-plane latency and user-plane (Mishra, 2004). This paper focuses on the user-plane latency based on the RTT measurements using 32 Byte since the control-plane is responsible for operator’s side ping (Person, 2008; Tapia et al., 2009).
The performance testing for the second process as explained in Concept I as shown in Figure 1. The third process (parameter tuning) includes parameters affecting handover control, packet scheduling, call admission control, etc., which involves the Radio Resource Management (RRM) (Laiho et al., 2006). The performance of radio network can be tuned by finding appropriate parameters settings to achieve a high level of harmony between various RRM functions. It has to tune based on measured data from the network performance monitoring process.
Since operators in Thailand have occupied more than one frequencies (850/900MHz and 2100MHz), RRM on frequency is therefore one of the QoS attribute mapping in Laiho et al. (2006). The intelligent RRM in the parameter tuning is acquired this knowledge to train in order to tune parameters and map traffic on the physical channel appropriately. Therefore, the knowledge for 850/900 and 2100MHz throughput that is the outcome of this paper is the important input for the parameter tuning as demonstrated in Figure 4.
METHODOLOGY
Whereas Figure 3 demonstrates the proposed conceptual framework for performance testing for Thai operators (Concept I), Figure 4 presents the proposed conceptual framework for network optimization for Thai operators (Concept II). Following these figures, Figure 5 illustrates the measurement setup in this research.
http
://jic
t.uum
.edu
.my

Journal of ICT, 15, No. 1 (June) 2016, pp: 1–31
14
Figure 5. Measurement setup.
Measurement Site Selection
Five measurement locations in Bangkok were selected. These locations were selected as they are the most congested and highest demand sites of the 3G usages in Bangkok (Chingchit, 2014), see Figure 6. In addition, 5 testing sites are considered to be adequate in the performance testing of the network conducted in Thailand. The studies by Sricharoen (2013), Anupan (2012), and Phonprisan & Boonkrong (2012) were also conducted their tests in 5 locations.
Figure 6. Map of the measurement locations.
Internet
Thairath
Notebook with 3G Air Card
AIS 3G
DTAC 3G
TrueMoveH 3G
Mthai
Facebook Youtube
FTP Server (Domestic)122.155.168.128
Speed Test Server115.178.62.15
Domestic Servers
International Servers
Latency Test
User Data Rate Test
Speed Test
1Mb
http
://jic
t.uum
.edu
.my

15
Journal of ICT, 15, No. 1 (June) 2016, pp: 1–31
The selected measurement locations are (1) AIS Tower, a company head office on Phaholyothin Road in Phayathai district; (2) Central Plaza Lardprao, an integrated shopping complex on Phaholyothin Road in Chatuchak district; (3) Siam Paragon, a shopping complex and department store on Rama 1 Road in Pathumwan district; (4) Pantip Plaza, an indoor IT shopping mall located on New Phetchaburi Road in Ratchathewi district; and (5) Queen Sirikit National Convention Center (QSNCC), a convention center and exhibition hall located on New Rachadapisek Road in Klongtoey district. Table 3 presents the approximate distance between these locations in kilometers (KM).
Table 3
Distance Chart between the Measurement Locations
Siam Paragon Pantip Plaza QSNCC AIS Tower Central PlazaSiam Paragon 0.5 KM 3.8 KM 4.5 KM 8.5 KMPantip Plaza 0.5 KM 3.9 KM 4.1 KM 8.2 KMQSNCC 3.8 KM 3.9 KM 7.4 KM 10.7 KMAIS Tower 4.5 KM 4.1 KM 7.4 KM 3.9 KMCentral Plaza 8.5 KM 8.2 KM 10.7 KM 3.9 KM
Measurement Periods
The measurement processes were conducted during (1) March to April 2013 (prior to 3G 2100MHz launched in Thailand) and (2) December 2013 to January 2014. The measurements were performed on both weekdays and weekends. The measurements were conducted during morning, afternoon, and evening periods. The morning period was from 8 AM to 12 PM. The afternoon period was from 12.01 PM to 6 PM, and 6.01 PM to 8 PM in the evening period. The measurements were performed at one location each day. The order of these measurements is presented in Table 4. The findings were obtained using means from three measurements in each period.
Table 4
Measurement Periods
Periods Times Operators
Morning (8 AM to 12 PM)8 AM - 9.10 AM AIS9.20 AM - 10.30 AM DTAC10.40 AM - 11.50 AM TrueMoveH
(continued)
http
://jic
t.uum
.edu
.my
Journal of ICT, 15, No. 1 (June) 2016, pp: 1–31
16
Periods Times Operators
Afternoon (12 PM to 4 PM)
12.01 PM - 1.11 PM TrueMoveH1.21 PM - 2.31 PM AIS2.41 PM - 3.51 PM DTAC
Evening (4 PM to 8 PM)4.01 PM - 5.11 PM DTAC5.21 PM - 6.31 PM TrueMoveH6.41 PM - 7.51 PM AIS
Measurement Equipment
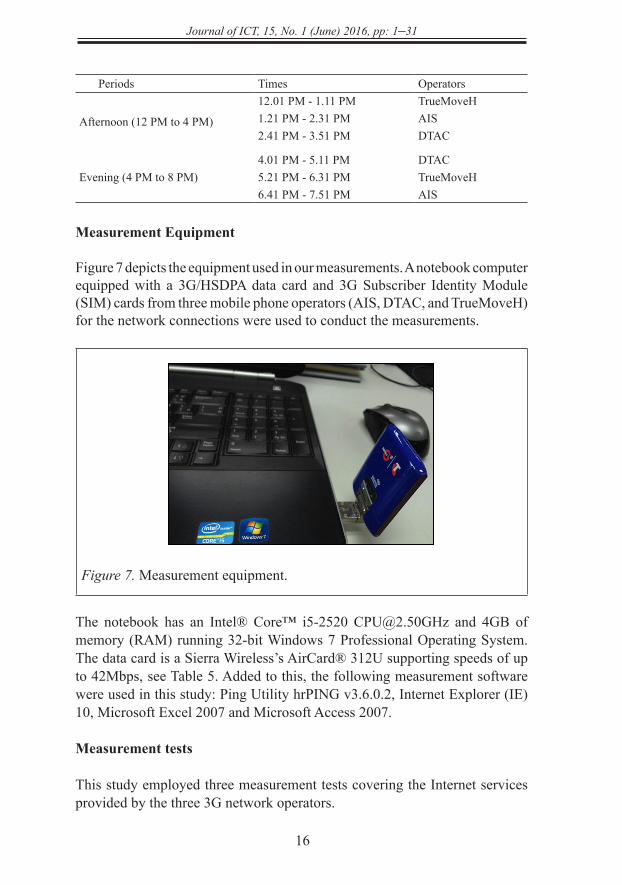
Figure 7 depicts the equipment used in our measurements. A notebook computer equipped with a 3G/HSDPA data card and 3G Subscriber Identity Module (SIM) cards from three mobile phone operators (AIS, DTAC, and TrueMoveH) for the network connections were used to conduct the measurements.
Figure 7. Measurement equipment.
The notebook has an Intel® Core™ i5-2520 [email protected] and 4GB of memory (RAM) running 32-bit Windows 7 Professional Operating System. The data card is a Sierra Wireless’s AirCard® 312U supporting speeds of up to 42Mbps, see Table 5. Added to this, the following measurement software were used in this study: Ping Utility hrPING v3.6.0.2, Internet Explorer (IE) 10, Microsoft Excel 2007 and Microsoft Access 2007.
Measurement tests
This study employed three measurement tests covering the Internet services provided by the three 3G network operators.
http
://jic
t.uum
.edu
.my

17
Journal of ICT, 15, No. 1 (June) 2016, pp: 1–31
Table 5
Measurement Equipment Details
Brand / Model Frequency Bands
Technology / SpeedDownload Upload
Sierra Wireless / 312U 2100MHz HSDPA 42Mbps DL HSUPA 5.76Mbps ULOption / iCON461 850/900MHz *HSUPA 7.2Mbps DL HSUPA 5.76Mbps UL
Table 6
Literature Review on QoS Requirement and Measurement in 3G / 4G
Authors
3G Providers
Methods
Frequency Bands &
TechnologiesStates Locations
AIS
DTA
CTR
UE
TOT
Ping
FTP
Spee
d Te
st
Sricharoen (2013) √ √ √ √ √ √ 3G 850MHz3G 900MHz
Stationary 5
Anupan (2012) √ √ √ √ √ 3G 850MHz StationaryMoving
5+ 10 BTS Stations
Phonprisan & Boonkrong (2012) √ √ √
3G 850MHz3G 900MHzWi-Fi
Stationary 5
Thongkaobua (2011) √ √ √ √ √ 3G 850MHz3G 900MHz
Moving Vibhavadi Rangsit Rd
Worakitpunya (2010) √ √ √ 3G 850MHz Moving BTS LinePabbumnan & Wisitpongphan (2011) √ √ √ √ 3G 850MHz
EDGEStationary 10
Iamsamang (2010) √ √ √ 3G 1900MHz StationaryMoving
BTS Stations + Airport Rail Link
These measurements tests included the latency, user data rates, and speed test measurements. Table 6 presents the mapping between 3G operators, measurement tools, frequency bands, technologies, and measurement sites identified in literature in Thailand.
Latency
The latency is measured as the Round Trip Time (RTT). By utilizing the Internet Control Message Protocol (ICMP) ping command, it is possible to time the latency. While, there is a Ping utility in Windows OS, hrPing has more features available. For example, the sequence numbers of the replies are
http
://jic
t.uum
.edu
.my

Journal of ICT, 15, No. 1 (June) 2016, pp: 1–31
18
listed, the times in microseconds (μs) with 3 decimals, the number of bytes in the received packet, the IP identification field, and the standard deviation, see Figure 8. In total, there were four tested websites in conducting the latency measurements. The websites were based on their rank which is calculated using a combination of average visitors and page views over the period. These four websites were obtained from the “top 500 sites on the web” by Alexa Internet Inc (2012, para. 1) and the “top ten websites” by Internet Innovation Research Center Co Ltd (2012, “Truehits Sites”, para. 1). They were grouped into domestic and international websites. www.thairath.co.th and www.mthai.com were two of Thailand’s domestic’s websites. www.facebook.com and www.youtube.com were the international websites.
Figure 8. An example of results from Ping and hrPing commands.
User data rates
All data rate measurements were performed during off peak and peak hours in order to monitor the realistic usages of the networks. In all locations, download (DL) and upload (UL) file transfers are performed. The file transfers are performed via the file transfer protocol (FTP), and the average FTP DL or UL throughput is computed per file transfer. FTP test with FileZilla software testing was performed to transfer 1MB file by downloading, uploading, and collecting the data. Measurements are in a unit of seconds (s).
Speed test
The speed test measures the network download and upload speed. The measurement performs three measurements, download speed, upload
http
://jic
t.uum
.edu
.my

19
Journal of ICT, 15, No. 1 (June) 2016, pp: 1–31
speed and round trip time (RTT) resulting in kbps and ms respectively. The measurements begin by entering http://speedtest.adslthailand.com/ into the URL.
RESULTS
This section presents the measurement results base on the measurement tests from a qualitative and quantitative perspective.
Latency Measurement Results
Figures 9 and 10 display the outcome of the latency measurements. The findings indicated that AIS was leading the rest of the operators on the average RTT values when tested with the domestic websites. For the international websites, TrueMoveH was the best performance overall. Thus, the latency measurement results on 3G 2100MHz were clearly better than on 3G 850/900MHz.
Figure 9 displays the bar charts of the ping’s average results to “www.thairath.co.th” and “www.mthai.com” in milliseconds (ms). The findings indicated that when pinged to “www.thairath.co.th”, AIS had obtained the best results 3 out of the 5 locations, followed by TrueMoveH, and DTAC. Similarly, AIS had obtained the best results 3 out of the 5 locations when pinged to “www.mthai.com”. Hence, AIS Tower had the fastest RTT average in both measurements.
Figure 9. Ping tests to domestic websites.
Figure 10 displays the bar charts of the ping’s average results to “www.facebook.com” and “www.youtube.com” in milliseconds. The findings indicated that when pinged to “www.facebook.com” and “www.youtube.com”, AIS had obtained the best ping’s results 3 out of the 5 locations, followed by TrueMoveH (2 out of 5), and DTAC. Despite this result, TrueMoveH had the
1200
1000
800
600
400
200
0
Mill
isec
onds
1200
1000
800
600
400
200
0
Mill
isec
onds
AIS
DTA
C
AIS
DTA
C
TRU
EMO
VEH
TRU
EMO
VEH AIS
DTA
C
TRU
EMO
VEH AIS
DTA
C
TRU
EMO
VEH AIS
DTA
C
TRU
EMO
VEH
AIS Central Pantip Paragon QSNCC
3G21003G850/900
AIS
DTA
C
AIS
DTA
C
TRU
EMO
VEH
TRU
EMO
VEH AIS
DTA
C
TRU
EMO
VEH AIS
DTA
C
TRU
EMO
VEH AIS
DTA
C
TRU
EMO
VEH
AIS Central Pantip Paragon QSNCC
3G21003G850/900
http
://jic
t.uum
.edu
.my

Journal of ICT, 15, No. 1 (June) 2016, pp: 1–31
20
best results in terms of RTT’s average. Similar to the domestic websites, AIS Tower had the fastest RTT average in both measurements.
Figure 10. Ping Tests to international websites.
User Data Rates Measurement Results
A number of measurements were performed to examine the average user data rate reachable by the 3G networks on 2100MHz and 850/900MHz provided by the three operators in Thailand. FileZilla was used to measure both download and upload speed of a file size 1MB. Figure 11 presents the download and upload speed in seconds.
Figure 11. FTP measurement results.
The results as shown in Figure 11 demonstrate that TrueMoveH had the best average download and upload speed when downloading and uploading 1MB file in size, followed by DTAC, and AIS respectively. It is also appropriate to note that that the lowest bar height means the best performance.
1200
1000
800
600
400
200
0
Mill
isec
onds
AIS
DTA
C
AIS
DTA
C
TRU
EMO
VEH
TRU
EMO
VEH AIS
DTA
C
TRU
EMO
VEH AIS
DTA
C
TRU
EMO
VEH AIS
DTA
C
TRU
EMO
VEH
AIS Central Pantip Paragon QSNCC
3G2100
3G850/900
1200
1000
800
600
400
200
0
Mill
isec
onds
AIS
DTA
C
AIS
DTA
C
TRU
EMO
VEH
TRU
EMO
VEH AIS
DTA
C
TRU
EMO
VEH AIS
DTA
C
TRU
EMO
VEH AIS
DTA
C
TRU
EMO
VEH
AIS Central Pantip Paragon QSNCC
3G2100
3G850/900
20181614121086420
Seco
nds
AIS
DTA
C
AIS
DTA
C
TRU
EMO
VEH AIS
AIS
DTA
C
TRU
EMO
VEHAIS
DTA
C
TRU
EMO
VEH
AIS Central Pantip Paragon QSNCC
3G21003G850/900
TRU
EMO
VEH
TRU
EMO
VEH
DTA
C
Seco
nds
3G21003G850/900
AIS Central Pantip Paragon QSNCC
20181614121086420
AIS
DTA
C
AIS
DTA
C
TRU
EMO
VEH AIS
AIS
DTA
C
TRU
EMO
VEHAIS
DTA
C
TRU
EMO
VEH
TRU
EMO
VEH
TRU
EMO
VEH
DTA
C
http
://jic
t.uum
.edu
.my

21
Journal of ICT, 15, No. 1 (June) 2016, pp: 1–31
Speed Test Measurement Results
The speed test measurement via “http://speedtest.adslthailand.com” was used to obtain the average speed in kbps. Figure 12 demonstrates that DTAC was the best performance on the average speed test measurements when downloading, followed by TrueMoveH, and AIS respectively. In contrast, TrueMoveH gave the best performance in terms of uploading; while DTAC was the next, then AIS.
Figure 12. Speed test measurement results.
DISCUSSION
Table 7 presents the overall average measurement findings. The findings clearly indicated the better performance in terms of the latency, user data rates, and speed test measurements from 3G on 2100MHz over 850/900MHz bands. The best performances in each measurement are highlighted and presented in each of the following Tables. Accordingly, these operators were able to provide the maximum bandwidth of 42Mbps in both 2100MHz and 850/900MHz bands. This is clearly exceeded the standard 3G transmission speed of 2.05Mbps and 3Mbps as reported in the studies by Garber (2002) and Hartung et al (2007). Two anticipate reasons are as follows. The first reason is that while these measurements were conducted at the same locations, dates and time periods for testing were different. The second reason was that the 3G on 850/900MHz are being shared between 2G and 3G usages.
The performance of the network providers on 850/900MHz are listed in Table 8. According to the measurement test findings, AIS performed best in the latency measurements. TrueMoveH was out performed in the user data
25,000.00
20,000.00
15,000.00
10,000.00
5,000.00
0.00
AIS
DTA
C
TRU
EMO
VEH AIS
DTA
C
TRU
EMO
VEHAIS
DTA
C
TRU
EMO
VEH AIS
DTA
C
TRU
EMO
VEH AIS
DTA
C
TRU
EMO
VEH
AIS Central Pantip Paragon QSNCC
3G2100
3G850/900
AIS
DTA
C
TRU
EMO
VEH AIS
DTA
C
TRU
EMO
VEHAIS
DTA
C
TRU
EMO
VEH AIS
DTA
C
TRU
EMO
VEH AIS
DTA
C
TRU
EMO
VEH
AIS Central Pantip Paragon QSNCC
3,500.00
3,000.00
2,500.00
2,000.00
1,500.00
1,000.00
500.00
0.00
3G2100
3G850/900
Kbs
p
Kbs
p
http
://jic
t.uum
.edu
.my

Journal of ICT, 15, No. 1 (June) 2016, pp: 1–31
22
rates, and speed test measurements. DTAC was at a moderate level in each measurement. All of the providers had met the standard set by the NBTC report (NBTC, 2014). The standard states that (1) the RTT must not be over 500 milliseconds; (2) the bandwidth for downloading must not be lower than 345kbps; and (3) the bandwidth for uploading must not be lower than 153kbps.
Table 7
Average Values of 3G on 2100MHz and 850/900MHz Measurements
Frequency Bands Ping (Millisecond) Speed Test (kbps) FTP (Seconds)
Download Upload Download Upload
3G 2100MHz 247.43 13394.25 1842.71 2.35 7.71
3G 850/900MHz 525.56 3362.14 614.62 11.85 5.90
Table 8
Average Values of 3G on 850/900MHz Measurements by Providers and NCBT Standard
3G 850/900MHz Ping Domestic
(Milliseconds)
Ping International (Millisecond)
Speed Test (kbps) FTP (Seconds)
Download Upload Download Upload
AIS 410.82 399.37 3271.21 429.52 13.46 69.68
DTAC 542.61 677.77 2515.44 530.56 13.37 73.13
TrueMoveH 465.73 657.04 4299.78 883.77 8.73 27.89
NCBT Standard 500 500 345 153 - -
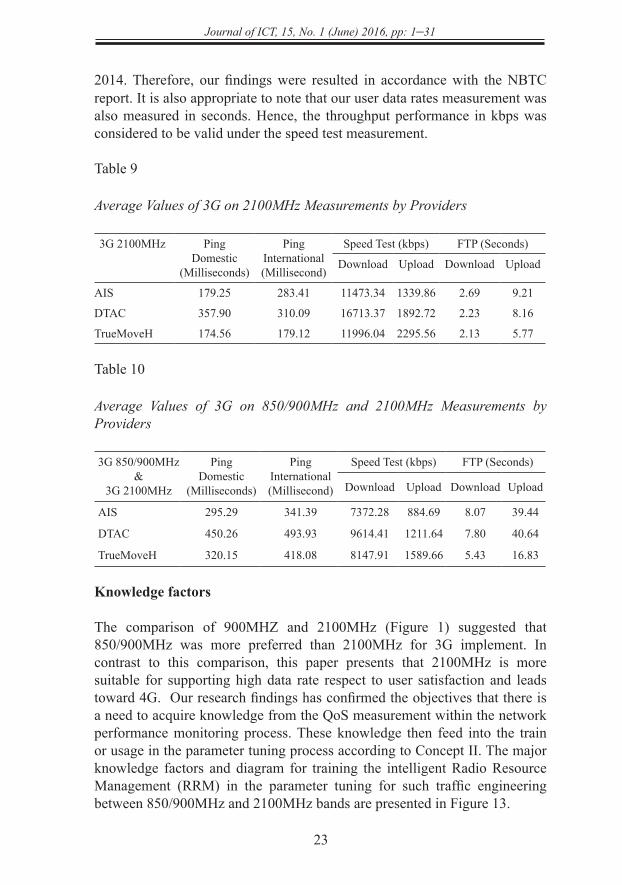
The measurement test results as shown in Table 9 indicated that TrueMoveH on the 3G 2100MHz was the best performance in all measurements except from the downloading in the speed test. While, DTAC was the best in this speed test measurement under downloading, other measurements were only at the moderate level.
In terms of 2100MHz and 850/900MHz band, see Table 10. Whereas, TrueMoveH offered the best performance in the user data rates measurement; AIS was the best in the latency measurement to both domestic and international websites. The speed test measurement was spitted between DTAC and TrueMoveH. The report by NBTC (2014) indicated that DTAC had the best performance in the user data rates during November 2013 to February
http
://jic
t.uum
.edu
.my
23
Journal of ICT, 15, No. 1 (June) 2016, pp: 1–31
2014. Therefore, our findings were resulted in accordance with the NBTC report. It is also appropriate to note that our user data rates measurement was also measured in seconds. Hence, the throughput performance in kbps was considered to be valid under the speed test measurement.
Table 9
Average Values of 3G on 2100MHz Measurements by Providers
3G 2100MHz Ping Domestic
(Milliseconds)
Ping International (Millisecond)
Speed Test (kbps) FTP (Seconds)
Download Upload Download Upload
AIS 179.25 283.41 11473.34 1339.86 2.69 9.21
DTAC 357.90 310.09 16713.37 1892.72 2.23 8.16
TrueMoveH 174.56 179.12 11996.04 2295.56 2.13 5.77
Table 10
Average Values of 3G on 850/900MHz and 2100MHz Measurements by Providers
3G 850/900MHz&
3G 2100MHz
Ping Domestic
(Milliseconds)
Ping International (Millisecond)
Speed Test (kbps) FTP (Seconds)
Download Upload Download Upload
AIS 295.29 341.39 7372.28 884.69 8.07 39.44
DTAC 450.26 493.93 9614.41 1211.64 7.80 40.64
TrueMoveH 320.15 418.08 8147.91 1589.66 5.43 16.83
Knowledge factors
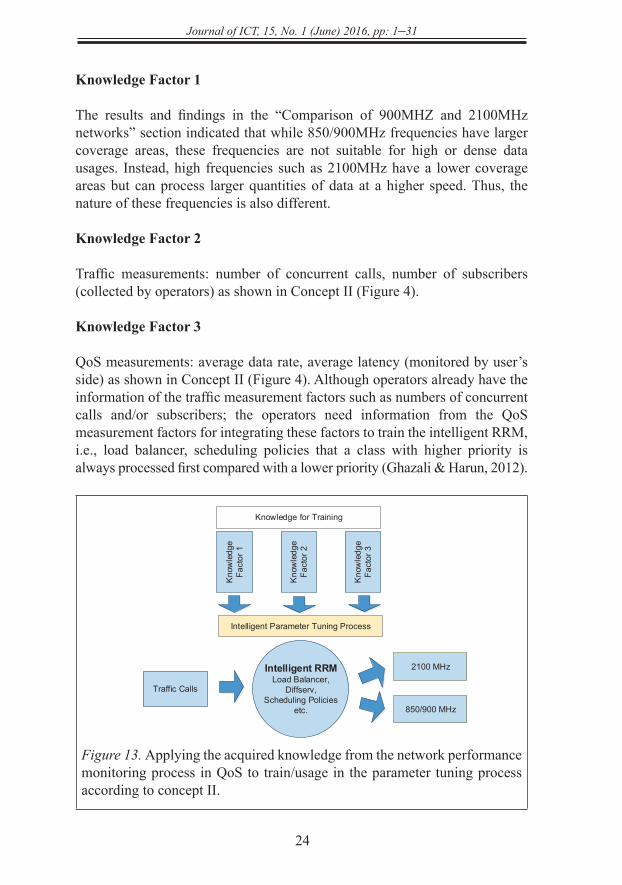
The comparison of 900MHZ and 2100MHz (Figure 1) suggested that 850/900MHz was more preferred than 2100MHz for 3G implement. In contrast to this comparison, this paper presents that 2100MHz is more suitable for supporting high data rate respect to user satisfaction and leads toward 4G. Our research findings has confirmed the objectives that there is a need to acquire knowledge from the QoS measurement within the network performance monitoring process. These knowledge then feed into the train or usage in the parameter tuning process according to Concept II. The major knowledge factors and diagram for training the intelligent Radio Resource Management (RRM) in the parameter tuning for such traffic engineering between 850/900MHz and 2100MHz bands are presented in Figure 13.
http
://jic
t.uum
.edu
.my
Journal of ICT, 15, No. 1 (June) 2016, pp: 1–31
24
Knowledge Factor 1
The results and findings in the “Comparison of 900MHZ and 2100MHz networks” section indicated that while 850/900MHz frequencies have larger coverage areas, these frequencies are not suitable for high or dense data usages. Instead, high frequencies such as 2100MHz have a lower coverage areas but can process larger quantities of data at a higher speed. Thus, the nature of these frequencies is also different.
Knowledge Factor 2
Traffic measurements: number of concurrent calls, number of subscribers (collected by operators) as shown in Concept II (Figure 4).
Knowledge Factor 3
QoS measurements: average data rate, average latency (monitored by user’s side) as shown in Concept II (Figure 4). Although operators already have the information of the traffic measurement factors such as numbers of concurrent calls and/or subscribers; the operators need information from the QoS measurement factors for integrating these factors to train the intelligent RRM, i.e., load balancer, scheduling policies that a class with higher priority is always processed first compared with a lower priority (Ghazali & Harun, 2012).
Figure 13. Applying the acquired knowledge from the network performance monitoring process in QoS to train/usage in the parameter tuning process according to concept II.
Intelligent RRMLoad Balancer,
Diffserv,Scheduling Policies
etc.
Kno
wle
dge
Fact
or 3
2100 MHz
850/900 MHz
Kno
wle
dge
Fact
or 2
Kno
wle
dge
Fact
or 1
Traffic Calls
Intelligent Parameter Tuning Process
Knowledge for Training
http
://jic
t.uum
.edu
.my

25
Journal of ICT, 15, No. 1 (June) 2016, pp: 1–31
Application of Knowledge Factors
Thus, there are several ways for applying these knowledge. Chimmaee et al. (2005) presented an intelligent load balancer based on hybrid neuro-fuzzy for distributing incoming application traffic between two links. Chimmanee et al. (2005) analogized two links as two classes, and taken a concept of traffic classification for distributing traffic. Before such intelligent load balancer can work properly, knowledge of application characteristic is needed. Examples of this knowledge are volume traffic, packet size, and delay-sensitive, to train the intelligent load balancer. In the same direction, two frequencies are analogized as two classes, which correspond to the traffic classification function in the QoS attribute mapping task of the network optimization process (Laiho et al., 2006). The proposed idea in Figure 13 which is a part of the Concept II framework are to combine the major factors into account in order to support mapping the service performance to the support mechanisms following the 3GPP QoS architecture. Intelligent traffic engineering such as load balancer with the proposed knowledge should be applied to Thai operators.
CONCLUSION
This study proposed the conceptual frameworks for performance testing and network optimization. It reported the performance comparison of operators conducted in Bangkok according to the Concept I framework in assisting users’ satisfaction decision about the services. The performance of 3G on 850/900MHz on and 2100MHz frequencies had been evaluated. The test results indicated that 2100MHz offered the better overall performance than 850/900MHz. The latency measurements indicated 47% better performance than 850/900MHz. The user data rate measurements indicated 621% better performance than 850/900MHz. The speed test measurements resulted in 349% better than its counterpart. In terms of the operators, TrueMoveH offered the best performance in the user data rate measurements; while AIS was the best in the latency measurements to both domestic and international websites. The speed test measurements were spitted between DTAC and TrueMoveH. Moreover, there is a need to obtain the knowledge from the QoS measurements from both 850/900MHz and 2100MHz because Thai operators already occupied both of the frequencies. While Thai operators may have information about their traffic measurements, the QoS which is perceived by the users are needed. Finally, this study had not only proffered the conceptual frameworks but has also presented evidence that supports the propositions, which the operators in Thailand could take information of the acquired knowledge into their account for Intelligent RRM in the parameter tuning.
http
://jic
t.uum
.edu
.my

Journal of ICT, 15, No. 1 (June) 2016, pp: 1–31
26
ACKNOWLEDGEMENTS
The authors express the most sincere thanks to Sitthipun Chingchit, Phitsanuluk Sricharoen, and Sittisak Kantala for their contributions.
REFERENCES
3GPP. (2014). GPRS & EDGE. Retrieved from http://www.3gpp.org/technologies/ keywords-acronyms/102-gprs-edge
Abdullah, M. F. L., Abdullah, J., Yonis, A. Z., & Ghanim, M. F. (2011). Comparison study on 3.9 G and 4G evolution. Proceedings of the 2011 International Conference on Information Communication and Management (pp. 181-186). Singapore.
Alexa Internet Inc. (2012). The top 500 sites on the web. Retrieved from http://www.alexa .com/topsites
Almutairi, A. F., Al-Jame, F., & A-Buraikan, A. (2009). GPRS/EDGE/3G/HSDPA networks performance measurements in the State of Kuwait. Proceedings of the 5th IEEE GCC Conference & Exhibition (pp. 1-3). Kuwait City, Kuwait.
Anupan, I. (2012). The measurement and comparison of 3G performance via mobile phone between True Move H and Dtac. (Unpublished master’s thesis). King Mongkut’s of University Technology North Bangkok, Thailand.
Cela, S., Kamo, B., Cakaj, S., Muka, Q., & Mitrushi, R. M. (2013). An algorithm for processing the measurement results of electromagnetic field near 2G and 3G base stations in Albanian territory. Proceedings of the 21st IEEE International Conference on Software, Telecommunications and Computer Networks (SoftCOM) (pp. 1-5). Primosten, Croatia.
Chen, Y., Towsley, D., Nahum, E. M., Gibbens, R. J., & Lim, Y. (2012). Characterizing 4G and 3G networks: supporting mobility with multipath TCP. UMass Amherst Technical Report, 22, 1-13.
Chimmaee, S., Wupusitwarakun, K., & Runggeratigul, S. (2005). Hybrid neuro-fuzzy based adaptive load balancing for delay-sensitive internet application. Journal of Intelligent and Fuzzy System (JIFS), 16(2), 79-93.
http
://jic
t.uum
.edu
.my

27
Journal of ICT, 15, No. 1 (June) 2016, pp: 1–31
Chingchit, S. (2014). Performance comparison of Internet services using 3G 2100 MHz technologies in Bangkok. (Unpublished master’s thesis). Rangsit University, Thailand.
Chingchit, S., & Chimmanee, S. (2014). Performance comparison of internet services using 3G 2100 MHz technologies in Bangkok. Proceedings of the SAU National Interdisciplinary Conference (pp. 20-29). Bangkok, Thailand.
Darst, C., & Ramanathan, S. (1999). Measurement and management of internet services. Proceedings of the 6th IFIP/IEEE International Symposium on Integrated Network Management and Distributed Management for the Networked Millennium (pp. 125-140). Boston, United States.
ETDA. (2013). Thailand Internet user profile 2013. Bangkok, Thailand: Author.
ETSI. (2014a). EDGE. Retrieved from http://www.etsi.org/index.php/technologies-clusters/technologies/mobile/edge
ETSI. (2014b). General packet radio service, GPRS. Retrieved from http://www.etsi.org/ technologies-clusters/technologies/mobile/gprs?highlight=YToxOntpOjA7czo0OiJncHJzIjt9
Fricke, M., Heckwolf, A., Herber, R., Nitsch, R., Schwarze, S., & Voß, S. (2012). Requirements of 4G-based mobile broadband on future transport networks. Journal of Telecommunications and Information Technology, 2, 21-28.
Garber, L. (2002). Will 3G really be the next big wireless technology. Computer, 35(1), 26-32.
Ghazali, O., & Harun, N. Z. (2012). Implementation and validation of an adaptive FEC machanism for video transmission. Journal of Information and Communication Technology, 11, 55-74.
Hartung, F., Horn, U., Huschke, J., Kampmann, M., Lohmar, T., & Lundevall, M. (2007). Delivery of broadcast services in 3G networks. IEEE Transactions on Broadcasting, 53(1), 188-199.
Haryadi, S., & Andina, R. (2012). QoS measurement of file transfer protocol services in 3G networks using aggregation method. Proceedings of the
http
://jic
t.uum
.edu
.my

Journal of ICT, 15, No. 1 (June) 2016, pp: 1–31
28
7th IEEE International Conference on Telecommunication Systems, Services, and Applications (TSSA) (pp. 107-110). Bali, Indonesia.
Hu, Y., Liu, J., & Tan, X. (2010). Digital modulation recognition based on instantaneous information. The Journal of China Universities of Posts and Telecommunications, 17(3), 52-90.
Iamsamang, W. (2010). Performance analysis of 3G data service on the underground mass rapid transit authority of Thailand (MRTA) Bangkok airport train and department store and shopping mall. (Unpublished master’s thesis). King Mongkut’s of University Technology North Bangkok, Thailand.
Internet Innovation Research Center Co Ltd. (2012). Top 10 websites. Retrieved from http://truehits.net
Jørgensen, N. T., Rodriguez Larrad, I., Elling, J., & Mogensen, P. (2014). 3G Femto or 802.11g WiFi: Which is the best indoor data solution today? Proceedings of the 2014 IEEE Vehicular Technology Conference (VTC Fall) (pp. 1-5). Vancouver, Canada.
Klessig, H., & Fettweis, G. (2014). Adaptive admission control in interference-coupled wireless data networks: A planning and optimization tool set. Proceedings of the 2014 IEEE International Conference on Communications (ICC) (pp. 2375-2380). Sydney, Australia.
Kurose, J. F., & Ross, K. W. (2013). Computer networking: a top-down approach. Upper Saddle River, NJ: Addison-Wesley.
Lachowski, J., Maternia, M., & Gorzynski, J. (2011). Multiband and multicarrier operations in HSDPA. Proceedings of the 8th International Symposium on Wireless Communication Systems (ISWCS), (pp. 725-729). Aachen, Germany.
Laiho, J., Wacker, A., & Novosad, T. (2006). Radio network planning and optimisation for UMTS. New York, NY: John Wiley & Sons.
Laner, M., Svoboda, P., Romirer-Maierhofer, P., Nikaein, N., Ricciato, F., & Rupp, M. (2012). A comparison between one-way delays in operating HSPA and LTE networks. Proceedings of the 10th International Symposium on Modeling and Optimization in Mobile, Ad Hoc and Wireless Networks (WiOpt) (pp. 286-292). Paderborn, Germany.
http
://jic
t.uum
.edu
.my

29
Journal of ICT, 15, No. 1 (June) 2016, pp: 1–31
Lodhi, A., Hathi, N., Gkekas, Y., & Nahi, P. (2008). Coverage comparison of UMTS networks in 900 and 2100 MHz frequency bands. Paper presented at the IET International Conference on Wireless, Mobile and Multimedia Networks (pp. 22-25). Beijing, China.
Malisuwan, S., Kaewphanuekrungsi, W., Madan, N., & Sivaraks, J. (2015). Analysis of 2.1 GHz spectrum auction in Thailand. Journal of Economics, Business and Management, 3(6), 591-598.
Malisuwan, S., Teppayayon, O., Madan, N., Sivaraks, J., & Kaewphanuekrungsi, W. (2013). Analysis of mobile spectrum management in Thailand to move towards a knowledge based economy: A regulatory review. Journal of Advanced Management Science, 1(3), 288-298.
Mishra, A. R. (2004). Fundamentals of cellular network planning and optimisation: 2G/2.5 G/3G... evolution to 4G: Hoboken, NJ: John Wiley & Sons.
Mohan, S., Kapoor, R., & Mohanty, B. (2011). Latency in HSPA data networks. Retrieved from https://www.qualcomm.com/media/documents/files/qualcomm-research-latency-in-hspa-data-networks.pdf
Nakamura, T. (2011). 3GPP radio access networks LTE-advanced status. Retrieved from ftp://www.3gpp.org/Information/presentations/present ations_2011/2011_09_LTE_Asia/2011_LTEAsia_3GPP%20RAN.pdf
NBTC. (2013). Telecommunications consumption survey of Thailand 2012-2013. Bangkok, Thailand: Author.
NBTC. (2014a). Annual Report on the Operation of the NBTC 2013. Bangkok, Thailand: Author.
NBTC. (2014b). Telecommunication report on 2.1 GHz working group. Bangkok, Thailand: Author.
Oseni, O. F., Popoola, S. I., Enumah, H., & Gordian, A. (2014). Radio frequency optimization of mobile networks in Abeokuta, Nigeria for improved quality of service. International Journal of Research in Engineering and Technology, 3(8), 174-180.
Pabbumnan, N., & Wisitpongphan, N. (2011). Performance comparison of accessing Internet mobile phone using EDGE and 3G technologies.
http
://jic
t.uum
.edu
.my

Journal of ICT, 15, No. 1 (June) 2016, pp: 1–31
30
Proceedings of the 7th National Conference on Computing and Information Technology (NCCIT2011) (pp. 613-618). Bangkok, Thailand.
Person, J. (2008). Mobile Broadband Comparison. Proceedings of the 3G CDMA Africa and Middle East Regional Conference (pp. 1-12). Cape Town, South Africa.
Phonprisan, G., & Boonkrong, S. (2012). Analysis and efficiency validation of video file on 3G and Wi-Fi hotspot technology : A case study of video on-demandstreaming. Proceedings of the 8th National Conference on Computing and Information Technology (NCCIT2012) (pp. 853-859). Chonburi, Thailand.
Ramli, R., Jamaluddin, F., Bakar, E. M. N. E. A., Alias, M. Y., Mahat, N. I., & Karim, M. Z. A. (2013). Assignment of spectrum demands by merits via analytic hierarchy process and integer programing. Journal of Information and Communication Technology, 12, 39-53.
Ranta, P. (2004). Top 10 3G optimisation actions. Retrieved January from the Academia website: https://www. academia.edu/7872546/TOP_10_3G_RAN_Optimisation_Actions_Version_0.4
Real Wireless Ltd. (2012). Timing of consumer and operator features available from HSPA and LTE. Pulborough: England: Author.
Saxena, T., & Jadon, J. S. (2013). Review on 2G, 3G and 4G radio network planning. International Journal of Engineering, Business and Enterprise Applications, 84-89.
Simba, F., Trojer, L., Mwinyiwiwa, B., Mvungi, N., & Mjema, E. (2012). Techno-economic analysis of UMTS900 and UMTS2100 for rural connectivity in Tanzania. Proceedings of the 14th IEEE International Conference on Communication Technology (ICCT) (pp. 10-15). Chengdu, China.
Sköld, J., Lundevall, M., Parkvall, S., & Sundelin, M. (2005). Broadband data performance of third-generation mobile systems. Ericsson Review, 82(1), 14-23.
Sricharoen, P. (2013). Performance comparison of internet services by 3G technology based on 850 and 900 mhz in the most congestion areas in Bangkok (Unpublished master’s thesis). King Mongkut’s of University Technology North Bangkok, Thailand.
http
://jic
t.uum
.edu
.my
31
Journal of ICT, 15, No. 1 (June) 2016, pp: 1–31
Sricharoen, P., & Chimmanee, S. (2013). Comparison the efficiency of internet services by 3G technology in Thailand. RMUTP Reserach Journal (Special Issue), 20-29.
Tapia, P., Liu, J., Karimli, Y., & Feuerstein, M. (2009). HSPA performance and evolution: a practical perspective. Bognor Regis, West Sussex: John Wiley & Sons.
Tarun, M. (2014). 3G KPI Guidelines. Retrieved from https://www.academia.edu /4306825/3G_KPI_guidelines
Thongkaobua, M. (2011). Impact of velocity on 3G network performance. (Unpublished master’s thesis). King Mongkut’s of University Technology North Bangkok, Thailand.
Total Access Communication PLC. (2014). TriNet 3 smart networks. Retrieved from http://www.dtac.co.th/en/business/trinet/trinet.html
Vacirca, F., Ricciato, F., & Pilz, R. (2005). Large-scale RTT measurements from an operational UMTS/GPRS network. Proceedings of the 1st International Conference on Wireless Internet, WICON 2005 (pp. 1-8). Budapest, Hungary.
Worakitpunya, K. (2010). Performance analysis of 3G data service on the Bangkok mass transit system (BTS). (Unpublished master’s thesis). King Mongkut’s of University Technology North Bangkok, Thailand.
http
://jic
t.uum
.edu
.my