Embed Size (px)
Citation preview
Advances in Concrete Construction, Vol. 1, No. 3 (2013) 201-213
DOI: http://dx.doi.org/10.12989/acc2013.1.3.201 201
Copyright © 2013 Techno-Press, Ltd.
http://www.techno-press.org/?journal=acc&subpage=7 ISSN:2287-5301(Print)2287-531X(Online)
Service life prediction of a reinforced concrete bridge exposed to chloride induced deterioration
Vagelis G. Papadakis
Department of Environmental and Natural Resources Management, University of Patras,
Seferi 2, GR-30100, Agrinio, Greece
(Received November 23, 2012, Revised February 25, 2013, Accepted April 18, 2013)
Abstract. While recognizing the problem of reinforcement corrosion and premature structural deterioration of reinforced concrete (RC) structures as a combined effect of mechanical and environmental actions (carbonation, ingress of chlorides), emphasis is given on the effect of the latter, as most severe and unpredictable action. In this study, a simulation tool, based on proven predictive models utilizing principles of chemical and material engineering, for the estimation of concrete service life is applied on an existing reinforced concrete bridge (Ø resund Link) located in a chloride environment. After a brief introduction to the structure of the models used, emphasis is given on the physicochemical processes in concrete leading to chloride induced corrosion of the embedded reinforcement. By taking under consideration the concrete, structural and environmental properties of the bridge investigated, an accurate prediction of its service life is taking place. It was observed that the proposed, and already used, relationship of service lifetime- cover is almost identical with a mean line between the lines derived from the minimum and maximum critical values considered for corrosion initiation. Thus, an excellent agreement with the project specifications is observed despite the different ways used to approach the problem. Furthermore, different scenarios of concrete cover failure, in the case when a coating is utilized, and extreme deicing salts attack are also investigated.
Keywords: bridge; chloride attack; concrete; durability; failure scenarios; protective measures; service life
1. Introduction
The majority of concrete deterioration cases is connected to corrosion of reinforcement due to
carbonation- or chloride-induced depassivation of steel bars. In urban and industrial areas, where
environmental pollution results in a significant concentration of carbon dioxide, carbonation-
initiated reinforcement corrosion prevails. Numerous surveys have indicated that chloride ions,
originating from deicing salts or seawater, are the primary cause of reinforcing steel corrosion in
highways and marine or coastal structures (Shi et al. 2012). The chlorides that transported through
the concrete pore network and microcracks depassivate the oxide film covering the reinforcing
steel and accelerate further the reaction of corrosion. Even high-performance concrete may not
necessarily ensure long-term durability in a severe environment unless it is designed for
dimensional stability and soundness.
Over the past 50 years, an enormous amount of energy has been expended in laboratory and
Corresponding author, Professor, E-mail: [email protected]
Vagelis G. Papadakis
field studies of chloride effect on concrete durability. Despite this effort, it is still not possible to
identify the “ideal” concrete to provide optimum performance in a particular corrosive
environment, because of the numerous material, design and environmental parameters involving
into this problem (Mehta and Monteiro 2006). A fundamental approach is, therefore, absolutely
necessary.
In the present work, a simulation tool, based on proven predictive models utilizing principles of
chemical and material engineering, for the estimation of concrete service life (according to in
performance-related methods of the European Standard EN 206 for assessing durability) is applied
on an existing reinforced concrete bridge (Ø resund Link; connecting Denmark and Sweden)
located in a chloride-rich environment. After a brief introduction to the structure of the models
used, emphasis is given on the physicochemical processes in concrete leading to chloride induced
corrosion of the embedded reinforcement. By taking under consideration the concrete
compositional parameters, the environmental conditions and various structural properties of the
bridge investigated, an accurate prediction of its service life is taking place. Furthermore, different
scenarios of concrete cover failure, in the case when a coating is utilized, and extreme deicing salts
attack are also investigated. Overall various protective measures are suggested for secure
protection against chloride attack.
2. Mathematical model
Almost in the majority of papers, chloride transport in concrete is modeled using the Fick’s
second law of diffusion neglecting the chloride interaction with the solid phase. However, several
field studies in recent years have indicated that the strict use of this law is not applicable for long
term chloride transport into concrete, calculating very often a decreasing chloride transport
coefficient in time (Tang et al. 2012). It is widely accepted that the transport behavior of chloride
ions in concrete is a more complex and complicated transport process than what can be described
by Fick’s law of diffusion (Glasser et al. 2008, Zhang and Gjørv 1996, Tang et al. 2012). This
approach, therefore, can be characterized as empirical, resulting in the calculation of an “apparent”
effective diffusivity unable often to explain chloride penetration and confrontation practices.
There is a generally good correlation between C3A-content (or C4AF when there is lack of C3A-
phase) and chloride binding capacity. There is also evidence for binding of chlorides in CSH gel,
possibly in interlayer spaces (Beaudoin et al. 1990). The Na+ ions can be bound in CSH gel lattice
(Suryavanshi et al. 1996), especially when the C/S ratio is low. Several secondary chloride-
calcium compounds have also been reported (Roy et al. 2000). In addition to the chemical binding,
the effects of ionic interaction, lagging motion of cations and formation of electrical double layer
on the solid surface are all playing an important role in the transport of chloride ions in concrete
(Zhang and Gjørv 1996).
The relationship between bound and free chlorides is non-linear and may be expressed by
Langmuir equation (Pereira and Hegedus 1984), Freundlich equation or modified BET equation
(Tang et al. 2012). Among them the Langmuir equation is both fundamental and easier for
practical applications. Pereira and Hegedus (1984) were the first to identify and model chloride
diffusion and reaction in fully saturated concrete as a Langmuirian equilibrium process coupled
with Fickian diffusion. Furthermore, Papadakis et al. (1996) and Papadakis (2000) generalized this
pioneering model effort of Pereira & Hegedus and extended to more general conditions, offering
an alternative simpler, yet equally accurate, numerical and analytical solution. By introducing a
202
Service life prediction of a reinforced concrete bridge exposed to chloride
chloride-solid phase interaction term in the equations the calculation of an “intrinsic” effective
diffusivity is possible.
The physicochemical processes of diffusion of Cl- in the aqueous phase of the concrete pores,
their adsorption and binding in the solid phase of concrete, and their desorption therefrom are
described by a nonlinear partial differential equation for the concentration of Cl- in the aqueous
phase [Cl-(aq)] (in kg/m
3 pore solution), from which that of Cl
- bound in the solid phase [Cl
-(s)]
(kg/m3 concrete) can be computed algebraically (Papadakis 2000)
2
2
2
2
, )(
))(1()(
))(1()(
x
aqCl
aqClKsClK
aqClKD
t
aqCl
eqsateq
eqCle
(1)
sat
eq
eqsCl
aqClK
aqClKsCl )(
)(1
)()(
(2)
initial condition: [Cl-(aq)] = [Cl
-(aq)]I at t = 0 (initial concentration) (3)
boundary conditions: [Cl-(aq)] = [Cl
-(aq)]0 at x = 0 (concrete surface) (4a)
∂[Cl-(aq)] / ∂x = 0 at x = M (axis of symmetry) (4b)
In these equations, x is the distance from the concrete surface (m), t is the time (s), De,Cl-
denotes the intrinsic effective diffusivity of Cl- in concrete (m
2/s), Keq the equilibrium constant for
Cl- binding (m
3 of water pore volume/kg), [Cl
-(s)]sat the saturation concentration of Cl
- in the solid
phase (kg/m3 concrete), and ε the concrete porosity (m
3 pore volume/m
3 concrete). As observed
from Eq. (2), the chloride binding capacity depends both on [Cl-(s)]sat (content of sites which can
bind chlorides) and Keq (ratio of adsorption to desorption rate constants). Eq. (1) can be solved
only numerically, e.g., using a finite difference or element method. The solution allows estimation
of the time (critical time for chloride-induced corrosion, tcr) required for the chloride concentration
surrounding the reinforcement to increase over the threshold of depassivation of reinforcing bars,
[Cl-(aq)]cr.
As observed from Eq. (1), chloride ingress is retarded as De,Cl- decreases, [Cl-(s)]sat increases, or
Keq increases. When a supplementary cementing material (SCM), such as silica fume (SF) or fly
ash (FA), is added in concrete, the chloride binding capacity increases, as experimental results
showed (higher total chloride content in a thin slice near the external concrete surface; Papadakis
2000, Papadakis et al. 2007). This may be attributed to higher CSH content, especially that with
lower C/S ratio, which can bind Na+ ions and, therefore, the accompanied Cl
-. On the other hand,
the pore restructuring due to pozzolanic products may decrease intrinsic diffusivity as well. As
observed (Papadakis 2000), a fine network of pozzolanic product (CSH) is created in the middle of
a capillary pore acting as trap for chlorides. Using atomic force microscopy (Papadakis et al.
1999), it was obtained that the internal surface of the SCM-cement pastes presents small spheroid
bulges giving an additional pore roughness.
2.1 Parameter estimation Let us suppose that 1 m
3 of fresh concrete that contains potentially both silica fume and fly ash
is composed as follows:
203
Vagelis G. Papadakis
C: kg cement / m3 ρC: cement density (kg/m
3)
SF: kg silica fume / m3 ρSF: silica fume density (kg/m
3)
FA: kg fly ash / m3 ρFA: fly ash density (kg/m
3)
A: kg aggregates / m3 ρA: aggregate density (kg/m
3)
W: kg water / m3 ρW: water density (kg/m
3)
D: kg admixtures / m3 ρD: admixture density (kg/m
3)
εair: m3 of entrained or entrapped air / m
3
The following balance equation should be fulfilled:
C/ρC + SF/ρSF + FA/ρFA + A/ρA + W/ρW + D/ρD + εair = 1 (5)
It has been shown (Papadakis 1999a, b), that if α is the portland cement hydration degree, and β
the fly ash reaction degree, the total porosity of a non-carbonated concrete, ε is given as follows
(SF does not practically influence the total porosity)
ε =εair+W/ρW-0.227 10-3
α C - 0.188 10-3
β FA (6)
The intrinsic effective diffusivity of Cl- in concrete (m
2/s) can be estimated by the following
semi-empirical equation (Papadakis 2000)
DC k SF k FA W
e Cl
SF FA
C W
eff,
. .( )
2 410 10
2
3
(7)
Eq. (7) is valid for NaCl and for 0.4 < W/C < 0.7, 0 < A/C < 6; for CaCl2 the numerator is 2
×10-10
. For W/C < 0.5, the dependence of De,Cl- from εeff is slightly higher, i.e., (εeff)3.5
. In Eq. (7) kSF
and kFA are the efficiency factors (k-values) of silica fume and fly ash respectively regarding
chloride penetration, and εeff an effective, for diffusion, porosity, calculated as follows
εeff = W/ρW - 0.227 10-3
α (C + kSFSF + kFAFA) (7a)
If sea attack concerns, the chloride concentration in the aqueous solution at the concrete
surface, [Cl-(aq)]0 (kg/m
3 pore solution), depends on the sea, e.g., Atlantic ocean: 20 kg/m
3, North
Sea: 16 kg/m3, Baltic Sea: 4 kg/m
3. In the case of deicing salts, the precise estimation of [Cl
-(aq)]0
is difficult due to many involved parameters (i.e., frequency and quantity of salt spreading, amount
of available water from rain or melted snow for salt dissolution, washout, etc.).
Parameters [Cl-(s)]sat and Keq can be determined from chloride binding isotherms. However, as
a first approximation the following empirical expressions may be used (Papadakis 2000; for NaCl)
[Cl-(s)]sat = 8.8 10
-3 (C + kSFSF + kFAFA) (8)
Keq = 0.1 m3 pore volume/kg Cl
- (9)
2.2 Chloride threshold for reinforcement corrosion It is well-established that the depassivation of embedded steel is a function not only of Cl
-
concentration, but also of OH- concentration. Diamond (1986) showed that for pH values
204
Service life prediction of a reinforced concrete bridge exposed to chloride
representative of those in concrete pore solutions (12.6-13.3) the maximum Cl-/OH
- ratio which
can be tolerated without depassivation is 0.3. This value corresponds to 0.32% total Cl- bw of
cement if the cation is Ca2+
and to 0.46% if the cation is Na+
in a normal portland cement.
However, much higher values of Cl-/OH
- ratio (1.3-2) have been reported (e.g., Hussain et al.
1995). These disagreements are very often related to the method which applied for the pH
determination, i.e., via electrode or titration, and it seems that for a safe calculation the threshold
value expressed by the Cl-/OH
- ratio should be considered as 0.6 (Goñi and Andrade 1990).
The pH-value of pore solution is determined from the presence of sodium and potassium ions
rather than calcium, thus a small decrease is expected if any by the use of CH-consuming materials.
In the case of fly ash this decrease is rather negligible, whereas for SF more pronounced but still
higher than 12.5 for 25% replacement (Sellevold and Nilsen 1987). Taking into account the
uncertainty in pH-prediction and, moreover, the rather high sensitivity of OH- concentration on
small pH changes, this approach may lead to significant different estimations for chloride
threshold (e.g., pH=12.6 means [OH-(aq)]= 40 mol/m
3 pore solution and therefore [Cl
-(aq)]cr = 24
mol/m3 pore solution; whereas for pH = 13.6 the [OH
-(aq)]= 400 mol/m
3 pore solution and [Cl
-
(aq)]cr = 240 mol/m3 pore solution).
Another way of threshold expression is by measurement of total chloride ion content in
concrete required for the onset of reinforcement corrosion. This approach embodies inaccuracies
because only the free chlorides present in pore solution cause corrosion. However, it is very often
reported that if the total chloride content is more than 0.4% by weight (bw) of cement, the steel is
activated and corrosion may occur. Ιt has been demonstrated (Sandberg 1998) that the chloride
threshold for uncracked SRPC (sulphate resistant portland cement) concrete with low water-to-
cement ratio, W/C (0.3-0.5) is in the range of 1-1.3% total chloride bw of binder, for SRPC
concrete with 5% SF in binder is 0.8-1.0%, and with 10-20% fly ash in the binder is about 0.7%.
Similar values have been reported for wider mixture proportions and materials (Xu et al. 2011,
Yong Ann and Song 2007).
3. Application for the Ø resund Link
The Ø resund or Ö resund Link is a combined twin-track railway and dual carriageway bridge-
tunnel across the Ø resund strait between Sweden and Denmark. The bridge runs nearly 8 km from
the Swedish coast to the artificial island Peberholm, which lies in the middle of the strait. The
remainder of the link is by tunnel from Peberholm to the Danish island Amager.
The application examined below concerns the bridge (technical information from Ø resund
Konsiortiet 1995, Falbe-Hansen and Munch-Petersen 1998, Bræ strup and Ennemark 1998,
Munch-Petersen 1998).
3.1 Estimation of parameters
Mix design parameters (bridge) C = 380 kg/m
3, ρC=3130 kg/m
3
SF = 14 kg/m3, ρSF=2237 kg/m
3 (FA = 0)
W = 139 kg/m3, ρW=1000 kg/m
3
A = 1763 kg/m3, ρA=2620 kg/m
3
εair = 0.055 m3 of entrained or entrapped air / m
3
205
Vagelis G. Papadakis
For silica fume, a higher kSF efficiency factor (about 3) as regards chloride penetration was
estimated (Papadakis 2000) than the usual one (i.e., 2) reported for compressive strength,
indicating that SF reduces the chloride permeability more than it improves the compressive
strength. Thus, kSF = 3 will be used in calculations.
Concrete porosity According to Eq. (6), the total porosity is calculated as ε = 0.116, and the effective porosity as
εeff = 0.053 (for 0.9 degree of hydration).
Intrinsic chloride diffusivity According to Eq. (7), the intrinsic effective diffusivity of Cl
- in fully saturated concrete is
calculated as De,Cl- = 5.10-13
m2/s. However, a lower value may be expected as Eq. (7) is valid for
W/C > 0.4. It has also to be clarified that this diffusion coefficient calculated herein is the
“intrinsic” one, completely different from the “apparent” diffusion coefficient, in which only
diffusion of chlorides is taken into consideration, neglecting the significant interaction (binding) of
the chlorides with the solid phase.
Chloride binding parameters Using Eqs. (8) and (9) the saturation concentration of Cl
- in the solid phase is estimated as [Cl
-
(s)]sat = 3.7 kg/m3 concrete, and the equilibrium constant for Cl
- binding Keq= 0.1 m
3/kg.
Chloride threshold for reinforcement corrosion As clearly stated above, two critical total chloride contents can be defined:
• a pessimistic: 0.4% by weight of cement (usually used in Denmark, by ACI etc.)
• an optimistic: 0.9% by weight of binder [20, SRPC concrete with 5% SF in binder]
Multiplying by the cement or binder content in concrete these thresholds are converted to:
(ε[Cl-(aq)]+[Cl
-(s)])cr,min = 1.5 kg total chlorides/m
3 concrete, and
(ε[Cl-(aq)]+[Cl
-(s)])cr,max = 3.5 kg total chlorides/m
3 concrete,
3.2 Exposure conditions
As stated in technical note (Ø resund Konsiortiet 1995), the concentration of Cl- in sea water in
Ø resund is between the concentration in the North Sea (16 kg/m3 solution) and the concentration
in the Baltic Sea (4 kg/m3 solution). The value of 16 kg/m
3 was selected in those calculations. In
the present approach both cases will be presented.
In the case of deicing salts high chloride concentrations of 100 kg/m3 solution can be
considered. Taking into account that the salt spreading takes place few months per year and
moreover due to wash by rain, the chloride surface concentration decreases, as a first
approximation an equivalent exposure to a 16 kg/m3 (as for North Sea) continuously all year
around can be considered. However, a more realistic approach based on statistical data should be
sought.
Another important conclusion from the present model parametric analyses (Papadakis et al.
1996) should be referred herein. Let us suppose that the exposure of the concrete surface to
chlorides is not continuous but periodic, dividing the total period of time (say tmax), into a number
of intervals of length T, where during one part rT of which the surface is considered to be exposed to
206
Service life prediction of a reinforced concrete bridge exposed to chloride
chloride ingress, while during the rest, (1-r)T, it is not. Pore saturation conditions, though, were not
considered to be affected by the change in exposure conditions. Results (Papadakis et al. 1996) showed
that the free chloride concentration at any time and distance is independent of total duration T of the
exposure-nonexposure cycle and it can be calculated multiplying that of the continuous exposure by the
exposure degree r, i.e.
[Cl-(aq)]r = r [Cl
-(aq)]r=1 (10)
3.3 Model predictions and discussion The Eq. (1) was solved numerically using a finite difference method. The EUCON
© software,
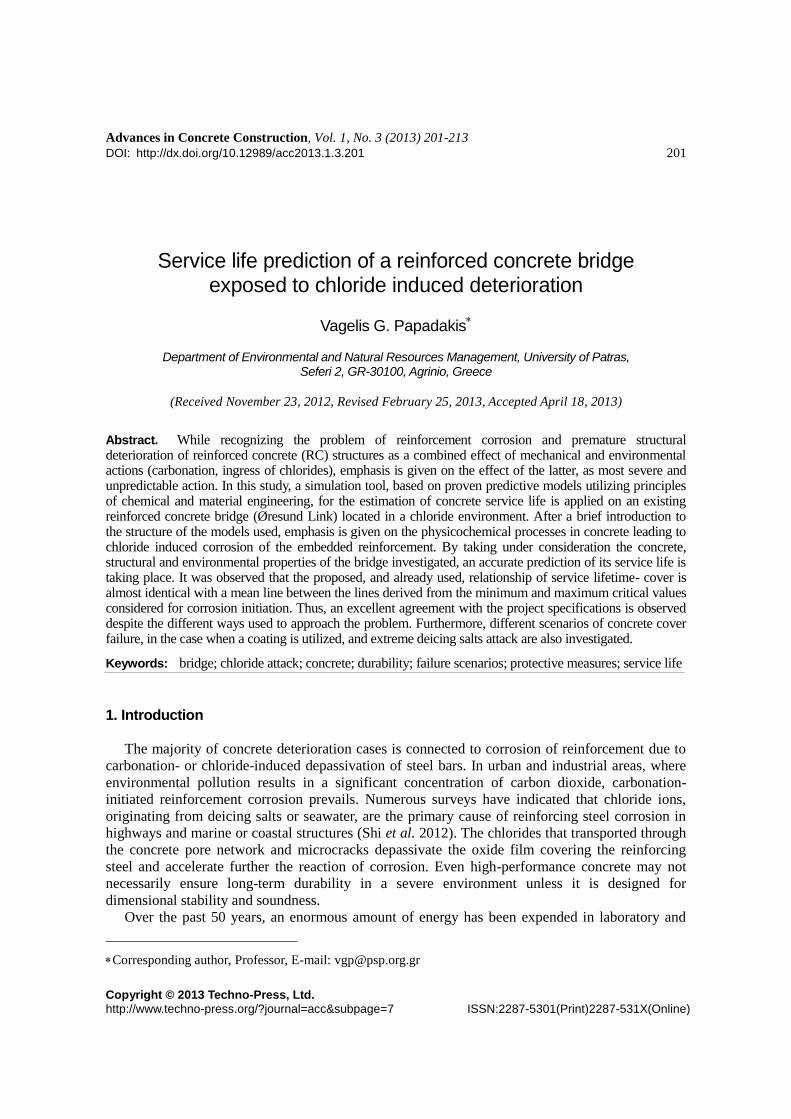
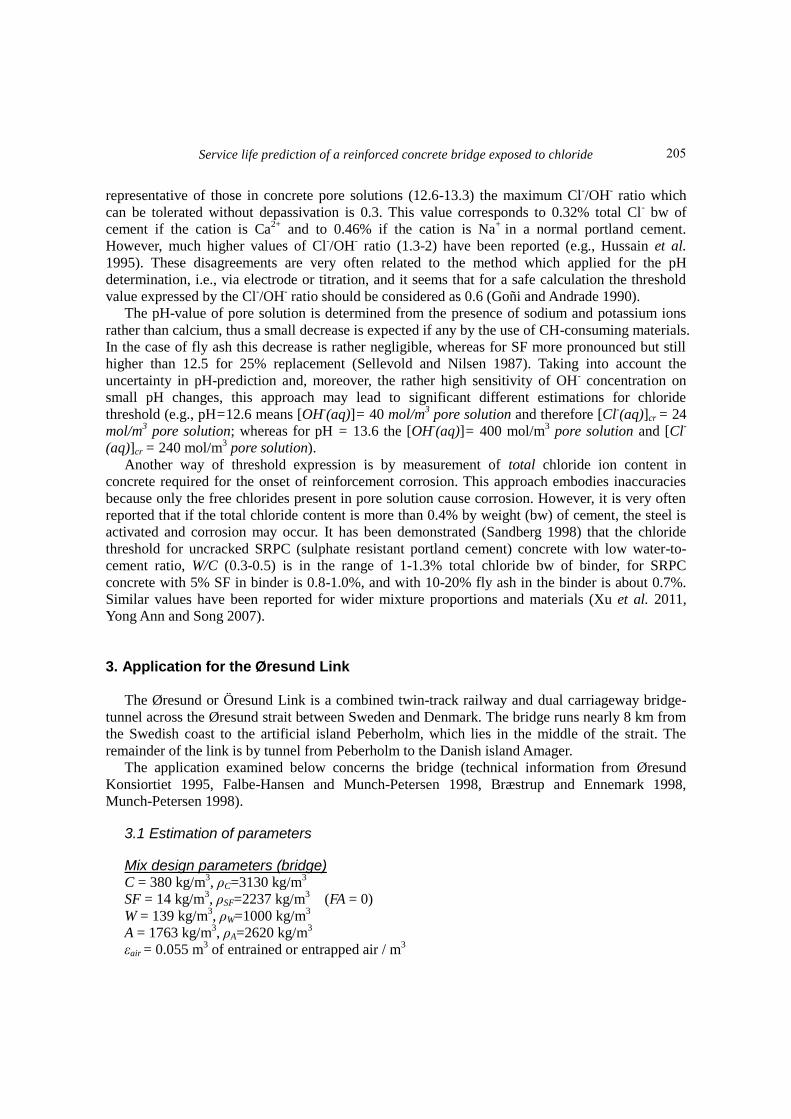
developed by the present author (Papadakis et al. 2007), was used. Fig. 1 shows the time evolution of
the free-Cl- concentration, ε[Cl
-(aq)], and the total-Cl
- one, ε[Cl
-(aq)] + [Cl
-(s)], as a function of the
distance from the outer concrete surface, for a saturated slab continuously exposed to Baltic sea water.
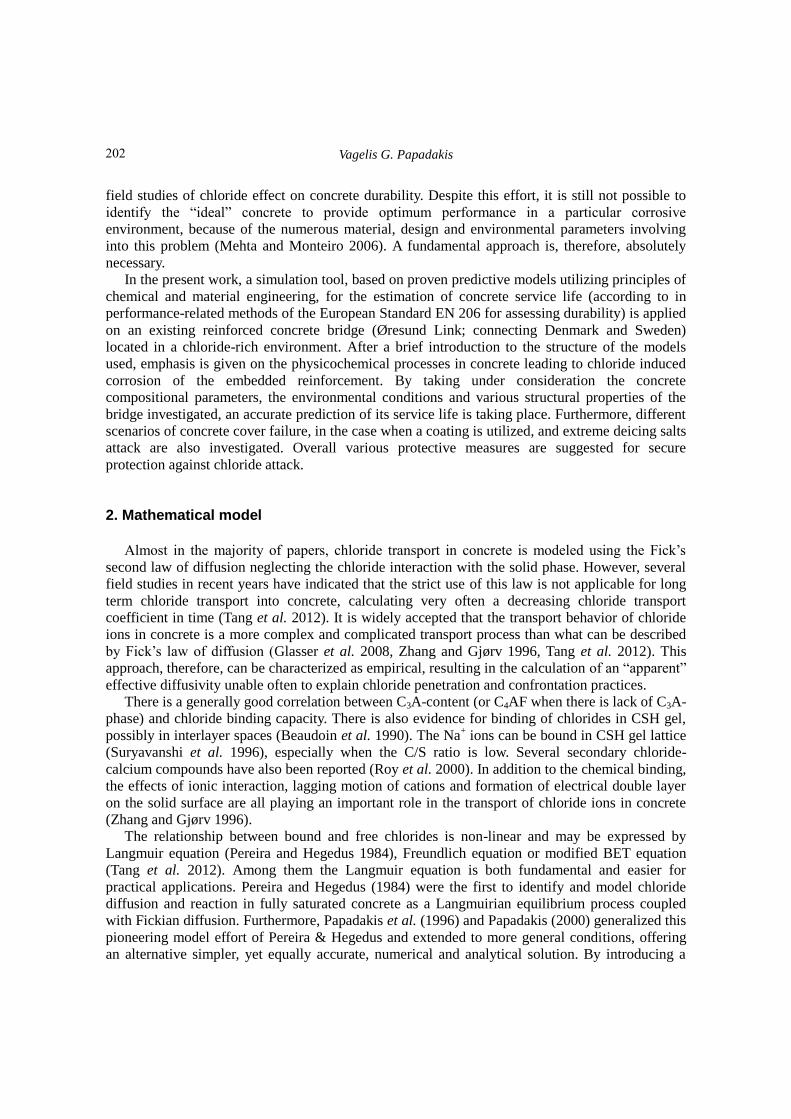
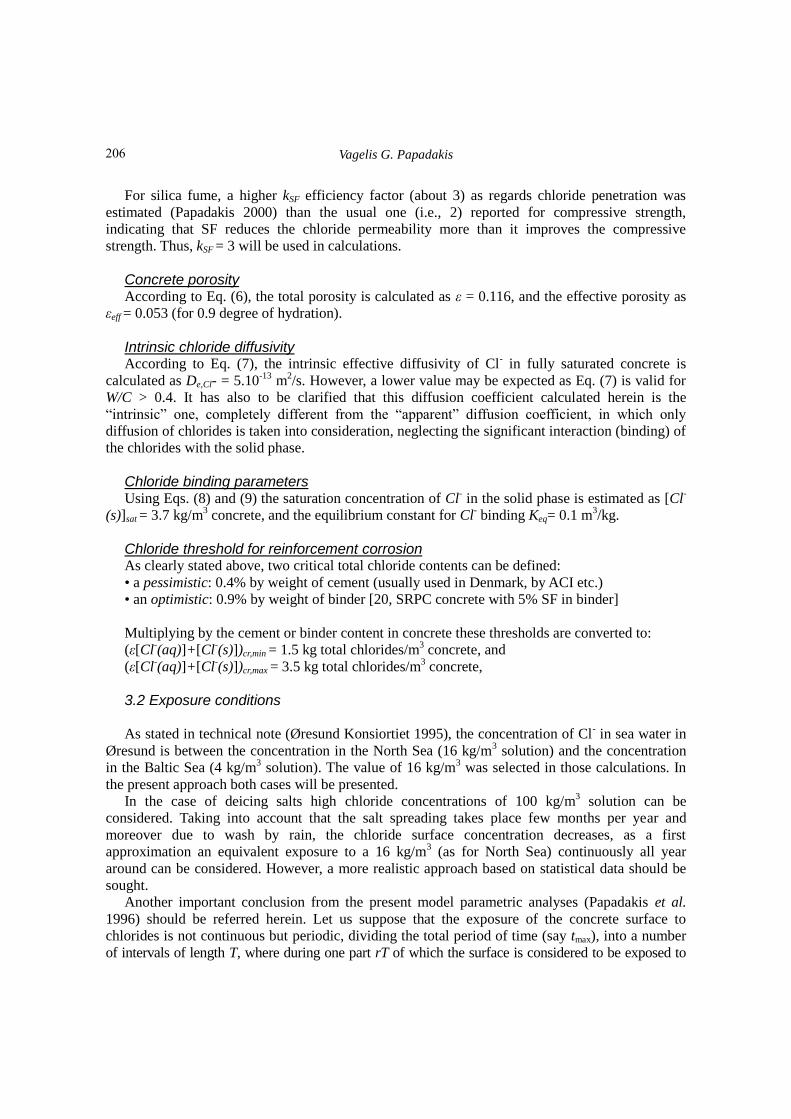
Cl- profiles for 10, 25, 50, 75 and 100 (tmax) years are shown. The exposure to North Sea water (or
equivalently an exposure to deicing salts) is presented in Fig. 2.
In the case of Baltic Sea exposure (Fig. 1), for this specific concrete and deterioration mechanism,
there is no problem for a period of 100 years and for all concrete covers, even if the minimum critical
value is considered.
In the case of North Sea exposure (Fig. 2), different results are obtained depending on critical value
considered. Denoting by L (years) the time required for chloride-induced bar depassivation (practically,
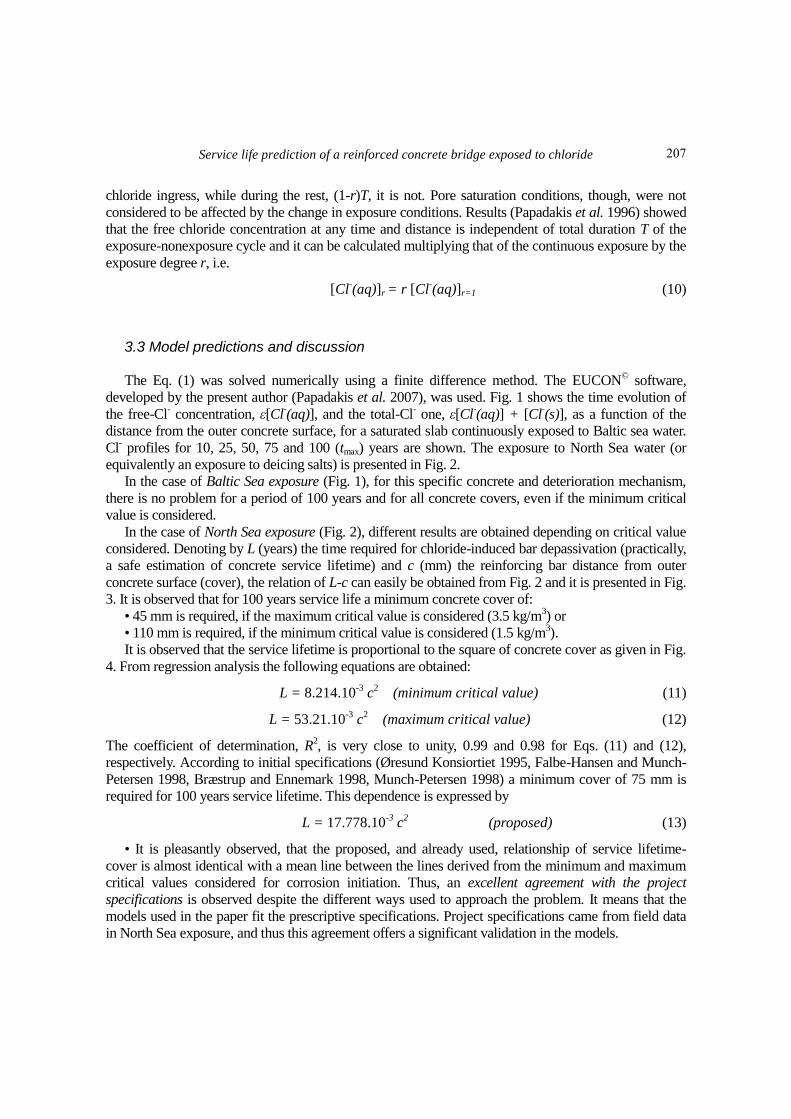
a safe estimation of concrete service lifetime) and c (mm) the reinforcing bar distance from outer
concrete surface (cover), the relation of L-c can easily be obtained from Fig. 2 and it is presented in Fig.
3. It is observed that for 100 years service life a minimum concrete cover of:
• 45 mm is required, if the maximum critical value is considered (3.5 kg/m3) or
• 110 mm is required, if the minimum critical value is considered (1.5 kg/m3).
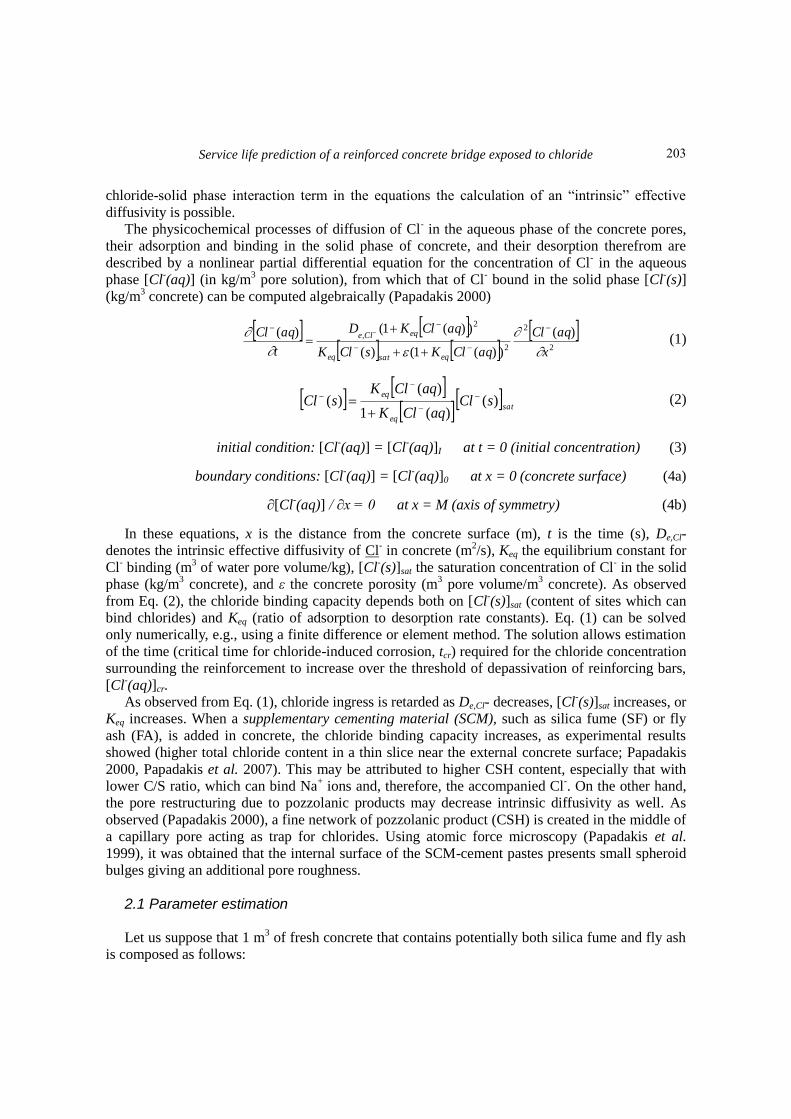
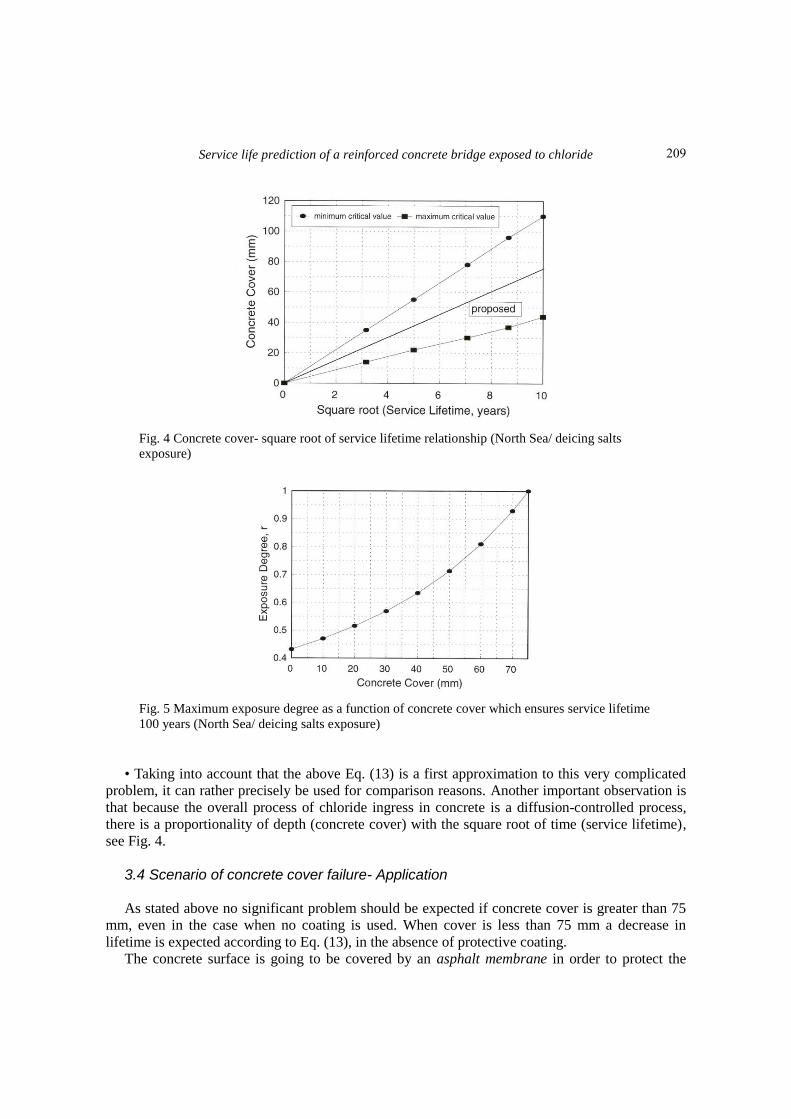
It is observed that the service lifetime is proportional to the square of concrete cover as given in Fig.
4. From regression analysis the following equations are obtained:
L = 8.214.10-3
c2 (minimum critical value) (11)
L = 53.21.10-3
c2 (maximum critical value) (12)
The coefficient of determination, R2, is very close to unity, 0.99 and 0.98 for Eqs. (11) and (12),
respectively. According to initial specifications (Ø resund Konsiortiet 1995, Falbe-Hansen and Munch-
Petersen 1998, Bræ strup and Ennemark 1998, Munch-Petersen 1998) a minimum cover of 75 mm is
required for 100 years service lifetime. This dependence is expressed by
L = 17.778.10-3
c2 (proposed) (13)
• It is pleasantly observed, that the proposed, and already used, relationship of service lifetime-
cover is almost identical with a mean line between the lines derived from the minimum and maximum
critical values considered for corrosion initiation. Thus, an excellent agreement with the project
specifications is observed despite the different ways used to approach the problem. It means that the
models used in the paper fit the prescriptive specifications. Project specifications came from field data
in North Sea exposure, and thus this agreement offers a significant validation in the models.
207
Vagelis G. Papadakis
Fig. 1 Chloride penetration profiles for exposure to Baltic Sea water (4 kg/m
3 solution)
Fig. 2 Chloride penetration profiles for exposure to North Sea water or equivalently to deicing
salts (16 kg/m3 solution)
Fig. 3 Concrete cover- service lifetime relationship (North Sea/ deicing salts exposure)
0
0.2
0.4
0.6
0.8
1
1.2
1.4
0 20 40 60 80 100 120 140 160 180 200
Distance from surface (mm)
Cl-
co
nce
ntr
atio
n (
kg
/m3
co
ncr.
).
free Cl-
total Cl-
10
25
5075
100 years
0
1
2
3
4
5
0 20 40 60 80 100 120 140 160 180 200
Distance from surface (mm)
Cl-
co
nce
ntr
atio
n (
kg
/m3
co
ncr.
).
free Cl-
total Cl-
1025
5075
100 years
maximum critical value
minimum critical value
208
Service life prediction of a reinforced concrete bridge exposed to chloride
Fig. 4 Concrete cover- square root of service lifetime relationship (North Sea/ deicing salts
exposure)
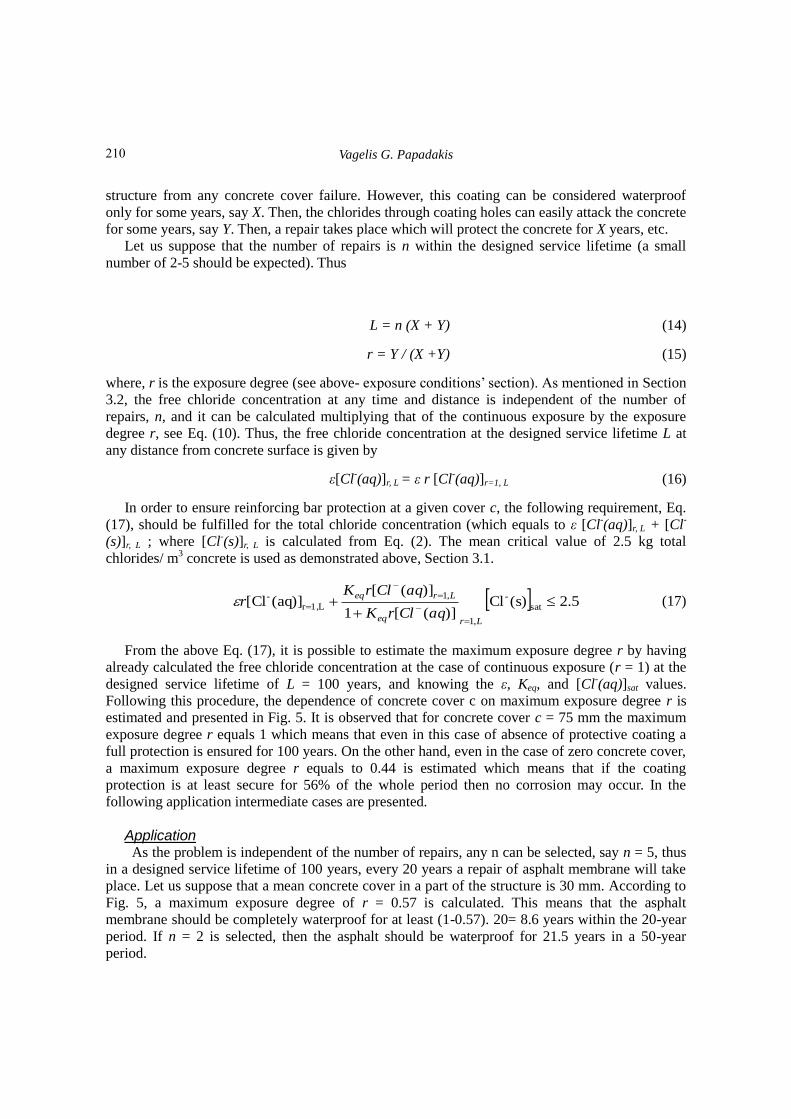
Fig. 5 Maximum exposure degree as a function of concrete cover which ensures service lifetime
100 years (North Sea/ deicing salts exposure)
• Taking into account that the above Eq. (13) is a first approximation to this very complicated
problem, it can rather precisely be used for comparison reasons. Another important observation is
that because the overall process of chloride ingress in concrete is a diffusion-controlled process,
there is a proportionality of depth (concrete cover) with the square root of time (service lifetime),
see Fig. 4.
3.4 Scenario of concrete cover failure- Application
As stated above no significant problem should be expected if concrete cover is greater than 75
mm, even in the case when no coating is used. When cover is less than 75 mm a decrease in
lifetime is expected according to Eq. (13), in the absence of protective coating.
The concrete surface is going to be covered by an asphalt membrane in order to protect the
209
Vagelis G. Papadakis
structure from any concrete cover failure. However, this coating can be considered waterproof
only for some years, say X. Then, the chlorides through coating holes can easily attack the concrete
for some years, say Y. Then, a repair takes place which will protect the concrete for X years, etc.
Let us suppose that the number of repairs is n within the designed service lifetime (a small
number of 2-5 should be expected). Thus
L = n (X + Y) (14)
r = Y / (X +Y) (15)
where, r is the exposure degree (see above- exposure conditions’ section). As mentioned in Section
3.2, the free chloride concentration at any time and distance is independent of the number of
repairs, n, and it can be calculated multiplying that of the continuous exposure by the exposure
degree r, see Eq. (10). Thus, the free chloride concentration at the designed service lifetime L at
any distance from concrete surface is given by
ε[Cl-(aq)]r, L = ε r [Cl
-(aq)]r=1, L (16)
In order to ensure reinforcing bar protection at a given cover c, the following requirement, Eq.
(17), should be fulfilled for the total chloride concentration (which equals to ε [Cl-(aq)]r, L + [Cl
-
(s)]r, L ; where [Cl-(s)]r, L is calculated from Eq. (2). The mean critical value of 2.5 kg total
chlorides/ m3 concrete is used as demonstrated above, Section 3.1.
5.2(s)Cl)]([1
)]([(aq)][Cl sat
-
,1
,1
L1,r-
Lreq
Lreq
aqClrK
aqClrKr (17)
From the above Eq. (17), it is possible to estimate the maximum exposure degree r by having
already calculated the free chloride concentration at the case of continuous exposure (r = 1) at the
designed service lifetime of L = 100 years, and knowing the ε, Keq, and [Cl-(aq)]sat values.
Following this procedure, the dependence of concrete cover c on maximum exposure degree r is
estimated and presented in Fig. 5. It is observed that for concrete cover c = 75 mm the maximum
exposure degree r equals 1 which means that even in this case of absence of protective coating a
full protection is ensured for 100 years. On the other hand, even in the case of zero concrete cover,
a maximum exposure degree r equals to 0.44 is estimated which means that if the coating
protection is at least secure for 56% of the whole period then no corrosion may occur. In the
following application intermediate cases are presented.
Application As the problem is independent of the number of repairs, any n can be selected, say n = 5, thus
in a designed service lifetime of 100 years, every 20 years a repair of asphalt membrane will take
place. Let us suppose that a mean concrete cover in a part of the structure is 30 mm. According to
Fig. 5, a maximum exposure degree of r = 0.57 is calculated. This means that the asphalt
membrane should be completely waterproof for at least (1-0.57). 20= 8.6 years within the 20-year
period. If n = 2 is selected, then the asphalt should be waterproof for 21.5 years in a 50-year
period.
210
Service life prediction of a reinforced concrete bridge exposed to chloride
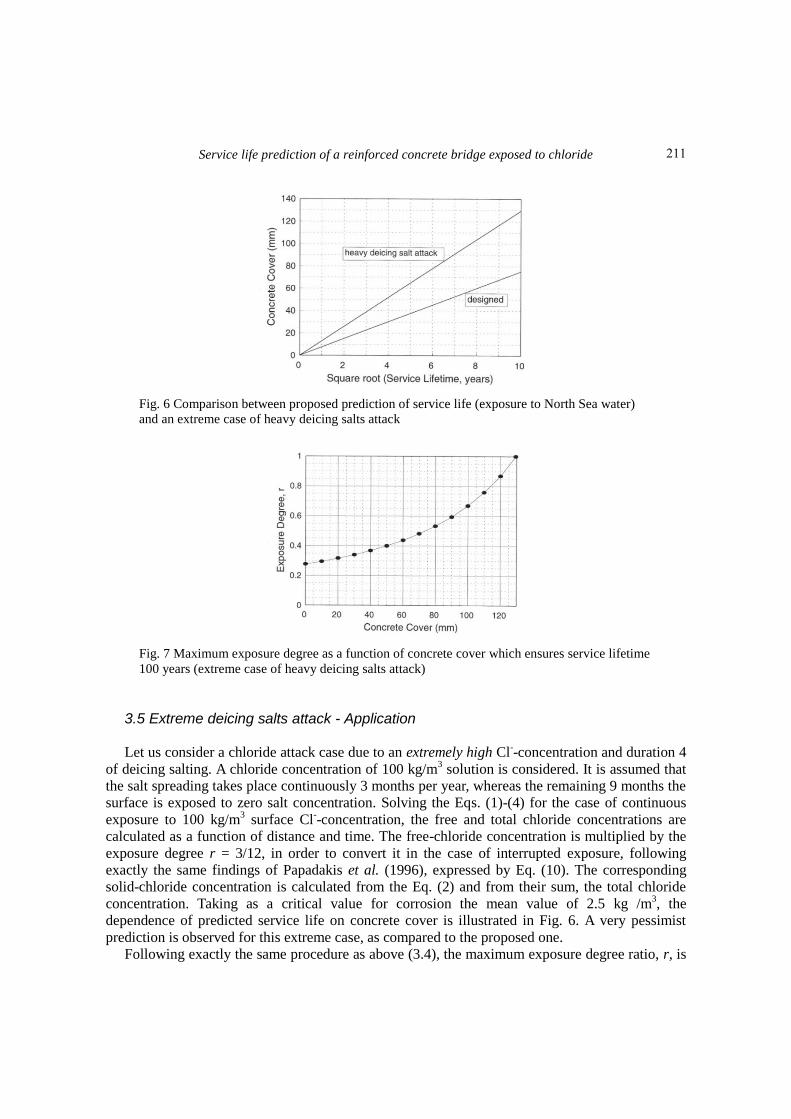
Fig. 6 Comparison between proposed prediction of service life (exposure to North Sea water)
and an extreme case of heavy deicing salts attack
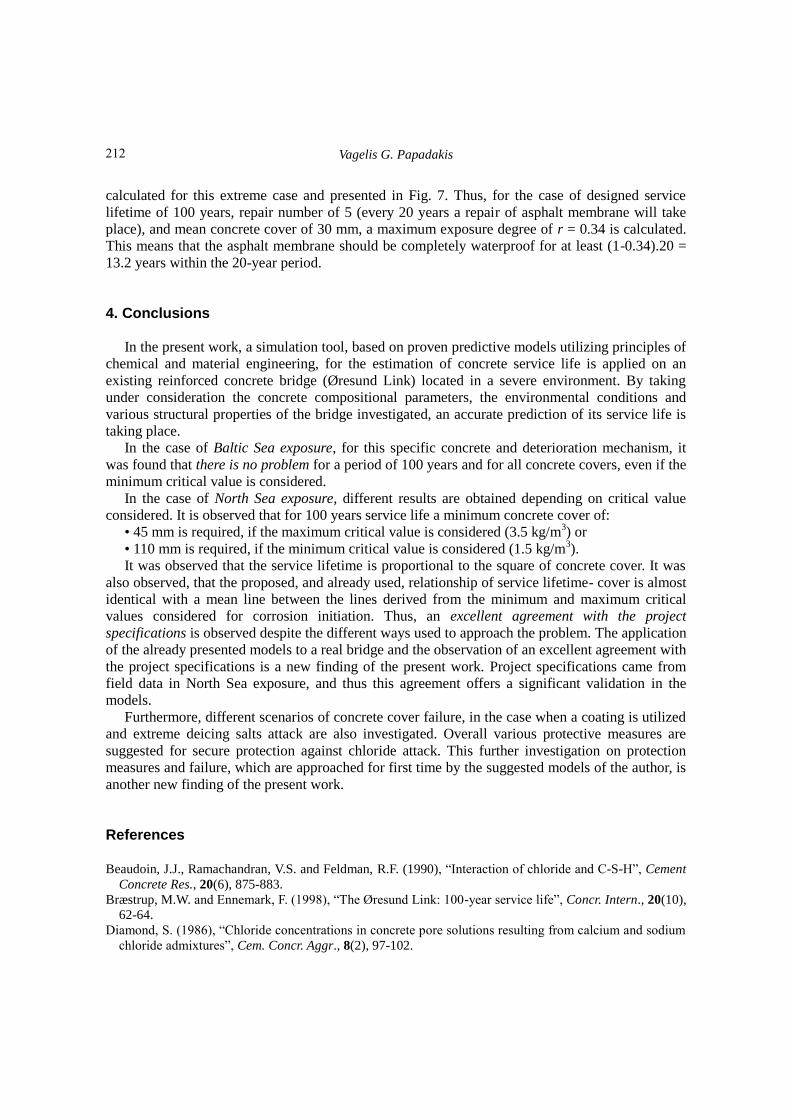
Fig. 7 Maximum exposure degree as a function of concrete cover which ensures service lifetime
100 years (extreme case of heavy deicing salts attack)
3.5 Extreme deicing salts attack - Application
Let us consider a chloride attack case due to an extremely high Cl--concentration and duration 4
of deicing salting. A chloride concentration of 100 kg/m3 solution is considered. It is assumed that
the salt spreading takes place continuously 3 months per year, whereas the remaining 9 months the
surface is exposed to zero salt concentration. Solving the Eqs. (1)-(4) for the case of continuous
exposure to 100 kg/m3 surface Cl
--concentration, the free and total chloride concentrations are
calculated as a function of distance and time. The free-chloride concentration is multiplied by the
exposure degree r = 3/12, in order to convert it in the case of interrupted exposure, following
exactly the same findings of Papadakis et al. (1996), expressed by Eq. (10). The corresponding
solid-chloride concentration is calculated from the Eq. (2) and from their sum, the total chloride
concentration. Taking as a critical value for corrosion the mean value of 2.5 kg /m3, the
dependence of predicted service life on concrete cover is illustrated in Fig. 6. A very pessimist
prediction is observed for this extreme case, as compared to the proposed one.
Following exactly the same procedure as above (3.4), the maximum exposure degree ratio, r, is
211
Vagelis G. Papadakis
calculated for this extreme case and presented in Fig. 7. Thus, for the case of designed service
lifetime of 100 years, repair number of 5 (every 20 years a repair of asphalt membrane will take
place), and mean concrete cover of 30 mm, a maximum exposure degree of r = 0.34 is calculated.
This means that the asphalt membrane should be completely waterproof for at least (1-0.34).20 =
13.2 years within the 20-year period.
4. Conclusions
In the present work, a simulation tool, based on proven predictive models utilizing principles of
chemical and material engineering, for the estimation of concrete service life is applied on an
existing reinforced concrete bridge (Ø resund Link) located in a severe environment. By taking
under consideration the concrete compositional parameters, the environmental conditions and
various structural properties of the bridge investigated, an accurate prediction of its service life is
taking place.
In the case of Baltic Sea exposure, for this specific concrete and deterioration mechanism, it
was found that there is no problem for a period of 100 years and for all concrete covers, even if the
minimum critical value is considered.
In the case of North Sea exposure, different results are obtained depending on critical value
considered. It is observed that for 100 years service life a minimum concrete cover of:
• 45 mm is required, if the maximum critical value is considered (3.5 kg/m3) or
• 110 mm is required, if the minimum critical value is considered (1.5 kg/m3).
It was observed that the service lifetime is proportional to the square of concrete cover. It was
also observed, that the proposed, and already used, relationship of service lifetime- cover is almost
identical with a mean line between the lines derived from the minimum and maximum critical
values considered for corrosion initiation. Thus, an excellent agreement with the project
specifications is observed despite the different ways used to approach the problem. The application
of the already presented models to a real bridge and the observation of an excellent agreement with
the project specifications is a new finding of the present work. Project specifications came from
field data in North Sea exposure, and thus this agreement offers a significant validation in the
models.
Furthermore, different scenarios of concrete cover failure, in the case when a coating is utilized
and extreme deicing salts attack are also investigated. Overall various protective measures are
suggested for secure protection against chloride attack. This further investigation on protection
measures and failure, which are approached for first time by the suggested models of the author, is
another new finding of the present work.
References
Beaudoin, J.J., Ramachandran, V.S. and Feldman, R.F. (1990), “Interaction of chloride and C-S-H”, Cement
Concrete Res., 20(6), 875-883.
Bræ strup, M.W. and Ennemark, F. (1998), “The Øresund Link: 100-year service life”, Concr. Intern., 20(10),
62-64.
Diamond, S. (1986), “Chloride concentrations in concrete pore solutions resulting from calcium and sodium
chloride admixtures”, Cem. Concr. Aggr., 8(2), 97-102.
212
Service life prediction of a reinforced concrete bridge exposed to chloride
Falbe-Hansen, K. and Munch-Petersen, C. (1998), “Concrete for the Øresund Bridge”, Concrete, 9(5-6), 29-
31.
Glasser, F.P., Marchand, J. and Samson, E. (2008), “Durability of concrete- Degradation phenomena
involving detrimental chemical reactions”, Cement Concrete Res., 38(2), 226-246.
Goñi, S. and Andrade, C. (1990), “Synthetic concrete pore solution chemistry and rebar corrosion rate in the
presence of chlorides”, Cement Concrete Res., 20(4), 525-539.
Hussain, S.E., Rasheeduzzafar, Al-Musallam, A., Al-Gahtani, A.S. and, Al-Gahtani, A.S. (1995), “Factors
affecting threshold chloride for reinforcement corrosion in concrete”, Cement Concrete Res., 25(7), 1543-
1555.
Mehta, P.K. and Monteiro, P.J.M. (2006), Concrete: Microstructure, Properties, and Materials, 3rd Ed.
McGraw- Hill, NY.
Munch-Petersen, C. (1998), “Danish concrete technology in action”, Concrete, 32(7), 13-14.
Ø resund Konsiortiet (1995), Chloride Penetration in Concrete, The Ø resund Link- Technical Note.
Papadakis, V.G., Fardis, M.N. and Vayenas, C.G. (1996), “Physicochemical processes and mathematical
modelling of concrete chlorination”, Chem. Eng. Sci., 51(4), 505-513.
Papadakis, V.G. (1999a), “Experimental investigation and theoretical modeling of silica fume activity in
concrete”, Cement Concrete Res., 29(1), 79-86.
Papadakis, V.G. (1999b), “Effect of fly ash on Portland cement systems. Part I: Low-calcium fly ash”
Cement Concrete Res., 29(11), 1727-1736.
Papadakis, V.G., Pedersen, E.J. and Lindgreen, H. (1999), “An AFM-SEM investigation of the effect of
silica fume and fly ash on cement paste microstructure”, J. Mater. Sie., 34(4), 683-690.
Papadakis, V.G. (2000), “Effect of supplementary cementing materials on concrete resistance against
carbonation and chloride ingress”, Cement Concrete Res., 30(2), 291-299.
Papadakis, V.G., Efstathiou, M.P. and Apostolopoulos, C.A. (2007), “Computer-aided approach of
parameters influencing concrete service life and field validation”, Comput. Concr., 4(1), 1-18.
Pereira, C.J. and Hegedus, L.L. (1984), “Diffusion and reaction of chloride ions in porous concrete”,
Proceedings of 8th International Symposium of Chemical Reaction Engineering, Edinburgh, UK.
Roy, D.M., Jiang, W. and Silsbee, M.R. (2000), “Chloride diffusion in ordinary, blended, and alkali-
activated cement pastes and its relation to other properties”, Cement Concrete Res., 30(12), 1879-1884.
Sandberg, P. (1998), Chloride Initiated Reinforcement Corrosion in Marine Concrete, Report TVBM-1015,
Lund Inst. of Tech., Div. Build. Mater., Lund, Sweden.
Sellevold, E.J. and Nilsen, T. (1987), “Condensed silica fume in concrete: A world review”, in
Supplementary Cementing Materials for Concrete, Ed. V.M. Malhotra, CANMET SP-86-8E, 165-243,
Ottawa, Canada.
Shi, X., Xie, N., Fortune, K. and Gong, J. (2012), “Durability of steel reinforced concrete in chloride
environments: An overview”, Constr. Build. Mater., 30, 125-138.
Suryavanshi, A.K., Scantlebury, J.D. and Lyon, S.B. (1996), “Mechanism of Friedel's salt formation in
cements rich in tri-calcium aluminate”, Cement Concrete Res., 26(5), 717-727.
Tang, L., Nilsson, L.-O. and Basheer, P.A.M. (2012), Resistance of Concrete to Chloride Ingress: Testing
and Modelling, Spon Press, NY.
Xu, J., Jiang, L., Wang, W. and Jiang, Y. (2011), “Influence of CaCl2 and NaCl from different sources on
chloride threshold value for the corrosion of steel reinforcement in concrete”, Constr. Build. Mater.,
25(2), 663-669.
Yong Ann, K. and Song H.W. (2007), “Chloride threshold level for corrosion of steel in concrete”,
Corrosion Science, 49(11), 4113-4133.
Zhang, T. and Gjørv, O.E. (1996), “Diffusion behavior of chloride ions in concrete”, Cement Concrete Res.,
26(6), 907-917.
213


![[Emmanuel P. Papadakis] Financial Justification of(Bookos.org)](https://img.pdfslide.net/doc/110x75/5695d0111a28ab9b0290caf0/emmanuel-p-papadakis-financial-justification-ofbookosorg.jpg)