Embed Size (px)
Citation preview

Trends in Chamber Operations 2017
ACCE’s 14th Annual Edition
Produced in part through generous support from

Chamber OperationsSurvey Report FY 2017
Fourteenth Annual Chamber Operations Survey
ACCE Chamber Operations Survey Report FY 2017

ACCE's 2017 Operations Survey Report
IntroductionOverview of the SurveyThis fourteenth annual ACCE Chamber Operations Survey continues to build on data collection from and about chambers of commerce. Statistics have been calculated from 252 chambers' 2017 program year data for the following areas:
• Organizational structure and function
• Governance
• Staffing
• Membership
• Finances
PurposeACCE strives to identify standards for statistics most chambers track in their organizations. The Chamber Operations Survey is conducted annually with questions carefully worded to ensure appropriate apples-to-apples comparisons.
Survey MethodsSurvey invitations were emailed to 1,257 chambers of commerce across the United States and Canada. All invitees are members of the Association of Chamber of Commerce Executives. The survey was administered online, and ACCE staff compiled data from survey questions completed as of March 30, 2018.
Respondent Profile252 chambers of commerce responded to the survey, approximately a 20% response rate.
• 73 respondents have annual total revenue of $450,000 and under
• 48 respondents have annual total revenue between $450,001 and $900,000
• 66 respondents have annual total revenue between $900,001 and $2,000,000
• 41 respondents have annual total revenue between $2,000,001 and $5,000,000
• 24 respondents have annual total revenue above $5,000,000
Most of the averages in this publication represent the median vs. the mean average used in prior years. The median average neutralizes outliers, whereas the mean average did not. Annual trend data in this publication will have a mix of mean averages for years 2012-2013 and median average for 2014-2017.
Contact ACCEQuestions? Contact us at [email protected]
ACCE Chamber Operations Survey Report FY 2017 | 3

ACCE's 2017 Operations Survey Report
Organizational Structure and Function1. Number of Chamber Mergers
2. Number of Major Functions Assumed by Another Organization
3. Chambers with or without CVB/ED
4. Comparison of Select Chamber Metrics by Structure and Function
Governance1. Voting Board Members on Board of Directors
2. Life, Emeritus, and Ex-Officio Board Members
3. Number of Executive Committee Members
4. Number of Times the Board Meets Annually
5. Number of Times the Executive Committee Meets Annually
Staffing1. Number of Members per FTE
(Full-Time Equivalent)
2. Revenue per FTE
3. Personnel Expense per FTE
4. Staff Turnover Rate
5. Employee Tenure in Years
Table of Contents
Membership1. Member Retention - Accounts
2. First Year Member Retention - Accounts
3. Member Retention - Dollars
4. Current Membership
5. Minimum Dues (Base Investment)
6. Market Penetration Rate
7. Chamber Members by Employee Size: Distribution by Chamber Members' Number of Employees
8. Revenue per Member
9. Member Dues Investment
10. Percentage of Canceled Members Due to Going Out of Business
11. Years Using a Tiered Dues Formula; and 11b. Change in Member Accounts by Number of Years Using a Tiered Dues Structure
Finance1. Breakdown of Total Revenue
2. Fundraising Revenue as a Percentage of Total Revenue
3. Expense per Member
4. Personnel as a Percentage of Total Expense
5. Breakdown as a Percentage of Total Expense
6. Number of Survey Participants in Percentage Range of Annual Expense Covered by Reserves
7. Net Assets
8. Net Assets as a Percentage of Annual Expenses
9. Chambers with a 501c(3) Foundation
ACCE Chamber Operations Survey Report FY 2017 | 4

Number of Respondents
n Category 1: $450,000 and under
n Category 2: $450,001 - $900,000
n Category 3: $900,001 - $2 million
n Category 4: $2,000,001 - $5 million
n Category 5: above $5 million
29%
19%
26%
16%
10%Category 1:
$450,000 and under
Category 5: above
$5 million
Category 2: $450,001 - $900,000
Category 3: $900,001 - $2 million
Category 4: $2 million - $5 million
Breakdown by percentage of total respondents. Where 252 respondents equals 100%, each category size below is shown as a percentage of the total.
ACCE's 2017 Operations Survey Report
158
47 26 21
0
50
100
150
200
Chamber Only Chamber and Economic Development Chamber and CVB Chamber, Economic Development &CVB
Organizational function(s) and the corresponding number of survey respondents with those functions.
ACCE Chamber Operations Survey Report FY 2017 | 5

Total Annual Revenue Categories
n Category 1: $450,000 and under
n Category 2: $450,001 - $900,000
n Category 3: $900,001 - $2 million
n Category 4: $2,000,001 - $5 million
n Category 5: above $5 million
ACCE's 2017 Operations Survey Report
Organizational Structure and Function1. Total Number of Chamber Mergers
Survey Question: Has your chamber merged with another organization in your region
(e.g., a merger of ED and chamber or multiple chamber merger) in fiscal year 2017?
2. Total Number of Major Functions Assumed by Another Organization
Survey Question: Has your chamber lost any major organizational functions to another organization in your region (e.g., a separation of ED and chamber and tourism) in fiscal year 2017?
4
3
2
1
00
1
2
3
4
5
Category 1:$450,000 and under
Category 2:$450,001 - $900,000
Category 3:$900,001 - $2 million
Category 4:$2,000,001 - $5 million
Category 5:above $5 million
3
0
2
0
1
0
1
2
3
4
Category 1:$450,000 and under
Category 2:$450,001 - $900,000
Category 3:$900,001 - $2 million
Category 4:$2,000,001 - $5 million
Category 5:above $5 million
ACCE Chamber Operations Survey Report FY 2017 | 6

Total Annual Revenue Categories
n Category 1: $450,000 and under
n Category 2: $450,001 - $900,000
n Category 3: $900,001 - $2 million
n Category 4: $2,000,001 - $5 million
n Category 5: above $5 million
ACCE's 2017 Operations Survey Report
Organizational Structure and Function
3. Chambers with or without CVB/ED
Survey Question: If your chamber is NOT responsible for primary functions of Economic Development (ED) and/or Convention and Visitor's Bureau (CVB), choose
"Chamber of Commerce." If your chamber is responsible for ED primary functions, choose "Chamber and ED." If your chamber is responsible for CVB functions (but not
ED), choose "Chamber and Convention and Visitor's Bureau (CVB)." Otherwise, if your chamber is responsible for BOTH CVB and ED primary functions, choose the
"Chamber, CVB and ED" option.
78%
7%
15%
0%
75%
10%
6%8%
62%
17%
11% 11%
37%41%
10%12%
38% 38%
4%
21%
0%
10%
20%
30%
40%
50%
60%
70%
80%
90%
Chamber Only Chamber with ED Chamber with CVB Chamber with ED and CVB
ACCE Chamber Operations Survey Report FY 2017 | 7
Count
Average
Net Income
Average
Net Assets
Average Net
Assets as a
Percentage
of Total
Annual
Expenses
Average
Member
Retention Rate
- Dollars
Average
Member
Retention Rate
- Accounts
Average
Revenue per
Member
Average
Unrestricted
Revenue per
Member
Average
Unrestricted
Revenue per
FTE
Average
Revenue per
FTE
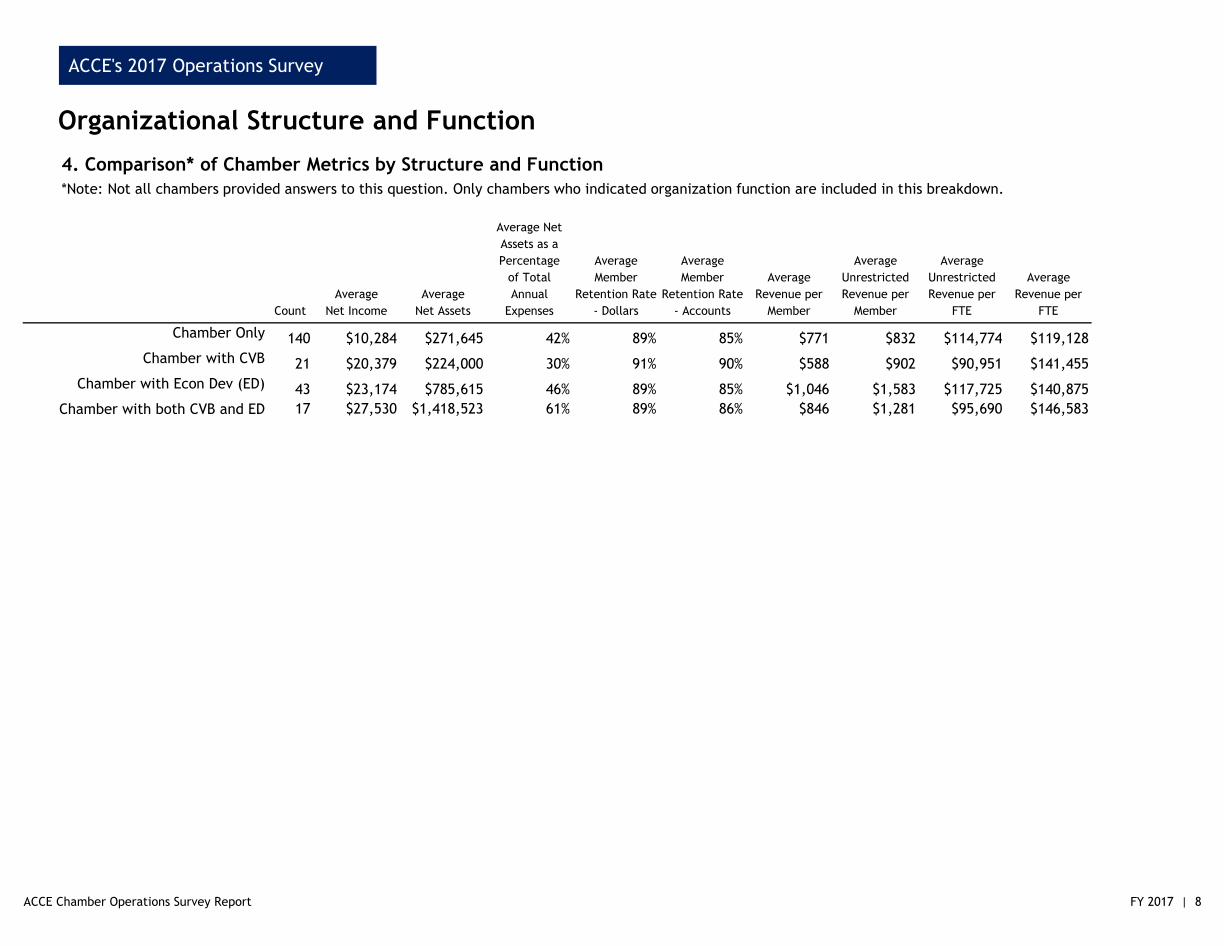
Chamber Only 140 $10,284 $271,645 42% 89% 85% $771 $832 $114,774 $119,128
Chamber with CVB 21 $20,379 $224,000 30% 91% 90% $588 $902 $90,951 $141,455
Chamber with Econ Dev (ED) 43 $23,174 $785,615 46% 89% 85% $1,046 $1,583 $117,725 $140,875
Chamber with both CVB and ED 17 $27,530 $1,418,523 61% 89% 86% $846 $1,281 $95,690 $146,583
ACCE's 2017 Operations Survey
Organizational Structure and Function
4. Comparison* of Chamber Metrics by Structure and Function
*Note: Not all chambers provided answers to this question. Only chambers who indicated organization function are included in this breakdown.
ACCE Chamber Operations Survey Report FY 2017 | 8
Total Annual Revenue Categories
n Category 1: $450,000 and under
n Category 2: $450,001 - $900,000
n Category 3: $900,001 - $2 million
n Category 4: $2,000,001 - $5 million
n Category 5: above $5 million
ACCE's 2017 Operations Survey Report
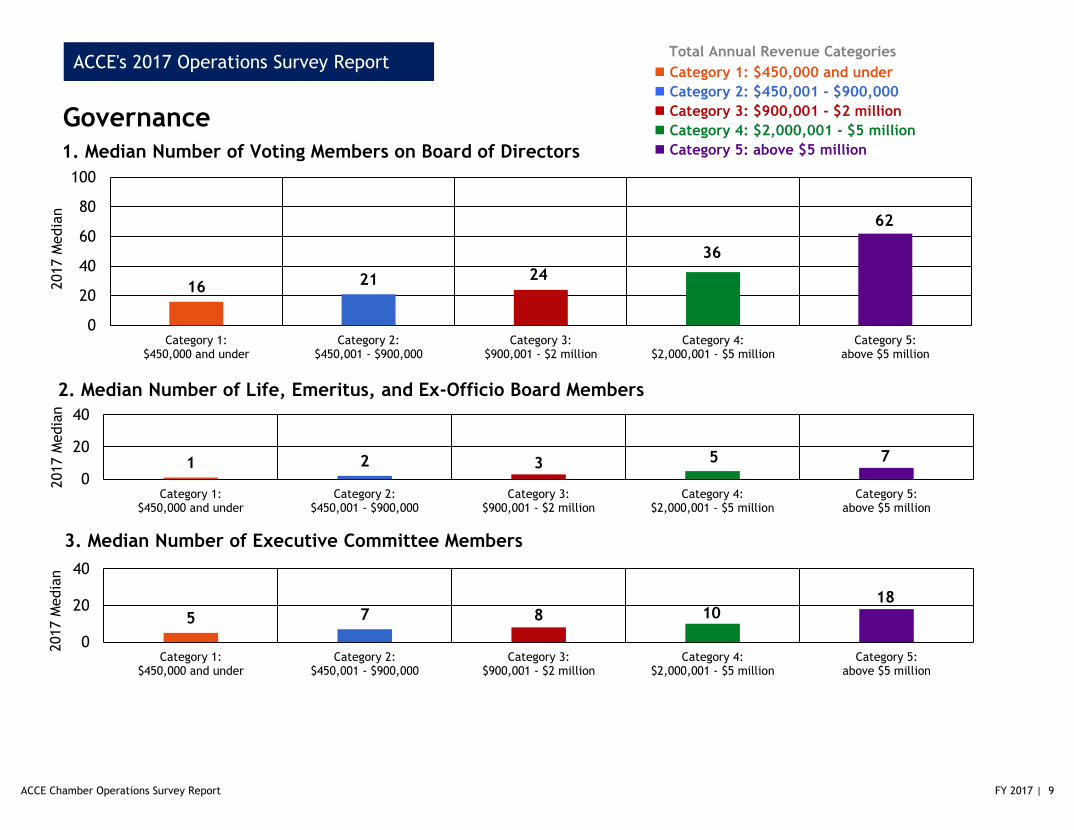
Governance1. Median Number of Voting Members on Board of Directors
16 21 24
36
62
0
20
40
60
80
100
Category 1:$450,000 and under
Category 2:$450,001 - $900,000
Category 3:$900,001 - $2 million
Category 4:$2,000,001 - $5 million
Category 5:above $5 million
2. Median Number of Life, Emeritus, and Ex-Officio Board Members
1 2 3 5 7
0
20
40
Category 1:$450,000 and under
Category 2:$450,001 - $900,000
Category 3:$900,001 - $2 million
Category 4:$2,000,001 - $5 million
Category 5:above $5 million
3. Median Number of Executive Committee Members
2017 M
edia
n2017 M
edia
n
5 7 8 1018
0
20
40
Category 1:$450,000 and under
Category 2:$450,001 - $900,000
Category 3:$900,001 - $2 million
Category 4:$2,000,001 - $5 million
Category 5:above $5 million
2017
Media
n
ACCE Chamber Operations Survey Report FY 2017 | 9

Total Annual Revenue Categories
n Category 1: $450,000 and under
n Category 2: $450,001 - $900,000
n Category 3: $900,001 - $2 million
n Category 4: $2,000,001 - $5 million
n Category 5: above $5 million
ACCE's 2017 Operations Survey Report
Governance
4. Median Number of Times the Board Meets Annually
11 12 1010 6
0
20
40
Category 1:$450,000 and under
Category 2:$450,001 - $900,000
Category 3:$900,001 - $2 million
Category 4:$2,000,001 - $5 million
Category 5:above $5 million
11 12 12 12
7
0
20
40
Category 1:$450,000 and under
Category 2:$450,001 - $900,000
Category 3:$900,001 - $2 million
Category 4:$2,000,001 - $5 million
Category 5:above $5 million
2017
Media
n2017
Media
n
5. Median Number of Times the Executive Committee Meets Annually
ACCE Chamber Operations Survey Report FY 2017 | 10

Total Annual Revenue Categories
n Category 1: $450,000 and under
n Category 2: $450,001 - $900,000
n Category 3: $900,001 - $2 million
n Category 4: $2,000,001 - $5 million
n Category 5: above $5 million
ACCE's 2017 Operations Survey Report
Staffing1. Average Number of Members per FTE (Full-Time Equivalent)
Calculation: average of (number of memberships divided by number of full-time staff equivalents)
2014-17 is a median average, 2012-13 represent the mean average
166 165 165160
152145
143140
132139
128123
108114
103
111 115109
85 8578 78 75 75
67 70
5055 52
48
0
20
40
60
80
100
120
140
160
180
2012 2013 2014 2015 2016 2017
Num
ber
of
Mem
bers
ACCE Chamber Operations Survey Report FY 2017 | 11

Total Annual Revenue Categories
n Category 1: $450,000 and under
n Category 2: $450,001 - $900,000
n Category 3: $900,001 - $2 million
n Category 4: $2,000,001 - $5 million
n Category 5: above $5 million
ACCE's 2017 Operations Survey Report
Staffing2. Average Revenue per FTE
Calculation: average of (total revenue divided by number of full-time staff equivalents)
2014-17 is a median average, 2012-13 represent the mean average
Revenue in D
ollars
$94,737$92,171
$96,667$101,333
$96,202
$94,141
$124,575 $125,790 $122,358
$122,159$117,196
$113,083
$148,036 $147,063
$135,024
$136,911
$139,818
$146,114
$178,934
$166,264$154,967
$164,892
$162,729 $160,912
$263,192
$227,745
$183,488$194,896
$204,014$208,521
$50,000
$100,000
$150,000
$200,000
$250,000
$300,000
2012 2013 2014 2015 2016 2017
ACCE Chamber Operations Survey Report FY 2017 | 12

Total Annual Revenue Categories
n Category 1: $450,000 and under
n Category 2: $450,001 - $900,000
n Category 3: $900,001 - $2 million
n Category 4: $2,000,001 - $5 million
n Category 5: above $5 million
ACCE's 2017 Operations Survey Report
Staffing
Pers
onnel Expense
in D
ollars
3. Average Personnel Expense per FTE Calculation: average of (personnel expense divided by number of full-time staff)
2014-17 is a median average, 2012-13 represent the mean average
$51,865 $52,056$50,000
$52,000$51,595 $50,061
$58,070$58,835
$61,993
$58,857 $59,775 $58,940
$64,794 $64,521
$69,959
$67,330$69,678
$72,542
$76,417 $75,078$78,163
$77,626$80,224
$80,435
$87,928
$91,139 $92,105
$89,634
$85,938
$99,414
$40,000
$45,000
$50,000
$55,000
$60,000
$65,000
$70,000
$75,000
$80,000
$85,000
$90,000
$95,000
$100,000
$105,000
2012 2013 2014 2015 2016 2017
ACCE Chamber Operations Survey Report FY 2017 | 13

Total Annual Revenue Categories
n Category 1: $450,000 and under
n Category 2: $450,001 - $900,000
n Category 3: $900,001 - $2 million
n Category 4: $2,000,001 - $5 million
n Category 5: above $5 million
ACCE's 2017 Operations Survey Report
Staffing4. Average Staff Turnover Rate
Calculation: (number of employees at the end of fiscal year 2016 minus number of those still employed
at the end of fiscal year 2017) divided by the number of employees at the end of fiscal year 2016
0% 1%10%
20%13%
0%
20%
40%
60%
80%
100%
Category 1:$450,000 and under
Category 2:$450,001 - $900,000
Category 3:$900,001 - $2 million
Category 4:$2,000,001 - $5 million
Category 5:above $5 million
2017 M
edia
n
5. Average Employee Tenure in YearsCalculation: (total number of years each current employee has worked for the organization)
divided by the number of current employees
5 5 6 6 8
0
20
40
Category 1:$450,000 and under
Category 2:$450,001 - $900,000
Category 3:$900,001 - $2 million
Category 4:$2,000,001 - $5 million
Category 5:above $5 million
2017
Media
n
ACCE Chamber Operations Survey Report FY 2017 | 14

Total Annual Revenue Categories
n Category 1: $450,000 and under
n Category 2: $450,001 - $900,000
n Category 3: $900,001 - $2 million
n Category 4: $2,000,001 - $5 million
n Category 5: above $5 million
ACCE's 2017 Operations Survey Report
Membership1a. Average Member Retention - Accounts
This chart shows annual member retention of accounts percentages, calculated as follows, with 2017 as an example: (number
of 2016 membership accounts minus number of cancellations in 2017), divided by the number of 2016 membership accounts.
2014-17 is a median average, 2012-13 represent the mean average
Perc
enta
ge o
f Reta
ined A
ccounts
87% 87% 87%
89%
88%
87%
85%
86% 86% 87%
88%
85%
85%
84%
86%
88%
85%
8…
84%
85%85%
85%
86%87%
84%
81%
85%
83%83%
85%
78%
80%
82%
84%
86%
88%
90%
2012 2013 2014 2015 2016 2017
87%
85%
ACCE Chamber Operations Survey Report FY 2017 | 15
Total Annual Revenue Categories
n Category 1: $450,000 and under
n Category 2: $450,001 - $900,000
n Category 3: $900,001 - $2 million
n Category 4: $2,000,001 - $5 million
n Category 5: above $5 million
ACCE's 2017 Operations Survey Report
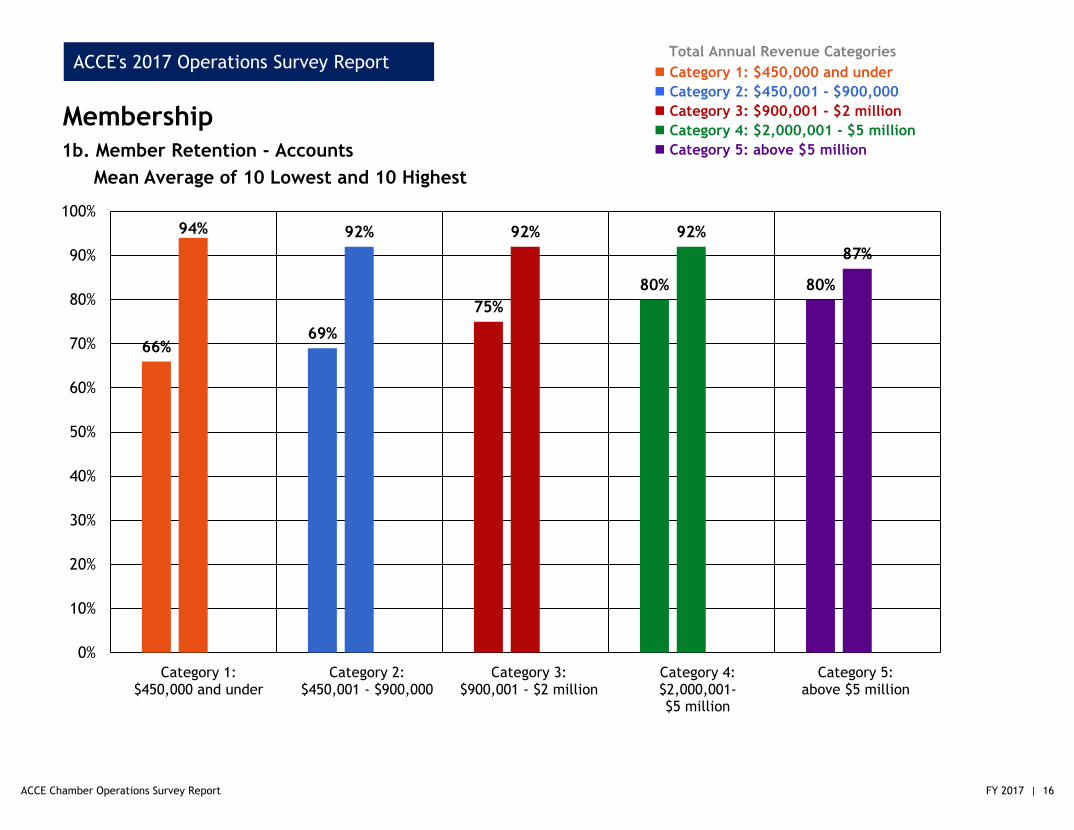
Membership
1b. Member Retention - Accounts
Mean Average of 10 Lowest and 10 Highest
66%69%
75%
80% 80%
94% 92% 92% 92%
87%
0%
10%
20%
30%
40%
50%
60%
70%
80%
90%
100%
Category 1: $450,000 and under
Category 2: $450,001 - $900,000
Category 3: $900,001 - $2 million
Category 4: $2,000,001-$5 million
Category 5: above $5 million
ACCE Chamber Operations Survey Report FY 2017 | 16

Total Annual Revenue Categories
n Category 1: $450,000 and under
n Category 2: $450,001 - $900,000
n Category 3: $900,001 - $2 million
n Category 4: $2,000,001 - $5 million
n Category 5: above $5 million
ACCE's 2017 Operations Survey Report
Membership
2a. Average First Year Member Retention - AccountsThis chart shows first year member retention of accounts percentages, calculated as follows, with 2017 as
an example: (number of 2016 new member accounts minus number of new member cancellations in 2017)
divided by the number of 2016 new member accounts.
2014-17 is a median average, 2012-13 represent the mean average
78%
69%
78%
87%84%
84%
71% 72% 75%
73% 75% 77%
68%
62%
67%
71%70%
63%66%61%
64%
66%
66%
68%
66%
48%
67%
65%
59%
69%
40%
50%
60%
70%
80%
90%
2012 2013 2014 2015 2016 2017
Perc
enta
ge o
f Reta
ined F
irst
Year
Accounts
ACCE Chamber Operations Survey Report FY 2017 | 17

Total Annual Revenue Categories
n Category 1: $450,000 and under
n Category 2: $450,001 - $900,000
n Category 3: $900,001 - $2 million
n Category 4: $2,000,001 - $5 million
n Category 5: above $5 million
44%
49%
41%
55%
57%
96%
89% 88% 88%
79%
0%
10%
20%
30%
40%
50%
60%
70%
80%
90%
100%
ACCE's 2017 Operations Survey Report
Membership
2b. Average First Year Member Retention - Accounts
Mean Average of 10 Lowest and 10 Highest
Category 1: $450,000 and under
Category 2: $450,001 - $900,000
Category 3: $900,001 - $2 million
Category 4: $2,000,001 -$5 million
Category 5: above $5 million
ACCE Chamber Operations Survey Report FY 2017 | 18

Total Annual Revenue Categories
n Category 1: $450,000 and under
n Category 2: $450,001 - $900,000
n Category 3: $900,001 - $2 million
n Category 4: $2,000,001 - $5 million
n Category 5: above $5 million
ACCE's 2017 Operations Survey Report
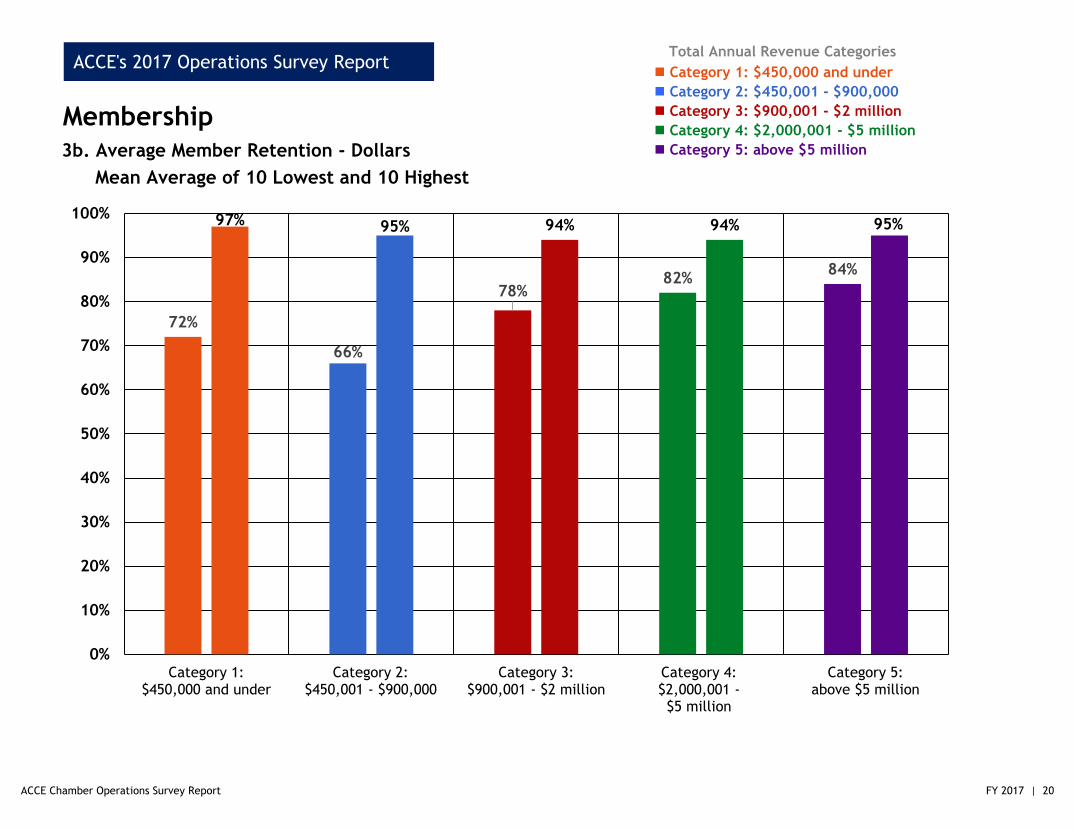
Membership
3a. Average Member Retention - Dollars
This chart shows the percentage of retained dues dollars year to year, calculated as follows with 2017 as an example:
(dues of 2016 memberships minus dues of canceled members in 2017) divided by dues of 2016 memberships.
2014-17 is a median average, 2012-13 represent the mean average
88%
88%
91% 91%
90%
89%
87%88% 88%
87%
88%
86%
89% 89%
88%
90%
89%
88%
88% 88%
90% 90%
89%
91%
90%
89% 90%
87%
89%
87%
82%
83%
84%
85%
86%
87%
88%
89%
90%
91%
92%
2012 2013 2014 2015 2016 2017
Perc
enta
ge o
f D
ollars
Reta
ined
ACCE Chamber Operations Survey Report FY 2017 | 19
Total Annual Revenue Categories
n Category 1: $450,000 and under
n Category 2: $450,001 - $900,000
n Category 3: $900,001 - $2 million
n Category 4: $2,000,001 - $5 million
n Category 5: above $5 million
72%
66%
78%82%
84%
97% 95% 94% 94% 95%
0%
10%
20%
30%
40%
50%
60%
70%
80%
90%
100%
ACCE's 2017 Operations Survey Report
Membership
3b. Average Member Retention - Dollars
Mean Average of 10 Lowest and 10 Highest
Category 1: $450,000 and under
Category 2: $450,001 - $900,000
Category 3: $900,001 - $2 million
Category 4: $2,000,001 -$5 million
Category 5: above $5 million
ACCE Chamber Operations Survey Report FY 2017 | 20
Total Annual Revenue Categories
n Category 1: $450,000 and under
n Category 2: $450,001 - $900,000
n Category 3: $900,001 - $2 million
n Category 4: $2,000,001 - $5 million
n Category 5: above $5 million
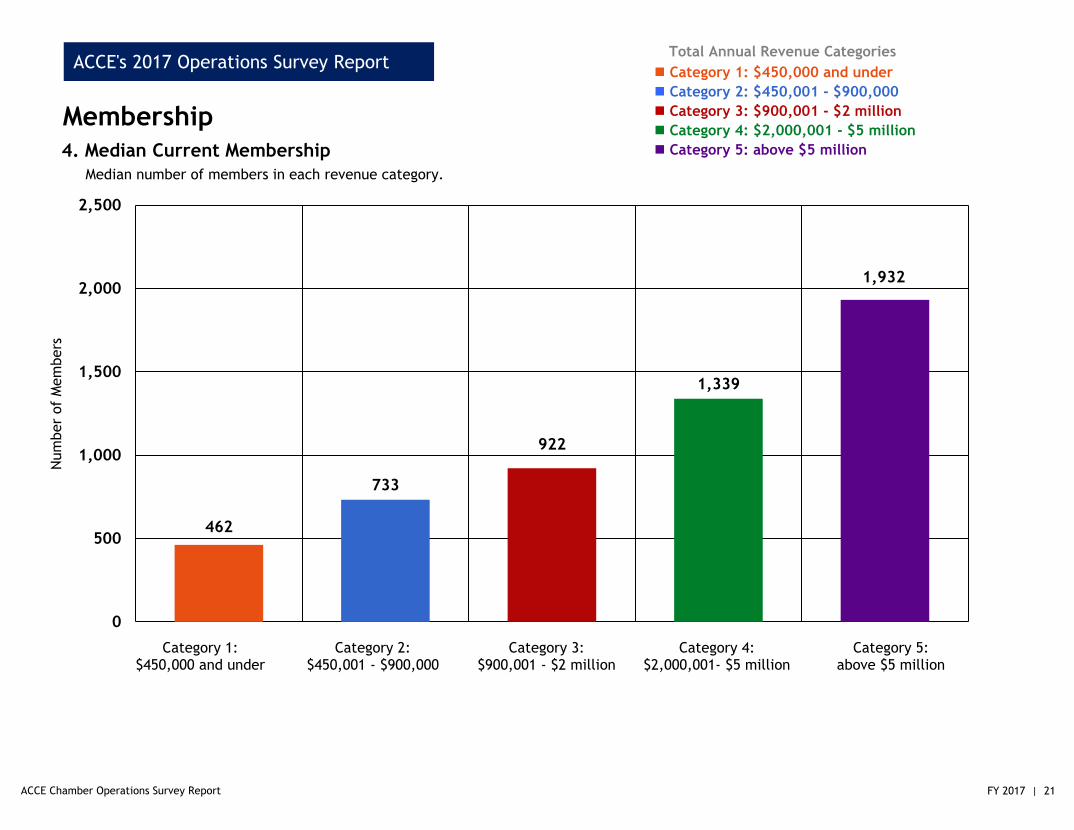
462
733
922
1,339
1,932
0
500
1,000
1,500
2,000
2,500
ACCE's 2017 Operations Survey Report
Membership
4. Median Current Membership
Median number of members in each revenue category.
Category 1: $450,000 and under
Category 2: $450,001 - $900,000
Category 3: $900,001 - $2 million
Category 4: $2,000,001- $5 million
Category 5: above $5 million
Num
ber
of
Mem
bers
ACCE Chamber Operations Survey Report FY 2017 | 21

Total Annual Revenue Categories
n Category 1: $450,000 and under
n Category 2: $450,001 - $900,000
n Category 3: $900,001 - $2 million
n Category 4: $2,000,001 - $5 million
n Category 5: above $5 million
$250
$298
$348
$393
$465
$0
$50
$100
$150
$200
$250
$300
$350
$400
$450
$500
ACCE's 2017 Operations Survey Report
Minimum Dues4. Median Minimum Dues
Median chamber membership minimum dues in each revenue category.
Category 1: $450,000 and under
Category 2: $450,001 - $900,000
Category 3: $900,001 - $2 million
Category 4: $2,000,001- $5 million
Category 5: above $5 million
Min
imum
Dues
ACCE Chamber Operations Survey Report FY 2017 | 22

Total Annual Revenue Categories
n Category 1: $450,000 and under
n Category 2: $450,001 - $900,000
n Category 3: $900,001 - $2 million
n Category 4: $2,000,001 - $5 million
n Category 5: above $5 million
34%
28%
25%
23%
29% 30%
27%
23%
19%
17%
20%
18%
22%20%
17%
19%
18%
13%13%
15%15%
14%
15%
11%
8% 8%
5%6% 6%
8%
0%
5%
10%
15%
20%
25%
30%
35%
40%
2012 2013 2014 2015 2016 2017
ACCE's 2017 Operations Survey Report
Membership
5. Market Penetration Rate
Calculation: average of (number of chamber members divided by the total number of businesses in the service area)
2014-17 is a median average, 2012-13 represent the mean average
Perc
enta
ge o
f M
ark
et
Penetr
ati
on
ACCE Chamber Operations Survey Report FY 2017 | 23

Total Annual Revenue Categories
n Category 1: $450,000 and under
n Category 2: $450,001 - $900,000
n Category 3: $900,001 - $2 million
n Category 4: $2,000,001 - $5 million
n Category 5: above $5 million
ACCE's 2017 Operations Survey Report
Membership7. Chamber Members by Employee Size: Distribution by Chamber Members' Number of Employees
Survey question: Enter the percentage of chamber members based on number of employees.
35%
28%
16%
9%
12%
35%
25%15%
11%
14%
42%
26%
14%
9%
9%
47%
25%
11%
8%
9%
50%
19%
13%
9%
9%
over 100employees
1-5 employees
6-20employees
21-50employees
51-100 employees
1-5 employees
over 100employees
6-20 employees
21-50 employees
51-100 employees
1-5 employees
over 100employees
6-20 employees
21-50 employees
51-100 employees
1-5 employees
over 100employees
6-20 employees
26-50 employees
51-100 employees
1-5 employees
over 100employees
6-20 employees
21-50 employees
51-100 employees
ACCE Chamber Operations Survey Report FY 2017 | 24

Total Annual Revenue Categories
n Category 1: $450,000 and under
n Category 2: $450,001 - $900,000
n Category 3: $900,001 - $2 million
n Category 4: $2,000,001 - $5 million
n Category 5: above $5 million
ACCE's 2017 Operations Survey Report
Membership
8a. Average Revenue per Member
Calculation: average of (total revenue divided by total number of members)
2014-17 is a median average, 2012-13 represent the mean average
Dollars
$633 $606 $581 $635 $643 $627
$917 $947 $894 $875 $880 $900
$1,663$1,419
$1,239 $1,225 $1,177 $1,267
$2,385
$2,163 $2,084 $2,007$1,915
$2,110
$4,786
$3,919
$3,719$3,352 $3,571
$3,307
$0
$500
$1,000
$1,500
$2,000
$2,500
$3,000
$3,500
$4,000
$4,500
$5,000
2012 2013 2014 2015 2016 2017
ACCE Chamber Operations Survey Report FY 2017 | 25

Total Annual Revenue Categories
n Category 1: $450,000 and under
n Category 2: $450,001 - $900,000
n Category 3: $900,001 - $2 million
n Category 4: $2,000,001 - $5 million
n Category 5: above $5 million
$358$570
$828
$1,405
$2,431
$1,068
$1,504
$2,236
$3,997
$6,139
$0
$1,000
$2,000
$3,000
$4,000
$5,000
$6,000
$7,000
ACCE's 2017 Operations Survey Report
Membership
8b. Average Revenue per Member
Mean Average of 10 Lowest and 10 Highest
Category 1: $450,000 and under
Category 2: $450,001 - $900,000
Category 3: $900,001 - $2 million
Category 4: $2,000,001 - $5
million
Category 5: above $5 million
ACCE Chamber Operations Survey Report FY 2017 | 26

Total Annual Revenue Categories
n Category 1: $450,000 and under
n Category 2: $450,001 - $900,000
n Category 3: $900,001 - $2 million
n Category 4: $2,000,001 - $5 million
n Category 5: above $5 million
ACCE's 2017 Operations Survey Report
Membership
9a. Average Member Dues Investment
Calculation: average of (total dollar value of member accounts divided by total number of member accounts)
2014-17 is a median average, 2012-13 represent the mean average
$293 $276 $281$315
$293$273
$366 $398 $391$357 $372
$408
$569
$521$488 $487 $491
$512
$825
$702
$577 $569 $597
$670
$1,144 $1,123
$999 $973 $984$959
$0
$200
$400
$600
$800
$1,000
$1,200
2012 2013 2014 2015 2016 2017
Dollars
ACCE Chamber Operations Survey Report FY 2017 | 27

Total Annual Revenue Categories
n Category 1: $450,000 and under
n Category 2: $450,001 - $900,000
n Category 3: $900,001 - $2 million
n Category 4: $2,000,001 - $5 million
n Category 5: above $5 million
$174$279 $310
$406
$650
$483
$632
$880
$1,719
$2,070
$0
$500
$1,000
$1,500
$2,000
$2,500
ACCE's 2017 Operations Survey Report
Membership
9b. Average Member Dues Investment
Mean Average of 10 Lowest and 10 Highest
Category 1: $450,000 and under
Category 2: $450,001 - $900,000
Category 3: $900,001 - $2 million
Category 4: $2,000,001 -$5 million
Category 5: above $5 million
ACCE Chamber Operations Survey Report FY 2017 | 28
Total Annual Revenue Categories
n Category 1: $450,000 and under
n Category 2: $450,001 - $900,000
n Category 3: $900,001 - $2 million
n Category 4: $2,000,001 - $5 million
n Category 5: above $5 million
ACCE's 2017 Operations Survey Report
Membership
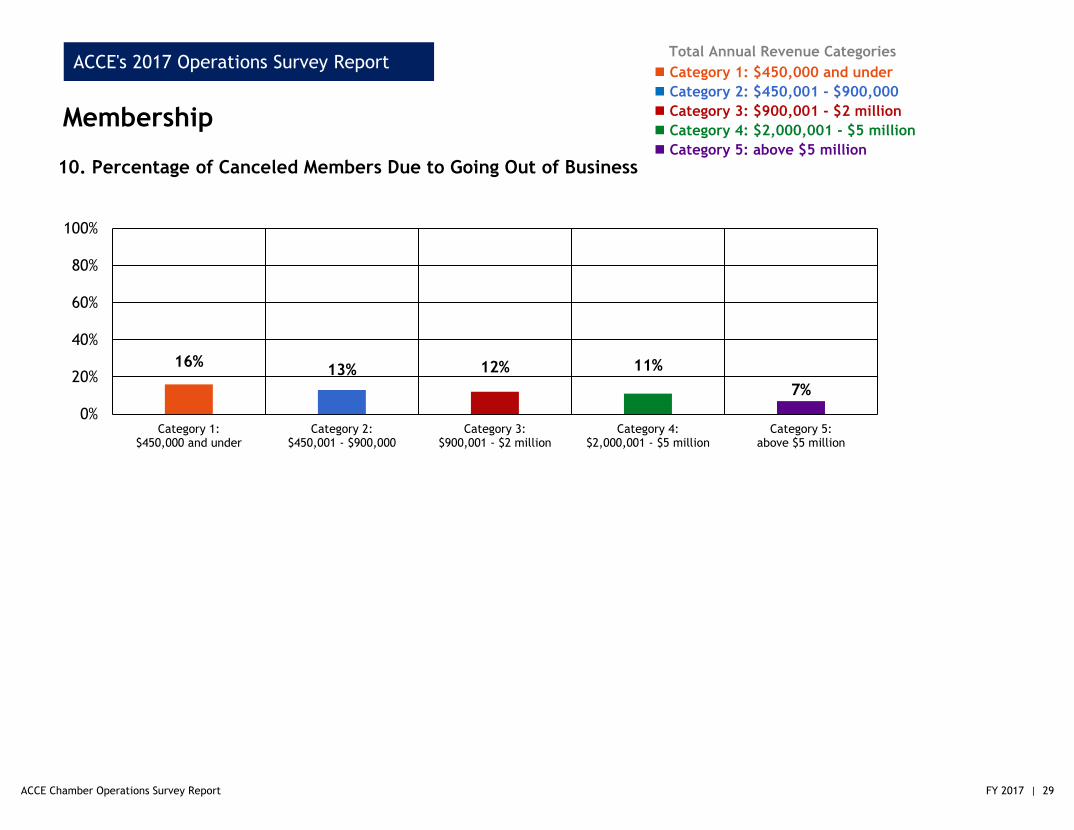
16%13% 12% 11%
7%
0%
20%
40%
60%
80%
100%
Category 1:$450,000 and under
Category 2:$450,001 - $900,000
Category 3:$900,001 - $2 million
Category 4:$2,000,001 - $5 million
Category 5:above $5 million
10. Percentage of Canceled Members Due to Going Out of Business
ACCE Chamber Operations Survey Report FY 2017 | 29
Total Annual Revenue Categories
n Category 1: $450,000 and under
n Category 2: $450,001 - $900,000
n Category 3: $900,001 - $2 million
n Category 4: $2,000,001 - $5 million
n Category 5: above $5 million
ACCE's 2017 Operations Survey Report
Membership
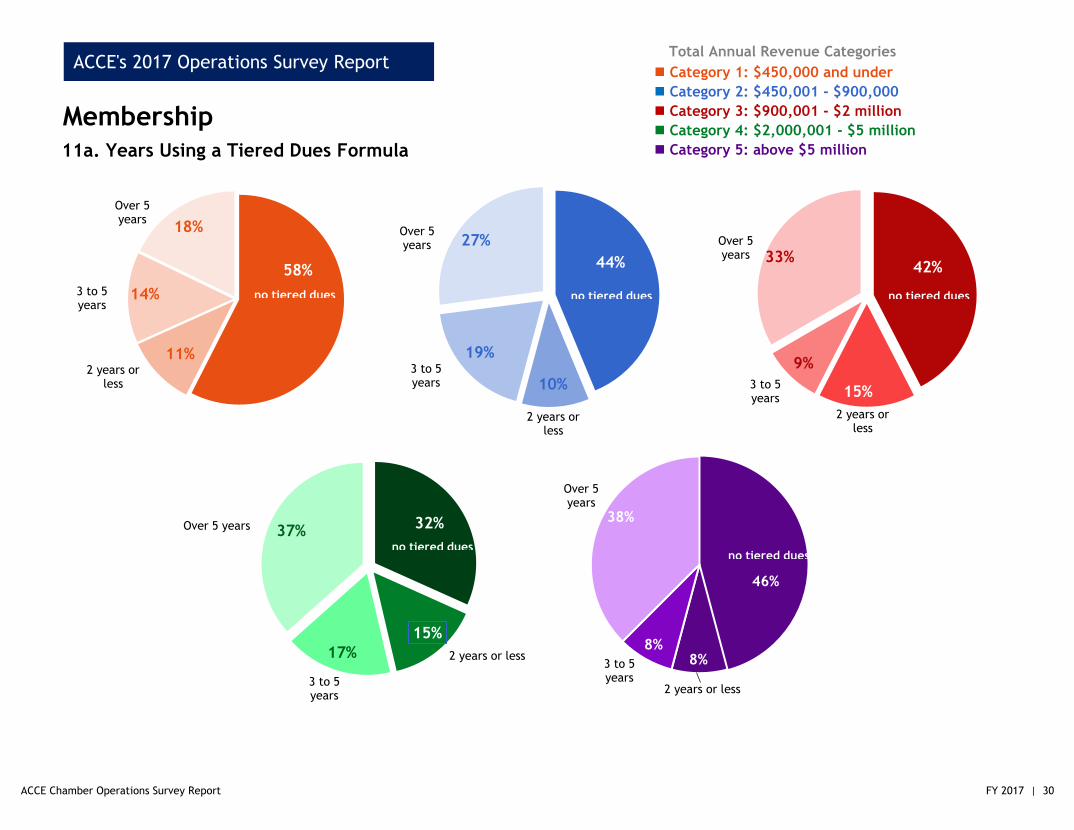
11a. Years Using a Tiered Dues Formula
46%
8%8%
38%32%
15%
17%
37%
42%
15%
9%
33%44%
10%
19%
27%
58%
11%
14%
18%
no tiered dues
Over 5 years
3 to 5 years
2 years or less
no tiered dues
Over 5 years
3 to 5 years
2 years or less
no tiered dues
Over 5 years
3 to 5 years
2 years or less
no tiered dues
Over 5 years
3 to 5 years
2 years or less
no tiered dues
3 to 5 years
Over 5 years
2 years or less
ACCE Chamber Operations Survey Report FY 2017 | 30

Total Annual Revenue Categories
n Category 1: $450,000 and under
n Category 2: $450,001 - $900,000
n Category 3: $900,001 - $2 million
n Category 4: $2,000,001 - $5 million
n Category 5: above $5 million
ACCE's 2017 Operations Survey Report
Membership
11b. Change in member accounts over time by number of years using a tiered dues structureThe chart displays the number of chambers showing an increase vs. a decrease in number of members after implementing
tiered dues.
2 years or less (1 no impact) 3 to 5 years (6 no impact) over 5 years (11 no impact)
increased 8 12 28
decreased -5 -8 -4
8
12
28
-5
-8
-4
-10
-5
0
5
10
15
20
25
30
Num
ber
Report
ing D
ecre
ase
d v
s In
cre
ase
d Im
pact
ACCE Chamber Operations Survey Report FY 2017 | 31

Total Annual Revenue Categories
n Category 1: $450,000 and under
n Category 2: $450,001 - $900,000
n Category 3: $900,001 - $2 million
n Category 4: $2,000,001 - $5 million
n Category 5: above $5 million
ACCE's 2017 Operations Survey Report
Dues Impact11c. Change in member dues over time by number of years
using a tiered dues structureDisplays the number of chambers showing an increase vs. a decrease in member dues after implementing tiered dues.
2 years or less (1 no impact) 3 to 5 years (2 no impact) over 5 years (4 no impact)
increased 19 26 44
decreased -2 -2 -3
19
26
44
-2 -2-3
-10
0
10
20
30
40
50
Num
ber
Report
ing D
ecre
ase
d v
s In
cre
ase
d Im
pact
ACCE Chamber Operations Survey Report FY 2017 | 32
Total Annual Revenue Categories
n Category 1: $450,000 and underACCE's 2017 Operations Survey Report
Finance
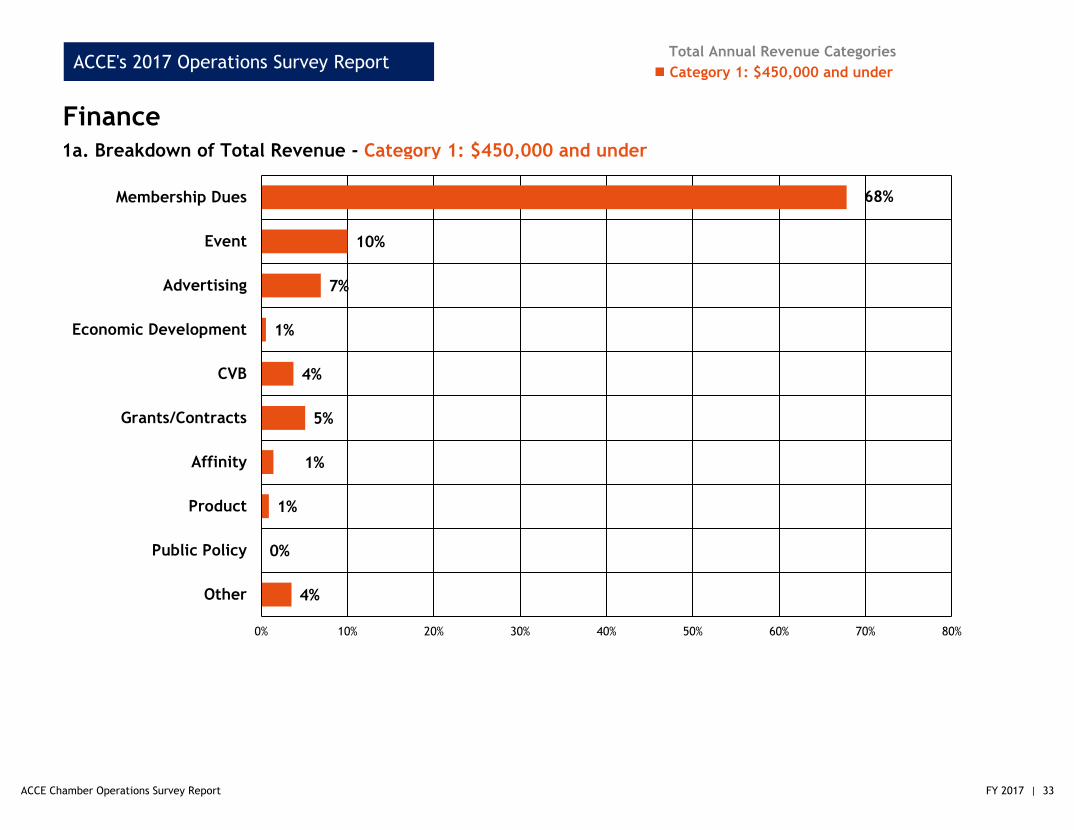
1a. Breakdown of Total Revenue - Category 1: $450,000 and under
4%
0%
1%
1%
5%
4%
1%
7%
10%
68%
0% 10% 20% 30% 40% 50% 60% 70% 80%
Other
Public Policy
Product
Affinity
Grants/Contracts
CVB
Economic Development
Advertising
Event
Membership Dues
ACCE Chamber Operations Survey Report FY 2017 | 33

Total Annual Revenue Categories
n Category 2: $450,001 - $900,000ACCE's 2017 Operations Survey Report
Finance
1b. Breakdown of Total Revenue - Category 2: $450,001 - $900,000
4%
0%
0%
1%
4%
2%
17%
4%
14%
53%
0% 10% 20% 30% 40% 50% 60%
Other
Public Policy
Product
Affinity
Grants/Contracts
CVB
Economic Development
Advertising
Event
Membership Dues
ACCE Chamber Operations Survey Report FY 2017 | 34
Total Annual Revenue Categories
n Category 3: $900,001 - $2 millionACCE's 2017 Operations Survey Report
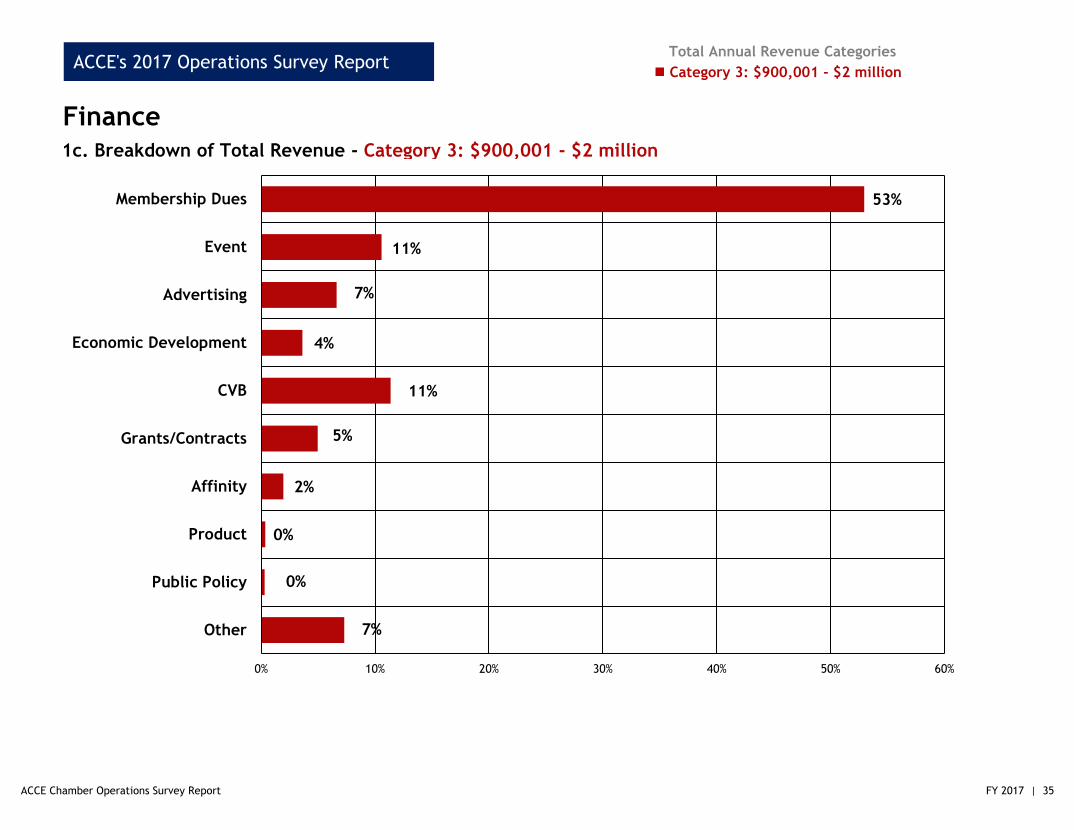
Finance
1c. Breakdown of Total Revenue - Category 3: $900,001 - $2 million
7%
0%
0%
2%
5%
11%
4%
7%
11%
53%
0% 10% 20% 30% 40% 50% 60%
Other
Public Policy
Product
Affinity
Grants/Contracts
CVB
Economic Development
Advertising
Event
Membership Dues
ACCE Chamber Operations Survey Report FY 2017 | 35

Total Annual Revenue Categories
n Category 4: $2,000,001 - $5 millionACCE's 2017 Operations Survey Report
Finance1d. Breakdown of Total Revenue - Category 4: $2,000,001 - $5 million
10%
0%
1%
4%
4%
10%
12%
2%
11%
45%
0% 5% 10% 15% 20% 25% 30% 35% 40% 45% 50%
Other
Public Policy
Product
Affinity
Grants/Contracts
CVB
Economic Development
Advertising
Event
Membership Dues
ACCE Chamber Operations Survey Report FY 2017 | 36

Total Annual Revenue Categories
n Category 5: above $5 millionACCE's 2017 Operations Survey Report
Finance
1e. Breakdown of Total Revenue - Category 5: above $5 million
13%
0%
1%
5%
4%
12%
16%
0%
8%
41%
0% 5% 10% 15% 20% 25% 30% 35% 40% 45%
Other
Public Policy
Product
Affinity
Grants/Contracts
CVB
Economic Development
Advertising
Event
Membership Dues
ACCE Chamber Operations Survey Report FY 2017 | 37
Total Annual Revenue Categories
n Category 1: $450,000 and under
n Category 2: $450,001 - $900,000
n Category 3: $900,001 - $2 million
n Category 4: $2,000,001 - $5 million
n Category 5: above $5 million
ACCE's 2017 Operations Survey Report
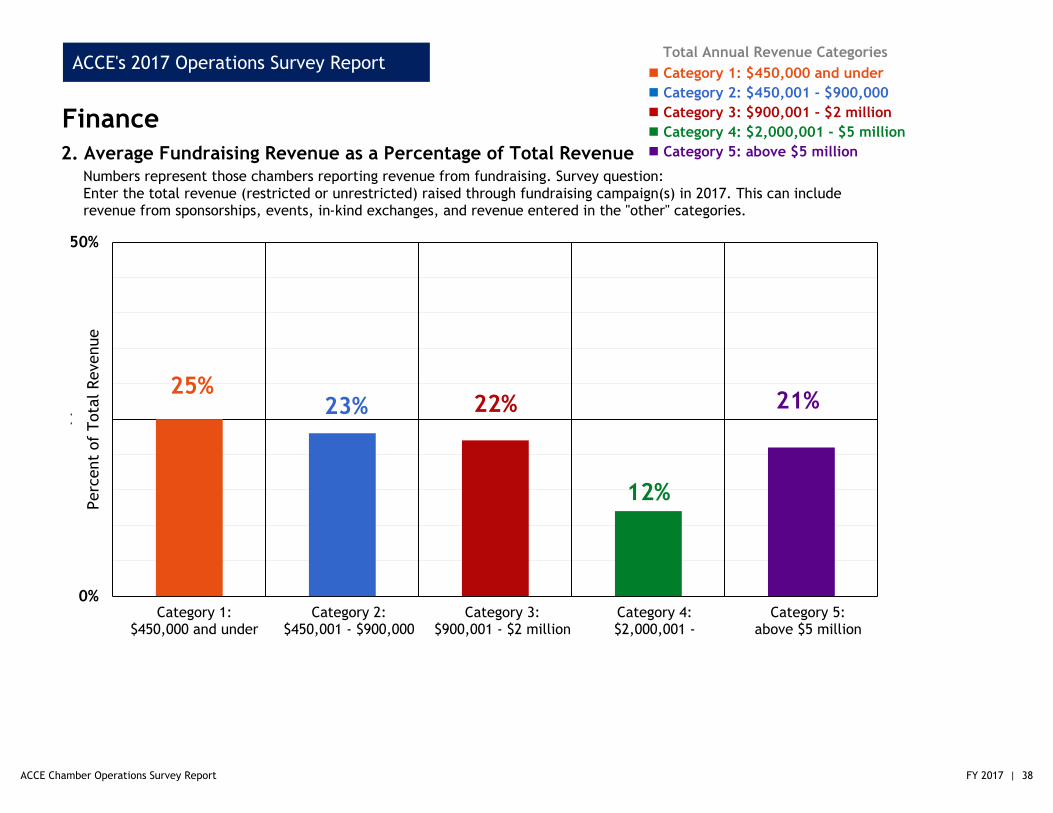
Finance
2. Average Fundraising Revenue as a Percentage of Total RevenueNumbers represent those chambers reporting revenue from fundraising. Survey question:
Enter the total revenue (restricted or unrestricted) raised through fundraising campaign(s) in 2017. This can include revenue from sponsorships, events, in-kind exchanges, and revenue entered in the "other" categories.
25%23% 22%
12%
21%
0%
25%
50%
Perc
ent
of
Tota
l Revenue
Category 1: $450,000 and under
Category 2: $450,001 - $900,000
Category 3: $900,001 - $2 million
Category 4: $2,000,001 -
Category 5: above $5 million
ACCE Chamber Operations Survey Report FY 2017 | 38

Total Annual Revenue Categories
n Category 1: $450,000 and under
n Category 2: $450,001 - $900,000
n Category 3: $900,001 - $2 million
n Category 4: $2,000,001 - $5 million
n Category 5: above $5 million
ACCE's 2017 Operations Survey Report
Finance3. Average Expense per Member
Calculation: average of (total expenses divided by number of member accounts)
2014-17 is a median average, 2012-13 represent the mean average
$640$612 $539 $579 $572
$621
$876 $905 $851 $836
$875$869
$1,344 $1,336$1,164 $1,234 $1,148
$1,215
$1,990 $2,049 $1,974 $2,061
$1,929
$2,222
$3,870 $3,743
$3,668
$3,115
$3,486
$3,344
$0
$500
$1,000
$1,500
$2,000
$2,500
$3,000
$3,500
$4,000
$4,500
2012 2013 2014 2015 2016 2017
Avera
ge E
xpense
per
Mem
ber
in D
ollars
ACCE Chamber Operations Survey Report FY 2017 | 39

Total Annual Revenue Categories
n Category 1: $450,000 and under
n Category 2: $450,001 - $900,000
n Category 3: $900,001 - $2 million
n Category 4: $2,000,001 - $5 million
n Category 5: above $5 million
ACCE's 2017 Operations Survey Report
Finance4. Personnel as a Percentage of Total Expense
49%46% 47%
43% 45%
5%6% 5%
6%7%
Category 1: $450,000 and under
Category 2: $450,001 - $900,000
Category 3: $900,001 - $2 million
Category 4: $2,000,001 -
Category 5: above $5 million
BenefitsBenefits Benefits
Benefits
SalariesSalariesSalariesSalariesSalaries
Benefits
Personnel Expenses include Salaries, Payroll Taxes, and Benefits
ACCE Chamber Operations Survey Report FY 2017 | 40

Total Annual Revenue Categories
n Category 1: $450,000 and under
n Category 2: $450,001 - $900,000
n Category 3: $900,001 - $2 million
n Category 4: $2,000,001 - $5 million
n Category 5: above $5 million
ACCE's 2017 Operations Survey Report
Finance5. Breakdown as a Percentage of Total Expense
8% 8% 7% 7% 6%
1%
11%
9%
12% 16%
0%
2%
1%
2%1%
17%
15%
16% 11%
13%
4%
3%4% 6%
8%
0%
1%3%
4%
3%
Category 1: $450,000 and under
Category 2: $450,001 - $900,000
Category 3: $900,001 - $2 million
Category 4: $2,000,001 -
Category 5: above $5 million
Total Expenses include Occupancy, Economic Development, Small Business Development,
Events, Membership Retention and Recruitment, and Public Policy. All areas include personnel
expenses.
ACCE Chamber Operations Survey Report FY 2017 | 41

Total Annual Revenue Categories
n Category 1: $450,000 and under
n Category 2: $450,001 - $900,000
n Category 3: $900,001 - $2 million
n Category 4: $2,000,001 - $5 million
n Category 5: above $5 million
ACCE's 2017 Operations Survey Report
Finance6. Number of Survey Participants in Percentage Range of Annual Expense Covered by Reserves
(i.e., 58% of chambers in Category 1 have reserves to cover 0-10% of total annual operating expense.)
32%
9%
5%
55%
24%
5%
8%
63%
46%
11%
14%
29%
40%
9%9%
42%58%
17%
11%
13%
11 to 20%
30+%
21-30%
0-10%
11 to 20%
30+%
21-30%
0-10%
11 to 20%
30+%
21-30%
0-10%
11 to 20%30+%
21-30%
0-10%
11 to 20%
30+%
21-30%
0-10%
ACCE Chamber Operations Survey Report FY 2017 | 42
Total Annual Revenue Categories
n Category 1: $450,000 and under
n Category 2: $450,001 - $900,000
n Category 3: $900,001 - $2 million
n Category 4: $2,000,001 - $5 million
n Category 5: above $5 million
$97,973
$475,603 $419,993
$1,514,366
$3,654,720
$0
$500,000
$1,000,000
$1,500,000
$2,000,000
$2,500,000
$3,000,000
$3,500,000
$4,000,000
ACCE's 2017 Operations Survey Report
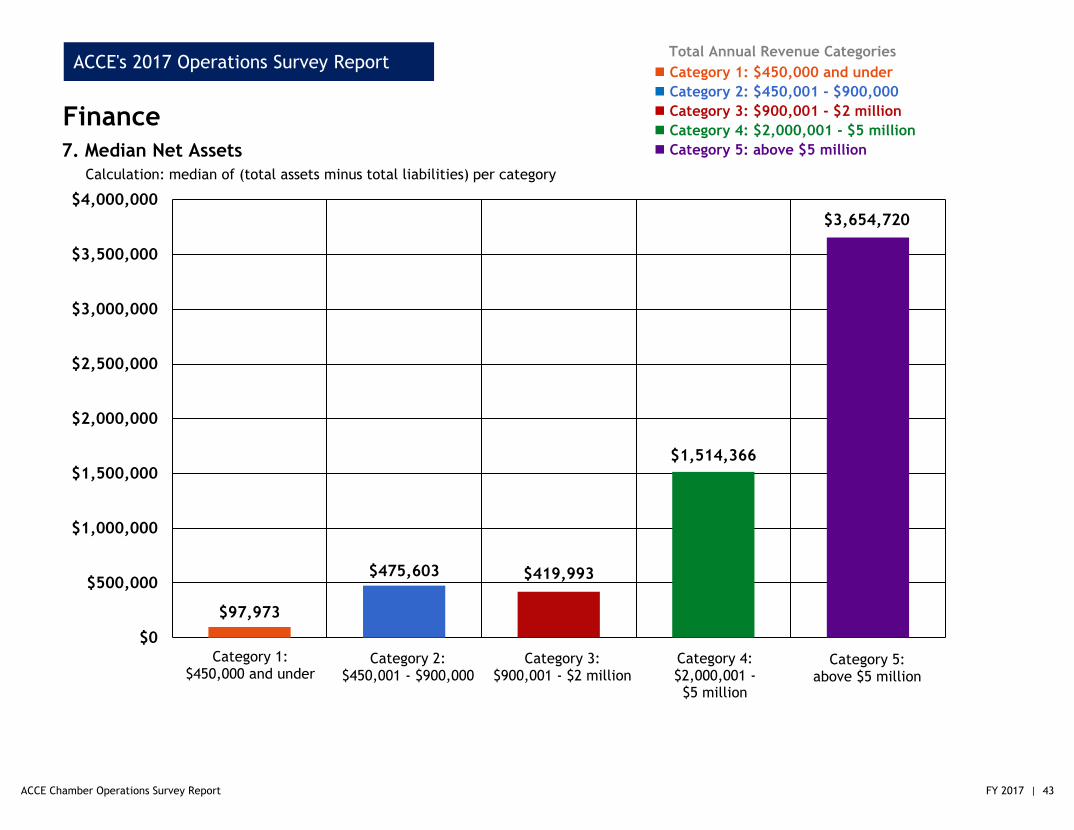
Finance
7. Median Net Assets
Calculation: median of (total assets minus total liabilities) per category
Category 1: $450,000 and under
Category 2: $450,001 - $900,000
Category 3: $900,001 - $2 million
Category 4: $2,000,001 -$5 million
Category 5: above $5 million
ACCE Chamber Operations Survey Report FY 2017 | 43

Total Annual Revenue Categories
n Category 1: $450,000 and under
n Category 2: $450,001 - $900,000
n Category 3: $900,001 - $2 million
n Category 4: $2,000,001 - $5 million
n Category 5: above $5 million
42%
70%
42%
55% 56%
0%
10%
20%
30%
40%
50%
60%
70%
80%
90%
100%
ACCE's 2017 Operations Survey Report
Finance
8. Net Assets as a Percentage of Annual ExpensesCalculation: median of (total assets minus total liabilities) divided by total expenses
Category 1: $450,000 and under
Category 2: $450,001 - $900,000
Category 3: $900,001 - $2 million
Category 4: $2,000,001 -$5 million
Category 5: above $5 million
Tota
l Annual Expense
Average Net Assets
ACCE Chamber Operations Survey Report FY 2017 | 44

Total Annual Revenue Categories
n Category 1: $450,000 and under
n Category 2: $450,001 - $900,000
n Category 3: $900,001 - $2 million
n Category 4: $2,000,001 - $5 million
n Category 5: above $5 million
ACCE's 2017 Operations Survey Report
Finance9. Number of Chambers with a 501c(3) Foundation
28
25
34
37
21
45
23
30
4 3
0
10
20
30
40
50
60
YesYes
Yes
Yes
Yes
No
No
No No
Category 1: $450,000 and under
Category 2: $450,001 - $900,000
Category 3: $900,001 - $2 million
Category 4: $2,000,001-$5 million
Category 5: above $5 million
No
This slide shows the breakdown of number of chambers who indicated yes or no to having a 501c(3) Foundation in FY 2017.
ACCE Chamber Operations Survey Report FY 2017 |45

ACCE's 2017 Operations Survey Report
Appendix
ACCE's Dynamic Chamber Benchmarking was the survey instrument used to collect FY 2017 data in two sections: Chamber Profile and Operations Survey.
The complete set of questions for each survey section, including help text and answer choice, are available in the Data Collection Worksheet which may be downloaded in Excel from Dynamic Chamber Benchmarking, or from the PDF attached in this Appendix.
ACCE Chamber Operations Survey Report FY 2017 | 46

ACCE's 2017 Operations Survey Report
Participating Chambers
The list of ACCE chamber members who participated in the FY 2017 survey questions in ACCE's Dynamic Chamber Benchmarking platform is available as a separate
attachment file to this Appendix. The list shows chamber participants in alpha order by chamber name/state.
ACCE Chamber Operations Survey Report FY 2017 | 47
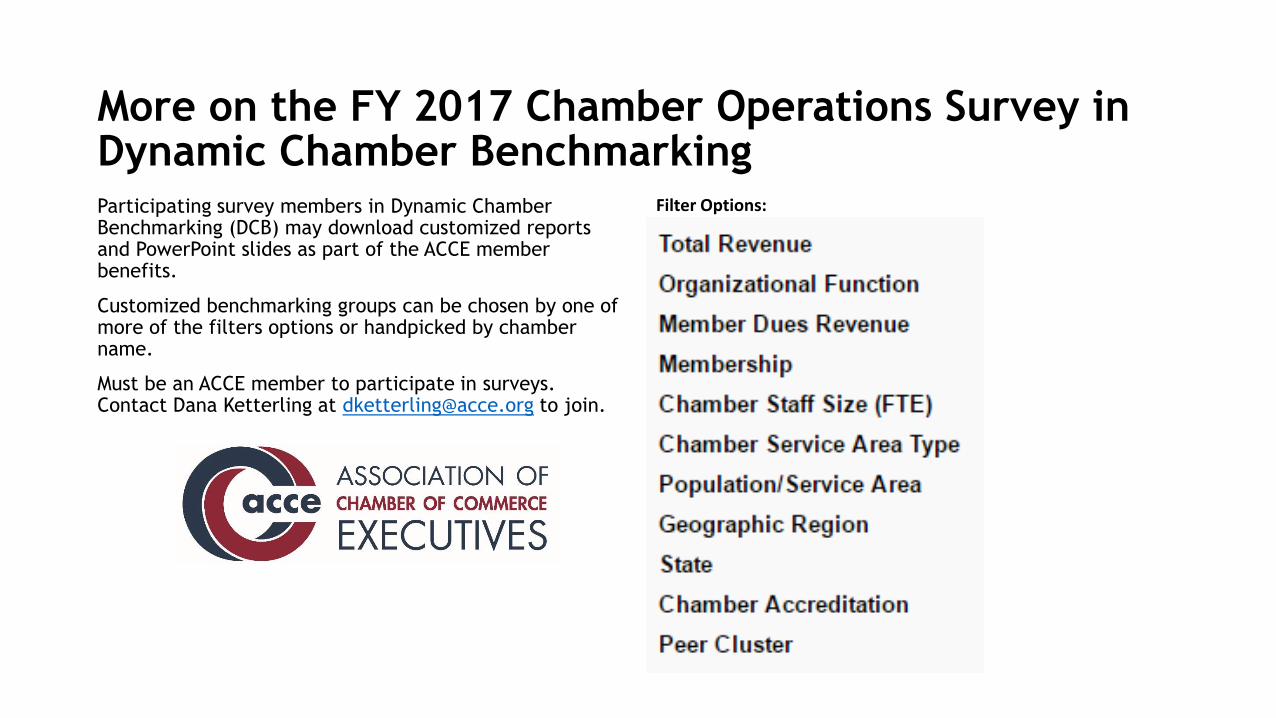
More on the FY 2017 Chamber Operations Survey in Dynamic Chamber Benchmarking Participating survey members in Dynamic Chamber Benchmarking (DCB) may download customized reports and PowerPoint slides as part of the ACCE member benefits.
Customized benchmarking groups can be chosen by one of more of the filters options or handpicked by chamber name.
Must be an ACCE member to participate in surveys. Contact Dana Ketterling at [email protected] to join.
Filter Options:

Example of a customized slide from the Operations Survey report in DCB:

Example of On-Demand Charting in “Compare by Question” tab from the Operations Survey module in DCB:

FY 2017 Chamber Operations Survey
Contact the HERO Team at ACCE to learn how to create custom reports comparing your chamber to peers.
![[NOT YET SCHEDULED FOR ORAL ARGUMENT]...Commerce, the Scottsdale Chamber of Commerce, the Superstition Region Chamber of Commerce, and the Tempe Chamber of Commerce. USCA Case #19-5125](https://img.pdfslide.net/doc/110x75/5f47b680ba1d83408f39933d/not-yet-scheduled-for-oral-argument-commerce-the-scottsdale-chamber-of-commerce.jpg)