Embed Size (px)
DESCRIPTION
PK20. Accountability in P-16 Systems & Database Issues: Florida Perspective August 13, 2004. Jay Pfeiffer, Director K20 Education Information and Accountability Division of Accountability Research and Measurement Florida Department of Education. www.fldoe.org - PowerPoint PPT Presentation
Citation preview
1
Accountability in P-16 Systems &
Database Issues: Florida PerspectiveAugust 13, 2004
Jay Pfeiffer, DirectorK20 Education Information and Accountability
Division of Accountability Research and MeasurementFlorida Department of Education
PK20
www.fldoe.org
www.k20accountability.org
2
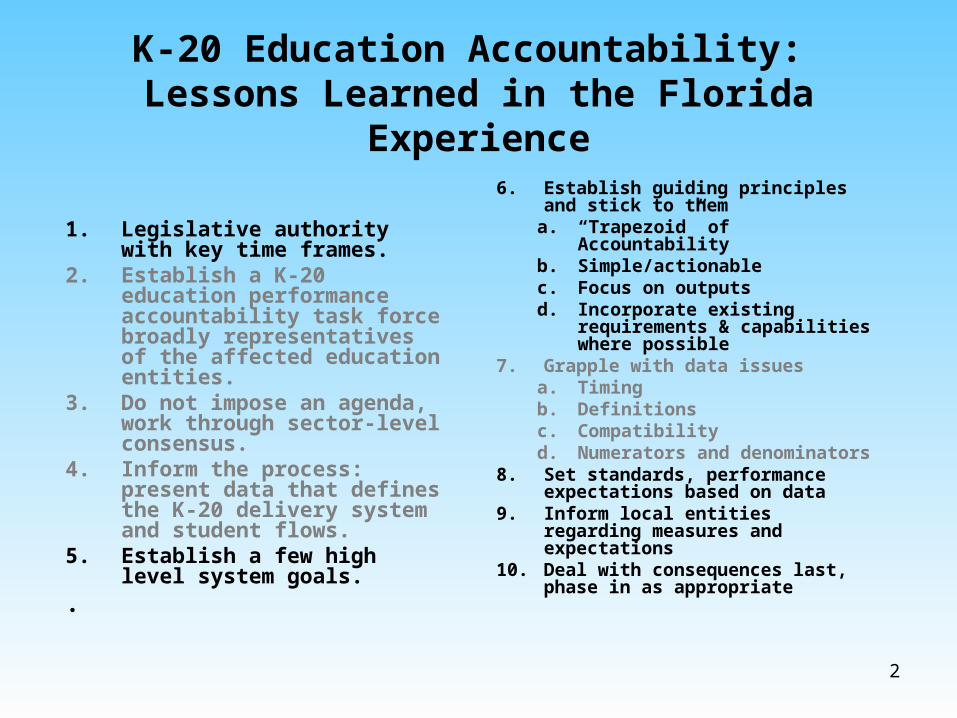
K-20 Education Accountability: Lessons Learned in the Florida Experience
1. Legislative authority with key time frames.
2. Establish a K-20 education performance accountability task force broadly representatives of the affected education entities.
3. Do not impose an agenda, work through sector-level consensus.
4. Inform the process: present data that defines the K-20 delivery system and student flows.
5. Establish a few high level system goals.
.
6. Establish guiding principles and stick to them
a. “Trapezoid” of Accountabilityb. Simple/actionablec. Focus on outputsd. Incorporate existing
requirements & capabilities where possible
7. Grapple with data issuesa. Timingb. Definitionsc. Compatibilityd. Numerators and denominators
8. Set standards, performance expectations based on data
9. Inform local entities regarding measures and expectations
10. Deal with consequences last, phase in as appropriate
3
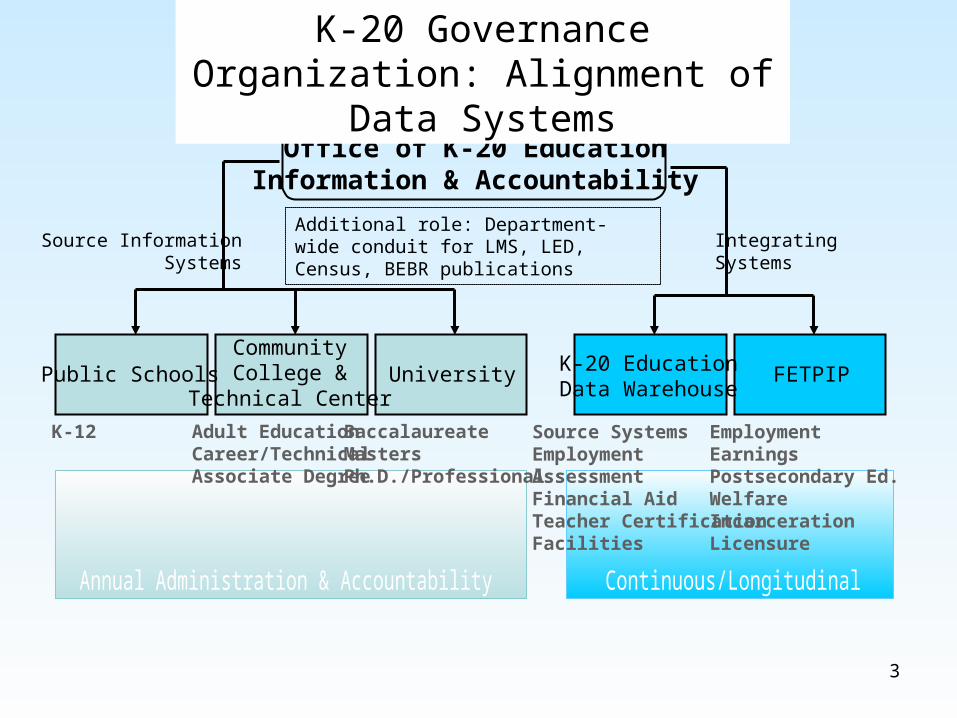
Additional role: Department-wide conduit for LMS, LED, Census, BEBR publications
Office of K-20 EducationInformation & Accountability
Public SchoolsCommunityCollege &
Technical CenterUniversity
Source InformationSystems
K-12 Adult EducationCareer/TechnicalAssociate Degree
BaccalaureateMastersPh.D./Professional
IntegratingSystems
Source SystemsEmploymentAssessmentFinancial AidTeacher CertificationFacilities
EmploymentEarningsPostsecondary Ed.WelfareIncarcerationLicensure
K-20 EducationData Warehouse
FETPIP
K-20 Governance Organization: Alignment of Data Systems
4
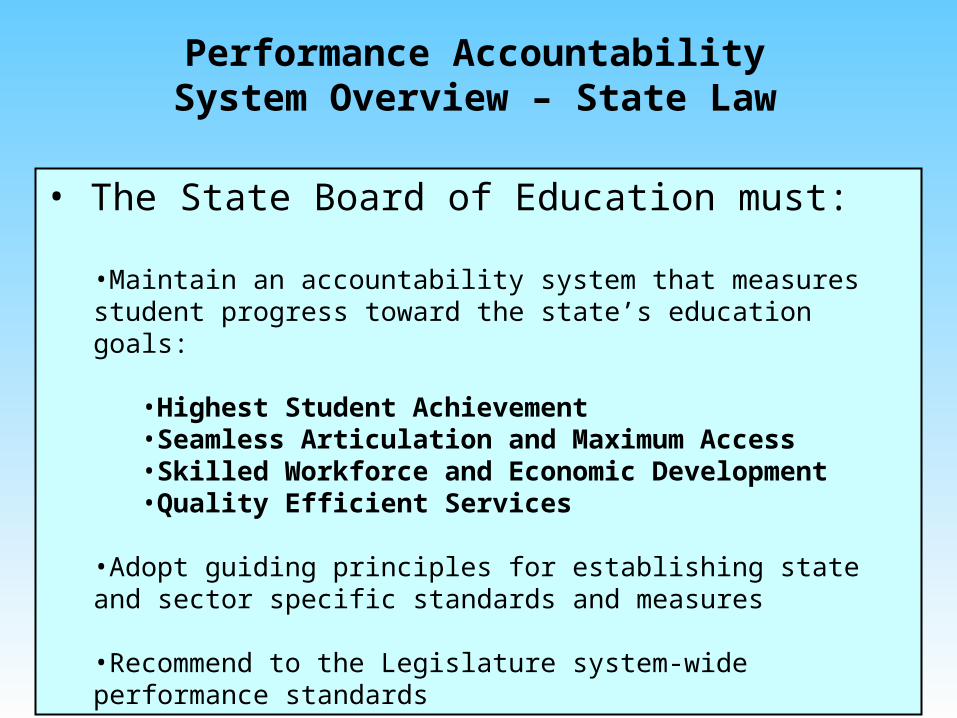
• The State Board of Education must:
•Maintain an accountability system that measures student progress toward the state’s education goals:
•Highest Student Achievement•Seamless Articulation and Maximum Access•Skilled Workforce and Economic Development •Quality Efficient Services
•Adopt guiding principles for establishing state and sector specific standards and measures
•Recommend to the Legislature system-wide performance standards
Performance Accountability System Overview – State Law
5
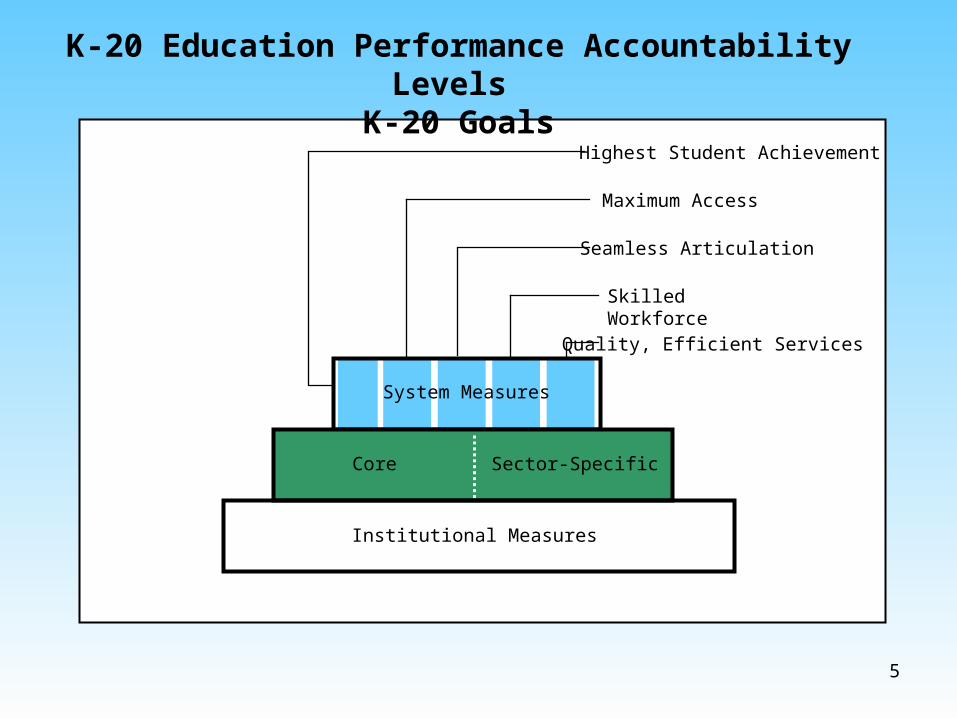
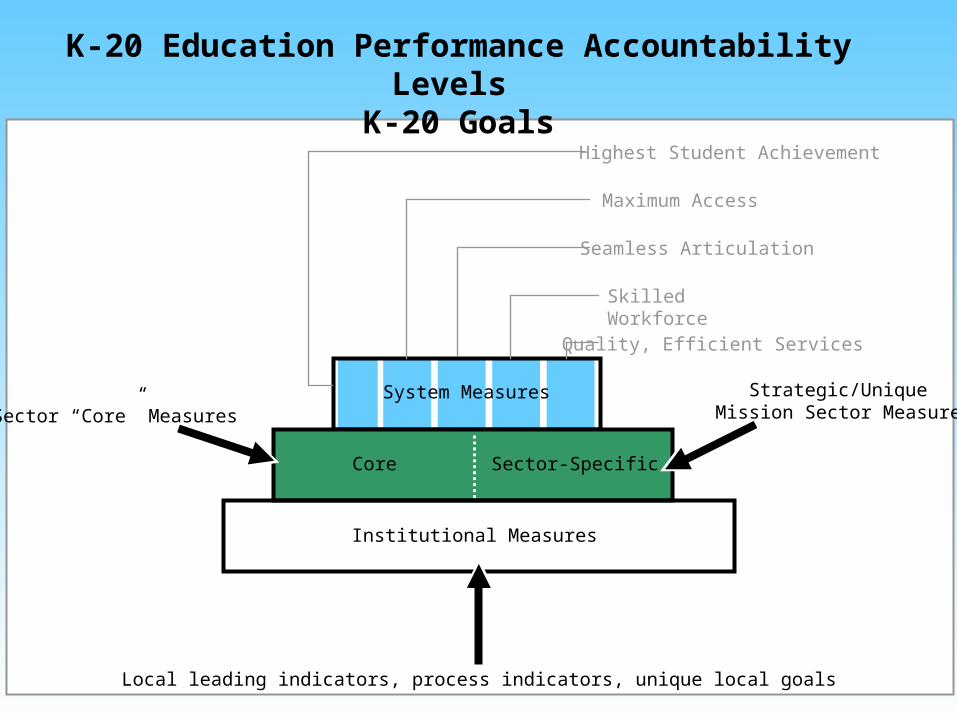
Core Sector-Specific
Institutional Measures
Highest Student Achievement
Seamless Articulation
Quality, Efficient Services
K-20 Education Performance Accountability Levels K-20 Goals
Maximum Access
Skilled Workforce
System Measures
6
Core Sector-Specific
Institutional Measures
Highest Student Achievement
Seamless Articulation
Quality, Efficient Services
K-20 Education Performance Accountability Levels K-20 Goals
Maximum Access
Skilled Workforce
System MeasuresSector “Core” Measures
Strategic/Unique Mission Sector Measures
Local leading indicators, process indicators, unique local goals
7
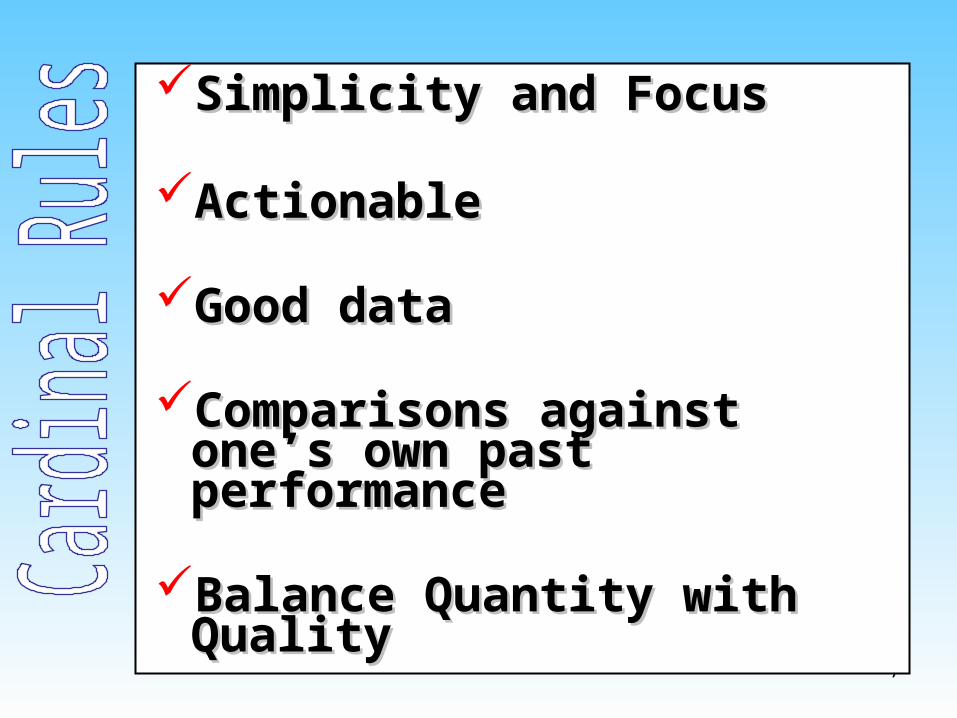
Simplicity and FocusSimplicity and Focus
ActionableActionable
Good dataGood data
Comparisons against one’s Comparisons against one’s own past performanceown past performance
BalanceBalance Quantity with Quality Quantity with Quality
8
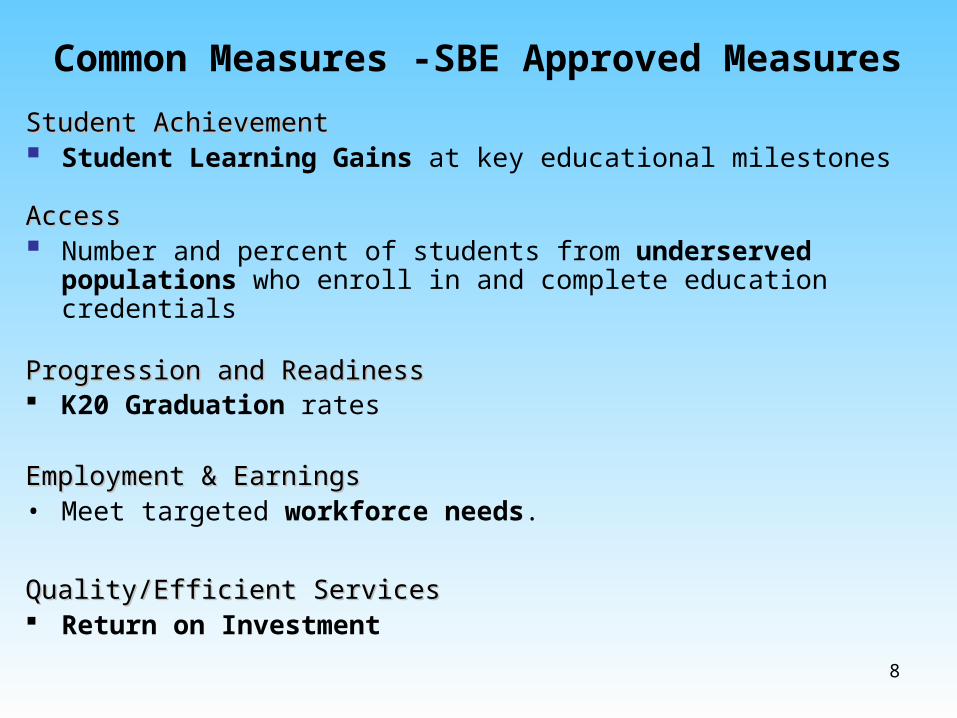
Common Measures -SBE Approved Measures
Student AchievementStudent Achievement Student Learning Gains at key educational milestones
AccessAccess Number and percent of students from underserved populations who
enroll in and complete education credentials
Progression and ReadinessProgression and Readiness K20 Graduation rates
Employment & EarningsEmployment & Earnings• Meet targeted workforce needs.
Quality/Efficient ServicesQuality/Efficient Services Return on Investment
9
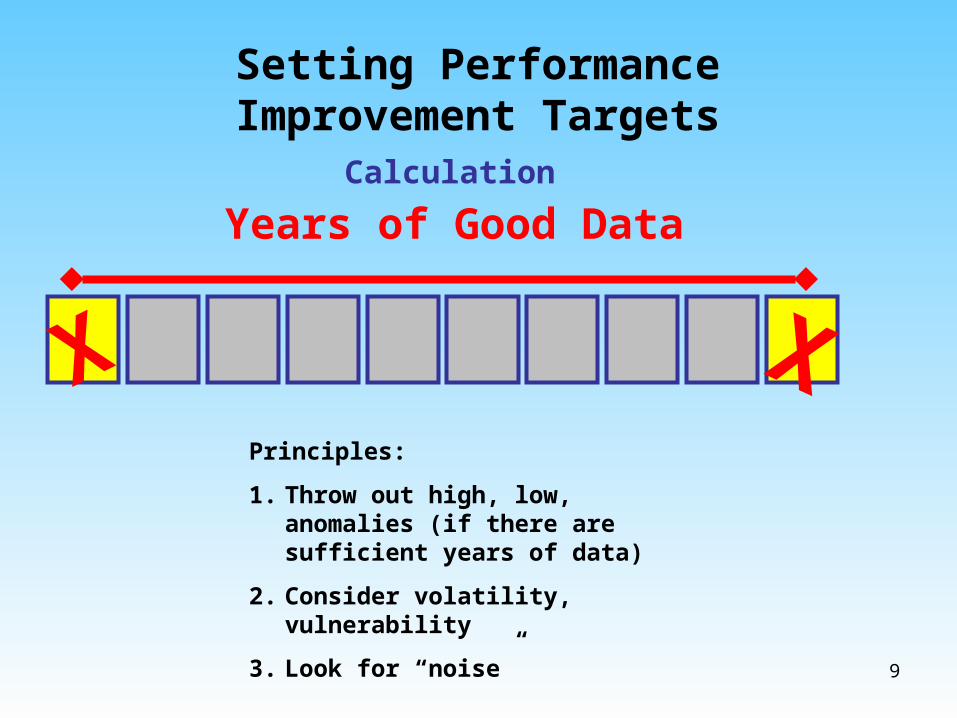
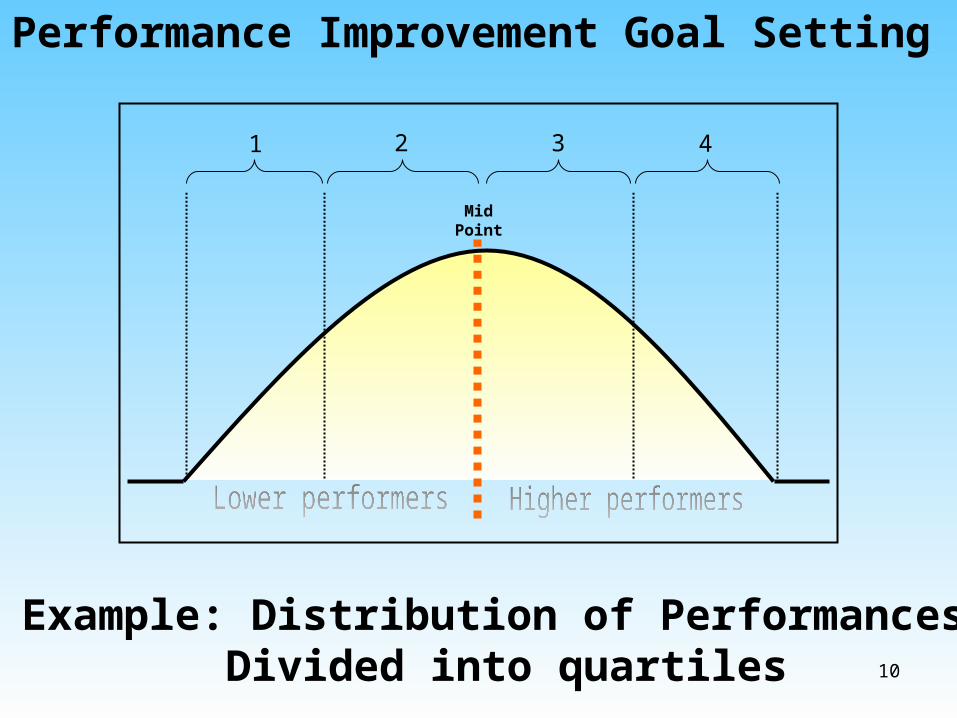
Setting Performance Improvement Targets
Calculation
Years of Good Data
XXPrinciples:
1. Throw out high, low, anomalies (if there are sufficient years of data)
2. Consider volatility, vulnerability
3. Look for “noise”
10
MidPoint
1 2 3 4
Example: Distribution of Performances Divided into quartiles
Performance Improvement Goal Setting

11
K-20 Education Performance Accountability: K-20 Education Performance Accountability: Performance Based Funding: State LawPerformance Based Funding: State Law
By December 1, 2004, the Department of Education must make recommendations to the Legislature regarding performance-based funding that applies accountability standards for public education at every level, kindergarten through graduate school.
The State Board of Education’s proposal to the Legislature must provide that at least 10 percent of the state funds appropriated for the k-20 education system are conditional upon meeting or exceeding established performance standards.
12
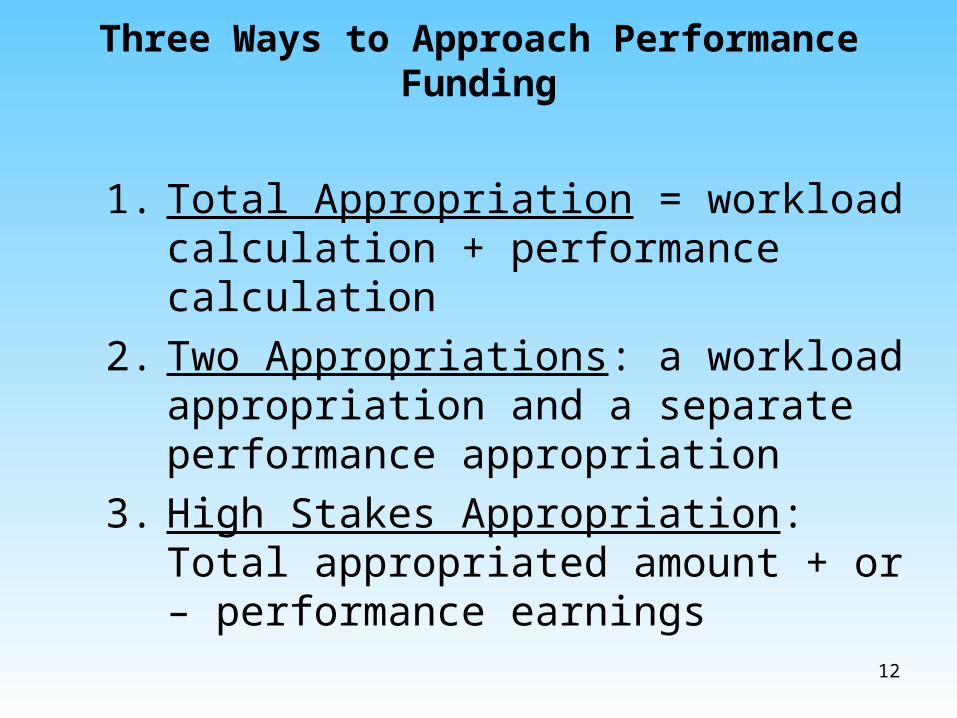
Three Ways to Approach Performance Funding
1. Total Appropriation = workload calculation + performance calculation
2. Two Appropriations: a workload appropriation and a separate performance appropriation
3. High Stakes Appropriation: Total appropriated amount + or – performance earnings
13
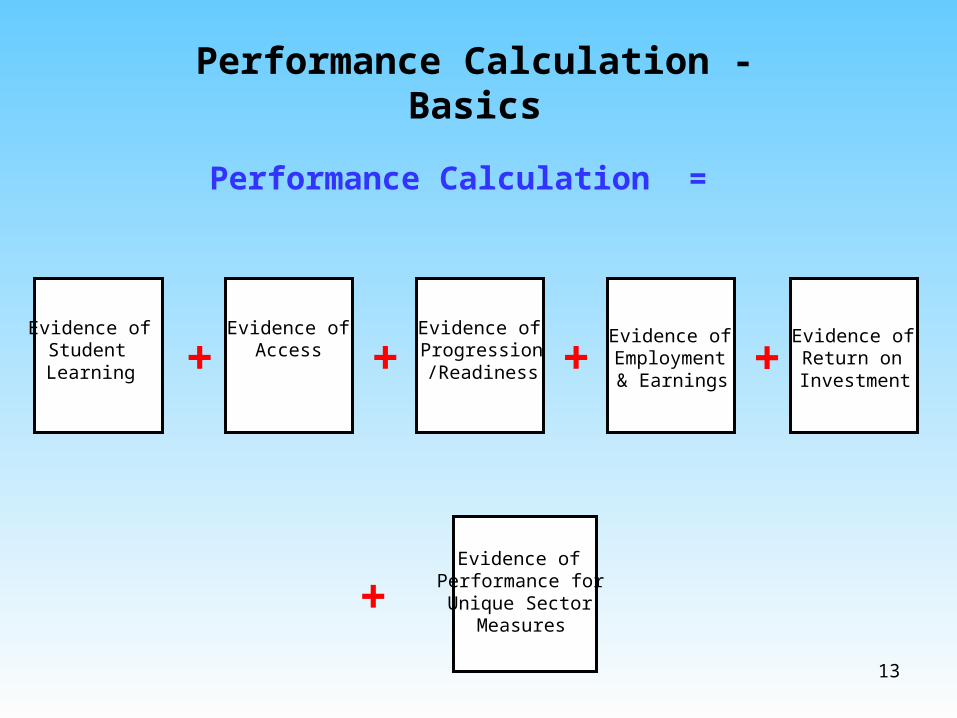
Performance Calculation - Basics
Evidence of Student Learning
Evidence of Access
Evidence of Progression/Readiness
Evidence of Employment & Earnings
Evidence of Return on Investment
Performance Calculation =
+ + + +
+Evidence of
Performance for Unique Sector
Measures
14
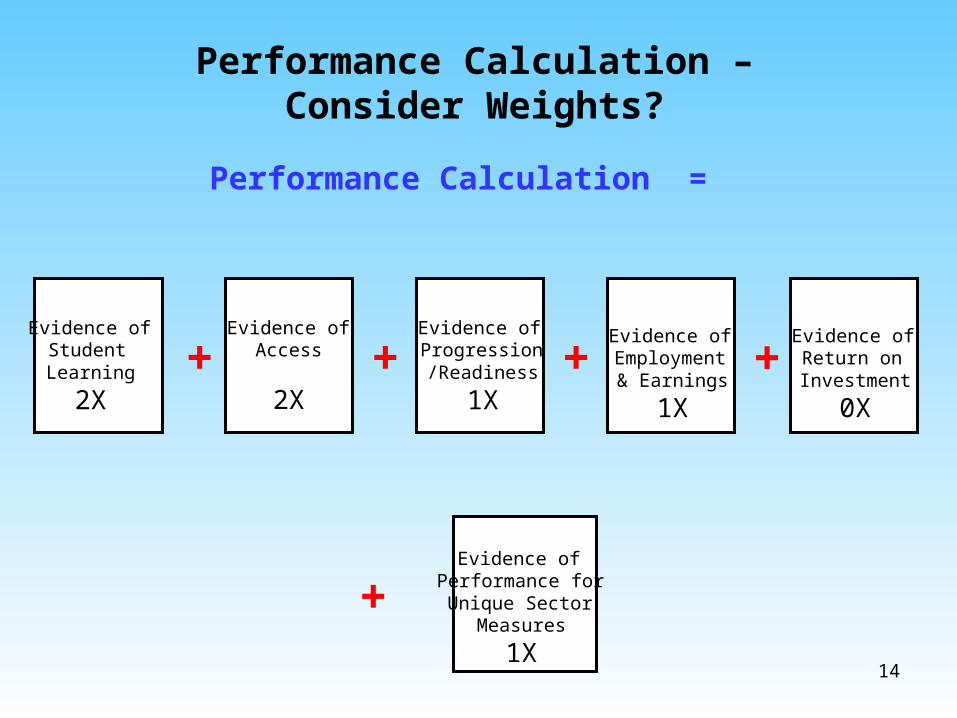
Performance Calculation – Consider Weights?
Evidence of Student Learning
2X
Evidence of Access
2X
Evidence of Progression/Readiness
1X
Evidence of Employment & Earnings
1X
Evidence of Return on Investment
0X
Performance Calculation =
+ + + +
+Evidence of
Performance for Unique Sector
Measures
1X
15
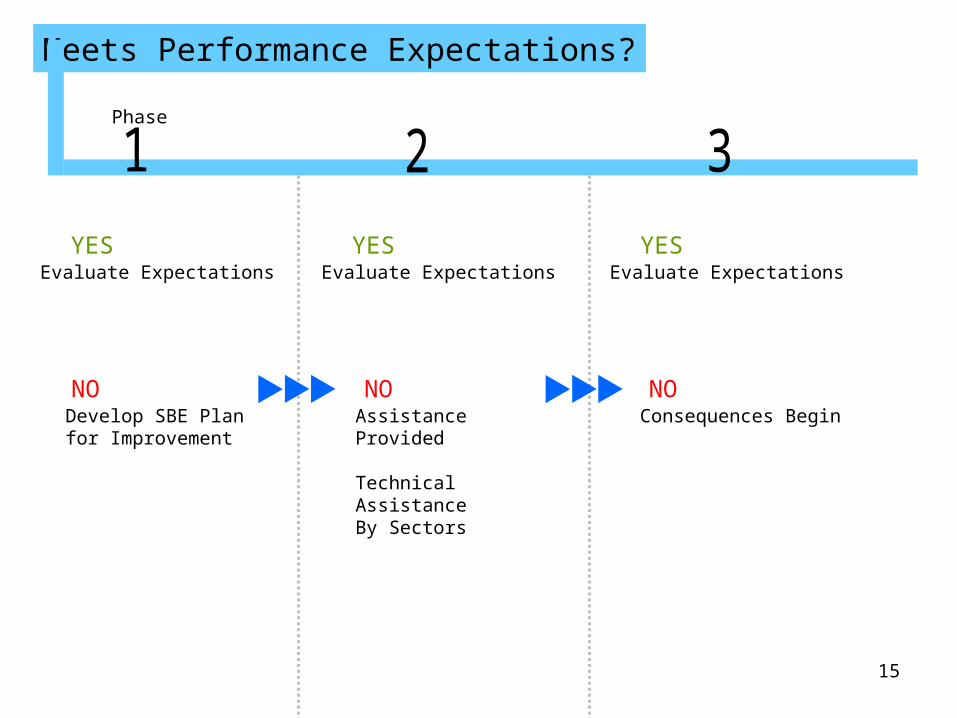
Meets Performance Expectations?
Evaluate ExpectationsYES
Evaluate ExpectationsYES
Evaluate ExpectationsYES
NODevelop SBE Plan for Improvement
Assistance Provided
Technical AssistanceBy Sectors
Consequences BeginNO NO
Phase
16
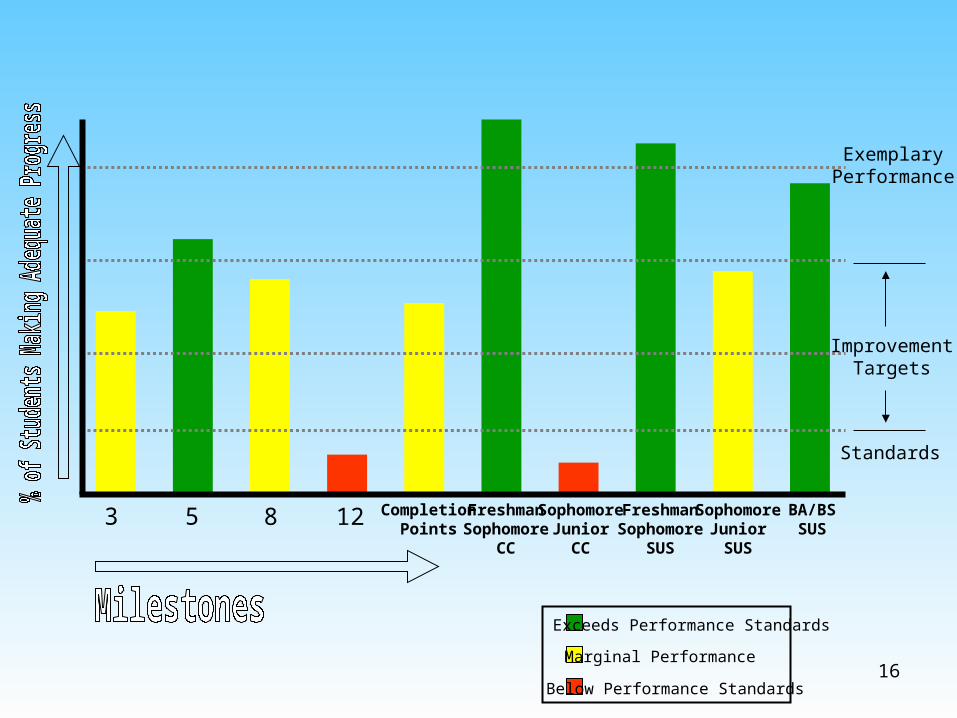
3 5 8 12 CompletionPoints
FreshmanSophomore
CC
SophomoreJunior
CC
FreshmanSophomore
SUS
SophomoreJuniorSUS
BA/BSSUS
ExemplaryPerformance
ImprovementTargets
Standards
Exceeds Performance Standards
Marginal Performance
Below Performance Standards
17
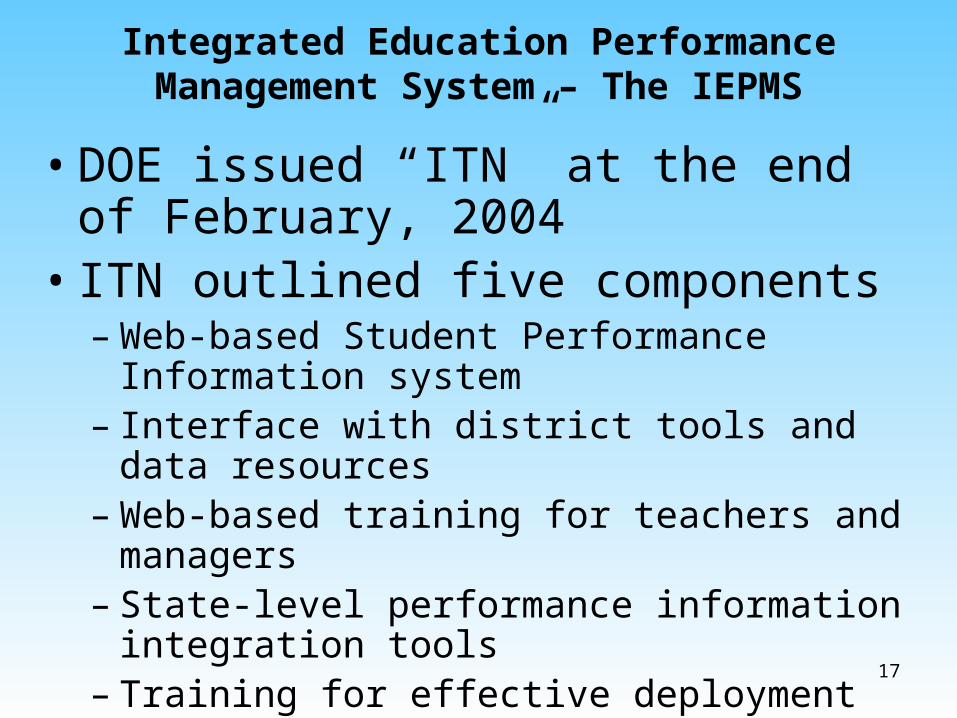
Integrated Education Performance Management System – The IEPMS
• DOE issued “ITN” at the end of February, 2004
• ITN outlined five components– Web-based Student Performance Information
system– Interface with district tools and data resources– Web-based training for teachers and managers– State-level performance information integration
tools– Training for effective deployment and
management