Embed Size (px)
Citation preview

1
Understanding the Core Components of RTI:Taking Stock of What’s in Place & Planning for
Next Steps
Beth Harn
Center on Teaching & Learning
University of Oregon
Acknowledgments
!Oregon Department of Education
!Bethel School District, Eugene, Oregon
Dr. Drew Braun, Dr. Carl Cole, Lori Smith, Rhonda Wolter,
Administrators, Staff, and Students
! Tigard-Tualatin School District
Dr. Carol Sadler, Pam Zinn, Petrea Hagen-Gilden,
Janice Best, Jennifer Duncan, & Theda Pansevicius,
Administrators, Staff, and Students
3
Objectives: What You Will Learn and Do
!Review the historical pressures on current approach
!Understand the core components of an RTIapproach
Programs, use of time, assessment practices,coordination of resources and decision making teams
!What might a school/district using an RTI approachlook like?
!Identify strategies or methods for implementing anRTI approach, improving schoolwide coordination
Taking Stock & Planning for Next Steps:
" Examining the quality of general educationimplementation, assessment systems, coordinatinginstructional resources, teaming and school-leveldecision making
4
Historical Pressures: How Did We Get Here?
An Evolving Process! PL 94-142 (1975):
Free and Appropriate Public Education for all
Institutionalization of the discrepancy approach
! IDEA 1997:Linking special and general education
Functional assessment
Increases parental/guardian participation
! Learning Disabilities Summit (2001)Continued dissatisfaction with LD identification approach (unreliable,invalid) -- http://www.air.org/ldsummit/
Recommended a problem-solving approach to assessment
! President’s Commission on Special Education (2002)Provided a range of recommendations to improve practice
http://www.ed.gov/inits/commissionsboards/whspecialeducation
! IDEA 2004:Enables use of a response to intervention (RTI) approach

5
Capricious Distinctions of the LD Label:Improves Communication?
Historical Pressures: How Did We Get Here?
Percent of Students withLD Label Across aSampling of States
! GA = 2.6
! CO = 3.16
! CA = 3.97
! OR = 4.08
! PN = 5.22
! IA = 5.70
! RI = 6.22
! DC = 6.48
Percent receiving all SpecialEducation services within
CA where 52% of studentsin Sped are identified as LD
! San Benito = 7.5
! Clovis = 7.5
! Fresno Unified = 9.1
! Fruitvale = 10.7
! Sacramento = 11.0
! San Francisco = 11.2
! Santa Cruz = 18.2From School Enrollment Data for 6-17 Year
olds (2002-2003) Table AA-13,
www.IDEAdata.org.6
Historical Pressures: How Did We Get Here? (Kavale &
Forness, 1999)
.9341Applied behavior analysis
.2152Social skills training
.4574Early intervention
.3070Psychotropic drugs
.1223Diet Intervention
.58135Stimulant drugs
.1539Modality training
.3034Psycholinguistic training
.08180Perceptual-motor training
Mean ES# of StudiesIntervention
! ES need to be interpreted in meaningful ways: is it significantly differentfrom 0?; Small=.20, Medium=.5, Large=.80 (Thompson, 2002)
Effectiveness of Special Education?
7
Historical Pressures: How Did We Get Here?
! Dr. Douglas Carnine, in a Hearing before the Subcommittee onEducation Reform Committee on Education and the WorkforceUnited States House of Representatives concluded:
“For twenty-five years, we have used the IQ-achievementdiscrepancy model, a wait-to-fail model that is known to be:
Ineffective -- 75% of students receiving reading remediationafter 3rd grade never read at grade levelInefficient -- the cost of late remediation is much greater thanearly intervention in K-2Irrational -- no scientific research base for waiting for failure todeepenImmoral -- it literally forces children to be left behindIndefensible – consensus in the field that is must go.
The opportunity is before you now to do away with it. You can putmillions of students on a better trajectory toward academicsuccess and ensure children are given every opportunity to learnrather than fail.”
(Carnine, 2003. Full testimony at http://edworkforce.house.gov/hearings/108th/edr/idea031303/carnine.htm) 8
Attempting to Define/Describe RTI
!National Research Center on Learning Disabilities
http://www.nrcld.org/index.shtml
!Purpose of the group:
To understand how alternative approaches to
identification affect who is identified.
To investigate state and local identification policies and
practices and LD prevalence.
To provide technical assistance and conduct
dissemination to enhance state and local practice in
identification.
To identify sites that effectively use responsiveness-to-
intervention as a method of identification.
Information from the National Research Center on Learning Disabilitieshttp://www.nrcld.org/index.shtml

9
Core Concepts of RTI
! Students receive high quality instruction in their general educationsetting
! General education instruction is research-based! General education instructors and staff assume an active role in
students' assessment in that curriculum! School staff conduct universal screening of academics and
behavior! Continuous progress monitoring of student performance occurs! School staff implement specific, research-based interventions to
address the student's difficulties! School staff use progress-monitoring data to determine
interventions' effectiveness and to make any modifications asneeded
! Systematic assessment is completed of the fidelity or integrity withwhich instruction and interventions are implemented
! The RTI model is well described in written documents (so that theprocedures and criteria used in schools can be compared to thedocuments)
! Sites can be designated as using a "standardized" treatmentprotocol or an individualized, problem-solving model
10
Core Concepts of RTI: The Role of GE
!Implementation of RTI is predicated on effective
practices in general education classroom
Students can not be identified as having a learning
disability if their difficulty is due to a lack of instruction
Programs need to be research-based
Prevention-oriented
" IDEA 2004 allocates 15% of funds to “early
intervening” services to non-identified students
(including materials and personnel)
“RTI requires a way of thinking about instruction,
academic achievement, and individual differences that
makes it impossible to implement without fully involving
general education” (Technical Assistance Paper, ODE, p. 2)
11
Core Concepts of RTI: General Components
!RTI models have also been implemented withvariations. Some attributes common to many RTIimplementations include the following:
the concept of multiple tiers of increasingly intensestudent interventions
implementation of a differentiated curriculum
instruction delivered by staff other than the classroomteacher
varied duration, frequency, and time of interventions
use a standardized treatment protocol and/or aproblem solving approach for addressing students'difficulties
Information from the National Research Center on Learning Disabilitieshttp://www.nrcld.org/index.shtml 12
What does RTI implementation look like?
1. Students receive high quality, research-based instructionby qualified staff in their general education setting.
2. General education instructors and staff assume an activerole in students’ assessment in that curriculum.
3. School staff conduct universal screening ofboth academics and behavior.
4. School staff implement specific, research-basedinterventions to address the student’s difficulties.
5. Regular progress monitoring of student performanceoccurs (weekly or biweekly).
6. School staff use progress-monitoring data and decisionrules to determine interventions’ effectiveness andneeded modifications.
7. Systematic assessment of the fidelity or integrity withwhich instruction and interventions are implemented.
Information from the National Research Center on Learning Disabilitieshttp://www.nrcld.org/index.shtml
13
Academic Systems Behavioral Systems
5-10% 5-10%
10-15% 10-15%
Intensive, Individual Interventions
•Individual Students
•Assessment-based
•High Intensity
•Of longer duration
Intensive, Individual Interventions
•Individual Students
•Assessment-based
•Intense, durable procedures
Targeted Group Interventions
•Some students (at-risk)
•High efficiency
•Rapid response
Targeted Group Interventions
•Some students (at-risk)
•High efficiency
•Rapid response
75-85% 75-85%Universal Interventions
•All students
•Preventive, proactive
Universal Interventions
•All settings, all students
•Preventive, proactive
Taking a Systems-Level Approach toCoordinated Support
14
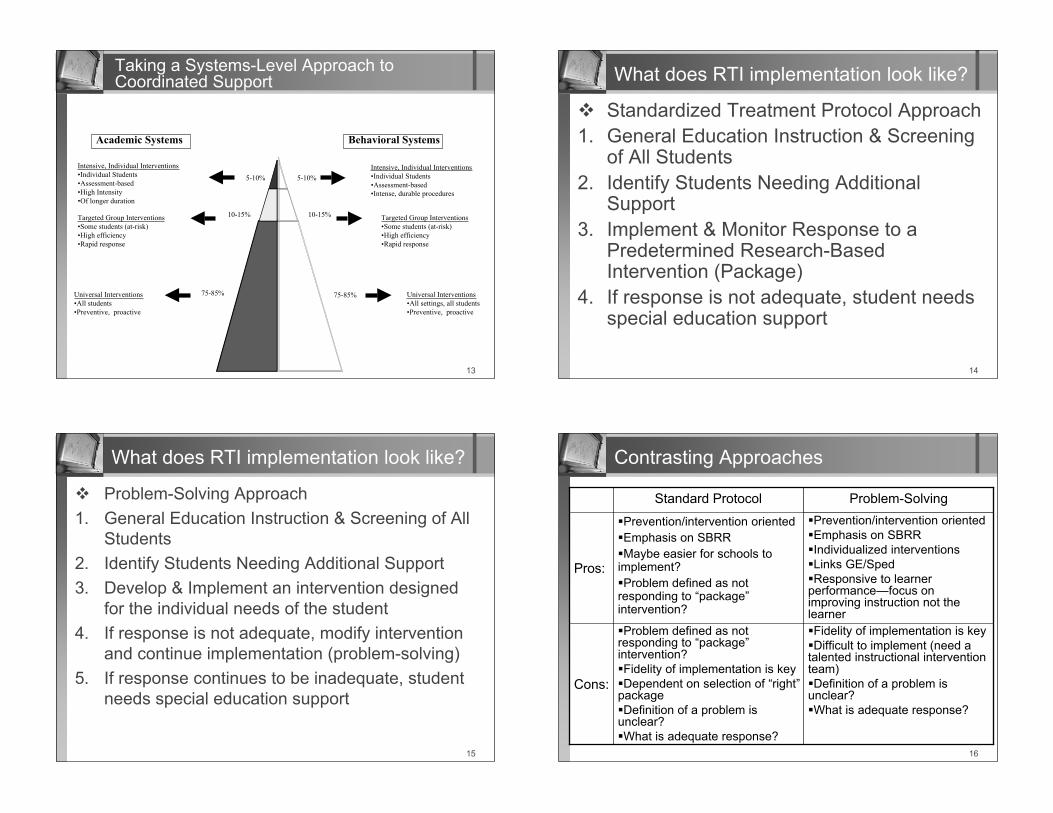
! Standardized Treatment Protocol Approach
1. General Education Instruction & Screeningof All Students
2. Identify Students Needing AdditionalSupport
3. Implement & Monitor Response to aPredetermined Research-BasedIntervention (Package)
4. If response is not adequate, student needsspecial education support
What does RTI implementation look like?
15
! Problem-Solving Approach
1. General Education Instruction & Screening of All
Students
2. Identify Students Needing Additional Support
3. Develop & Implement an intervention designed
for the individual needs of the student
4. If response is not adequate, modify intervention
and continue implementation (problem-solving)
5. If response continues to be inadequate, student
needs special education support
What does RTI implementation look like?
16
Contrasting Approaches
"Fidelity of implementation is key
"Difficult to implement (need atalented instructional interventionteam)
"Definition of a problem isunclear?
"What is adequate response?
"Problem defined as notresponding to “package”intervention?
"Fidelity of implementation is key
"Dependent on selection of “right”package
"Definition of a problem isunclear?
"What is adequate response?
Cons:
"Prevention/intervention oriented
"Emphasis on SBRR
"Individualized interventions
"Links GE/Sped
"Responsive to learnerperformance—focus onimproving instruction not thelearner
"Prevention/intervention oriented
"Emphasis on SBRR
"Maybe easier for schools toimplement?
"Problem defined as notresponding to “package”intervention?
Pros:
Problem-SolvingStandard Protocol

17
Determining Response to Intervention
!Specific guidelines have not been agreed upon;however, response can be considered in differentways
Idiographic—increase in relation to the student’s priorperformance (i.e., slope and level)
Normative—increase in relation to national norms (i.e.,move from the 10th%ile to the 15th%ile on a PNRT in aspecified period of time)
Local normative—increase in relation to classroom orschool norms (i.e., move from the 10th%ile to the15th%ile on a formative tool (CBM) in a specified periodof time)
Criterion—must meet some pre-designated goal (e.g.,grade-level expectations, benchmarks)
18
Determining Response to Intervention
! Measures that are useful in educational settings must bestandardized and have established reliability and validity.
! Measures were evaluated across areas critical to readingdevelopment: phonological awareness, alphabetic principle,fluency with connected text, comprehension and vocabulary.
Reading First Academy Assessment Committee
! David Francis, University of Houston! Lynn Fuchs, Vanderbilt University! Roland Good, University of Oregon! Rollanda O’Connor, University of Pittsburgh! Deborah Simmons, Texas A&M! Gerald Tindal, University of Oregon! Joseph Torgesen, Florida State University
Team Leader Edward J. Kame’enui, University of Oregon
http://idea.uoregon.edu/assessment/index.html
19
The Reading First Assessment Committee Identified FourPurposes of Valid and Valuable Assessment Devices
Outcome - Provides a bottom-line evaluation of theeffectiveness of the reading program in relation toestablished performance levels.
Screening - Designed as a first step in identifyingchildren who may be at risk for difficulties and needingadditional services and supports.
Progress Monitoring - Determines through frequentmeasurement if students are making adequateprogress or need more intensive supports toaccelerate learning.
Diagnosis - Helps teachers plan instruction byproviding in-depth information about students’ skillsand instructional needs.
Determining Response to Intervention:Know Your Purpose
20
Determining Response to Intervention
! For eachassessment type, avariety of measureswere evaluated
For eachassessmentconsider thefollowing inselection:
Number ofgrades it can beused with
Price
Time inadministrationand scoring
Number ofalternate forms
http://idea.uoregon.edu/assessment/index.html

21
Determining Response to Intervention
!Useful Assessment Tools:
Screening: For early identification of students
needing increased supports
Progress Monitoring: Formative assessments
such as curriculum-based measurement,
monitoring student response to intervention
Diagnostic: For problem solving when progress
monitoring data warrant further investigation,
possibly assistive in determining special
education eligibility
22
Response to Intervention
! Determining response using a criterion approach:
Student 2: Implication: Continue instructional program and monitor response
Student 1: Implication: Consider changing instructional group or intensifying support,student is not improving as expected
23
Response to Intervention
!Determining response using a idiographic and localnorm approach
Slope to Achieve 11 wk
goal =5.2 words/wk
Slope to Achieve 5 wk
goal =9.6words/wk
Goal 110 WRC in 11 weeks
110-53=57; 57/11=5.17
Goal 110 WRC in 5 weeks
110-62=48; 48/5=9.6
24
Response to Intervention
!Determining response using a idiographic and localnorm approach
Slope to Achieve 11 wk
goal =6.1 words/wk
Goal 110 WRC in 11 weeks
110-43=67; 67/11=6.1

25
Number of Words per Week Minimum MaximumStudents Improvement Progress Progress
Grade 1 19 2.10 .35 4.97
Grade 2 25 1.46 .71 4.00
Grade 3 14 1.08 .43 2.43
Grade 4 16 .84 .47 1.41
Grade 5 20 .49 .04 1.12
Grade 6 23 .32 -.22 .97
Oral Reading Fluency Weekly Progress Data
Fuchs, Fuchs, Hamlett, Walz, & Germann (1993).
Typical ORF Growth Rates
26
Typical ORF Growth Rates
.662176
.582815
1.012594
1.183673
1.665292
1.8010021
General EducationN TotalGrade
Average words per week growth on ORF for students in
General Education (Deno, Fuchs, Marston, & Shin, 2001)
27
What Might RTI implementation look like?
! Tiers or Levels of Instructional Intensity
Level I: General Education: All students
Level II: Standard Protocol Treatments: Smallgroup tutoring (3-5) in general education/Title1/Special Education
Level III: Problem Solving: Targeted individualinterventions in general education/Title 1/SpecialEducation
Level IV: Special education: More intenseservices brought to student
28
TIER 1: CLASS INSTRUCTION FOR READING
Focus
Program
Interventionist
Setting
Grouping
Time
Assessment
For all students
Scientific!based reading instruction and curriculumemphasizing the five critical elements of beginning reading
General education teacher
General education classroom
Multiple grouping formats to meet student needs
90 minutes per day or more
Benchmark assessment at beginning, middle, and end of the academic year

29
Benchmark - At Grade LevelLow Risk93113Tammy
Benchmark - At Grade LevelLow Risk92112Jake
Benchmark - At Grade LevelLow Risk8289Maria
Benchmark - At Grade LevelLow Risk8088Justin
Benchmark - At Grade LevelLow Risk6368Melissa
Benchmark - At Grade LevelLow Risk5964Jesus
Benchmark - At Grade LevelLow Risk4748Jerry
Benchmark - At Grade LevelLow Risk4647Darek
Benchmark - At Grade LevelLow Risk4344Greg
Strategic - Additional InterventionSome Risk4042Mitchell
Strategic - Additional InterventionSome Risk3941Ashley
Strategic - Additional InterventionSome Risk3840Kayla
Strategic - Additional InterventionSome Risk3638Austin
Strategic - Additional InterventionSome Risk2531Jose
Strategic - Additional InterventionSome Risk2328Tiffany
Strategic - Additional InterventionSome Risk2227Timothy
Intensive - Needs Substantial InterventionAt Risk1621Aaron
Intensive - Needs Substantial InterventionAt Risk1419Sheila
Intensive - Needs Substantial InterventionAt Risk46Thomas
Intensive - Needs Substantial InterventionAt Risk21Lee
Intensive - Needs Substantial InterventionAt Risk21John
StatusPercentileScore Instructional Recommendation
Oral Reading Fluency
Name
Which 2nd
graders are in
most need of
instructional
support?
Tier I Screening in General Education
30
TIER 2: SUPPLEMENTAL INSTRUCTION
Focus
Program
Setting
Grouping
Time
Assessment
For students identified with marked reading difficulties, and who have not responded to Tier I efforts
Personnel determined by the school "e.g., a classroom teacher, a specialized reading teacher, an external interventionist#
Appropriate setting designated by the school;may be within or outside of the classroom
Homogeneous small group instruction "1:3, 1:4, or 1:5#
Minimum of 30 minutes per day in small group in additionto 90 minutes of core reading instruction
Progress monitoring twice a month on target skill to ensure adequate progress and learning
Specialized, scientifically based reading program"s# emphasizing the five critical elements of beginning reading
Interventionist
31
Program
Focus
Interventionist
Setting
Grouping
Time
Assessment
For students with marked difficulties in reading or reading disabilities and who have not responded adequately to Tier I and Tier II efforts
Appropriate setting designated by the school
Homogeneous small group instruction "1:1! 1:3#
Minimum of two 30!minute sessions per day insmall group or 1:1 in addition to 90 minutes of corereading instruction.Progress monitoring twice a month on target skills toensure adequate progress and learning
Sustained, intensive, scientifically based reading program"s# emphasizing the critical elements of reading for students with reading difficulties/disabilities
Personnel determined by the school "e.g., a classroomteacher, a specialized reading teacher, an externalinterventionist#
TIER 3: INTENSIVE INTERVENTION
32
So What Comprises an Intervention?
!For RTI to be implemented as intended,
schools will need to design and implement
interventions to meet student’s instructional
needs
Student learning is impacted by the following
" Nature of the instructional programs/materials
" Skills the student currently has and prior instructional
experiences
" Time allocated to instruction
" Fidelity of program implementation

33
Understanding the Learning Environment
!The changing educational arena:
“The ultimate test of the value of specialeducation is that, once identified, children closethe gap with their peers (President’s Commission onSpecial Education, 2003).”
The focus of an RTI approach is on effectiveinstruction and not on eligibility (Fletcher, Coulter,
Reschly & Vaughn, 2004)
We need to put the best of what we know inplace early to maximize success and minimizefailure
Maximizing learning through instruction
34
! Research in the field of education over the past 30 years hascome to a consensus on a great many things, some are thefollowing:
All children can learn
" “Unexpected learning difficulty” is based on the expectationthat all students can learn when provided research-basedinstruction (Fletcher, Coulter, Reschly & Vaughn, 2004)
Certain instructional behaviors are positively associated with
improved student performance regardless of student
characteristics
Essentially, effective instruction boils down into two components:
" Instructional delivery (How to Teach)
" Instructional design (What to Teach)
(Brophy & Good, 1986; Rosenshine & Stevens, 1986;
Vaughn, Gersten, & Chard, 2000)
Understanding the Learning Environment
35
Instructional Delivery Principles Related toAchievement
! Maximizing instructional timeTime spent in active learning is significantly related to higheracademic achievement
Instruction should have students actively engaged inlearning the new skill
" Provide lots of opportunities to respond (e.g.,questioning, choral responding)
" Students should be successful while initially learningthe skill
" Quick pacing of instruction
" Teacher wording is very important to minimize learnerconfusion
" Teachers that monitor progress on a regular basis aremore responsive to learner performance (e.g.,dynamic instruction)
(Brophy & Good, 1986; Carnine, Silbert & Kameenui, 1990; Gettinger, 1995; Greenwood, Hall,
Delquadrie, 1994; Fuchs, Fuchs, Phillips, et al, 1995)36
The Power of CoordinatedInstruction and Intervention
The Bethel Reading Project

37
The Power of Coordinated Intervention: TheBethel School District Story
Bethel School District, Eugene, OR
!Student Enrollment: 5,3107 Elementary Schools
!SES: 45% Free and reduce lunch__(Range 32%-74%)
!Special Education: In Year 1 ofimplementation, 15 percent were receivingservices
!Reading Program: “Eclectic”, at least 6programs used district-wide with multipleprograms used within schools and grades
38
The Power of Coordinated Intervention
!Outcomes Assessment: Oregon State AchievementTest at the end of Grade 3
In year 1 of implementation, 21% did notmeet the minimum proficiency standard
!Screening: Dynamic Indicators of Basic EarlyLiteracy Skills (DIBELS) Oral Reading FluencySkills at the end of Grade 1
In year 1 of implementation, only 22% werereading at a level predictive of later readingsuccess
The district evaluated these data anddecided a change was needed and took
steps to implement.
39
The Power of Coordinated Intervention
!District Goal: All students will be proficientreaders by the end of grade 3
!Steps to Meet this Goal:
Use research to guide practice" Adopt a core reading program with documented
efficacy
" Prioritize and protect reading time
" Implement an assessment system that providestimely feedback on student performance
" Increase instructional efficacy (professionaldevelopment) and efficiency (small, flexible groups)
" Provide professional development for all instructors(teachers and educational assistants)
" Focus on early identification and intervention40
The Power of Coordinated Intervention:Evaluating District Progress Over Time
28% Low risk for reading difficulties
34% Some risk for reading difficulties
38% At risk for reading difficulties
End-of-First Grade ORF Results Prior toImplementing Systemwide Reading Program

41
57% Low risk for reading difficulties20% Some risk for reading difficulties22% At risk for reading difficulties
End of Year Histogram - ORF, First Grade, Year 2After changes in curricular program, instruction, intervention
efforts, and professional development:
The Power of Coordinated Intervention:Evaluating District Progress Over Time
42
Evaluating District Progress Over Time
Cross-Year BoxplotFor more information on Bethel School District’s efforts
see American Educator Fall 2004 issue
After 4 years of sustained, focused effort:
43
The Power of Coordinated Intervention: EvaluatingDistrict Progress Over Time
!Outcomes Assessment: Oregon State AchievementTest at the end of Grade 3
In year 1 of implementation, 21% did not meet theminimum proficiency standard
In year 4 of implementation, 10% did not meet theminimum proficiency standard
2004-05 year, 6% did not meet the minimum proficiencystandard
!Screening: DIBELS Oral Reading Fluency skills atthe end of Grade 1
In year 1 of implementation, only 22% were reading at alevel predictive of later reading success
In year 4 of implementation, 67% were reading at a levelpredictive of later reading success
! Percent of students receiving Special Education serviceshas decreased from 15% to 5% in the same time frame
44
District-Level Results in Iowa
Special Education
placement rates
have reduced by 34%
across this time
period as well.

45
Essential Components to Improve Outcomes
! A core research-based reading program that is delivereddaily for all students
Instructional time that is protected and prioritized
! A continuum of research-based instructional supports tomeet the needs of all learners (i.e., Title, ELL, Special Education)
! A system of assessment tools implemented to makeinstruction more responsive to student learning
Focus on all students
Early identification
Progress monitoring: Is instructionally respectful and relevant
! Using the assessment system to allocate instructionalresources more efficiently
Intensifying instruction strategically, differentiating systematically
! For more information on this district’s continuing effortssee the article titled Practicing Prevention: One District'sSuccess at the following website:
http://www.aft.org/pubs-reports/american_educator/issues/fall04/prevention.htm
46
The Use of Research-Based or Scientifically BasedInterventions
! NCLB Defines Scientifically Based Reading Research as:
(A) applies rigorous, systematic, and objective procedures to obtainvalid knowledge relevant to reading development, reading instruction,and reading difficulties; and
(B) includes research that:
" (i) employs systematic, empirical methods that draw onobservation or experiment;
" (ii) involves rigorous data analyses that are adequate to test thestated hypotheses and justify the general conclusions drawn;
" (iii) relies on measurements or observational methods that providevalid data across evaluators and observers and across multiplemeasurements and observations; and
" (iv) has been accepted by a peer-reviewed journal or approved bya panel of independent experts through a comparably rigorous,objective, and scientific review. (20 U. S. C. § 6368(6))
The greater the needs of the learner, the greater thedemand on instructional tools! (Engelmann & Carnine)
Understanding Scientifically-Based Instruction
47
Understanding Scientifically-Based Instruction
! Questions Districts, Schools, & Interventionists shouldconsider when selecting materials and interventions:
1. Use of rigorous, systematic and empirical methods – Doesthe work have a solid theoretical or research foundation?Does the research clearly delineate how the research wasconducted, by whom it was conducted, and on whom it wasconducted?
2. Adequacy of the data analyses to test the statedhypotheses and justify the general conclusions drawn?Does the research make clear what populations werestudied (i.e., does it describe the participants’ ages, as well as their
demographics, etc.) and does it describe to whom the findingscan be generalized? Does the study provide a fulldescription of the outcome measures?
Modified from the Florida Center for Reading Research (Torgesen, 2004)48
Understanding Scientifically-Based Instruction
! Questions Districts, Schools, & Interventionists shouldconsider when selecting materials and interventions(cont.):
3. Reliance on measurements or methods that provided validdata across evaluators and across measurements– Are thedata based on a single-investigator single-classroom study,or were similar data collected by multiple investigators innumerous locations? Were well-known, valid measuresused in evaluating results? Are the study interventionsdescribed in sufficient detail to allow for replicability? Doesthe research explain how instructional fidelity was ensuredand assessed?
4. Acceptance by a peer-reviewed journal or approved by apanel of independent experts through a comparablyrigorous, objective and scientific review – Has the researchbeen carefully reviewed by unbiased individuals who werenot part of the research study?
Modified from the Florida Center for Reading Research (Torgesen, 2004)

49
!Programs can be categorized into two groups:Scientifically proven —meaning scientific results havealready been published in peer-reviewed journals usingthe previously described scientific rigor
" Right now only 5% or less of the available research evidence onschool reform strategies have clearly demonstrated effects(National Clearinghouse for Comprehensive School Reform, 2003)
Research-based —meaning the methods, content,materials, etc. were developed in guidance from thecollective research and scientific community" “There is an abundance of promotional literature that is often
presented as “evidence.” Buyer beware! Work to the higheststandard possible.” (National Clearinghouse for Comprehensive SchoolReform, 2003)
The responsibility is on each educator to examine and look forevidence before the money is spent and the program imposedon children
Understanding Scientifically-Based Instruction
50
Understanding Scientifically-Based Instruction
! Resources of Different Groups that Have Reviewed aRange of Reading Programs:
Oregon Reading First
" http://oregonreadingfirst.uoregon.edu/index.php
Florida Center for Reading Research
" http://www.fcrr.org/
The What Works Clearing House has reviewed mathprograms and is in the process of reviewing reading programs
" http://www.whatworks.ed.gov/
! Resources for Research-Based ApproachesPeer refereed scientific journals such as Learning DisabilitiesResearch & Practice, Exceptional Children, Journal ofLearning Disabilities, etc.
University of Texas at Austin" http://www.texasreading.org/utcrla/
This is not a complete list; however, the quality of these sources ofinformation is exceptional
51
Classifying Reading Programs:
What is the purpose of the program?
1. Core
2. Supplemental
3. Intervention
Core
Reading Program
Meeting the needs for most
Supplemental
Reading Program
Core
Supplemental
Intervention
Intervention
Reading Program
Supporting the Core Meeting the needs for each
Programs are tools that are implemented by teachers to
ensure that children learn enough on time.
(Vaughn et al. 2001)
Understanding the Purpose of DifferentPrograms—A Continuum of Support
52
Core Program
A core program is the “base” reading program designed
to provide instruction on the essential areas of reading for
the majority of students schoolwide. In general, the core
program should enable 80% or more of students to attain
schoolwide reading goals.

53
One size does
not fit all—
Period!
We may need to supplement or modify, butwe must do it judiciously and systematically.
Supporting the Core Program: IdentifyingGaps
54
Supplemental Programs:
!Support and extend the critical elements of a
core reading program.
!Provide additional, more explicit, instruction
in one or two areas (e.g., phonological
awareness, fluency).
!Provide more instruction or practice in
particular area(s) of need.
55
Intervention Programs:
!Designed for children who demonstrate reading
difficulty and are performing below grade level.
!Provide more explicit, systematic instruction to
accelerate learning and bring the learner to grade-level
performance.
!Specialized, intense, and typically delivered in small
group settings.
!Allows teachers to meet the needs of individual
students who are struggling in their classrooms.
56
Examining the Quality of the Core Program
!RTI is predicated on effective, research-basedprograms and practices in general and supplementalinstructional settings
Districts/Schools need to examine their current materialsto identify strengths and weakness and determine if achange is needed
" Use the reviews and rubrics/metrics by others to assistin the process
There is no “perfect program,” need to identify gaps to befilled
Need to determine the quality of implementation toexamine fidelity
" Time, grouping, delivery of instruction
" May need to plan for additional professionaldevelopment for teachers to maximize efficacy

57
! If the present reading program in a district is notsuccessful with the majority of students, consider:
" Providing additional professional development forteachers
Not a “dump-truck” approach, needs to be ongoingand varied (coaching, observations, trainings)
Assessing the degree of fidelity
" Gathering Materials
Fill identified gaps with supplemental programs
Modify/supplement the existing program
" Selecting a new program
How to choose?
Evaluating Core Programs: Assessing Needs
Incr e
as
i ng
Diffic
ul ty
58
Advantages of Implementing a Core Program
Increasing communication, coordination and learning
! Improving communication
Teachers within and across grades using commonlanguage, instructional principles and objectives tosupport all students
! Improving learning
Provides students a consistent method or approach toreading which is helpful for all students
Provides teachers an instructional sequence of skillpresentation and strategies to maximize student learning
Provides more opportunity to differentiate
instruction when necessary
59
Supplementing the Core: Creating a Continuumof Instructional Support
! If instructional gaps are identified in the core, strategically selectscientifically-based or validated supplemental and intensivereading programs
Oregon Reading First has evaluated over 80 such programsand the reviews are available at:http://oregonreadingfirst.uoregon.edu/SIreport.php
Additional programs have been reviewed by the FloridaCenter for Reading Research and are available at:http://www.fcrr.org/
! Consider the following when selecting materials:
Instructional alignment with the core reading program
Alignment of supplemental and intervention programs witheach other (transitioning from one to the other)
Number of instructional objectives addressed by theprogram (PA only, PA and AP, etc.)
Instructional delivery requirements (time, skill level ofinstructor, group size, professional development, expense,etc.) 60
Additional Information on Programs:http://oregonreadingfirst.uoregon.edu

61
Sample of Supplemental Programs Reviewed toAddress Fluency with Connected Text Reading
Make Selection Based On:--Percentage of Components Adequately Addressed--Number of Grade Levels it Can Address--Alignment with other instructional materials--Need for professional development and expense
This is not a complete list, please refer to the website for additional programs. Fullreview of programs are available at oregonreadingfirst.uoregon.edu . This is simplyan example and not an endorsement of any specific program. 62
Coordinating a Schoolwide Instructional SupportPlan: 3-Tier Instructional Support Plan
Summary of Instructional Support Plan
Time Period
Instructional Recommendation Participation in Core
Supplemental & Intervention Programs
Supplemental and Intervention Program Delivery
Determining Instructional Effectiveness (DIBELS Progress
Monitoring)
Primary / Benchmark:
Who: When: Activities: Group Size:
Who: When:
____ w/in 90 minutes ____ outside of 90 min
Time: Group Size:
Who: How Often: Criteria:
Secondary / Strategic:
Who: When: Activities:
Group Size:
Who: When:
____ w/in 90 minutes ____ outside of 90 min
Time: Group Size:
Who: How Often: Criteria:
Fall to
Winter
Tertiary / Intensive:
Who: When: Activities: Group Size:
Who: When:
____ w/in 90 minutes ____ outside of 90 min
Time: Group Size:
Who: How Often: Criteria:
Grade: ______
63
Coordinating a Schoolwide Instructional SupportPlan: Taking Stock of Current Materials
! Before considering purchasing new materials/programs,take stock of materials in the building
Identify areas of need, make a multi-year plan to improve supportsfor the building
Document range of materials to ensure materials are available foruse across the building
64
Essential Features of Interventions
! Interventions must increase the intensity of instruction
More time, smaller groups, consistent teacher wording
Target essential skills, more focused to accelerate learning ofkey skills (teaching less more thoroughly)
Differentiated to the instructional needs of the learner
! Interventions must be regularly monitored to be responsive tostudent learning
Progress monitoring must be frequent, evaluated, andresponded to
! Interventions must be skillfully deliveredAt risk students require clear explanations, systematic practice,and effective error correction, good pacing
Professional development is critical
! Interventions must be coordinated at the school level
Principal and all instructional staff must be involved toorchestrate resources and staff to students or grades most inneed

65
Alterable Variables to Intensify InstructionSystematically
Alterable
Components Level of Specific Enhancements
Options 1 2 3 4 5
ProgramEmphasis
Use coreprogram &
explicitly teach
priority skills.
Useextensions
of the core
program(e.g., add
examples)
Supplementcore with
reteaching or
interventioncomponents
of core.
Replacecurrent core
program with
interventionprogram.
Implementspecially
designed
program
Time
(Opportunitiesto Learn)
Schedule &
deliver 90minutes of daily
reading
instruction
(minimum 30minutes small
group).
Increase
opportunitiesto respond
during core
instruction.
Schedule
core +supplementa
l period
daily.
(90 + 30 or60 + 30)
Schedule two
interventionsessions daily
(no less than
90 minutes
total)
Grouping for
Instruction
Check group
placement &provide
combination of
whole & smallgroup instruction.
Schedule
small groupopportunity
for specific
practice
Reduce
group size
Provide
individualinstruction
Incre
asin
g In
ten
sity
Increasing Intensity 66
Example: 4th Grader, Jesse
!Area of concern: Reading skills is muchlower than his peers, difficulty completingwork independently
!History: Teacher reported student has goneto 4 schools in five years and had previouslybeen referred for SST but moved prior to themeeting, good attendance currently, studentis still motivated but becoming frustrated
!Assessment: Determine overall readingskills using the Multilevel Academic SkillsInventory-Revised (MASI-R) and ORF
67
80%Criterion
97%
(40 out of 42)
Mazes
(comprehension)
140wpm140wpm100wpmCriterion
53 wpm
(82% accuracy)
84 wpm
(89% accuracy)
135 wpm
(94% accuracy)
Reading Passage
(decoding)
100%100%Criterion
65%100%Word List
(word recognition)
Curriculum Level 4Curriculum Level 3Curriculum Level 2
Component
Comparing his Performance to What IsExpected
! Implications: Good comprehension, adequate sight
word reading, but slow rate in reading connected
text
68
Assessing Fluency: DIBELS ORF Jesse,4th Grade
! How well is Jessereading?
Accurate but slow
! How accurately canhe perform the skill?
90%
! Readiness forfluency instruction?
Fluency buildingand sight wordinstruction maybe appropriate
WRC=53

69
! Question: If provided with additional instruction in connectedtext reading (fluency building) would his skills generalize toimproving in-class performance?
! Intervention: Focused on providing additional instruction onconnect text reading (i.e., fluency development; Steps taken fromHowell & Nolet, 2001)
Twice each day (after coming in from recess) Jesse did arepeated reading intervention
1. Student would read for 1-min. from a set of passages that he canread with good accuracy (>90%) and count the number of wordscorrect on the cold (initial) reading
2. Set a goal that is between 20-40% higher than the obtained coldrate and make a mark on the passage to indicate the student’sgoal
3. Student would time himself using a timer to see how many timeshe needed to read the passage to meet the goal
4. Student would chart his progress (# of readings and WRC)
Start with a simple, doable, research-basedintervention first
Investigating Alterable Variables
70
Monitoring Response to Intervention
Johnny's Reading Progress
8682
91
98
105 105
120
127
115
130
140145
150
0
20
40
60
80
100
120
140
160
180
Nov. 3 Nov. 10 Nov. 17 Nov. 24 Dec. 1 Dec. 9 Dec. 17 Dec. 22 Jan. 6 Jan. 14 Jan. 21 Jan. 28 Feb. 6
Dates of Progress Monitoring
Wo
rds R
ead
Co
rrectl
y
Goal: 140 WRC by the end of January
71
Implementing the Intervention
!Maximizing Intervention Success is dependent on:
Communication & Coordination: Do all involved parties
know what they are supposed to do, when to do it, and
how to do it?
Materials: Are the materials research-based? Are the
necessary materials available for implementation? Do
people know how to deliver the intervention?
Support: Do parties know how to get questions
answered in case they arise?
Ongoing Evaluation: Who will be regularly monitoring
student progress and evaluating the effectiveness of
the intervention?
" SST/Intervention Monitoring Team72
Accelerating Learning Rates: Instructionaland Curricular Features of Intensive ThirdTier Intervention Efforts With SecondGraders
Project CIRCUITS: Center for Improving ReadingCompetence Using Intensive Treatments Schoolwide
Beth Harn, David Chard, Edward Kame`enui, andKristen MacConnell
Center on Teaching and LearningUniversity of Oregon
Project Funded By Office of Special Education Programs Grant No. H324X010014,U.S. Department of Education

73
Model Demonstration Project
!Goal of Project CIRCUITS is to assist schools inbuilding capacity and sustainability of a three-tierprevention model (schoolwide reading) by:
Using schoolwide assessment data in early literacy
skills to identify students at risk for reading difficulties,
make instructional decisions, and monitor progress
Implementing research-based interventions at the
secondary and tertiary levels for students at risk for
reading difficulties
Providing professional development to school staff to
implement interventions effectively
74
Bethel
Carl ColeDrew Braun
Rhonda Wolter
Tigard-Tualatin
Carol SadlerPam Zinn
Janice Best
Jennifer Duncan
CIRCUITS
Principal Investigators
David Chard
Beth Harn (Co-PI)
Previously Edward Kame`enui & Roland Good
Project Manager
Tanya Sheehan
Research Coordinator
Beth Harn
Data Analysis
Mike Stoolmiller
Intervention
David Chard
Kristen MacConnell
Jeanie Smith
Ginger Reece
Danielle Parisi
Assessment
Annie Hommel
David Larsen
Leslie Simmons
Data Management
Patrick Paine
Data Scoring / Entry
David Larsen
Leslie Simmons
Annie Hommel
CCE Center OSEP
Project CIRCUITS Personnel & Partners
75
Three-Tier Prevention Model: SchoolwideReading Approach
!Primary Prevention: to reduce the numberof new cases (incidence) of severe difficultylearning to read
!Secondary Prevention: to reduce theduration of existing cases (prevalence) ofsevere difficulty learning to read
!Tertiary Prevention: to reducecomplications from established cases ofsevere difficulty learning to read
76

77
Summary of Studies Completed So Far:
! Year 01 (2002-2003): Examined the features, components, andcharacteristics of primary, secondary, and tertiary interventions (andpreventions) in grades K-1 and determined which features were highlyrelated to student reading performance.
! Year 02 (2003-2004): Examined the efficacy of first gradeinterventions (secondary and tertiary) specifically designed to parallel oralign with the primary core reading program compared to schools thatemployed programs that may not directly align with the core readingprogram.
! Year 03 (2004-2005): Interventions for second grade:
Secondary: Examined the role of repeatability or “control” ofword use in text to enhance reading fluency
Tertiary: Examined variables necessary to intensify instructionto accelerate learning for significantly at-risk readers
78
Focus of Year 3: Accelerating Learning Rates
!What are the effects of a standardized
tertiary intervention protocol on end-of-
second grade reading performance on
normative and criterion-referenced
measures of reading proficiency as
compared to school-determined
interventions?
Accelerating learning rates through research-based
programs implemented with intensity and fidelity
Programs reported were used in this particular project and are notreported to advocate, promote, or endorse their use.
79
Accelerating Learning Rates
! Students requiring third tier instructional support: Studentsreading less than 20 ORF
Project Implemented Intervention Students
" 17 students across 5 schools
School Implemented Intervention Students
" 18 students across 4 schools
! Nature of Instructional Program Selected to AccelerateLearning
Research-based, explicit, systematic: Reading Mastery, FastCycle, and added Read Naturally in February to increase timereading connected text
! Nature of Intervention Efforts
Small group instruction (i.e., 1-4) based on instructional needs
Began November 1 and continued all year
Groups modified as data and instructional needs warranted
Programs reported were used in this particular project and are notreported to advocate, promote, or endorse their use. 80
Features Used to Intensify Instruction
!Purposeful Instructional Design & Delivery
!Prioritized Content
!Protected Time & Grouping
!Performance Monitoring

81
Purposeful Instructional Design & Delivery
!Characteristics of Reading Mastery & Fast Cycle:Explicitness of Instructional Language" Scripted lessons, correct procedures, etc.
Careful design and sequence of skill introduction, practice,and review" Explicit scope and sequence
" Careful selection used in “skip-cycle” of skills within Fast Cycle
!Characteristics of Read NaturallyStructured and systematic approach to building fluency inreading connected text
Additional explicitness in implementation provided toincrease consistency and fidelity of implementation (i.e.,Power Reading)
Programs reported were used in this particular project and are notreported to advocate, promote, or endorse their use. 82
Prioritized Content
!Need to teach less more thoroughlyReading Mastery / Fast Cycle" Letter-sounds
" Essential irregular words
" Whole word reading
" Reading words in sentences and short stories
" Reading and comprehending passages
Accelerating Students Through Program" Teachers completed at least 3-4 lessons/day depending on
level of RM
!Read Naturally (added Late Feb or March)Repeated reading procedure in passages they can readwith high accuracy
Building range of successful, fluent reading experiences(vocabulary, text type, word types)
Programs reported were used in this particular project and are notreported to advocate, promote, or endorse their use.
83
Protected Time & Grouping
! Increasing time in intensive instructional arrangementson prioritized skills
Each student received 2 – 45 minute periods of small groupinstruction (less than 5)
" Increases opportunities to respond and feedback from teacher
Grouped according to skill level
Instructors have specialized skill or receive increased support
! Time spent in general education carefully chosen forstudents to benefit and be successful (i.e. vocabulary,spelling and oral comprehension exercises)
Expectation is that groups will not be canceled (e.g.,assemblies, etc.)
84
Performance Monitoring
! Formative Evaluation
Monthly project-collected data using NWF and ORF
Districts and schools also collect data twice a month
Increased to 2xWeek after Adding RN
! Mastery Measurement
Reading Mastery has built-in checkouts to determine
mastery of skills and readiness for the next skill introduction
! Responding to Student Learning
When Progress Monitoring Data indicated limited growth for
the individual, coach reviewed checkouts and rearranged
groups (lesson #, instructor) when necessary
Programs reported were used in this particular project and are notreported to advocate, promote, or endorse their use.

85
Tertiary Progress Monitoring on ORF by Sub-Group
0
5
10
15
20
25
30
35
40
45
50
55
60
65
Fall Bench
Nov
1
Nov
8
Nov
15
Nov
22
Nov
29
Dec
6
Dec
13
Dec
20
Dec
27
Jan 3
Jan 1
0
Win
ter B
ench
Jan 2
4
Feb 1-4
Feb 7
Feb 14-1
8
Feb 21
Feb 28 M
ar 2
Mar 7
-8
Mar 1
7-18
Mar 3
1 Apr 1
Apr 7-8
Apr 14-1
5
Apr 21-2
2
Apr 28-2
9
May
5-6
May
11-13
Date
CW
PM
Phase A (n=10) Phase B (n=6) Comparison (n=10)
Phase Shift with RN for
Group A
Phase Shift with RN for
Group B
Start of Intervention
Feb 28-Apr 28 Slopes(words per/wk)
A= 2.58B= 2.22C= 1.92
Sep-Feb 14 Slopes(words per/wk)
A = 1.10B = .94C = 1.08
Year-Long PM on ORF by Sub-Group
86
Evaluating Response to Intervention &Determining Need for Intervention Modifications
Mrs. J's Morning 2nd Grade Group ORF Progress
0
10
20
30
40
50
60
70
80
90
Jan
17-1
8
Jan
20-2
1
Jan
24-2
5
Jan
27-2
8
Feb 1
- 2
Feb 3
-4
Feb 1
4-15
Feb 1
7-18
Feb 2
8 M
ar 2
Mar
3
- 4
Mar
7
- 8
Mar
14-
16
Mar
17-
18
Mar
28-
30
Mar
31
Apr 1
Apr
4 - 5
Apr
7 - 8
Apr 1
1-13
Apr 1
4-15
Apr 1
8-19
Apr 2
1-22
Apr 2
5-27
Apr 2
8-29
Date
Co
rrect
WP
M
Kelly Terri John Jose
Added Fluency ComponentPhonics & Reading Intervention
Trendline: Slope=4 Word/wk
Trendline: Slope=1.38 Word/wk
Trendline: Slope= .5 Word/wk
Trendline: Slope= -1.2Word/wk
87
Current Implications
!Professional development is critical
Professional development/Training in using
program/materials
Continual support in implementation—instructional
consultation/coaching
" Responding to student growth (ORF and NWF)
" Increasing instructional/intervention efficiency
!Implementing within the school context
" Personnel, scheduling, groupingBased on student performance, some groups need to be re-arranged
" Coordination of instruction across general and remedial
supports (i.e., Title and Special Education)
88
Current Implications
!Next steps with these students?Range of skill performance (all started between 7-17 inFall)" ORF 31-40 = 4 students (3 of 4 receiving SPED)" ORF 41-60 = 6 students (3 of 6 receiving SPED)" ORF 61-78 = 7 students (5 of 7 receiving SPED)
49.67 (12.09)55.56 (18.57)ORF
96.17 (5.78)95.63 (7.79)Tot. Read SS
96.58 (6.74)94.50 (7.45)Pass Comp SS
104.25 (10.77)100.63 (9.52)Word At SS
96.92 (4.85)97.31 (7.02)Word Id SS
School ImplementedProjectImplementedMeasure
(SS=Standard Scores, mean=100, SD=15)
Effect size of .83 (large)

89
Coordinating Schoolwide Efforts to ImproveOutcomes for All
! As educators we need to stop making predictions aboutstudent performance and start making a difference (Ysseldyke,
2001)
Current educational efforts (IDEA 2004, No Child Left Behind,
Reading First) offer a prime opportunity for schools to moveaway from the traditional approach to service delivery
! Focusing on the essential components of successfulschoolwide improvement (Borman, et al., 2003)
Addresses the system to provide focus for all personnel’seffortsFocuses on clearly articulated goals and student outcomesResponsive assessment system to provide feedback oneffortsLong-term commitment to research-based practicesKnowledgeable and effective leaders
90
Taking Stock & Next Steps
! Assessing the Quality of What is in place:1) Tier 1: General Education Implementation
" Research-based core program implemented with fidelity,time allocated to instruction is adequate, multiple groupingstructures utilized, data indicate the instruction is meetingthe needs of approximately 80% of the students
2) Schoolwide Assessment System" Screening process for identifying students needing support,
data utilized to differentiate instruction in general education,progress monitoring to asses efficacy of interventions,diagnostic assessments used when response is notadequate and further problem-solving is necessary
3) Tier 2 & 3: Coordinated Instructional Support System" Determine the quality of programs, time, grouping,
instructional intensity of supports in Title, Special Education,English Language Learners, etc.
4) Teaming and System-Level Decision Making" School-level decision making process for coordinating and
allocating resources (reviewing school and student-leveldata, personnel needs, material purchases, andprofessional development)
91
! The Planning and Evaluation Tool (PET) is designed to helpschools “take stock” of their strengths and areas ofimprovement in developing a schoolwide beginning readingplan.
Similar to the SET for implementing PBIS
! It is a subjective evaluation form for schools to ratethemselves for planning in the following areas:
! Goals/Objectives/Priorities, Assessment, Instructional Practices
and Materials, Instructional Time, Differentiated
Instruction/Grouping, Administration/Communication, Professional
Development
This will discussed in the other sessions as well and is
available online at:
http://oregonreadingfirst.uoregon.edu/downloads_gen.php
! Technical Assistance Paper:
http://www.ode.state.or.us/initiatives/idea/orrtiguidancetigardsd.doc
Planning & Evaluation Tool
92
Concluding Thoughts
! The specifics of what RTI will “look like” has yet to bedetermined
Oregon still needs to develop regulations interpretingfederal policy
" Issues needing clarification:
What is adequate response and for how long?
What are research-based interventions?
What level of fidelity is necessary in determining ifinterventions were implemented as expected?
Who provides the interventions?
" Focus is now on providing effective instruction tostudents rather than on identifying students in a wait-to-fail approach
" RTI may provide a “seamless, unified system” ofinstructional support by integrating general andspecial education systems

93
Conclusions
! “If we always do what we have always done, we will alwaysget what we have always gotten.” (unknown)
Focus on the variables that we can change that arerelated to student success:
" Instructional and curricular variables
Intervene prior to significant student failure to preventserious motivational and behavioral concerns fromdeveloping" IDEA 2004 allocates 15% of funds to “early intervening”
services to non-identified students (including materials andpersonnel)
! Well designed instruction is the best weapon againstlearning failure and the best resource available
“We have an obligation to think of students as difficult to teachbefore we label them as unable to learn (Fletcher, Coulter, Reschly,& Vaughn, 2004, p. 328)”
94
Additional Instructional Resources! Bos, C. S. & Vaughn, S. (2002). Strategies for Teaching Students with
Learning and Behavior Problems (Fifth edition). Boston, M.A.: Allyn.
! Deschler, D., Ellis, E., Lenz, K. (1996). Teaching adolescents with learningdisabilities (2nd Edition). Denver, CO: Love Publishing Company
! Foorman, B. R. & Torgesen, J. (2001). Critical Elements of Classroom andSmall-Group Instruction to Promote Reading Success in All Children,Learning Disabilities Research and Practice, 16, 203-121.
! Howell, K. & Nolet, V. (2000). Curriculum-based evaluation: Teaching anddecision making (3rd edition). Stamford, CT: Wadsworth Publishing
! Kameenui, E.J., Carnine, D. W., Dixon, R.C., Simmons, D.C., & Coyne,M.D. (2002). Effective teaching strategies that accommodate diverselearners (2nd edition). Upper Saddle River, NJ: Merrill Prentice Hall
! Shinn, M., Walker, H., & Stoner, G. (2002). Interventions for Academic andBehavior Problems. Washington DC: NASP Publications
! Stanovich, P. & Stanovich, K (2003). Using Research and Reason in EducationHow Teachers Can Use Scientifically Based Research to Make Curricular &Instructional Decisions. Available at:http://www.nifl.gov/partnershipforreading/publications/html/stanovich/
! Sugai, G. & Tindal, G. (1993). Effective school consultation: An interactiveapproach. Pacific Grove, CA: Brooks/Cole Publishing Company
! Vaughn, S., Linan-Thompson, S., & Hickman, P. (2003). ExceptionalChildren, 69, 397-415.
95
Additional Useful References
! Biancarosa, G., & Snow, C. (2004). Reading Next—A Vision for Action andResearch in Middle and High School Literacy: A Report from CarnegieCorporation of New York. Washington, D.C.: Alliance for Education.
! Borman, G. D., Hewes, G., Overman, L., & Brown, S. (2003). ComprehensiveSchool Reform and Achievement: A Meta-Analysis, Review of EducationalResearch, 73, 125-230.
! Fooman, B. R. (2003). Preventing and Remediating Reading Difficulties:Bringing Science to Scale. Baltimore, MD: York Press.
! Learning Disabilities Research & Practice (2003), Volume 13 Special Issueon RTI
! Kame’enui, E. J., Good, R. & Harn, B.A. (2005). “Beginning Reading Failureand the Quantification of Risk: Reading Behavior as the Supreme Index,” inFocus on Behavior Analysis in Education: Achievements, Challenges, andOpportunities. Edited by W. Heward; T. Heron; N. Neef; S. Peterson; D.Sainato; G. Cartledge; R. Gardner; L. Peterson; S. Hersh;
! Salvia, J. & Yssledyke, J. (2003). Assessment in special and inclusiveeducation (9th Edition). New York: Houghton Mifflin
! Shaywitz, S. (2003). Overcoming dyslexia: A new and complete science-based program for reading problems at any level. New York: KnoffPublishing.
! Shinn, M. (1998). Advanced Applications of curriculum-based measurement.New York: Guilford Press.
! Torgesen, J. K. (2002). The Prevention of Reading Difficulties, Journal ofSchool Psychology, 40, 7-26.
96
Websites for Additional Information
Institute for the
Development of Educational Achievement (IDEA)
IDEA Beginning Reading
Dynamic Indicators of
Basic Early Literacy (DIBELS)
http://dibels.uoregon.edu/
http://reading.uoregon.edu/
http://idea.uoregon.edu/
Oregon Reading Firsthttp://oregonreadingfirst.uoregon.edu

![discrepancy · tooth size discrepancy is rather high. Some researchers have established a relationship between tooth size discrepancy and malocclusion, such as [16], [13], [17] and](https://img.pdfslide.net/doc/110x75/5ea308cad574a31a0f083034/discrepancy-tooth-size-discrepancy-is-rather-high-some-researchers-have-established.jpg)