Embed Size (px)
DESCRIPTION
The Acoustics Research Group of Brigham Young University analyzed Server room of one of the C7 Data Centers Co-location Lindon 5 Facility in 2010. Results show a significant amount of sound power below 500Hz and EDT's between 0.25-3.20 seconds depending on location. For more information on C7 Data Centers, check - http://www.c7.com/data-center/
Citation preview
Brigham Young University
Acoustical Analysis of Active Control inthe Server Room of a C7 Data Centers
Colocation Facility
Feasibility Report
Advisor:Dr. Scott Sommerfeldt
C7 Data Centers representative:Mike Maughan
Group Leaders:Jesse Daily
James EsplinZach Collins
Matthew Shaw
June 21, 2010
Contents
1 Executive Summary 2
2 Introduction 2
3 Methods 33.1 Data Collection . . . . . . . . . . . . . . . . . . . . . . . . . . . . . . . . . . 3
Room Acoustic Measurements . . . . . . . . . . . . . . . . . . . . . . . . . . 3Noise in the Server Room . . . . . . . . . . . . . . . . . . . . . . . . . . . . 5
3.2 Computational Simulations . . . . . . . . . . . . . . . . . . . . . . . . . . . 6Governing Equations . . . . . . . . . . . . . . . . . . . . . . . . . . . . . . . 6Computational Model Results . . . . . . . . . . . . . . . . . . . . . . . . . . 8
3.3 Experimental Testing . . . . . . . . . . . . . . . . . . . . . . . . . . . . . . . 11Methods . . . . . . . . . . . . . . . . . . . . . . . . . . . . . . . . . . . . . . 11Results . . . . . . . . . . . . . . . . . . . . . . . . . . . . . . . . . . . . . . . 12
4 Conclusion 154.1 Summary . . . . . . . . . . . . . . . . . . . . . . . . . . . . . . . . . . . . . 154.2 Conclusions . . . . . . . . . . . . . . . . . . . . . . . . . . . . . . . . . . . . 174.3 Recommendation . . . . . . . . . . . . . . . . . . . . . . . . . . . . . . . . . 18
5 Contact Information 18
1
Feasibility Report
1 Executive Summary
C7 Data Centers provides colocation, virtualization and disaster recovery services andwanted to explore the possibility of applying active noise control technology to reduceambient noise in the data center server room. Active noise control uses loud speakers andmicrophones to observe the acoustical environment to emit an “inverse” sound signal tocancel out the noise. Three methods were used to determine the feasibility of using activenoise control inside the data center server room: measured acoustical data, computationalmodeling, and experimental testing.
For the measured data, four measurement locations were considered: inside the data centerentrance door, in front of a C7 Data Centers cage near the center of the room, in a “hotrow” aisle and inside a “cold row” aisle. Two different computational simulations wereperformed, the first determined the effect of using a simplified “best-case” scenario model,and the second used a more complex model. Finally, an experimental test was constructedto determine if active noise control is feasible for the C7 Data Centers Lindon 5 serverroom.
The culmination of our results indicates that active noise control over an extended regionis not possible in the data center room in general. This is due to the random nature ofthe noise and the high modal density of the room itself. However, our results indicate thatactive noise control may be feasible inside the cold row aisle, given that modest control(2-4dB) was achieved in laboratory experiments.
2 Introduction
C7 Data Centers has been proactive in seeking out new technologies to make the datacenter experience more enjoyable for their customers. Reducing ambient noise on the datacenter floor isnt necessarily a need, but more of an interest to see whether somethingminimally invasive could be done to counter-act the noise. The C7 Data Centers Lindon
2
5 data center, as is typical of data centers, has little acoustic absorption. The common,passive forms of acoustical absorption, such as foam or fiberglass panels were not employedas they contain materials which are highly flammable and give off particulates that couldtrigger the early warning fire detection systems.
Active noise control (ANC) was considered as it uses loud speakers and microphones toobserve the acoustical environment and then emits an “inverse” sound signal to attenuatethe noise. Since active control does not use fibrous materials, it may be the ideal solutionfor reducing low frequency noise in the server room. To determine if active control isfeasible, acoustic data of the server room was used in concert with computational modelsand experimental testing.
3 Methods
Three methods were used to determine the feasibility of using active control in a C7 DataCenters server room: measured acoustical data, computational modeling, and experimen-tal testing. Taking acoustical data of the server room yielded valuable information on theacoustic characteristics of the room and of the noise emitted by the servers and HVAC.The recorded noise was then used in computational models of the room. These modelsimulations were used to estimate the effect that active noise control might have on elim-inating unwanted sound. Finally, an experimental active control mockup was made todetermine if a physical solution was feasible and to validate or invalidate the computa-tional model.
3.1 Data Collection
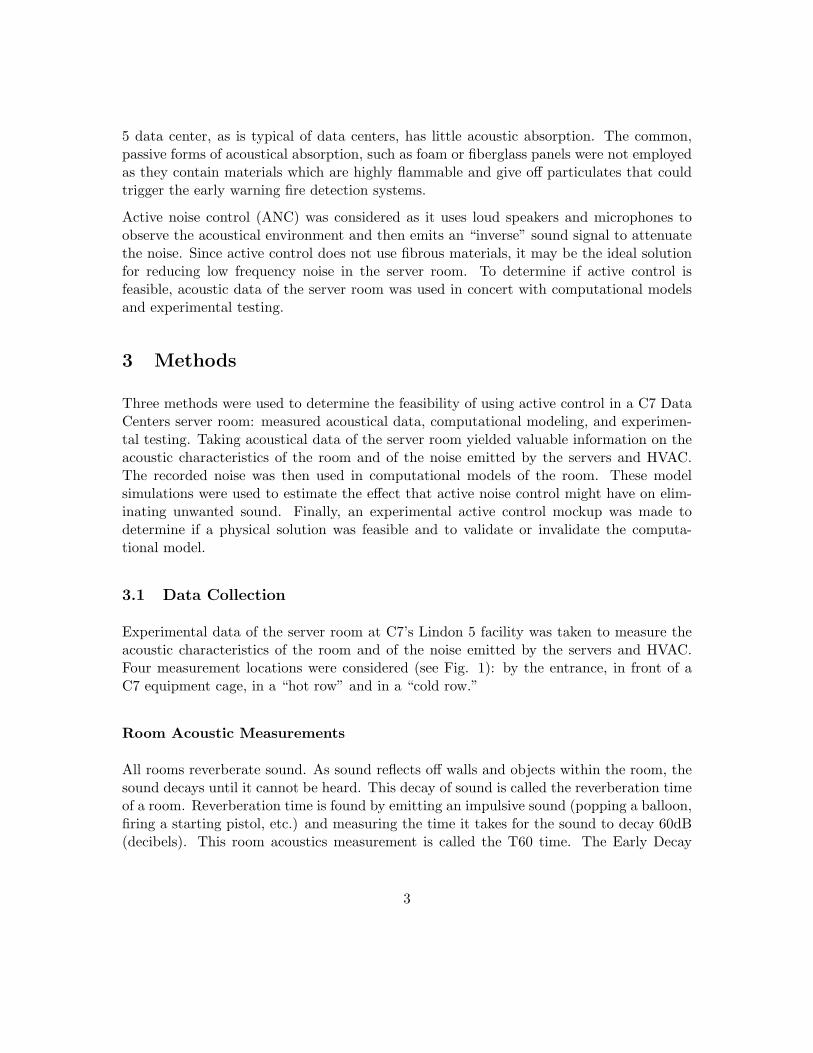
Experimental data of the server room at C7’s Lindon 5 facility was taken to measure theacoustic characteristics of the room and of the noise emitted by the servers and HVAC.Four measurement locations were considered (see Fig. 1): by the entrance, in front of aC7 equipment cage, in a “hot row” and in a “cold row.”
Room Acoustic Measurements
All rooms reverberate sound. As sound reflects off walls and objects within the room, thesound decays until it cannot be heard. This decay of sound is called the reverberation timeof a room. Reverberation time is found by emitting an impulsive sound (popping a balloon,firing a starting pistol, etc.) and measuring the time it takes for the sound to decay 60dB(decibels). This room acoustics measurement is called the T60 time. The Early Decay
3
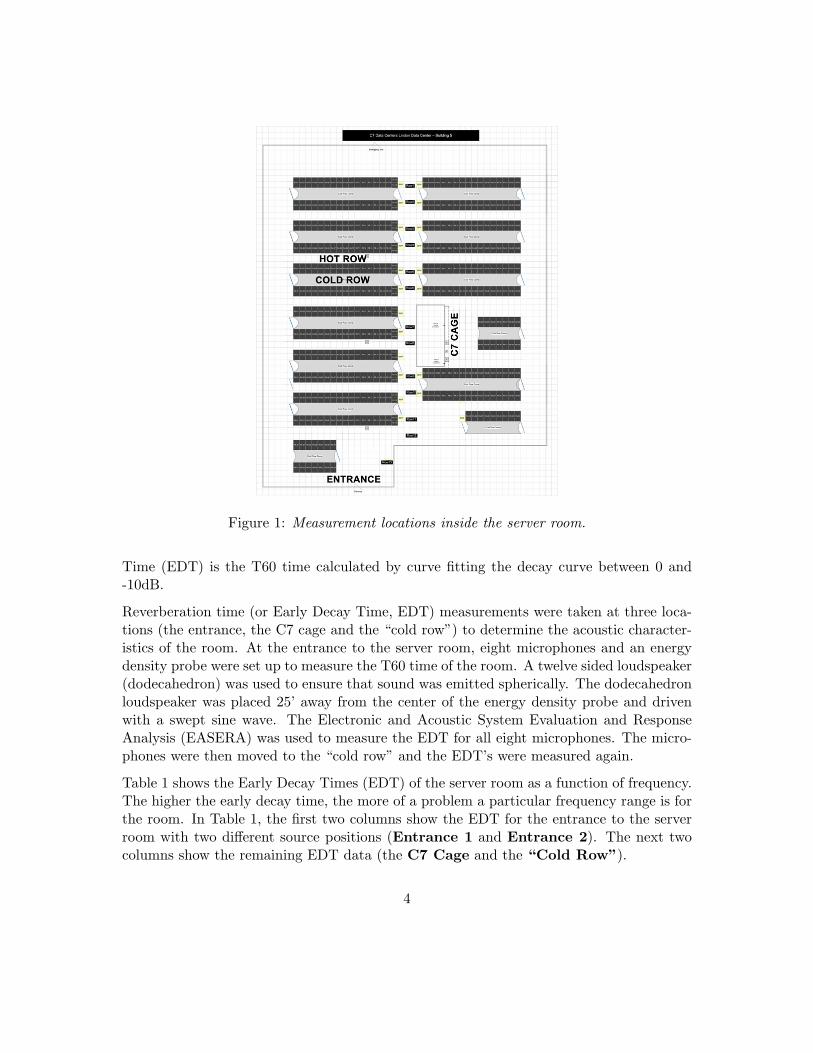
Figure 1: Measurement locations inside the server room.
Time (EDT) is the T60 time calculated by curve fitting the decay curve between 0 and-10dB.
Reverberation time (or Early Decay Time, EDT) measurements were taken at three loca-tions (the entrance, the C7 cage and the “cold row”) to determine the acoustic character-istics of the room. At the entrance to the server room, eight microphones and an energydensity probe were set up to measure the T60 time of the room. A twelve sided loudspeaker(dodecahedron) was used to ensure that sound was emitted spherically. The dodecahedronloudspeaker was placed 25’ away from the center of the energy density probe and drivenwith a swept sine wave. The Electronic and Acoustic System Evaluation and ResponseAnalysis (EASERA) was used to measure the EDT for all eight microphones. The micro-phones were then moved to the “cold row” and the EDT’s were measured again.
Table 1 shows the Early Decay Times (EDT) of the server room as a function of frequency.The higher the early decay time, the more of a problem a particular frequency range is forthe room. In Table 1, the first two columns show the EDT for the entrance to the serverroom with two different source positions (Entrance 1 and Entrance 2). The next twocolumns show the remaining EDT data (the C7 Cage and the “Cold Row”).
4
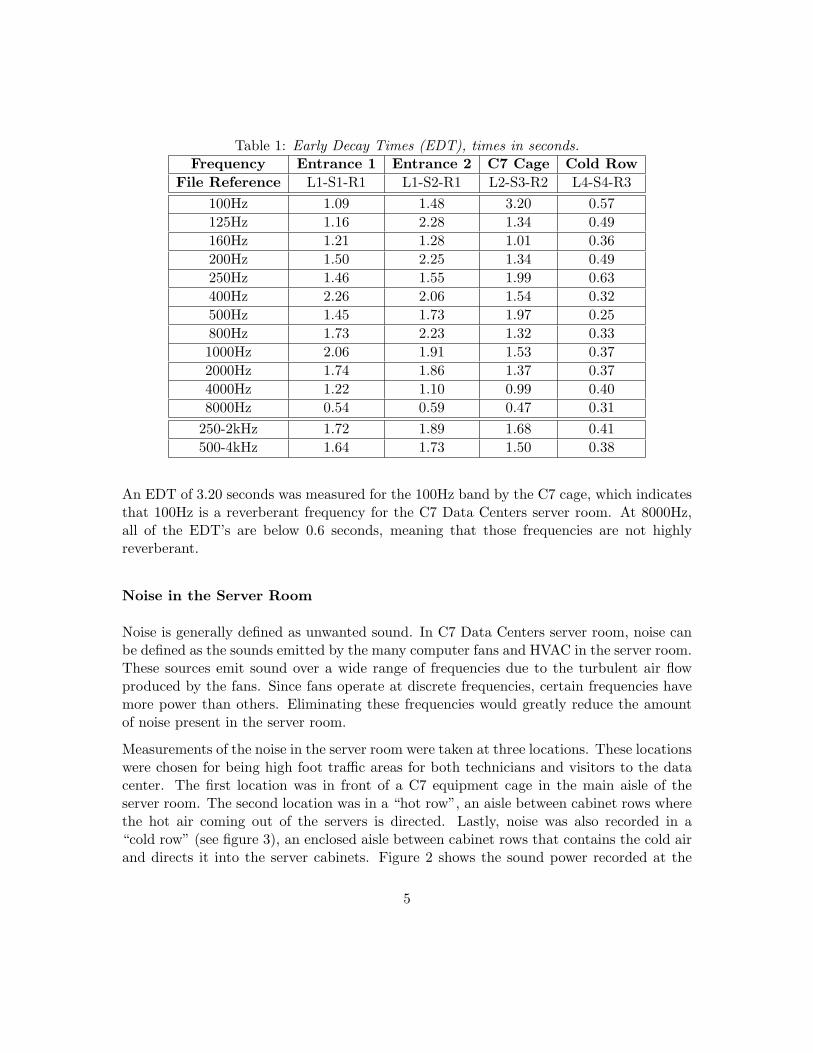
Table 1: Early Decay Times (EDT), times in seconds.Frequency Entrance 1 Entrance 2 C7 Cage Cold Row
File Reference L1-S1-R1 L1-S2-R1 L2-S3-R2 L4-S4-R3100Hz 1.09 1.48 3.20 0.57125Hz 1.16 2.28 1.34 0.49160Hz 1.21 1.28 1.01 0.36200Hz 1.50 2.25 1.34 0.49250Hz 1.46 1.55 1.99 0.63400Hz 2.26 2.06 1.54 0.32500Hz 1.45 1.73 1.97 0.25800Hz 1.73 2.23 1.32 0.331000Hz 2.06 1.91 1.53 0.372000Hz 1.74 1.86 1.37 0.374000Hz 1.22 1.10 0.99 0.408000Hz 0.54 0.59 0.47 0.31
250-2kHz 1.72 1.89 1.68 0.41500-4kHz 1.64 1.73 1.50 0.38
An EDT of 3.20 seconds was measured for the 100Hz band by the C7 cage, which indicatesthat 100Hz is a reverberant frequency for the C7 Data Centers server room. At 8000Hz,all of the EDT’s are below 0.6 seconds, meaning that those frequencies are not highlyreverberant.
Noise in the Server Room
Noise is generally defined as unwanted sound. In C7 Data Centers server room, noise canbe defined as the sounds emitted by the many computer fans and HVAC in the server room.These sources emit sound over a wide range of frequencies due to the turbulent air flowproduced by the fans. Since fans operate at discrete frequencies, certain frequencies havemore power than others. Eliminating these frequencies would greatly reduce the amountof noise present in the server room.
Measurements of the noise in the server room were taken at three locations. These locationswere chosen for being high foot traffic areas for both technicians and visitors to the datacenter. The first location was in front of a C7 equipment cage in the main aisle of theserver room. The second location was in a “hot row”, an aisle between cabinet rows wherethe hot air coming out of the servers is directed. Lastly, noise was also recorded in a“cold row” (see figure 3), an enclosed aisle between cabinet rows that contains the cold airand directs it into the server cabinets. Figure 2 shows the sound power recorded at the
5
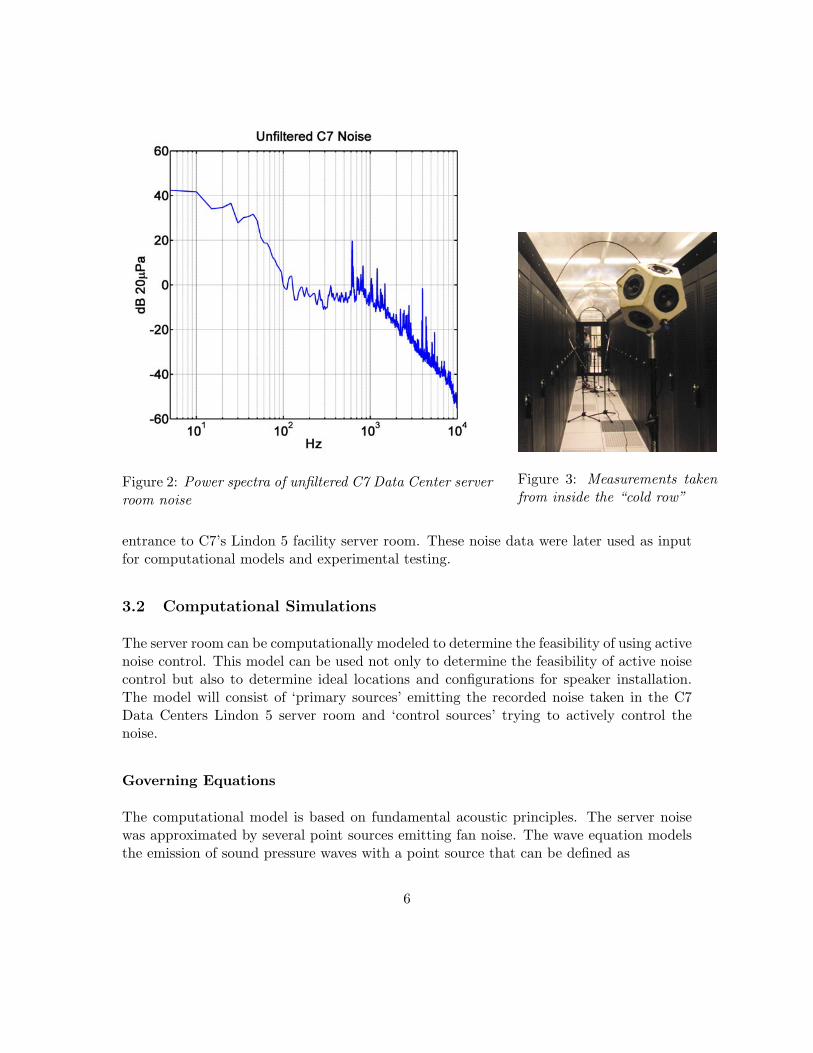
Figure 2: Power spectra of unfiltered C7 Data Center serverroom noise
Figure 3: Measurements takenfrom inside the “cold row”
entrance to C7’s Lindon 5 facility server room. These noise data were later used as inputfor computational models and experimental testing.
3.2 Computational Simulations
The server room can be computationally modeled to determine the feasibility of using activenoise control. This model can be used not only to determine the feasibility of active noisecontrol but also to determine ideal locations and configurations for speaker installation.The model will consist of ‘primary sources’ emitting the recorded noise taken in the C7Data Centers Lindon 5 server room and ‘control sources’ trying to actively control thenoise.
Governing Equations
The computational model is based on fundamental acoustic principles. The server noisewas approximated by several point sources emitting fan noise. The wave equation modelsthe emission of sound pressure waves with a point source that can be defined as
6
∇2p̂− 1c2∂2p̂
∂t2= −Q0(t)δ(r − r0), (1)
where Q0(t) is the volume velocity of the point source. The pressure p̂ is the pressure fieldin the volume and can be characterized as the sumed response of all the point sources.
p̂ =Nmax∑N=1
qNψN (2)
The variable qn represents all n point sources that must be solved in the matrix, (k20 − k2
1)C11 +D11 D12 · · ·D21 (k2
0 − k22)C22 +D22 · · ·
......
. . .
· q1q2...
=
−Q̂0ψ∗1(r0)
−Q̂0ψ∗2(r0)
...
or
A ·Q = B, (3)
where ki is the acoustic wave number for each source and
Cmn =∫∫∫
V
ψ∗mψnd3x = Λmnδmn (4)
Dmn =∮
s(β − βI)ψ∗mψnda (5)
Referring back to Eq. (2), the variable ψn represents the eigenfunction solutions in Carte-sian coordinates which are defined as,
ψN = cos
(mπ
Lxx
)cos
(nπ
Lyy
)cos
(lπ
Lzz
). (6)
The variables Lx, Ly, Lz are the dimensions of the room.
In Eq. (3), the A matrix can become very large. As the A matrix grows, solving forthe qN ’s becomes increasingly difficult. To simplify the solution process, the off-diagonalterms in the A matrix can be deleted, effectively decoupling the A matrix and making thematrix far easier to solve. This code has been used previously with success for smallerrooms.
7
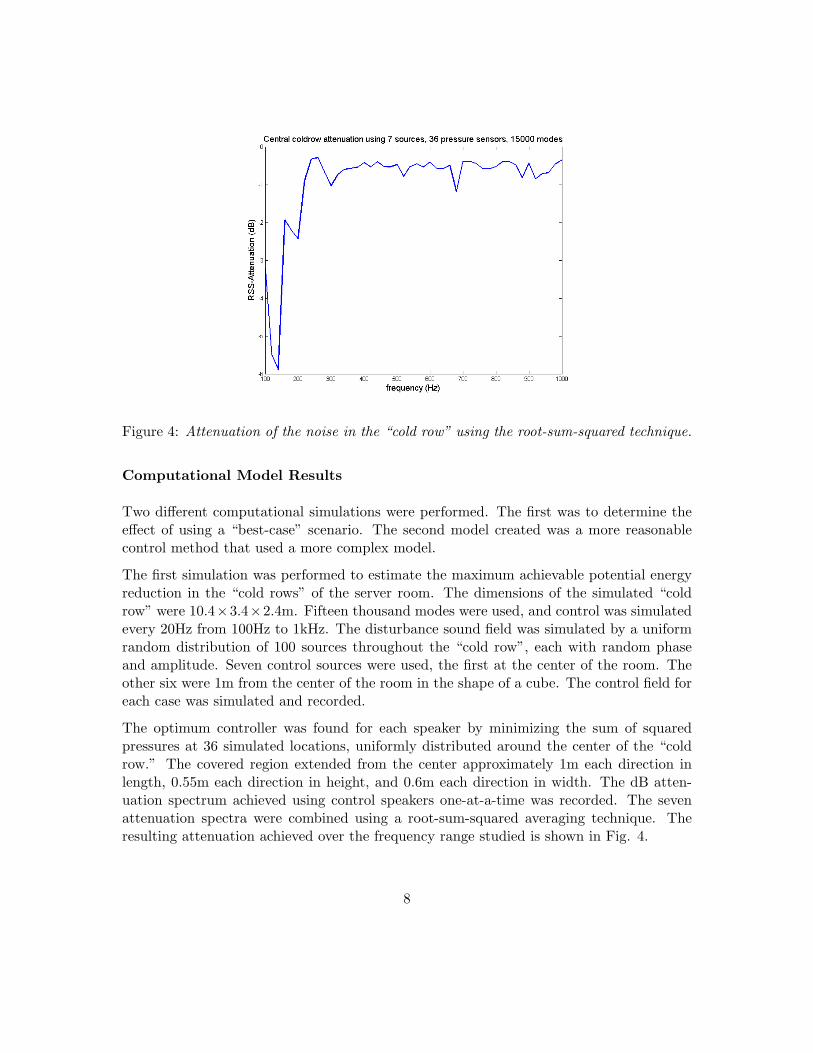
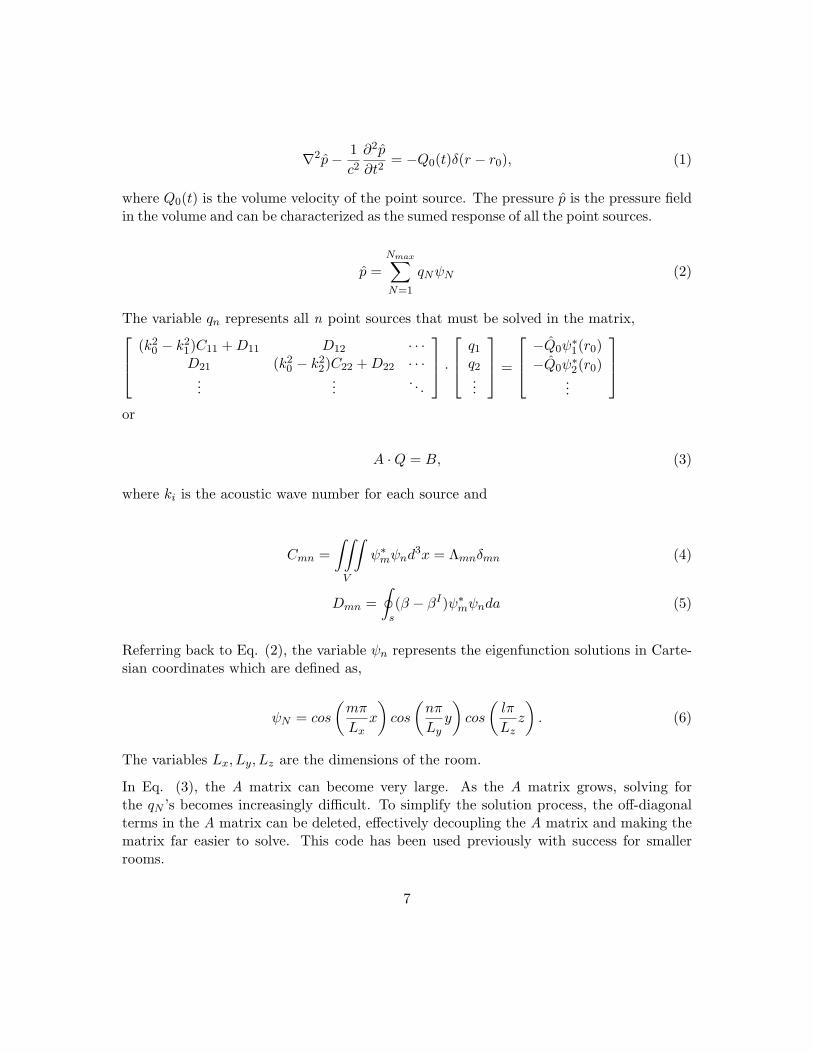
Figure 4: Attenuation of the noise in the “cold row” using the root-sum-squared technique.
Computational Model Results
Two different computational simulations were performed. The first was to determine theeffect of using a “best-case” scenario. The second model created was a more reasonablecontrol method that used a more complex model.
The first simulation was performed to estimate the maximum achievable potential energyreduction in the “cold rows” of the server room. The dimensions of the simulated “coldrow” were 10.4×3.4×2.4m. Fifteen thousand modes were used, and control was simulatedevery 20Hz from 100Hz to 1kHz. The disturbance sound field was simulated by a uniformrandom distribution of 100 sources throughout the “cold row”, each with random phaseand amplitude. Seven control sources were used, the first at the center of the room. Theother six were 1m from the center of the room in the shape of a cube. The control field foreach case was simulated and recorded.
The optimum controller was found for each speaker by minimizing the sum of squaredpressures at 36 simulated locations, uniformly distributed around the center of the “coldrow.” The covered region extended from the center approximately 1m each direction inlength, 0.55m each direction in height, and 0.6m each direction in width. The dB atten-uation spectrum achieved using control speakers one-at-a-time was recorded. The sevenattenuation spectra were combined using a root-sum-squared averaging technique. Theresulting attenuation achieved over the frequency range studied is shown in Fig. 4.
8
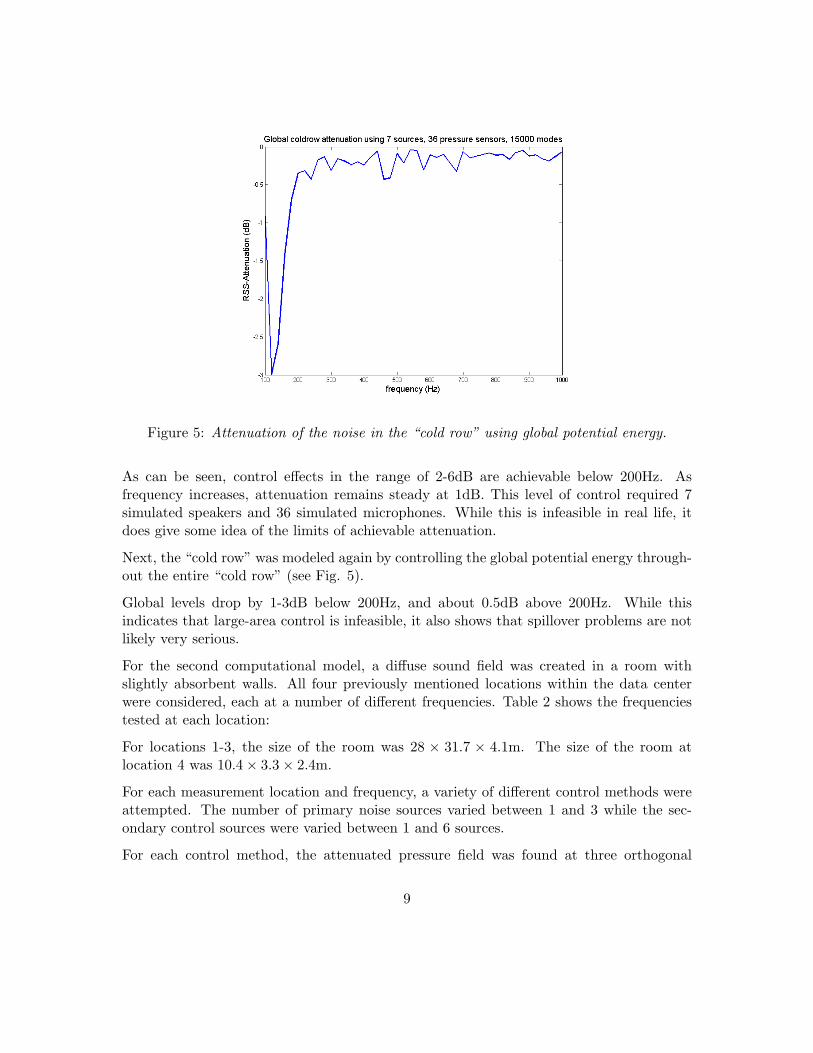
Figure 5: Attenuation of the noise in the “cold row” using global potential energy.
As can be seen, control effects in the range of 2-6dB are achievable below 200Hz. Asfrequency increases, attenuation remains steady at 1dB. This level of control required 7simulated speakers and 36 simulated microphones. While this is infeasible in real life, itdoes give some idea of the limits of achievable attenuation.
Next, the “cold row” was modeled again by controlling the global potential energy through-out the entire “cold row” (see Fig. 5).
Global levels drop by 1-3dB below 200Hz, and about 0.5dB above 200Hz. While thisindicates that large-area control is infeasible, it also shows that spillover problems are notlikely very serious.
For the second computational model, a diffuse sound field was created in a room withslightly absorbent walls. All four previously mentioned locations within the data centerwere considered, each at a number of different frequencies. Table 2 shows the frequenciestested at each location:
For locations 1-3, the size of the room was 28 × 31.7 × 4.1m. The size of the room atlocation 4 was 10.4× 3.3× 2.4m.
For each measurement location and frequency, a variety of different control methods wereattempted. The number of primary noise sources varied between 1 and 3 while the sec-ondary control sources were varied between 1 and 6 sources.
For each control method, the attenuated pressure field was found at three orthogonal
9
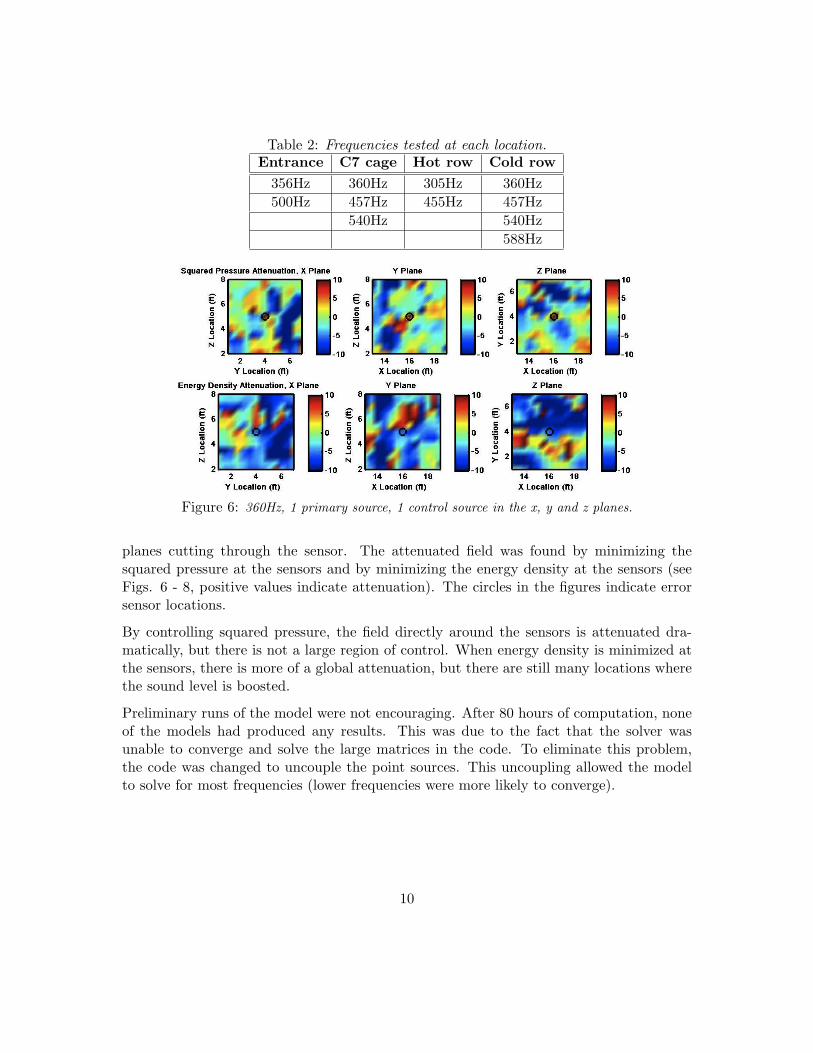
Table 2: Frequencies tested at each location.Entrance C7 cage Hot row Cold row
356Hz 360Hz 305Hz 360Hz500Hz 457Hz 455Hz 457Hz
540Hz 540Hz588Hz
Figure 6: 360Hz, 1 primary source, 1 control source in the x, y and z planes.
planes cutting through the sensor. The attenuated field was found by minimizing thesquared pressure at the sensors and by minimizing the energy density at the sensors (seeFigs. 6 - 8, positive values indicate attenuation). The circles in the figures indicate errorsensor locations.
By controlling squared pressure, the field directly around the sensors is attenuated dra-matically, but there is not a large region of control. When energy density is minimized atthe sensors, there is more of a global attenuation, but there are still many locations wherethe sound level is boosted.
Preliminary runs of the model were not encouraging. After 80 hours of computation, noneof the models had produced any results. This was due to the fact that the solver wasunable to converge and solve the large matrices in the code. To eliminate this problem,the code was changed to uncouple the point sources. This uncoupling allowed the modelto solve for most frequencies (lower frequencies were more likely to converge).
10
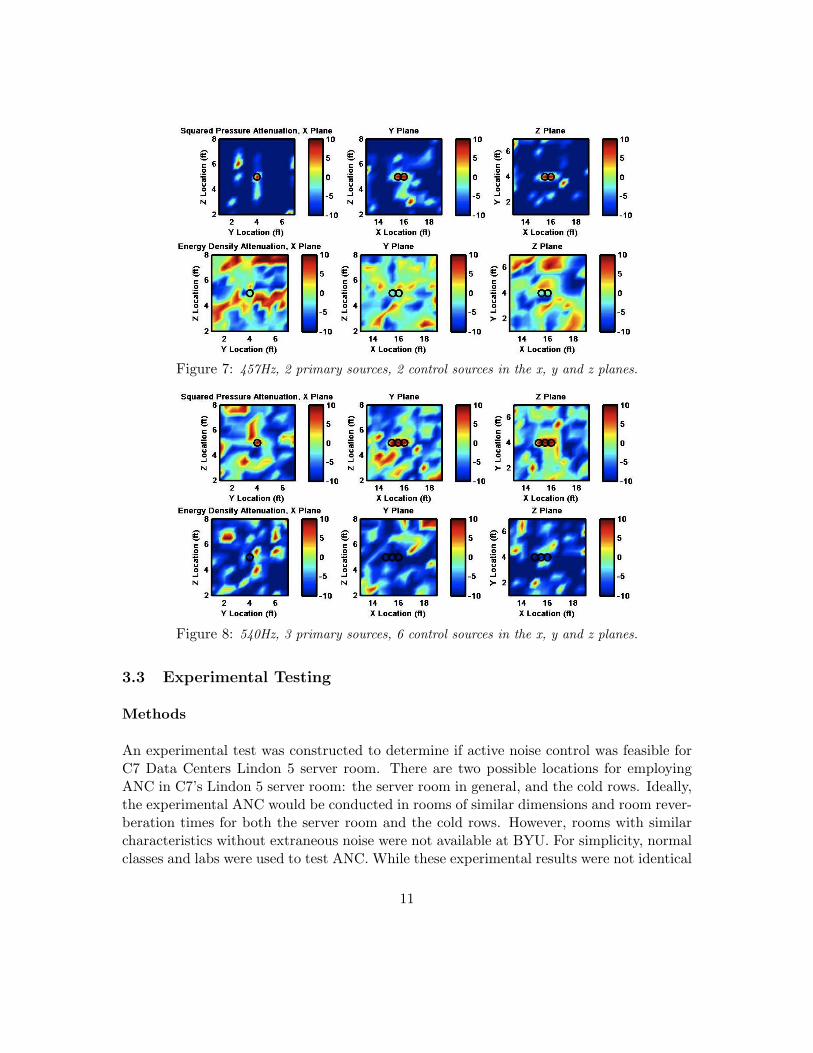
Figure 7: 457Hz, 2 primary sources, 2 control sources in the x, y and z planes.
Figure 8: 540Hz, 3 primary sources, 6 control sources in the x, y and z planes.
3.3 Experimental Testing
Methods
An experimental test was constructed to determine if active noise control was feasible forC7 Data Centers Lindon 5 server room. There are two possible locations for employingANC in C7’s Lindon 5 server room: the server room in general, and the cold rows. Ideally,the experimental ANC would be conducted in rooms of similar dimensions and room rever-beration times for both the server room and the cold rows. However, rooms with similarcharacteristics without extraneous noise were not available at BYU. For simplicity, normalclasses and labs were used to test ANC. While these experimental results were not identical
11
to those that would be produced in the actual locations, the results yielded valuable insightinto whether or not ANC was possible.
The first step in determining if ANC is possible was to try to control a simple sine wave.As a sine wave only has a single frequency, it is the easiest signal to control. If theANC failed to control a sine wave then there was little possibility of controlling a morecomplex signal such as white noise. The experiment was conducted in U186C in the EyringScience Center at Brigham Young University (room dimensions ≈ 4m x 4m x 4m). Theexperimental setup consisted of two Mackie loudspeakers. The first loudspeaker acted asthe source, while the second loudspeaker was used as the control. A two-dimensional, fourchannel energy density sensor (a sensor that measures both pressure and velocity insteadof just pressure) was used as the error sensor. A 1
4
′′ microphone was used to monitor theeffectiveness of ANC. The microphone was moved away from the reference energy densitysensor to measure how ANC performed as a function of distance.
Results
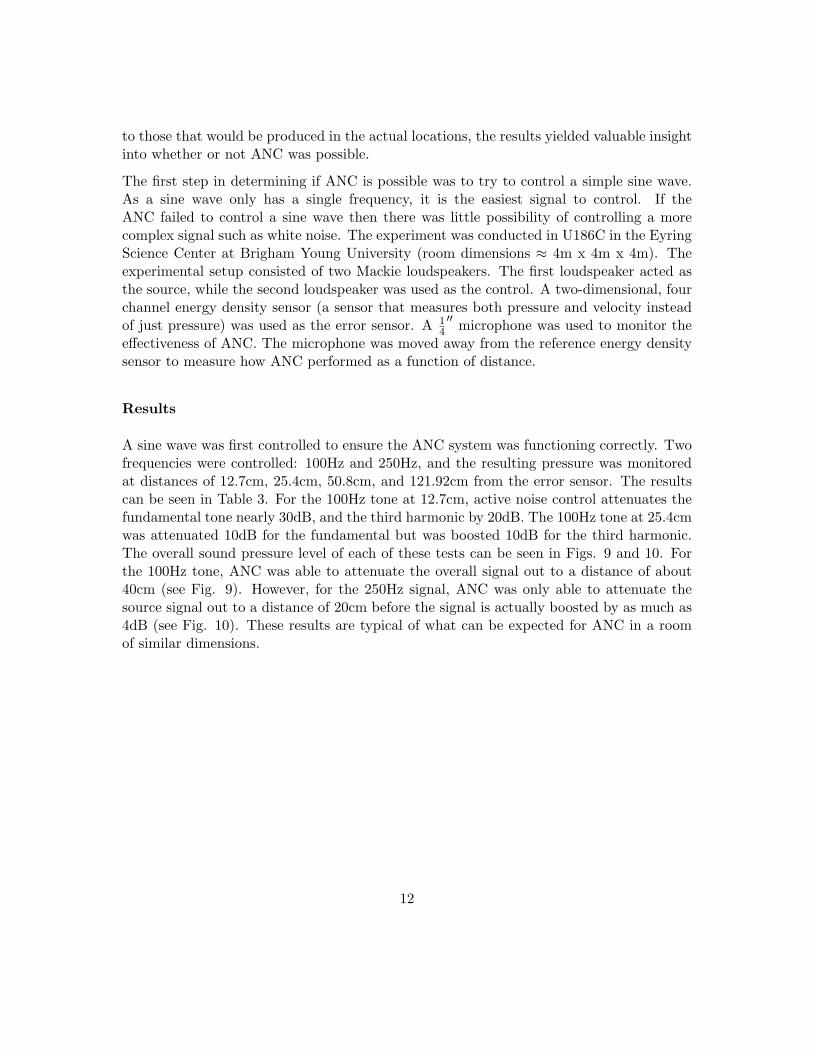
A sine wave was first controlled to ensure the ANC system was functioning correctly. Twofrequencies were controlled: 100Hz and 250Hz, and the resulting pressure was monitoredat distances of 12.7cm, 25.4cm, 50.8cm, and 121.92cm from the error sensor. The resultscan be seen in Table 3. For the 100Hz tone at 12.7cm, active noise control attenuates thefundamental tone nearly 30dB, and the third harmonic by 20dB. The 100Hz tone at 25.4cmwas attenuated 10dB for the fundamental but was boosted 10dB for the third harmonic.The overall sound pressure level of each of these tests can be seen in Figs. 9 and 10. Forthe 100Hz tone, ANC was able to attenuate the overall signal out to a distance of about40cm (see Fig. 9). However, for the 250Hz signal, ANC was only able to attenuate thesource signal out to a distance of 20cm before the signal is actually boosted by as much as4dB (see Fig. 10). These results are typical of what can be expected for ANC in a roomof similar dimensions.
12
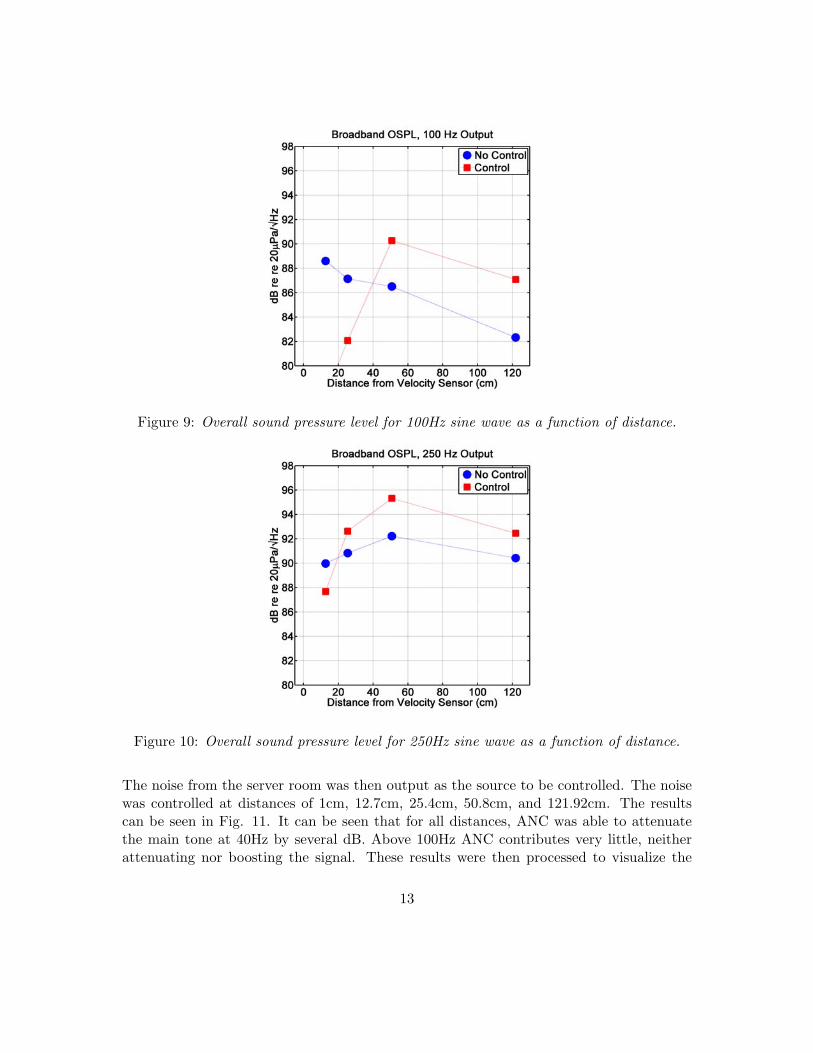
Figure 9: Overall sound pressure level for 100Hz sine wave as a function of distance.
Figure 10: Overall sound pressure level for 250Hz sine wave as a function of distance.
The noise from the server room was then output as the source to be controlled. The noisewas controlled at distances of 1cm, 12.7cm, 25.4cm, 50.8cm, and 121.92cm. The resultscan be seen in Fig. 11. It can be seen that for all distances, ANC was able to attenuatethe main tone at 40Hz by several dB. Above 100Hz ANC contributes very little, neitherattenuating nor boosting the signal. These results were then processed to visualize the
13
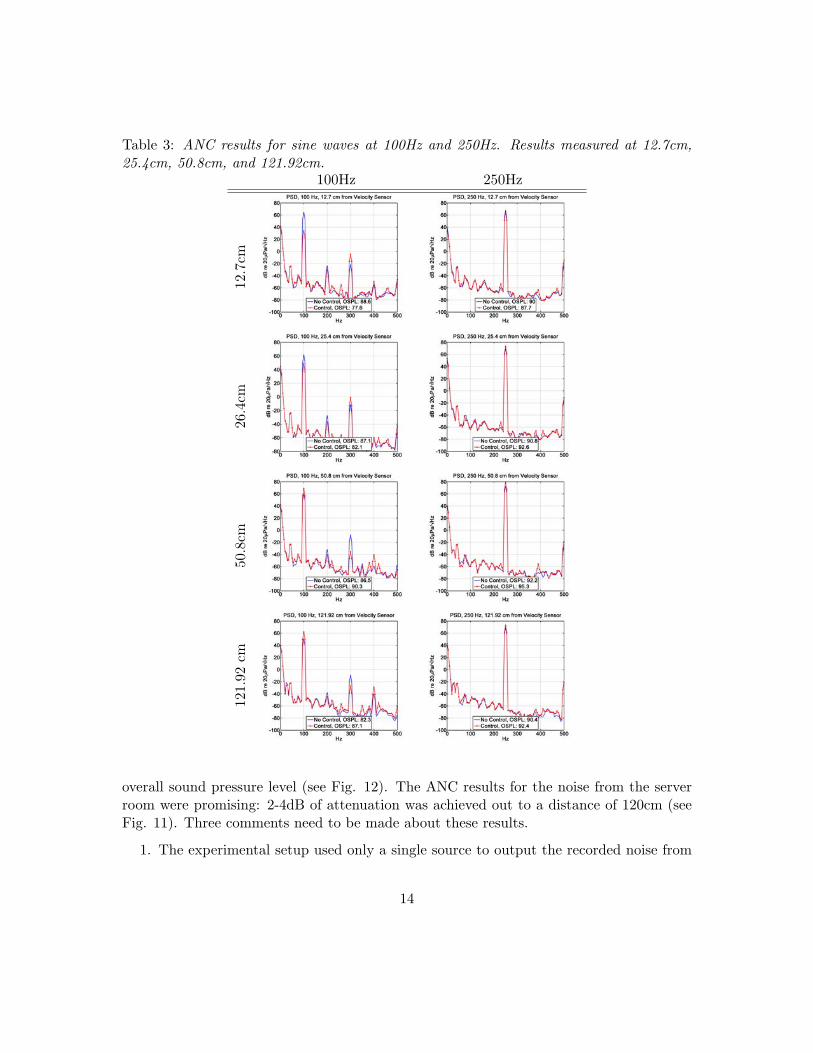
Table 3: ANC results for sine waves at 100Hz and 250Hz. Results measured at 12.7cm,25.4cm, 50.8cm, and 121.92cm.
100Hz 250Hz
12.7
cm26
.4cm
50.8
cm12
1.92
cm
overall sound pressure level (see Fig. 12). The ANC results for the noise from the serverroom were promising: 2-4dB of attenuation was achieved out to a distance of 120cm (seeFig. 11). Three comments need to be made about these results.
1. The experimental setup used only a single source to output the recorded noise from
14
the server room. In reality, there will be many sources of noise in the server roomand in the “cold rows.”
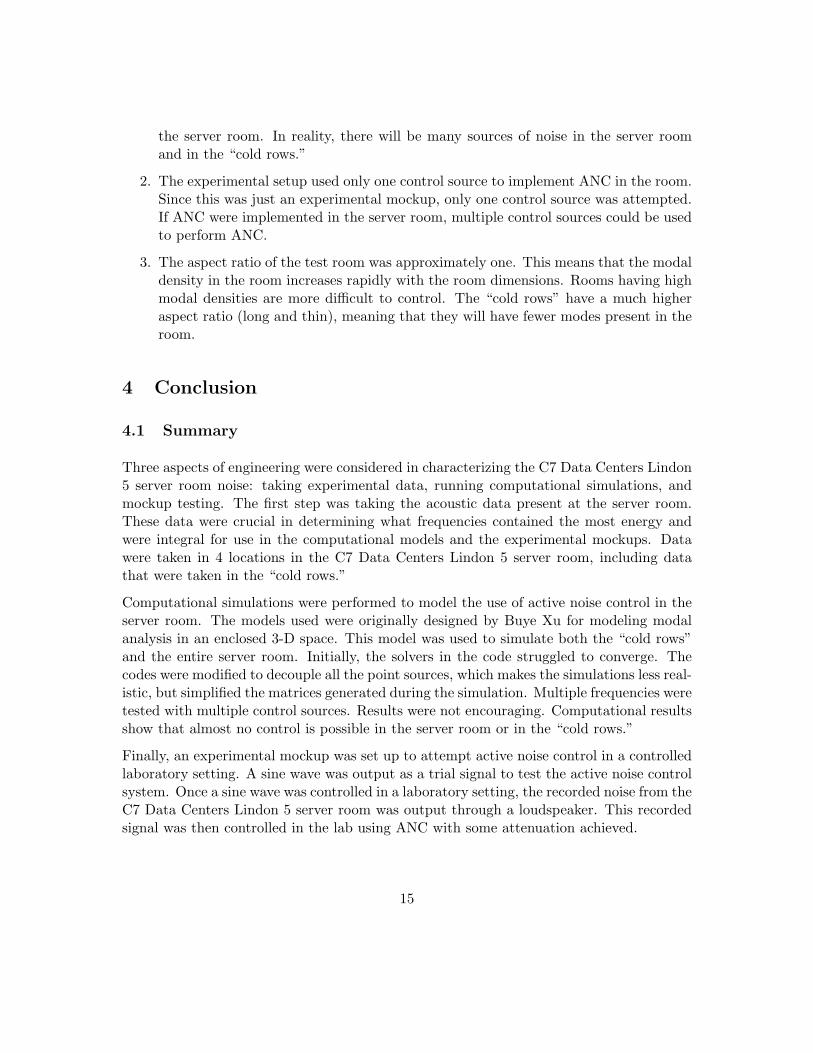
2. The experimental setup used only one control source to implement ANC in the room.Since this was just an experimental mockup, only one control source was attempted.If ANC were implemented in the server room, multiple control sources could be usedto perform ANC.
3. The aspect ratio of the test room was approximately one. This means that the modaldensity in the room increases rapidly with the room dimensions. Rooms having highmodal densities are more difficult to control. The “cold rows” have a much higheraspect ratio (long and thin), meaning that they will have fewer modes present in theroom.
4 Conclusion
4.1 Summary
Three aspects of engineering were considered in characterizing the C7 Data Centers Lindon5 server room noise: taking experimental data, running computational simulations, andmockup testing. The first step was taking the acoustic data present at the server room.These data were crucial in determining what frequencies contained the most energy andwere integral for use in the computational models and the experimental mockups. Datawere taken in 4 locations in the C7 Data Centers Lindon 5 server room, including datathat were taken in the “cold rows.”
Computational simulations were performed to model the use of active noise control in theserver room. The models used were originally designed by Buye Xu for modeling modalanalysis in an enclosed 3-D space. This model was used to simulate both the “cold rows”and the entire server room. Initially, the solvers in the code struggled to converge. Thecodes were modified to decouple all the point sources, which makes the simulations less real-istic, but simplified the matrices generated during the simulation. Multiple frequencies weretested with multiple control sources. Results were not encouraging. Computational resultsshow that almost no control is possible in the server room or in the “cold rows.”
Finally, an experimental mockup was set up to attempt active noise control in a controlledlaboratory setting. A sine wave was output as a trial signal to test the active noise controlsystem. Once a sine wave was controlled in a laboratory setting, the recorded noise from theC7 Data Centers Lindon 5 server room was output through a loudspeaker. This recordedsignal was then controlled in the lab using ANC with some attenuation achieved.
15

Figure 11: ANC results for server room noise. Results measured at 1cm, 12.7cm, 25.4cm,50.8cm, and 121.92cm.
16
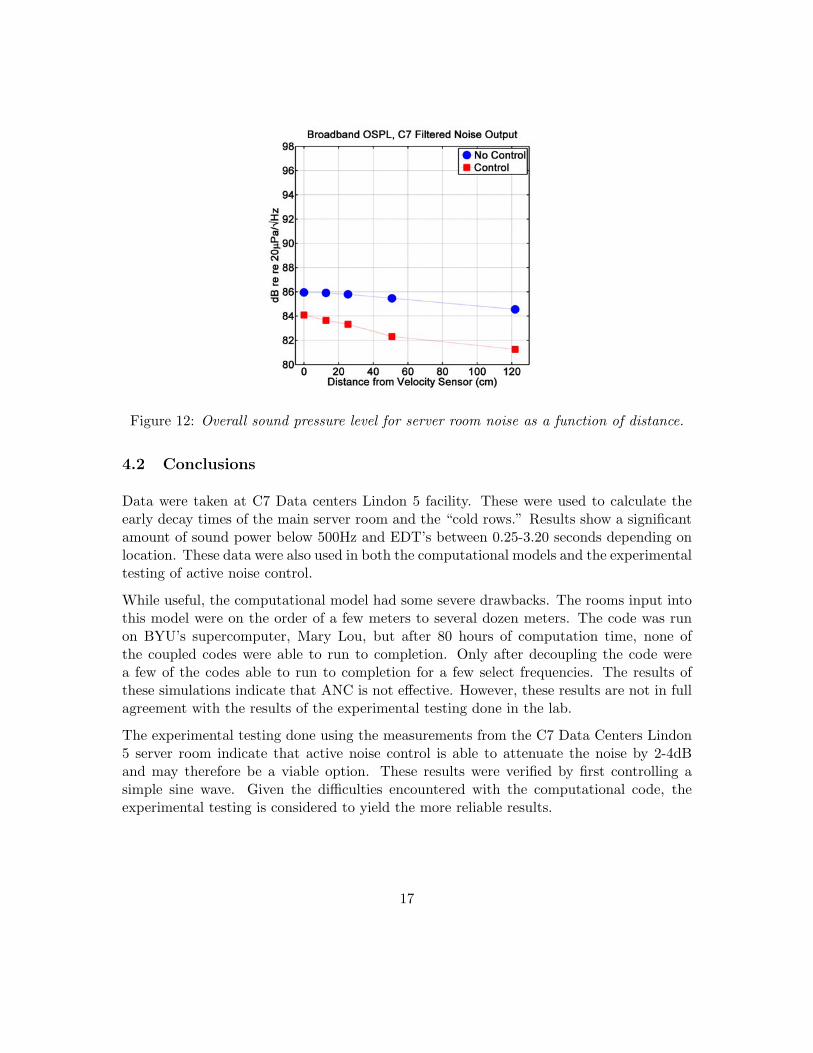
Figure 12: Overall sound pressure level for server room noise as a function of distance.
4.2 Conclusions
Data were taken at C7 Data centers Lindon 5 facility. These were used to calculate theearly decay times of the main server room and the “cold rows.” Results show a significantamount of sound power below 500Hz and EDT’s between 0.25-3.20 seconds depending onlocation. These data were also used in both the computational models and the experimentaltesting of active noise control.
While useful, the computational model had some severe drawbacks. The rooms input intothis model were on the order of a few meters to several dozen meters. The code was runon BYU’s supercomputer, Mary Lou, but after 80 hours of computation time, none ofthe coupled codes were able to run to completion. Only after decoupling the code werea few of the codes able to run to completion for a few select frequencies. The results ofthese simulations indicate that ANC is not effective. However, these results are not in fullagreement with the results of the experimental testing done in the lab.
The experimental testing done using the measurements from the C7 Data Centers Lindon5 server room indicate that active noise control is able to attenuate the noise by 2-4dBand may therefore be a viable option. These results were verified by first controlling asimple sine wave. Given the difficulties encountered with the computational code, theexperimental testing is considered to yield the more reliable results.
17
4.3 Recommendation
The initial plan for implementing active noise control in the C7 Data Centers Lindon 5facility was at two locations, in the server room, and in the “cold rows.” The cumulationof our results indicates that active noise control will not be effective in the main area ofthe server room (this includes the Entrance and the C7 Cage area). This is due to therandom nature of the noise and the high modal density present in the main room. Howeverour results indicate that active noise control may be possible in the “cold rows.” Sinceactive noise control was possible in the laboratory experiments, it can be said that similarcontrol within the “cold rows” may be feasible, but more elaborate experiments should beperformed to ensure that active noise control can yield sufficient acoustic control.
5 Contact Information
Dr. Scott Sommerfeldt 1
Dean, College of Physical and Mathematical Sciencesphone: 801.422.2205email: scott [email protected]
Jesse DailyGraduate studentphone: 925.321.4815email: [email protected]
Mike MaughanC7 Data Centersemail: [email protected]
Contributing Students: Zach Collins, Jesse Daily, James Esplin, Jarom Giraud, DavidKrueger, Dan Manwill, Matt Shaw, Brad Solomon, Dan Tengelsen, Alan Wall, BuyeXu
1Corresponding author
18