Embed Size (px)
Citation preview
AD-A252 892
ANALYSES OF BATTLE CASUALTIESBY WEAPON TYPE ABOARD
U.S. NAVY WARSHIPS
C. G. BLOOD nTICJUL 2 l •2
O2 9 177
REPORT No. 91-1
Approved1 for public release: distribution unlimited.
NAVAL HEALTH RESEARCH CENTER
P-0- BOX 65122SAN DIEGO, CAUFORNIA 92186-5122
NAVAL MEDICAL RESEARCH AND DEVELOPMENT COMMAND , .
BETHESDA, MARYLAND
ANALYSES OF BATTLE CASUALTIES BY WFAFM TYPE
ABOARD U.S. NAVY WARSHIPS
Christopher G. Blood
Medical Decisions Support Department
Naval Health Research Center
P.O. Box 85122
San Diego,, CA 92186--5122
Report No. 91-1, supporced by the Naval Medical Research and Development
Conmand, Department of the Navy, under work unit No. M0095.005-6050. The
views expressed in this article are those of the author and do riot reflect
the official policy or position of the Department of Defense, nor the U.S.
Government. Apprcved for public release, distribution unlimited.
TABLE OF CONTEIS
Summary ............................................................ 3
"Introduction ............................................... 4
methoduction........................................................5
Analyses ........ ................................................... 6
Discussion ........ ................................................. 9
References ........................................................ 12
Table 1 - WWII warships by weapons involved in attacks............ 13
Table 2 - Analysis op covariance o wilA determinants............. 14
Table 3 - Analysis of covariance of KIA determinants .............. 14
Table 4 - mean casualties by weapon typest....................... 15
Table 5 - Mean casualties by types of ships....................... 16
Table 6 - Mean casualties by weapon and ship type ................. 17
TbLle 7 - Frequencies and percentages of wound types and regions..18
ForTable 8 - Injury categories by weapon types .................... 20
*ed EFigure I - Injury types as percentages of total wounds ............ 21
Figure 2 - Anatomical regions as percentages of total wounds ...... 22 "Oil/
Dis2rI
fl~~jiy~~ 40, 1 z T
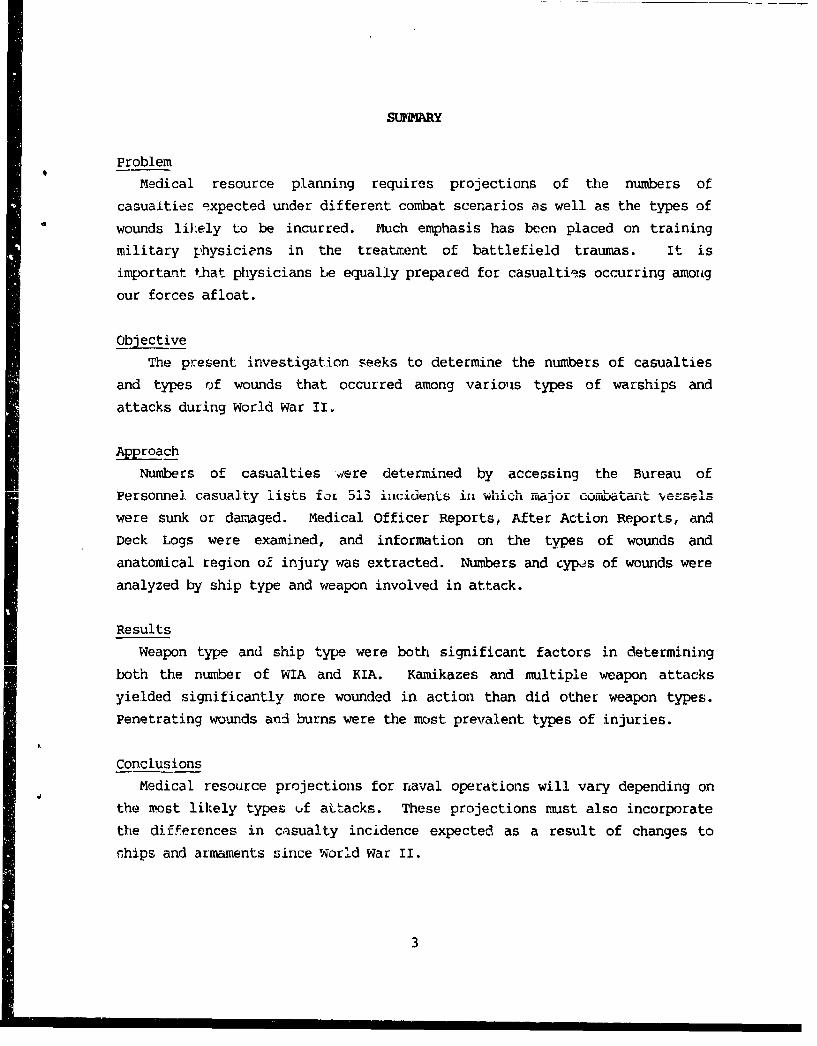
SUN¥RY
Problem
Medical resource planning requires projections of the numbers of
casualtiec expected under different combat scenarios as well as the types of
wounds likely to be incurred. Much emphasis has been placed on training
military physiciens in the treatment of battlefield traumas. It is
important that physicians be equally prepared for casualtieýs occurring amoug
our forces afloat.
Objective
The present investigation seeks to determine the numbers of casualties
and types of wounds that occurred among various types of warships and
attacks during World War II.
ApproachNumbers of casualties &qere determined by accessing the Bureau of
Personnel casualty lists for 513 iucideaLs in w.ich JUL . .uiuatat . ve..sels
were sunk or damaged. Medical Officer Reports, After Action Reports, and
Deck Logs were examined, and information on the types of wounds and
anatomical region of injury was extracted. Numbers and cypes of wounds were
analyzed by ship type and weapon involved in attack.
Results
Weapon type and ship type were both significant factors in determining
both the number of WIA and KIA. Kamikazes and multiple weapon attacks
yielded significantly more wounded in action than did other weapon types.
Penetrating wounds and burns were the most prevalent types of injuries.
ConclusionsMedical resource projections for naval operations will vary depending on
the most likely types of attacks. These projections must also incorporate
the differences in casualty incidence expected as a result of changes to
ships and armaments since World War II.
3
ANALYSES OF BATTIE CASUALTIE3 BY WEAPON TYPE
ABOARD U.S. NAVY WARSHIPS
Introduction
In recent years much emphasis has been placed on training militaryphysicians in advanced trauma life support (ATLS) in order to enhancemedical readiness. 12.3 This education is a necessary component of medicaltraining because wounds incurred by ground troops are likely to be
substantially different than those ordinarily seen by peacetime traumasurgeons. While these courses address the demands of battlefield medicalcare, it is important that medical preparedness for casualties occurringamonL forces afloat not lag behind.
The Department of Defense has undertaken a quad-service initiativedesigned to project, and make readily deployable, the equipment and suppliesneeded to establish treatment facilities withi~n operational thcaters.Deployable Medical Systems (DEPMEDS) is a modular system which involves theprepositioning of medical materiel using data on the expected battleinjuries and illnesses4 . A set of algorithms have been developed andinrorporated into a computer program to calculate the quantity of varioussupplies needed to support a given operation. The DEPMEDS algorithmsrequire not only the anticipated overall rates of incidence of battlewounds, but also projections of the specific types of injuries likely to beIncurred by each eLVwce branch.
A recent investigation indicated that shipboard battle casualties in thelast major conflict occurred at a rate of 0.60 per 1000 strength per day5 .Among the casualties, 48% were either 'missing in action' or killedoutright, and therefore would not have impacted the medical resource system,Wounded shipboard personnel, nevertheless, represent a substantial andcontinuous expenditure of resources in terms of supplies and health carepersonnel. In order to accurately project rhe types of medical equipment,
supplies, and personnel needed to treat Navy afloat casualties, it isnecessary to determine the most probable types of wounds.
The objective of the present investigation is to determine the types of
battle injuries which occurred among forces afloat in the last major
4
conflict with U.S. Navy involvement. Injury types will be analyzed by
weaponry involved as well as by the types of vessels which were attacked.
Medical resource planning is a critical element of operational readiness and
essential to the saving of numerous liles and, indeed, the success of the
mission. Knowledge of casualty incidence and likely types of wounds should
better enable medical logisticians to gauge the medical requirements of
future combat operations. While both ships and armaments have changed since
World War II, the real-life statistics of past naval warfare provide the
starting point from which future casualties can be projected.
Method
Determination of the warships that were sunk or damaged during World War
II operations was made using two historical sources. The Summary of War
Damage6 and the United States Naval Chronology, World War II7 were examined
to obtain a list of major afloat combatants which were attacked, and on
which casualties may have been sustained. Becauýe the most detailedinformation was limited to battleships, carriers, cruisers, and destroyers,
the current investigation was restricted to these types of warships. Data
collected from these two sources included the ship name, hull number, date
of incident, location, the weapon involved in the attack, and whether the
ship was sunk or damaged.
The Medical Officer Reports and After Action Reports maintained at the
the Navy Operational Archives division of the Navy Historical Center in
Washington, D.C. were examined and BUMED diagnoses- were extracted for
casualty incidents corresponding to those found in the War Damage Summary
and Naval Chronology. When the medical information on these incidents was
not available from the Historical Center, the deck logs of these ships,
housed at the National Archives in Washington, D.C., were analyzed and the
relevant information extracted. Medical data collected from these three
sources included the service number of the casualty, BuMed injury code, and
the anatomical region of the injury. The injury codes were collapsed into
the following wound categories: Fractures, Burns, Penetrating Wounds,
Concussions, Contuaions/Abrasions, Traumatic Amputations,
Sprains/Strains/Disl.ocations, Asphyxiations, Non-fatal Immersions, Multiple
Wounds, and Other/Unsp.,cified. Anatomical locations were grouped as Hk•ad,
5
Back, Chest, Shoulder, Abdomen, Arm, Hand, Leg, Foot, Multiple, andOther/Unspecified.
Additionally, Bureau of Personnel casualty lists kept at the OperationalArchives were examined to determine the numbers of casualties aboard shipswhen partial or no information was available from the medical sources. Crewcomplements of the sunk/damaged ships were collected from the muster rollshoused at the National Archives.
Total casualties, both 'wounded in action, (WIA) and 'killed in action'(KIA), were examined by weapon and type of ship separately, as well as byweapon and ship combined. Analyses of covariance were performed to test thesignificance of differences in casualties among the ship types and weaponsinvolved while controlling for size of crew complement. Battle injuryfrequencies and percentages were calculated for the various wound categoriesand anatomical regions. Injury category frequencies and percentages werealso tabulated by type of weapon involved in the attacks. TheDunn-Bonferroni method of adjusting the significance level for multiplecomnarison9 cwa used- when calcu1lating analyies nf variance for the effectof weapon type on the eleven injury categories. Chi squares were calculatedto determine if there were systematic differences in the percentages ofships sunk by either weapon type or ship type.
Analyses
There were 513 incidents in which major combatants were either sunk ordamaged, and on which causal inforiation was avai'able. Battleships (BB)were involved in 43 of these incidents, heavy cruisers (CA) in 32, lightcruisers (CL) in 40, carriers (CV) in 39,'escort carriers (CVE) in 29, lightcarriers (CVL) in 7, destroyers (DD) in 283, and destroyer escorts (DE) in48. These attacks involved 22 separate battleships, 17 heavy cruisers, 22light cruisers, 16 carriers, 21 carrier escorts, 7 light carriers, 206
destroyers, and 45 destroyer escorts. The average crew complements forthese ships were BB: 1,932, CA: 1,075, CL: 1,104, CV: 2,538, CVE: 859, CVL:1,404, DD: 298, and DE: 216. In 190 incidents the weapon in the attack waskamikaze; Another 118 incidents involved gunfire, 83 were bombings, 75attacks were torpedos, 19 incidents were the result of mines, and 28 of theincidents involved multiple weapons. The distribution of incidents by ship
6
type and weapon are displayed in Table 1.
Analyses of covariance were computed to determine the relative
significance of weapon type and type of ship as they relate to the numbers
and types of casualties sustained; to prevent spurious results associated
with the relationship between ship type and size of crew complement, the
effect of crew size was controlled for by using it as a covariate. It can
be seen from Table 2 that both v:eapon and ship type were significant factors
in accounting for the variance in the n•umber of WIA. Similarly, Table 3
indicates that the effects of weapon type and ship type were significant
factors in the number of p>rsonnel killed.
The effect of weapon type on numrber of casualties is presented in Table
4, which shows the mean WIA, KIA, and total casualties by weapon for the 513
incidents. The "multiple weapon" category had the highest average number of
both wounded and killed; kamikazes yielded the second highest number of WIA
while torpedos ranked behind the mtultiple weapon category in KIA. The means
adjusted for crew size were nearly identical to the observed means.
multiple contrasts among the individual wcapon tITcG wcrc pcrformedusing tho least-significant differences (LSD) -ange test. Multiple
comparisons of WIA by the individual weapon types indicated that an attack
by multiple weapons yielded a signific-;ntly greateL aumber of wounded than
did bombs, gunfire, kamikaze, mines, or torpedos. Additionally, kamikaze
attacks produced a larger number of WIA than did gunfire incidents.
Examination of KIA by weapon types indicated that attacks by multiple
weapons yielded significantly more killed thai isncidents involving bombs,gunfire, kamikazes, mines, or torpedos; attu-cks by torpedos caused
significantly more KIA than bombs, gunfire, kamikazes, or mines,
Analyses of casualties incurred with respect to ship types indicated
that heavy cruisers had the highest mean casualties across all incident'-.
Table 5 is a presentation of KIA, WIA, and total casualties by each shiptype. Though heavy cruisers had the highest average KIA and total
casualties, it can be seen that carriers, light carriers, and escort
carriers all averaged higher frequencies of WIA. While the numbers of WIA
were nearly identical for the observed means and the crew size-adjusted
means, the adjusted means for KIA differed in magnitude from the observed
means due to a negative relationship between KIA and crew size within three
ship types (B3,CLDD).
7
Multiple contrasts of WIA for each ship type with all others indicated
that: carriers and escort carriers had significantly more wounded per
incident than destroyers, destroyer escorts, battleships, and light
cruisers; battleships and heavy cruisers had significantly more wounded than
destroyers; heavy cruisers had significantly more wounded than destroyer
escorts. Multiple comparisons of KIA by the ship types indicated that
attacks on heavy cruisers yielded significantly more killed than attacks on
battleships, light cruisers, destroyers and destroyer escorts; attacks on
carriers yielded significantly more deaths than incidents involving
destroyers and destroyer escorts.
The analyses of covariance also indicated that there was a significant
interaction between weapon and ship type in determining the number of
personnel killed. Mean WIA and KIA by weapon type and type of ship are
shown in Table 6. It should be noted that some 'ship by weapon' casualty
averages are based on small numbers of observations and therefore are not asreliable for future projections as those based on relatively large numbers
of incidents.
Chi squares were computed to examine whether weapon type or ship type
were factors in determining if the ship remained afloat or was sunk as a
result of the attack. The chi square for weapon type was highly significant2(X =69.5c., df--5; sig=.0001). The percentages of ships sunk by each weapon
type were: bo.,i, 12%; gunfire, 11%; kamikaze, 8%; mine, 26%; torpedo, 44%;
and multiple weon, 46%. The chi square for sunk/damaged status by ship
type was nonsi-gn4c2!t.Further anal-ses i-,e conducted orn the WIA to more spci ly deal
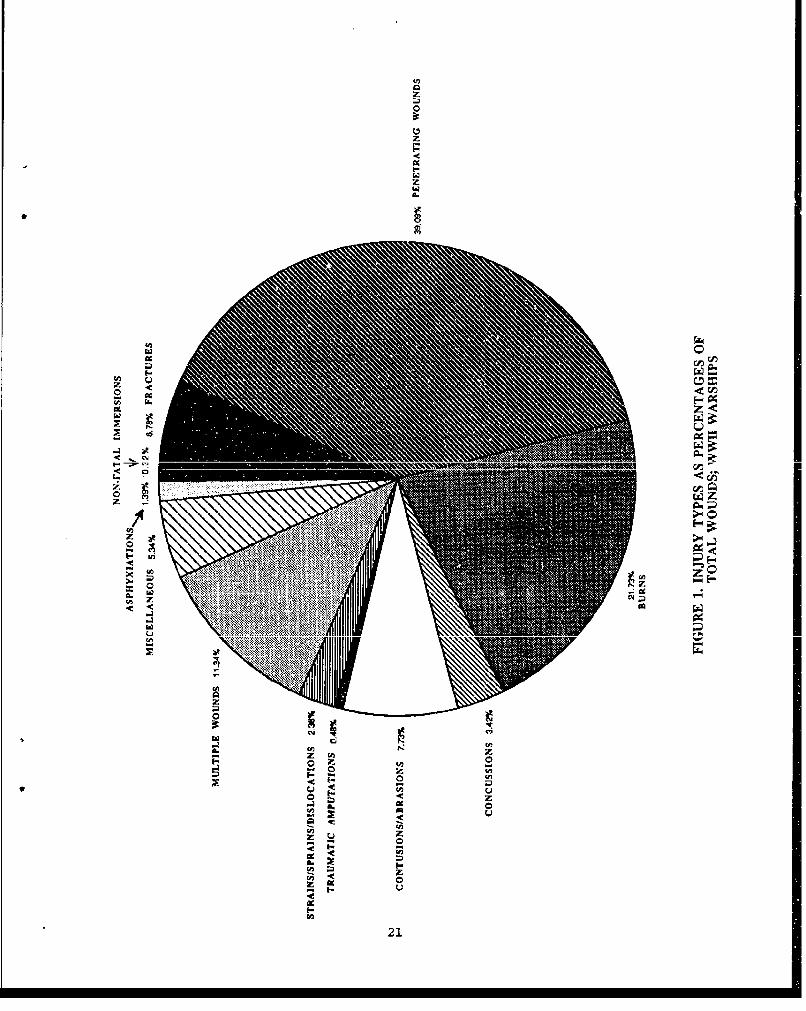
the types of wounds whi.ch were incurred. Figure 1 is a graphic display of
the percentage each injury category represents of the total number of known
diagnoses. Penetrating woinds and burns constituted over sixty percent of
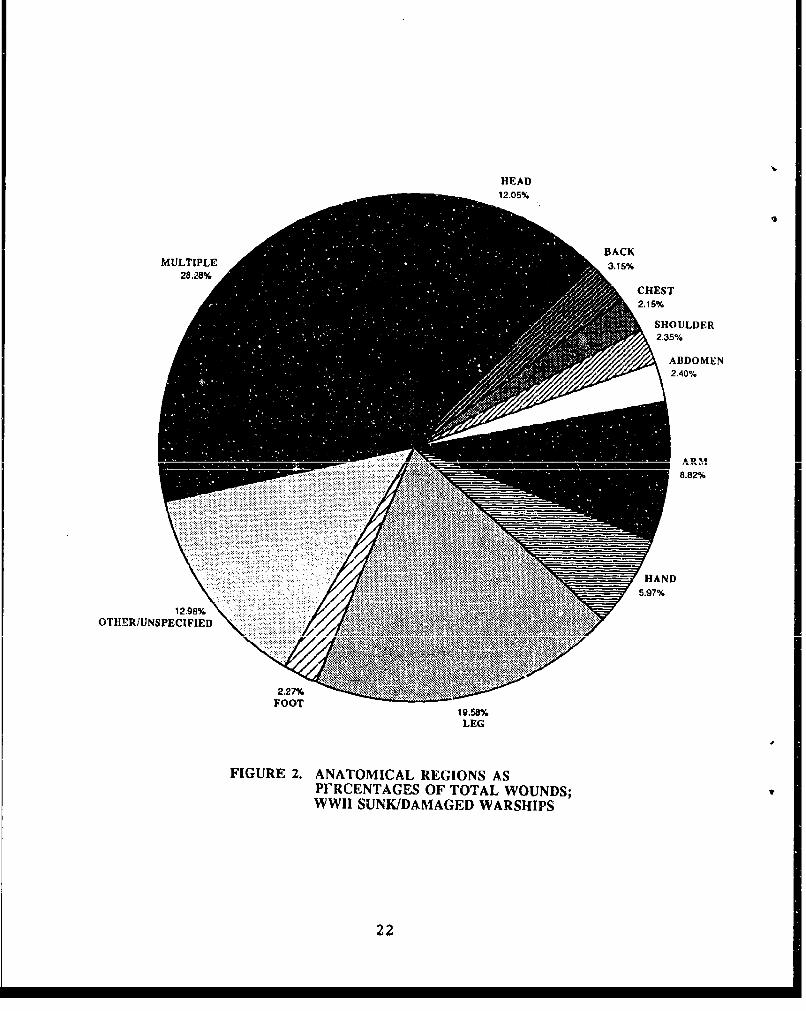
the battle wounds incurred among these ship incidents. Figure 2 is a
similar chart of the percentages of overall wounds represented by each
anatomical region. The "multiple region" category represents the largest
proportion among all anatomical locations while the second most prevalent
wound site was the leg.
Table 7 displays the distribution of wounds for anatomical regions
within each injury category. The 'wound by anatomical region' categories
making up the two largest percentages were multiple burns and multiple
8
penetrating wounds, together representing almost a quarter of the injuries.
Analyses of variance were computed for each injury category to determine
if there were significant differences by weapon type. The number of burns
varied significantly with weapon type (F=6.22, df=5, p < .001); multiple
contrasts indicated that the numbers of burns was significantly greater in
incidents involving kamikazes when compared with gunfire attacks. The
numbers of strains, sprains, and dislocations also differed significantly by
weapon type (F=4.85, df=5, p < .001); multiple comparisons indicated that
mine incidents yielded significantly more wounds within this injury category
than attacks with bombs, kamikazes, or gunfire. Table 8 indicates the
frequencies and percentages of each injury type by the weapons causing the
injuries. This table shows that while kamikaze attacks were responsible for
51% of the injuries, almost 71% of the burns resulted from this type of
attack. Additionally, while strains, sprains, and dislocations represented
2.4% of the total known injuries they constituted 15.8% of the wounds
resulting from mine attacks.
DISCUSSION
Trauma medicine training needs to incorporate the types of wounds
expected among shipboard casualties as well as those anticipated on the
battlefield. Among warships sunk or damaged in World War II, there were an
average of 35 crew members wounded in each attack. Additionally, 4.9% of
shipboard deaths were classified as 'died of wounds' 5 indicating that these
personnel recei-~ czrr treatment before scumbing to tIcir -ounds.
Clearly, in prolonged Naval warfare a large expenditure of medical resources
would be required to save lives, minimize maiming, and ensure the success of
t-he operational mission.
The analyses indicated that types of weapon and ship types both played
statistically significant roles in the numbers of wounded and killed in the
attacks. While both weapon and ship type were factors in influencing the
numbers of casualties, type of weapon played a highly significant role in
determining the number of personnel killed and percentage of ships sunk.
Attacks by torpedos were significantly more lethal than gunfire, kamikaze,
and bombs while incidents falling within the multiple weapon category
yielded significantly more deaths than those attacks involving bombs,
9
gunfire, mines, or kamikazes alone. Closer examination indicated that in 18
of the 28 multiple weapon incidents torpedos were one of the two weapons
involved--again attesting to the enhanced lethality of torpedos over the
other weapon systems. This higher incidence of mortality among torpedo and
multiple weapon attacks is tied to the fact that these two types of assaults
were more likely to cause the sinking of a ship than bombs, gunfire, or
kamikazes.
Like their counterparts on the battlefield, a large percentage of the
casualties aboard ships resulted from penetrating wounds. However,
casualties among forces afloat were much more likely to be burn victims than
were ground troops. Also, the incidence of two or more types of wounds in
combination with each other accounted for more than one tenth of the
shipboard injuries. The sizable numbers of penetrating wounds, burns, and
multiple wounds likely result from a combination of factors, including: 1)
the large amounts of shrapnel yielded by explosions occurring within the
relatively confined spaces of ships, 2) the fires imminent when fuel laden
aircraft, bombs, and torpedos are used prominently as weapons- and 3) the
need to fight these fires immediately, even in the face of continuing
combat.
In examining the anatomical regions of the wounds, the most prevalent
sites were the head, arm, hand, and leg. While the leg, the site of
one-fifth of all injuries, was the most prominent individual region, 28% of
the total number of wounds were inflicted upon mu].tiple regions. The high
frequency of wounds to multiple sites, again, likely resulted from the largequ-ntte--of srpne "e_--A-*'I _ý_T~~antltes~s ofsrpe z iat d wit. ex."Losions as well as the extensive
burns that crew members sustained in the initial attacks and fighting the
fires.
Proportional distributions of wound types varied greatly with the
weapons used in the attacks. The wounds resulting from kamikaze attacks
were predominantly penetrating wounds and burns (67%), as might be expected
with the massive destruction caused by using aircraft as weapons against
ships. Nearly sixty percent of the injuries caused by gunfire/shellfire were
penetrating wounds. Bombs, like kamikazes, yielded high percentages of
penetrating wounds and burns (52%), as well as a large percentage of
multiple wounds (18%), indicating the increased likelihood of sustaining
combinations of wounds such as burns, penetrating wounds, and fractures in
10
this type of attack. The wounds occurring in torpedo attacks were more
likely to be concussions (10%) than for the other weapon types, and were
otherwise mainly distributed over fractures, penetrating wounds, burns, and
contusions/abrasions. This distribution attests to the woumd variability
associated with blast/oierpressure. Like torpedos, mines also yielded
substantial percentages for a number of different wound categories: 17%
fractures, 22% penetrating wounds, 14% contusions, and 16% strains, sprains,
and dislocations.
Rates of shipboard casualties will vary with the type of operation, the
types of ships involved, and the weapons used by our adversaries. Armed
with the types oC wounds anticipated, Navy medical planners will be better
equipped to project the types of health care personnel and resources needed
to save lives and limbs and restore wounded sailors to a level of military
effectiveness.
11
REFIM4ES
1. Heydorn WH: Basic and advanced combat casualty care: A military
problem. Military Medicine, 155(5):229-31, 1990.
2. Rignault DP: How to train War surgery specialists: Part II.
Military Medicine, 155(4):143-47, 1990.
3. Smith AM, Bellamr RF: Conceptual errors in combat casualty care
training: How to reverse them. Navy Medicine, 79(<):15-21, 1988.
4. Galarza JG: Using the Deployable Medical Systems clinical
database for materiel requirements. Presentation to Army
Operations Research Symposium (AORS XXVI),Oct 1987, Fort Lee, VA.
5. Blood CG: Shipboard and ground troop casualty rates among Navy
and Marine Corps personnel during World War XI operations. Report
No. 90-16. San Diego, CA, Naval Health Research Center, 1990.
6. Bureau of Ships, Navy Department: Summaries of war damage: U.S.
battleships, carriers, cruisers, destroyers and destroyer
escorts. 1943-1946.
7. Naval History Division, Office of the Chief of Naval Operations:United States Naval Chronolocgvy World War II. Washington, 1955.
8. United States Bureau of Medicine and Surgery: Manual of the
Medical Department of the United States Navy (NAVMED-117). 1945.
9. Dunn, OJ: On multiple tests and confidence intervals.
Communications in Statistics, 3, 101-3, 1974.
12
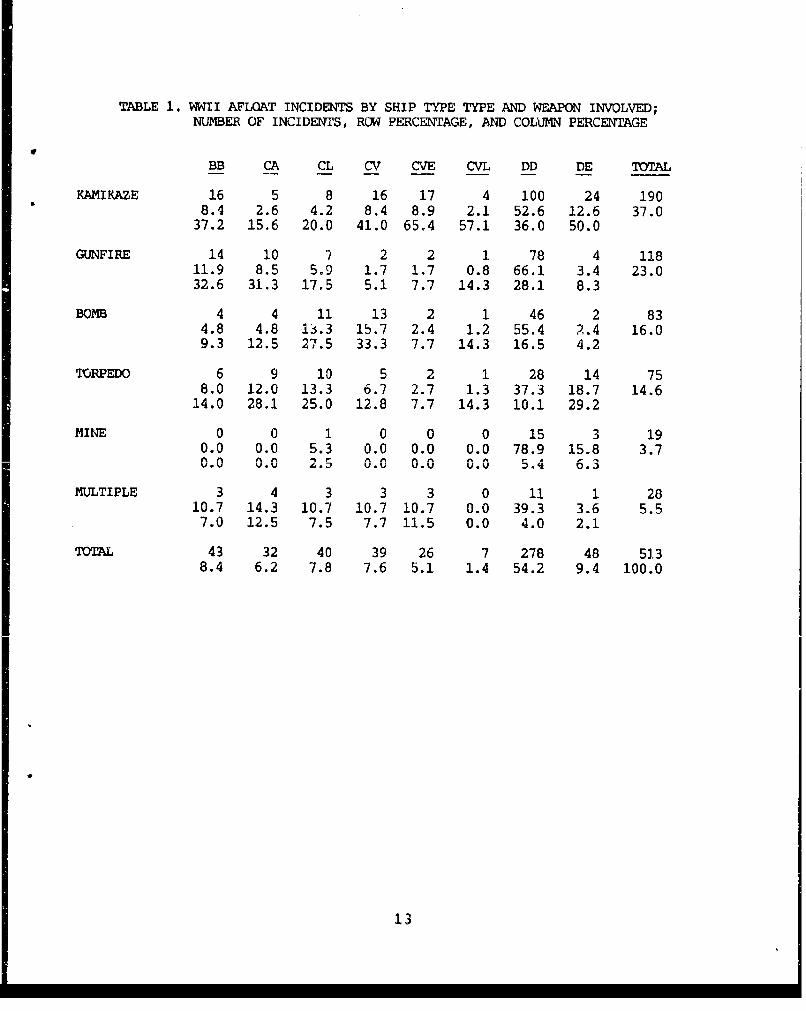
TABLE 1. WWII AFLOAT INCIDENTS BY SHIP TYPE TYPE AND WEAPON INVOLVED;NUMBER OF INCIDENTS, ROW PERCENTAGE, AND COLUMN PERCENTAGE
BB CA CL CV CVE CVL DD DE TOTAL
KAMIKAZE 16 5 8 16 17 4 100 24 1908.4 2.6 4.2 8.4 8.9 2.1 52.6 12.6 37.0
37.2 15.6 20.0 41.0 65.4 57.1 36.0 50.0
GUNFIRE 14 10 7 2 2 1 78 4 11811.9 8.5 5.9 1.7 1.7 0.8 66.1 3.4 23.032.6 31.3 17.5 5.1 7.7 14.3 28.1 8.3
BOMB 4 4 11 13 2 1 46 2 834.8 4.8 13.3 15.7 2.4 1.2 55.4 2.4 16.09.3 12.5 27.5 33.3 7.7 14.3 16.5 4.2
TORPEDO 6 9 10 5 2 1 28 14 758.0 12.0 13.3 6.7 2.7 1.3 37.3 18.7 14.6
14.0 28.1 25.0 12.8 7.7 14.3 10.1 29.2
MINE 0 0 1 0 0 0 15 3 190.0 0.0 5.3 0.0 0.0 0.0 78.9 15.8 3.70.0 0.0 2.D 0.0 0.0 0.0 5.4 6.3
MULTIPLE 3 4 3 3 3 0 11 1 2810.7 14.3 10.7 10.7 10.7 0.0 39.3 3.6 5.57.0 12.5 7.5 7.7 11.5 0.0 4.0 2.1
TOTAL 43 32 40 39 26 7 278 48 5138.4 6.2 7.8 7.6 5.1 1.4 54.2 9.4 100.0
13
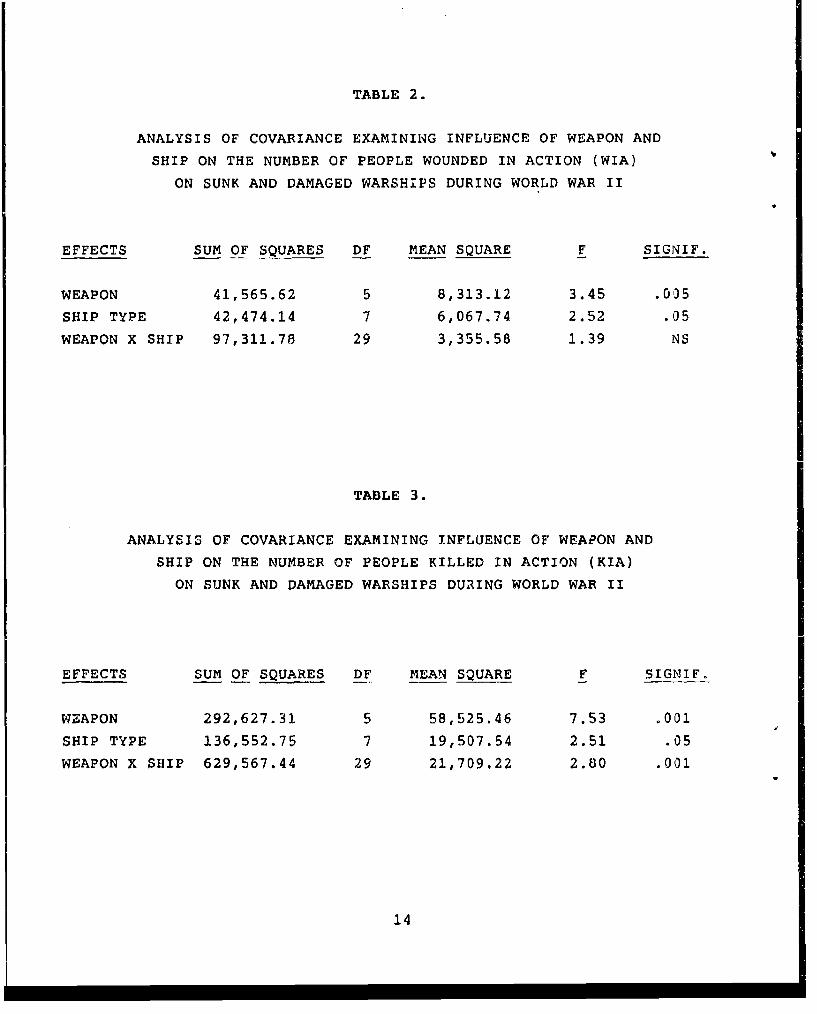
TABLE 2.
ANALYSIS OF COVARIANCE EXAMINING INFLUENCE OF WEAPON AND
SHIP ON THE NUMBER OF PEOPLE WOUNDED IN ACTION (WIA)
ON SUNK AND DAMAGED WARSHIPS DURING WORLD WAR II
EFFECTS SUM OF SQUARES DF MEAN SQUARE F SIGNIF.
WEAPON 41,565.62 5 8,313.12 3.45 .005
SHIP TYPE 42,474.14 7 6,067.74 2.52 .05
WEAPON X SHIP 97,311.78 29 3,355.58 1.39 NS
TABLE 3.
ANALYSIS OF COVARIANCE EXAMINING INFLUENCE OF WEAPON AND
SHIP ON THE NUMBER OF PEOPLE KILLED IN ACTION (KIA)
ON SUNK AND DAMAGED WARSHIPS DURING WORLD WAR II
EFFECTS SUM OF SQUARES DF MEAN SQUARE F SIGNIF.
WEAPON 292,627.31 5 58,525.46 7.53 .001
SHIP TYPE 136,552.75 7 19,507.54 2.51 .05
WEAPON X SHIP 629,567.44 29 21,709.22 2.80 .001
14
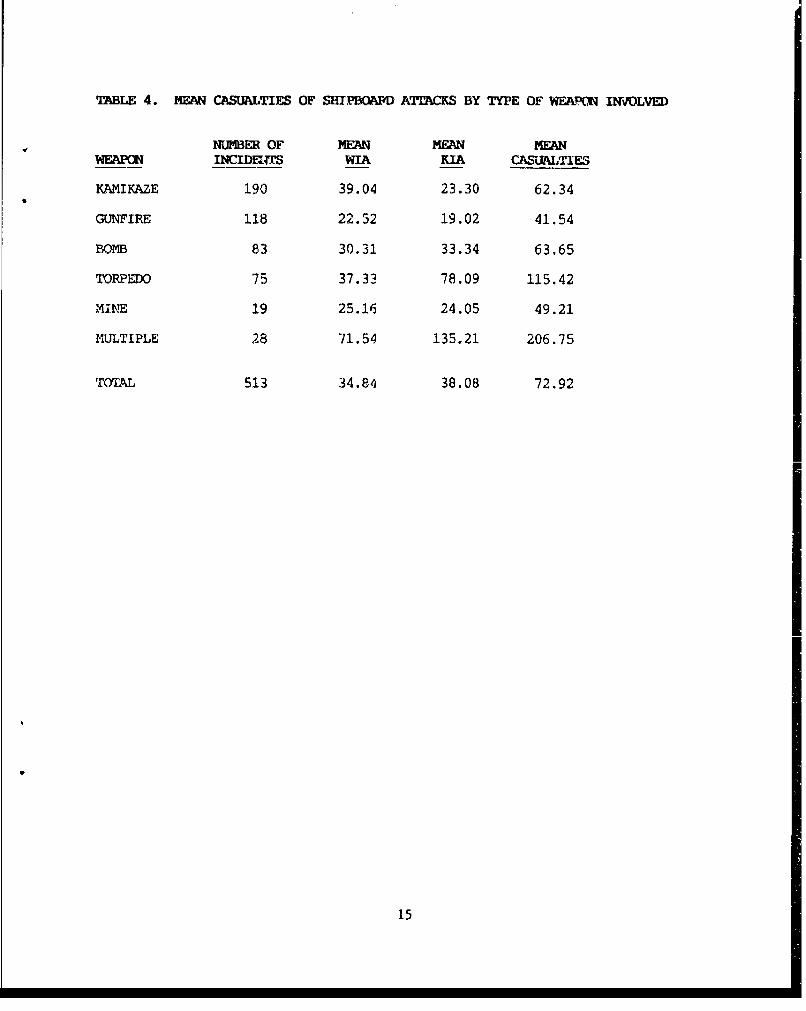
TABLE 4. MEAN CASUALTIES OF SHIFBCOAR'D ATM=CKS BY TYPE OF WEAX., INVOLVED
NUMBER OF MEAN MEAN MEANWEAPON INCIDEUPS WIA KIA CASUALTIES
KAMIKAZE 190 39.04 23.30 62.34
GUNFIRE 118 22.52 19.02 41.54
BOMB 83 30.31 33.34 63.65
TORPEDO 75 37.33 78.09 115.42
MINE 19 25.16 24.05 49.21
MULTIPLE 28 71.54 135.21 206.75
TOTAL 513 34.84 38.08 72.92
15
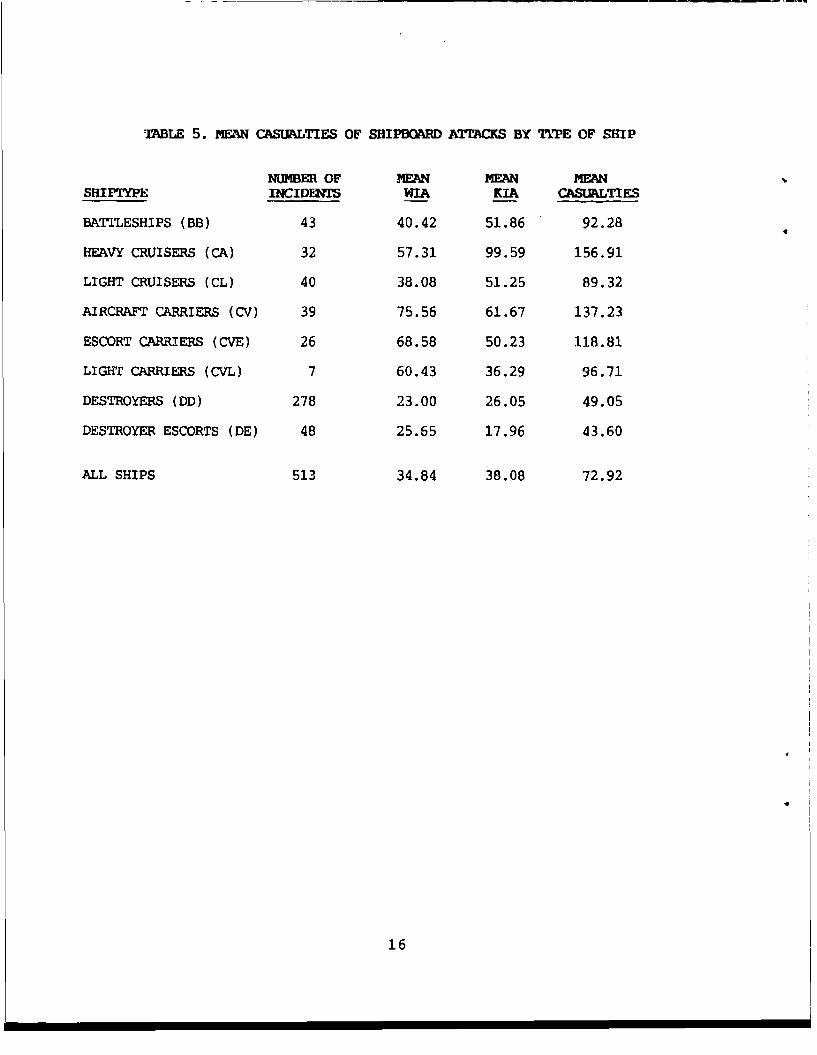
TABLE 5. MEAN CASUALTIES OF SHIPBOARD M¶ACKS BY TIPE OF SHIP
NUMBER OF MEAN MEAN MEANSHIPTYPE INCIDE2T WIA KIA CASUTIES
BATILESHIPS (BB) 43 40.42 51.86 92.28
HEAVY CRUISERS (CA) 32 57.31 99.59 156.91
LIGHT CRUISERS (CL) 40 38.08 51.25 89.32
AIRCRAFT CARRIERS (CV) 39 75.56 61.67 137.23
ESCORT CARRIERS (CVE) 26 68.58 50.23 118.81
LIGHT CARRIERS (CVL) 7 60.43 36.29 96.71
DESTROYERS (DD) 278 23.00 26.05 49.05
DESTROYER ESCORTS (DE) 48 25.65 17.96 43.60
ALL SHIPS 513 34.84 38.08 72.92
16
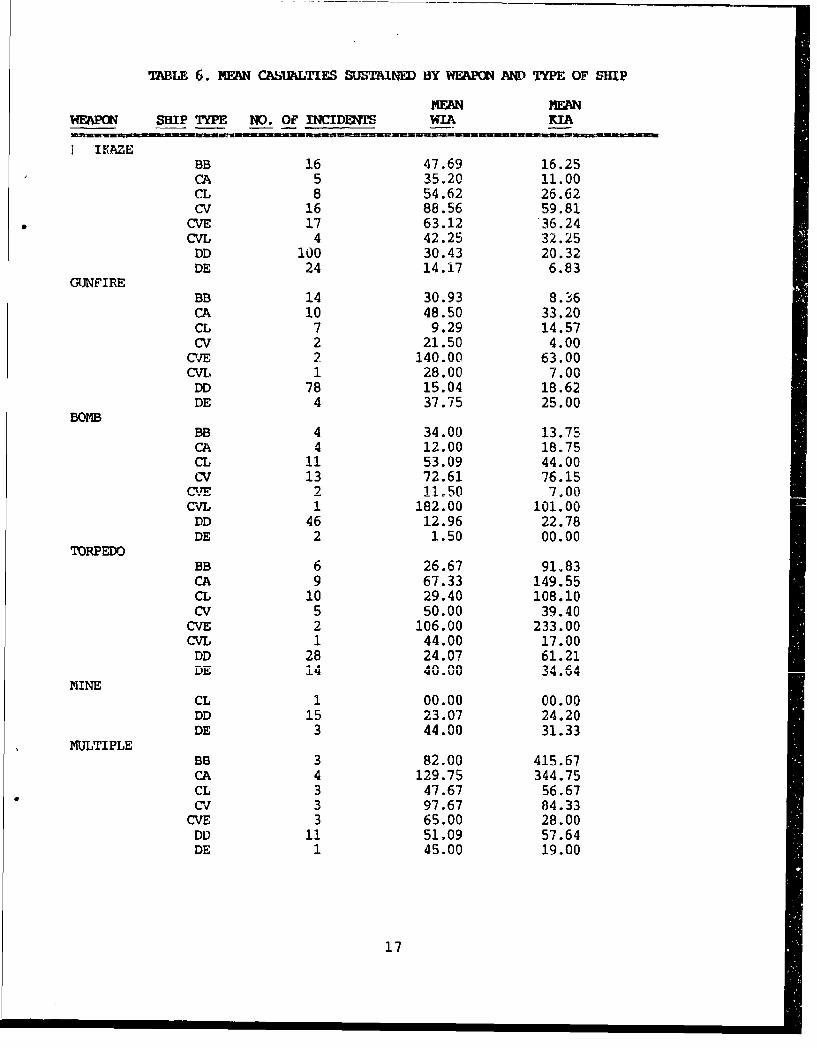
TABLE 6. MEAN CASUALTIES SUSTAINED BY WEAPON AND TYPE OF SHIP
MEAN MEANWEAPON SHIP TYPE Ni). OF INCIDENTS WIA KIA:
IKAZEBB 16 47.69 16.25CA 5 35.20 11.00CL 8 54.62 26.62CV 16 88.56 59.81
CVE 17 63.12 36.24CVL 4 42.25 32.25
DD 100 30.43 20.32DE 24 14.17 6.83
GUNFIREBB 14 30.93 8.36CA 10 48.50 33.20CL 7 9.29 14.57CV 2 21.50 4.00OE 2 140.00 63.00CVL 1 28.00 7.00
DD 78 15.04 18.62DE 4 37.75 25.00
BOMBBB 4 34.00 13.75CA 4 12.00 18.75CL 11 53.09 44.00cv 13 72.61 76.15
CVE 2 11o50 7-00CVL 1 182.00 101.00
DD 46 12.96 22.78DE 2 1.50 00.00
TORPEDOBB 6 26.67 91.83CA 9 67.33 149.55CL 10 29.40 108.10CV 5 50.00 39.40
CVE 2 106.00 233.00CVL 1 44.00 17.00
DD 28 24.07 61.21DE 14 40.UV 34.64
MINECL 1 00.00 00.00DD 15 23.07 24.20DE 3 44.00 31.33
MULTIPLEBB 3 82.00 415.67CA 4 129.75 344.75CL 3 47.67 56.67cv 3 97.67 84.33
CVE 3 65.00 28.00DD 11 51.09 57.64DE 1 45.00 19.00
17
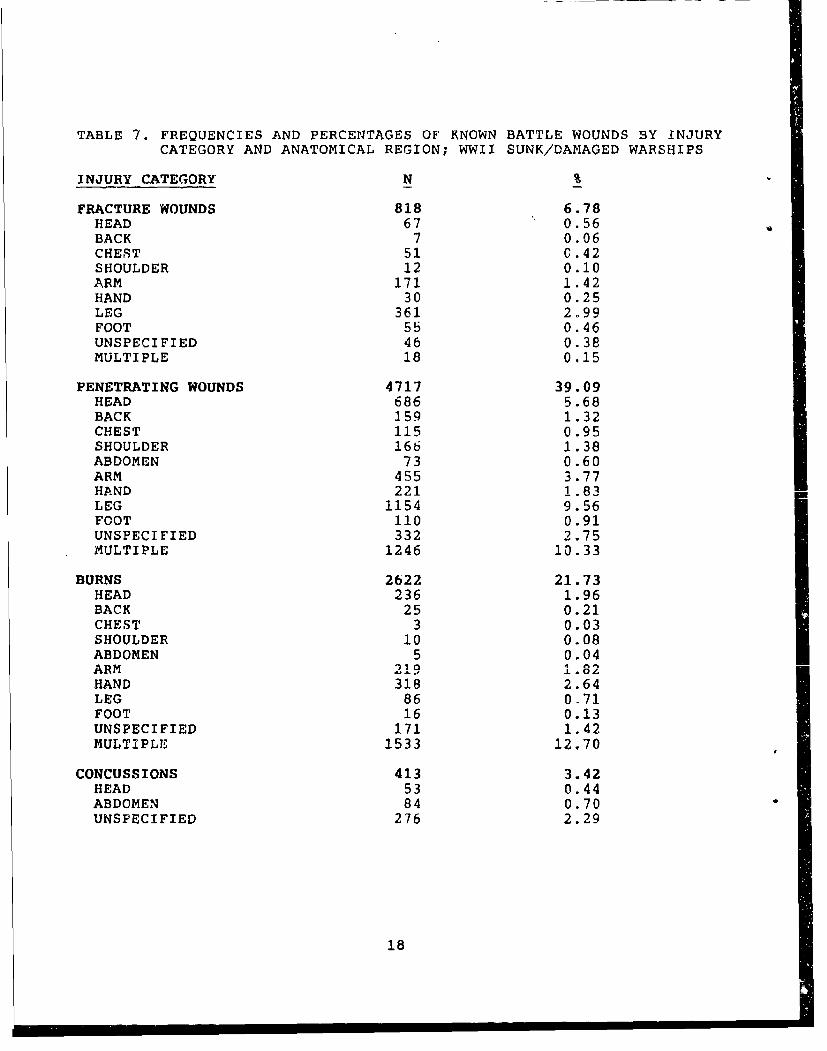
TABLE 7. FREQUENCIES AND PERCENTAGES OF KNOWN BATTLE WOUNDS BY INJURYCATEGORY AND ANATOMICAL REGION; WWII SUNK/DAMAGED WARSHIPS
INJURY CATEGORY N %
FRACTURE WOUNDS 818 6.78HEAD 67 0.56BACK 7 0.06CHEST 51 C.42SHOULDER 12 0.10ARM 171 1.42HAND 30 0.25LEG 361 2.99FOOT 55 0.46UNSPECIFIED 46 0.38MULTIPLE 18 0.15
PENETRATING WOUNDS 4717 39.09HEAD 686 5.68BACK 359 1.32CHEST 115 0.95SHOULDER 166 1.38ABDOMEN 73 0.60ARM 455 3.77HAND 221 1.83LEG 1154 9.56FOOT 110 0.91UNSPECIFIED 332 2.75MULTIPLE 1246 10.33
BURNS 2622 21.73HEAD 236 1.96BACK 25 0.21CHEST 3 0.03SHOULDER 10 0.08ABDOMEN 5 0.04ARM 219 1.82HAND 318 2.64LEG 86 0.71FOOT 16 0.13UNSPECIFIED 171 1.42MULTIPLE 1533 12.70
CONCUSSIONS 413 3.42HEAD 53 0.44ABDOMEN 84 0.70UNSPECIFIED 276 2.29
18
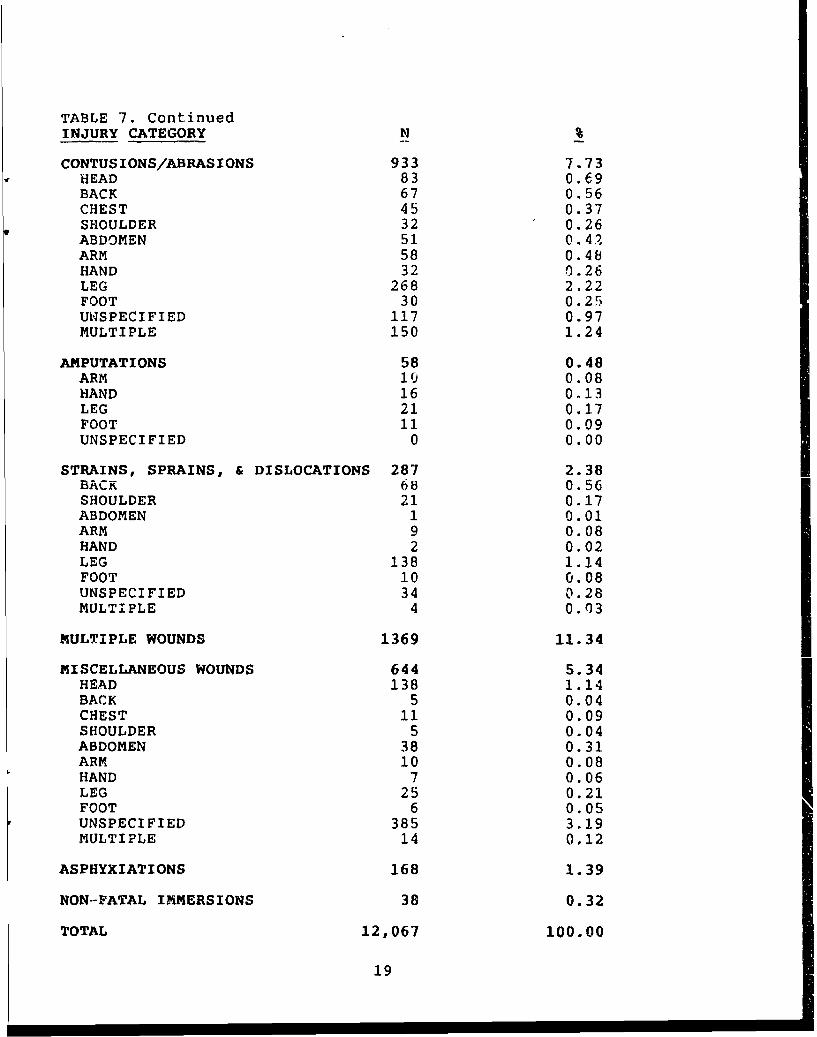
TABLE 7. ContinuedINJURY CATEGORY N
CONTUSIONS/ABRASIONS 933 7.73HEAD 83 0.69BACK 67 0.56CHEST 45 0.37SHOULDER 32 0.26ABDOMEN 51 0.42ARM 58 0.48HAND 32 0.26LEG 268 2.22FOOT 30 0.25UNSPECIFIED 117 0.97MULTIPLE 150 1.24
AMPUTATIONS 58 0.48ARM 10 0.08HAND 16 0.13LEG 21 0.17FOOT 11 0.09UNSPECIFIED 0 0.00
STRAINS, SPRAINS, & DISLOCATIONS 287 2.38BACK 68 0.56SHOULDER 21 0.17ABDOMEN 1 0.01ARM 9 0.08HAND 2 0.02LEG 138 1.14FOOT 10 0.08UNSPECIFIED 34 0.28MULTIPLE 4 0.03
MULTIPLE WOUNDS 1369 11.34
MISCELLANEOUS WOUNDS 644 5.34HEAD 138 1.14BACK 5 0.04CHEST 11 0.09SHOULDER 5 0.04ABDOMEN 38 0.31ARM 10 0.08HAND 7 0.06LEG 25 0.21FOOT 6 0.05UNSPECIFIED 385 3.19MULTIPLE 14 0.12
ASPHYXIATIONS 168 1.39
NON--FATAL IMMERSIONS 38 0.32
TOTAL 12,067 100.00
19
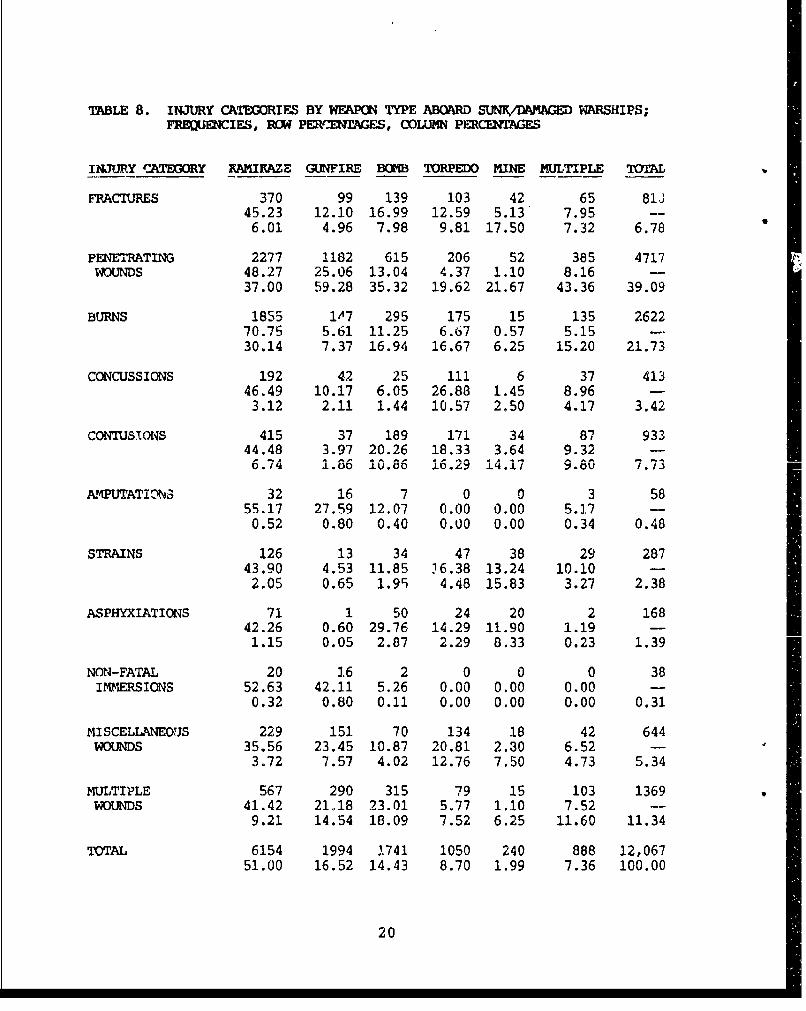
TABLE 8. INJURY CATEGORIFS BY WEAPON TYPE ABOARD SUNK/1WLGED WARSHIPS;FREQUENCIES, ROW PERrXNTAGES, COLUMN P-CENTAGS
INJURY CATEGORY KAMIKAZE G(NFIRE BOMB TORPEDO MINE MULTIPLE TOTAL
FRACTURES 370 99 139 103 42 65 81.345.23 12.10 16.99 12.59 5.13 7.95 --
6.01 4.96 7.98 9.81 17.50 7.32 6.78
PENETRATING 2277 1182 615 206 52 385 4717WOUNDS 48.27 25.06 13.04 4.37 1.10 8.16 -
37.00 59.28 35.32 19.62 21.67 43.36 39.09
BURNS 1855 i17 295 175 15 135 262270.75 5.61 11.25 6.67 0.57 5.1530.14 7.37 16.94 16.67 6.25 15.20 21.73
CONCUSSIONS 192 42 25 ill 6 37 41346.49 10.17 6.05 26.88 1.45 8.96 -3.12 2.11 1.44 10.57 2.50 4.17 3.42
CONTUSIONS 415 37 189 171 34 87 93344.48 3.97 20.26 18.33 3.64 9.32 -6.74 1.86 10.66 16.29 14.17 9.60 7.73
AOMPUTATION 32 16 7 0 0 3 5855.17 27.59 12.07 0.00 0.00 5.17 -0.52 0.80 0.40 0.00 0.00 0.34 0.48
STRAINS 126 13 34 47 38 29 28743.90 4.53 11.85 16.38 13.24 10.10 -
2.05 0.65 1.95 4.48 15.83 3.27 2.38
ASPHYXIATIONS 71 1 50 24 20 2 16842.26 0.60 29.76 14.29 11.90 1.19 -1.15 0.05 2.87 2.29 8.33 0.23 1.39
NON-FATAL 20 16 2 0 0 0 38IfOMRSIONS 52.63 42.11 5.26 0.00 0.00 0.00 -
0.32 0.80 0.11 0.00 0.00 0.00 0.31
MISCELLANEVJS 229 151 70 134 18 42 644WOUNDS 35.56 23.45 10.87 20.81 2.30 6.52 -
3.72 7.57 4.02 12.76 7.50 4.73 5.34
MULTIPLE 567 290 315 79 15 103 1369WOUNDS 41.42 21H18 23.01 5.77 1.10 7.52 -
9.21 14.54 18.09 7.52 6.25 11.60 11.34
TOTAL 6154 1994 1741 1050 240 888 12,06751.00 16.52 14.43 8.70 1.99 7.36 100.00
20
zP
z
I- I-
z W
0 C
C05 U
zz
zU
i21
HEAD
28..82%
OTHERUNSPEIFIECHEST"
2..40%
129.58%
LEG
FIGURE 2. ANATOMICAL REGIONS ASPrRCENTAGES OF TOTAL WOUNDS;WWII SUNK/DAMAGED WARSHIPS
22
Unj i fs J fied
"SECURITY CLASSiFICATION OF THIS PAGE
REPORT DOCUMENTATION PAGEIa. REPORT SECURITY CLASSIFICATION lb RESTRICTIVE MARKINGS
Unclassified N/A
2a. SECURITY CLASSIFICATION AUTHORITY 3. DISTRIBUTION/AVAILABILITY OF REPORT
N/A2b. DECLASSIFICATION/DOWNGRADING SCHEDULE Approved for public release; distribution
N/A unlimited.
4. PERFORMING ORGANIZATION REPORT NUMBER(S) 5. MONITORING ORGANIZATION REPORT NUMBER(S)
Report No. 91-1
S6a. NAME OF PERFORMING ORGANIZATION 6b. OFFICE SYMBOL 7a. NAME OF MONITORING ORGANIZATIONI (if applicable)
Naval Health Research Center Chief, Bureau of Medicine and Surgery
6c. ADDRESS (City, State, and ZIPCode) 7b. ADDRESS (City, State, and ZiP Code)
P. 0. Box 85122 Navy DepartmentSan Diego, CA 92186-5122 Washington, DC 20372-5120
8a. NAME Or FUNDING/SPONSORING " 8b. OFFICE SYMBOL 9. PROCUREMENT INSTRUMENT IDENTIFICATION NUMBER
ORGANIZATION Naval Medical (If applicable)
Research & Development Command_8c. ADDRESS ICity, State, and ZIP Code) 10. SOURCE OF FUNDING NUMBERS
NNMC PROGRAM PROJECT TASK WORK UNIT
Bethesda, MD 20889-5044 ELEMENT NO. NO. NO ACCESSION NO.
63706N M0095 .005 DN24950611. TITLE (Include Security Classification)
(U) ANALYSES OF BATTLE CASUALTIES BY WEAPON TYPE ABOARD U.S. NAVY WARSHIPS
12. PERSONAL AUTHOR(S)Blood, C. G.
13a. TYPE OF REPORT 13b. TIME COVERED 14. DATE OF REPORT (Year,1Month,Oay) 15. PAGE COUNTFinal FROM TO 91 February 19 23
16. SUPPLEMENTARY NOTATION
17 COSATI CODES 18. SUBJECT TERMS (Continue on reverse if necessary and identify by block number)FIELD GROUP SUB-GROUP Shipboard battle injuries, casualties, ship typesFL wounded-in-action, killed-in-action, weapon effects
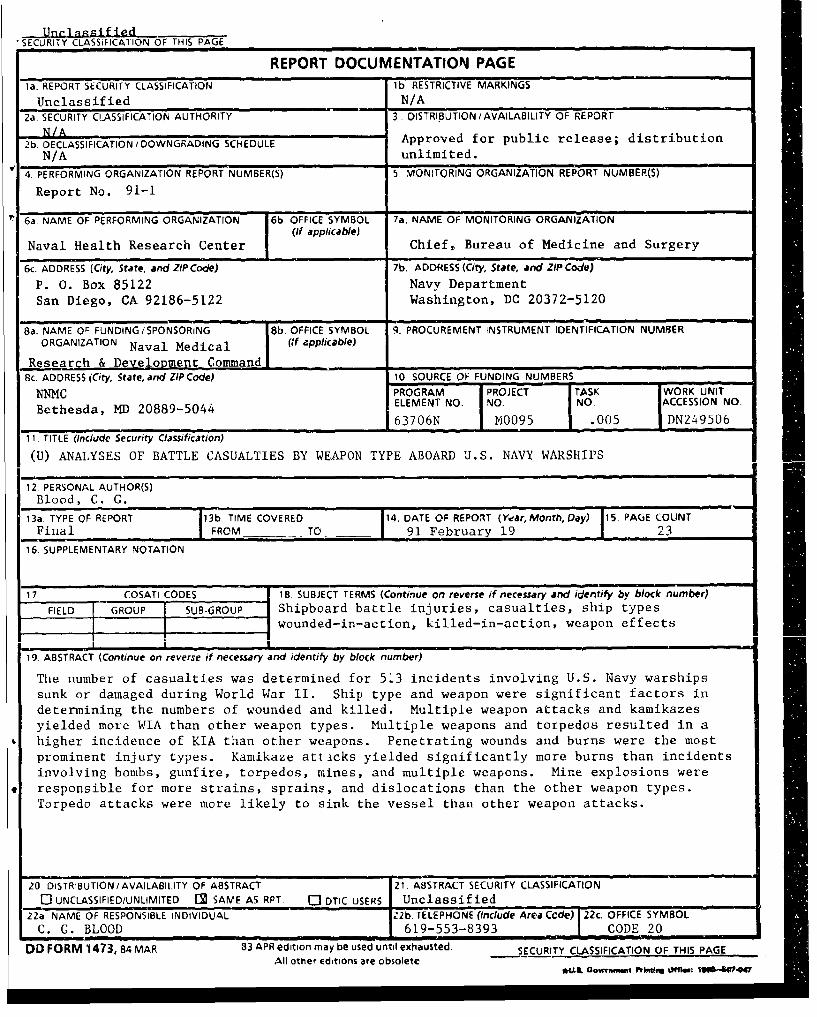
i i I19. ABSTRACT (Continue on reverse if necessary and identify by block number)
The number of casualties was determined for 513 incidents involving U.S. Navy warshipssunk or damaged during World War II. Ship type and weapon were significant factors in
determining the numbers of wounded and killed. Multiple weapon attacks and kamikazesyielded more WIA than other weapon types. Multiple weapons and torpedos resulted in ahigher incidence of KIA than other weapons. Penetrating wounds and burns were the most
prominent injury types. Kamikaze attacks yielded significantly more burns than incidentsinvolving bombs, gunfire, torpedos, mines, and multiple weapons. Mine explosions were
responsible for more strains, sprains, and dislocations than the other weapon types.Torpedo attacks were more likely to sink the vessel than other weapon attacks.
20 DISTRIBUTION/AVAILABIL.ITY OF ABSTRACT 21. ABSTRACT SECURITY CLASSIFICATION
0 UNCLASSIFIED/UNLIMITED [2 SAME AS RPT. 0 DTIC USERS Unclassified
22a NAME OF RESPONSIBLE INDIVIDUAL 22b TELEPHONE (Include Area Ccde) 22c. OFFICE SYMBOL
C. G. BLOOD 619-553-8393 CODE 20
DD FORM 1473, 84 MAR 83 APR edition may be used until exhausted. SECURITY CLASSIFICATION OF THIS PAGEAll other editions are obsolete
IJ.& Gow..qygmt ft ~WNW: TIIISI-41044W