Embed Size (px)
Citation preview

RappoRt suR les mesuRes
de gestion des chaRges
addenda aubudget de l’ontario de 2012
R e p o R t o n e x p e n s e
m a n a g e m e n t m e a s u R e s
addendumto the 2012 ontario Budget


R e p o R t o n e x p e n s e
M a n a g e M e n t M e a s u R e s
addendumto the 2012 ontario Budget

For general inquiries regarding the Addendum to the 2012 Ontario Budget: Report on Expense Management Measures, please call:
Toll-free English & French inquiries: 1-800-337-7222Teletypewriter (TTY): 1-800-263-7776
For electronic copies of this document, visit our website atwww.ontario.ca/budget
A printed copy of this publication can be ordered:Online at: www.serviceontario.ca/publications
By phone through the ServiceOntario Contact CentreMonday to Friday, 8:30 AM to 5:00 PM416 326-5300 416 325-3408 (TTY) 1 800 668-9938 Toll-free across Canada 1 800 268-7095 TTY Toll-free across Ontario
© Queen’s Printer for Ontario, 2012ISBN 978-1-4435-9274-1 (Print)ISBN 978-1-4435-9275-8 (HTML)ISBN 978-1-4435-9276-5 (PDF)
Ce document est disponible en français sous le titre :Addenda au budget de l’Ontario de 2012 – Rapport sur les mesures de gestion des charges

Report on Expense Management Measures
Contents
Introduction ............................................................................. 1
Removing Overlap and Duplication ................................................ 2
Overview............................................................................ 2
Ministry of Children and Youth Services...................................... 3
Ministry of Community and Social Services .................................. 4
Ministry of Economic Development and Innovation, Ministry of Training, Colleges and Universities, and Other Ministries .............................................................. 5
Ministry of Economic Development and Innovation........................ 5
Ministry of Education ............................................................. 6
Ministry of Finance ................................................................ 6
Ministry of Municipal Affairs and Housing.................................... 7
Ministry of Tourism, Culture and Sport ...................................... 7
Ministry of Transportation....................................................... 8
More Efficient and Effective Delivery Models .................................... 9
Overview............................................................................ 9
Ministry of Children and Youth Services.....................................10
Ministry of Community and Social Services .................................11
Ministry of Community Safety and Correctional Services ................12
Ministry of Education ............................................................14
Ministry of the Environment ...................................................15
Ministry of Finance ...............................................................16
Ministry of Government Services..............................................16
Ministry of Labour................................................................17
Ministry of Municipal Affairs and Housing...................................17
Ministry of Natural Resources .................................................18
iii

Addendum to the 2012 Ontario Budget
iv
Ministry of Tourism, Culture and Sport .....................................20
Ministry of Transportation......................................................20
Various Ministries ................................................................21
Focusing on Core Business...........................................................22
Overview...........................................................................22
Ministry of Aboriginal Affairs ..................................................23
Ministry of Agriculture, Food and Rural Affairs ............................24
Ministry of the Attorney General..............................................26
Cabinet Office.....................................................................26
Ministry of Children and Youth Services.....................................27
Ministry of Citizenship and Immigration.....................................28
Ministry of Community Safety and Correctional Services ................28
Ministry of Economic Development and Innovation.......................29
Ministry of Education ............................................................31
Ministry of Energy................................................................33
Ministry of the Environment ...................................................34
Ministry of Finance...............................................................35
Ministry of Government Services .............................................35
Ministry of Health and Long-Term Care.....................................37
Ministry of Infrastructure .......................................................41
Ministry of Municipal Affairs and Housing...................................42
Ministry of Natural Resources .................................................43
Ministry of Northern Development and Mines .............................43
Office of the Premier ............................................................44
Ministry of Tourism, Culture and Sport .....................................45
Ministry of Training, Colleges and Universities ............................47
Ministry of Transportation......................................................49
Various Ministries ................................................................50

Report on Expense Management Measures
Introduction
This “Report on Expense Management Measures” provides a detailed list of expense management measures totalling $4.9 billion in savings planned over the next three years. As described in Chapter I: Transforming Public Services, of the 2012 Budget, these savings are planned through removing overlap and duplication, more efficient and effective delivery models, and focusing on core business. The expense management measures in this Report are grouped under three categories. The table below provides total savings for each category.
($ Billions)
($ Billions) 2012–13 2013–14 2014–15 3-year
total
Removing Overlap and Duplication (0.1) (0.1) (0.4) (0.5)
More Efficient and Effective Delivery Models (0.1) (0.3) (0.5) (0.9)
Focusing on Core Business (0.8) (1.3) (1.4) (3.5)
Total (1.0) (1.7) (2.2) (4.9)
Note: Numbers in this table and other tables in the Report may not add due to rounding.
1

Addendum to the 2012 Ontario Budget
Removing Overlap and Duplication
Overview
The government continues to eliminate overlap and duplication wherever possible to deliver services and programs in the most efficient and effective manner. This will save public money and enhance service delivery.
2

Report on Expense Management Measures
Ministry of Children and Youth Services
($ Millions) 2012–13 2013–14 2014–15 3-year
total
Closure of Bluewater Youth Centre (0.9) (12.9) (13.8) (27.6)
The government has created a dedicated youth justice system that emphasizes community-based alternatives and decreased use of custody for youth in conflict with the law. This has resulted in excess capacity in the system. As announced on March 5, 2012, the government is rationalizing the youth justice system, in part, through the closure of the Bluewater Youth Centre in Goderich, which had been operating at 26 per cent capacity. Youth have been transferred to nearby facilities as close to home as possible.
Closure will help to bring overall capacity utilization in secure-custody youth justice facilities closer to the optimal 70 per cent level, thus reducing the overall costs of operating the youth justice system while helping to avoid spending on necessary capital upgrades and maintenance.
($ Millions) 2012–13 2013–14 2014–15 3-year
total
Downsizing of Cecil Facer Youth Centre and Brookside Youth Centre
(0.4) (6.1) (6.4) (12.9)
The government will rationalize excess capacity in the youth justice system, in part, through downsizing the Cecil Facer Youth Centre in Sudbury and the Brookside Youth Centre in Cobourg — both of which are operating at less than 50 per cent capacity.
The reduction will help to bring overall capacity utilization in secure-custody youth justice facilities closer to the optimal 70 per cent level, thus reducing the overall cost of operating the youth justice system.
3

Addendum to the 2012 Ontario Budget
($ Millions) 2012–13 2013–14 2014–15 3-year
total
Reduce Contracted Open Custody Services (1.9) (3.8) (3.8) (9.4)
The government will rationalize excess capacity in the youth justice system, in part, by reducing the number of transfer payment agencies contracted to provide open custody services. Youth in these facilities will be supported in nearby facilities as close to home as possible.
This change will reduce the overall cost of operating the youth justice system.
Ministry of Community and Social Services
($ Millions) 2012–13 2013–14 2014–15 3-year
total
Rationalize Central Support and Administration Functions
(3.5) (7.0) (7.0) (17.6)
Rationalizing central support and administration functions across program, policy and common support services, as well as across ministries, will reduce expenditures while refocusing remaining resources on core functions and process improvements.
4

Report on Expense Management Measures
Ministry of Economic Development and Innovation, Ministry of Training, Colleges and Universities, and Other Ministries
($ Millions) 2012–13 2013–14 2014–15 3-year
total
Jobs and Prosperity Fund – – (250.0) (250.0)
The government is transforming the way it delivers support to business by consolidating many of these programs into one Jobs and Prosperity Fund that will focus on supporting productivity growth and job creation in the business sector.
This is expected to result in overall savings of $250 million in 2014-15.
Ministry of Economic Development and Innovation
($ Millions) 2012–13 2013–14 2014–15 3-year
total
Merger of Ministry of Economic Development and Trade with Ministry of Research and Innovation
(4.0) (4.0) (4.0) (12.0)
By merging the two ministries, there will be savings of $12 million over three years, which will be used to offset other ministry pressures.
5

Addendum to the 2012 Ontario Budget
Ministry of Education
($ Millions) 2012–13 2013–14 2014–15 3-year
total
School Board Amalgamations – (10.5) (16.7) (27.2)
Across Ontario there are 72 district school boards, with directors of education, supervisory officers and board administrative staff.
To further reduce administrative and back-office expenses, the ministry will pursue the amalgamation of some neighbouring district boards to encourage economies of scale and allow the new boards to focus resources on student achievement.
The government will not consider merging public and separate school boards, in keeping with constitutional requirements.
Ministry of Finance
($ Millions) 2012–13 2013–14 2014–15 3-year
total
Efficiencies in Tax Administration (31.3) (17.7) (23.8) (72.8)
As a result of the sales tax reform wind-down, effective September 1, 2011, the former Ministry of Revenue underwent a reorganization that consolidated functions and reduced full-time equivalents.
The ministry has also found additional savings as a result of organizational realignment, reductions in staff, improved efficiencies, and consolidating the former Ministry of Revenue with the Ministry of Finance. In addition, the ministry has found efficiencies in corporate tax administration.
6

Report on Expense Management Measures
Ministry of Municipal Affairs and Housing
($ Millions) 2012–13 2013–14 2014–15 3-year
total
Organizational Efficiencies (0.1) (2.8) (8.3) (11.3)
The Ministry of Municipal Affairs and Housing will rationalize functions such as policy, planning, program and common support services. Measures include the consolidation of functions, discontinuation of work in some areas, process improvements and elimination of non-core functions.
Ministry of Tourism, Culture and Sport
($ Millions) 2012–13 2013–14 2014–15 3-year
total
Transform Cultural Sector Support (3.0) (4.0) (4.0) (11.0)
The government will continue to make targeted, strategic investments through an expanded and enhanced Cultural Strategic Investment Fund. Four existing grant programs (Museum and Technology Fund, International Cultural Initiatives, Creative Communities Prosperity Fund and Cultural Strategic Investment Fund) will be integrated into one program to achieve savings and improve client services. Concentrating resources into a stronger and comprehensive fund that is open to all cultural sectors will create new and innovative projects and lead to job creation and economic growth.
In addition, the Entertainment and Creative Cluster Partnerships Fund program will sunset one year early to achieve savings from program administration.
7

Addendum to the 2012 Ontario Budget
Ministry of Transportation
($ Millions) 2012–13 2013–14 2014–15 3-year
total
Redesign Electric Vehicles Programs (14.8) (18.3) (10.0) (43.1)
The Province provides two initiatives to support the adoption of electric vehicles (EVs) in Ontario. The Electric Vehicle Incentive Program provides incentive payments to consumers purchasing EVs. The Electric Vehicle Charging Infrastructure initiative supports the establishment of charging infrastructure for EVs. The EV incentive program has had lower-than-expected uptake. The two initiatives will be combined to improve effectiveness and efficiencies.
($ Millions) 2012–13 2013–14 2014–15 3-year
total
Ministry-Wide Service Delivery Efficiencies (2.4) (3.1) (3.9) (9.4)
The ministry provides transportation services, fleet acquisition and maintenance across the Ontario Public Service (OPS) through the OPS Fleet Management Centre.
Due to the work of the Fleet Management Centre in building economies of scale for management of fleet assets, the ministry is now in a position to achieve savings while continuing to provide the same level of service.
8

Report on Expense Management Measures
More Efficient and Effective Delivery Models
Overview
The government is committed to reviewing programs to determine if the way programs and services are delivered is as effective and efficient as possible. Often, alternative methods of delivery can save money while delivering better service for the people of Ontario.
9

Addendum to the 2012 Ontario Budget
Ministry of Children and Youth Services
($ Millions) 2012–13 2013–14 2014–15 3-year
total
Phased Closure of Thistletown Regional Centre (2.1) (4.8) (4.8) (11.7)
The delivery of social services has evolved from being directly funded and administered by the Province to a more decentralized model where municipalities, broader public-sector partners and non-profit organizations deliver services. The phased closure over two years of the Thistletown Regional Centre is consistent with the goals of the government’s Comprehensive Mental Health Strategy in creating a more responsive and integrated children’s mental health system within communities.
The government will work with community organizations to ensure that high-quality services are available in the community. Savings will be achieved through a reduction in administrative and support costs.
10

Report on Expense Management Measures
Ministry of Community and Social Services
($ Millions) 2012–13 2013–14 2014–15 3-year
total
Reform the Community Start-Up and Maintenance Benefit (CSUMB) and Home Repairs Benefit
(16.2) (70.6) (75.7) (162.5)
The Community Start-Up and Maintenance Benefit and Home Repairs Benefit will be removed from social assistance, with housing supports delivered as part of the Long-Term Affordable Housing Strategy. This will result in a better-coordinated service delivery system; more responsive planning and programming based on local needs; and improved cost-effectiveness, with a reduction in unnecessary jurisdictional overlap.
Providing low-income individuals and families with access to supports locally without their having to be eligible for social assistance will contribute to a lower “welfare wall.” Providing fewer benefits within social assistance will help simplify rules and support program integrity and long-term sustainability.
($ Millions) 2012–13 2013–14 2014–15 3-year
total
Cap Health- and Non-Health-Related Benefits in Ontario Works
(14.1) (20.0) (21.2) (55.3)
Provincial–municipal cost-sharing for Ontario Works discretionary benefits is currently determined through a formula that caps provincial cost-sharing of non-health-related discretionary benefits at $8.75 per case, but has no cap for health-related discretionary benefits.
Replacing this formula with a $10 per case cap that applies to both health- and non-health-related discretionary benefits would reduce costs in the short term and help control cost growth over the long term. This would result in a revised funding arrangement with municipalities for the provision of discretionary social assistance benefits.
11

Addendum to the 2012 Ontario Budget
Ministry of Community Safety and Correctional Services
($ Millions) 2012–13 2013–14 2014–15 3-year
total
Closure of Correctional Facilities (Update of 2011 Announcement)
(19.9) (96.0) (116.7) (232.6)
Ontario continues to modernize the province’s aging correctional system to provide more inmate capacity and get better value for taxpayers. A major component of this process is to close older, less efficient jails and transfer inmates to new correctional facilities such as the Toronto South Detention Centre/Toronto Intermittent Centre and South West Detention Centre.
The government is closing inefficient prisons in Owen Sound, Walkerton, Brantford, Chatham and Sarnia, and will proceed with undertaking the full closure of the Toronto West Detention Centre.
($ Millions) 2012–13 2013–14 2014–15 3-year
total
Operating Savings Resulting From Vacating Outdated Facilities
(1.6) (4.8) (10.1) (16.5)
The government is vacating outdated facilities that will no longer be required as operations shift to new facilities such as the Toronto South Detention Centre and the Forensic Services and Coroner’s Complex.
Vacating outdated facilities will enable the ministry to generate savings related to leasing, maintenance, utilities and other costs.
Vacating outdated facilities is consistent with the government’s strategy to modernize infrastructure and vacate older, less efficient space.
12

Report on Expense Management Measures
($ Millions) 2012–13 2013–14 2014–15 3-year
total
Private Security Transformation – (2.0) (2.0) (4.0)
The Private Security and Investigative Services Branch (PSISB) regulates the private security industry in Ontario. The PSISB is responsible for licensing the private investigative services and security guard industries, including compliance and enforcement activities.
Processing applications and producing licences are not legislative obligations for the PSISB and could be better provided through another service delivery model, realizing efficiencies.
The government is modernizing existing customer service-related operations through the use of alternate service providers such as ServiceOntario. This initiative will improve the customer experience by providing reliable and more accessible services to the private security industry in Ontario. A partnership would enable the reallocation of resources to policy development, compliance and enforcement.
This strategy is geared towards service delivery transformation, resulting in improved services at a lower cost.
13

Addendum to the 2012 Ontario Budget
Ministry of Education
($ Millions) 2012–13 2013–14 2014–15 3-year
total
Underutilized Schools – (43.7) (72.5) (116.2)
Declining enrolment and population changes have led to underutilization of some of the province’s schools. The government has provided all school boards with significant increases in resources over the past eight years.
To encourage efficiency, the government will reduce incentives in the education funding formula that facilitate the continued operation of underutilized school sites where other options exist. These changes will begin in the 2013–14 school year to allow boards time to work with their communities to ensure a smooth transition.
($ Millions) 2012–13 2013–14 2014–15 3-year
total
Cap on Successful Secondary Credits – (13.9) (22.0) (35.9)
A cap on successful secondary credits will reduce the sizable number of students who return for a fifth year of high school after earning their Ontario Secondary School Diploma, by motivating them to plan courses appropriately while allowing them to seek additional or upgraded credits. This approach strikes a balance between flexibility for students and the need for sustainability.
To allow students adequate time to plan, the credit cap will come into effect in September 2013. The government will work with its partners in the school system to ensure that the credit cap is implemented fairly and with minimal disruption. Schools will continue to offer programs that allow students to customize their education to their individual strengths and encourage graduation.
14

Report on Expense Management Measures
($ Millions) 2012–13 2013–14 2014–15 3-year
total
Student Transportation (6.6) (9.4) (18.3) (34.3)
The government is committed to ensuring that students are transported to and from schools in a safe, timely and cost-effective manner. The Ministry of Education has worked with school boards on student transportation reform initiatives involving the development of transportation consortia, adoption of best business practices, and raising management capacity to deliver safe, effective and efficient transportation services.
The ministry will continue to work with school boards and the industry to achieve savings through the implementation of competitive procurement processes and other measures that encourage operators to adopt more efficient practices, while ensuring that student transportation safety is maintained and student needs are met.
Ministry of the Environment
($ Millions) 2012–13 2013–14 2014–15 3-year
total
Proposed Drive Clean Office Transfer to a Delegated Administrative Authority Model
– – (11.0) (11.0)
The Drive Clean Office is responsible for the management and administration of Drive Clean, Ontario’s mandatory vehicle-emissions inspection and maintenance program.
Drive Clean has been operating since 1999, and over four million vehicles are tested annually. As it is a mature program that fully recovers its operating costs through revenue, Drive Clean is a proposed candidate for delivery through a Delegated Administrative Authority (DAA) model.
As a DAA, Drive Clean would be fully funded by its own revenue, eliminating the need for funding from the ministry.
15

Addendum to the 2012 Ontario Budget
Ministry of Finance
($ Millions) 2012–13 2013–14 2014–15 3-year
total
Financial-Hardship Unlocking Reform (2.5) (2.6) (2.7) (7.8)
The government has completed the administrative review of the financial-hardship unlocking program announced in the 2011 Budget, and intends to restructure the program to create a simpler, more streamlined process to access locked-in funds.
Consistent with the one-step application procedure for federally regulated locked-in accounts, consent of the regulator will no longer be required to withdraw money for reasons of financial hardship. Instead, applicants would be able to request withdrawals directly from their financial institutions, based on a simplified process.
Ministry of Government Services
($ Millions) 2012–13 2013–14 2014–15 3-year
total
Move Towards Self-Insurance for the General and Roads Liability Protection Program
(2.1) (2.1) (2.1) (6.4)
The government pays $2.1 million annually for insurance coverage related to the General and Roads Liability Protection Program, to respond to a variety of potential liability claims between $5 million and $20 million made against the Crown. No claims have been paid under this policy since its inception in 2003.
Based on a balance of risk relative to cost, the government will move towards full self-insurance and the policy will not be renewed in 2012–13.
16

Report on Expense Management Measures
Ministry of Labour
($ Millions) 2012–13 2013–14 2014–15 3-year
total
Greater Workload Flexibility at the Ontario Labour Relations Board
– (0.2) (0.4) (0.6)
The Ontario Labour Relations Board (OLRB), an independent adjudicative tribunal, will make the transition to part-time board members, creating greater flexibility in managing workloads. This change is anticipated to reduce wait times to schedule hearings, as well as allow the board to reach out to the broader legal community for additional members.
Ministry of Municipal Affairs and Housing
($ Millions) 2012–13 2013–14 2014–15 3-year
total
Ending Provincial Enforcement Role in Residential Rental Maintenance Standards Enforcement
– – (0.1) (0.1)
The ministry is ending the Province’s enforcement role for property maintenance standards. Most Ontario municipalities already have bylaws to address residential rental maintenance standards enforcement. Municipalities without property standards bylaws would be encouraged to assess local needs to determine whether bylaws are required and, if so, to establish bylaws and enforcement capability. This change is intended to achieve consistency across all municipalities. In the past six years, only 49 of the 164 municipalities with no bylaws or partial coverage have had inspections within their boundaries, and only three of those have had average yearly inspection fees greater than $1,000.
17

Addendum to the 2012 Ontario Budget
Ministry of Natural Resources
($ Millions) 2012–13 2013–14 2014–15 3-year
total
Streamlining Approvals Process (2.1) (2.6) (6.5) (11.1)
The ministry has reviewed its legislative requirements, business lines and delivery structure. As a result, it has developed a three-year plan to transform, refocus and reshape its role in natural resources management, as well as supporting economic growth and job creation.
New legal requirements for permitting, licensing, and the stewardship of Crown land and resources are proposed as part of the Budget. These legislative amendments would change requirements, business lines and delivery structures within the ministry to:
• enable a shift to permit by rule rather than individual authorizations;
• empower the Minister of Natural Resources to delegate approval to third parties; and
• adjust the frequency or scale of future resource planning activities.
($ Millions) 2012–13 2013–14 2014–15 3-year
total
Operational Delivery Transformation (5.0) (12.0) (36.5) (53.6)
Over the next three years, the ministry will modernize its operations for individuals and businesses. This modernization effort will ensure that Ontario’s abundant and valuable natural resources are protected for future generations.
The ministry will move away from detailed review and approval of site-specific activities, and deliver its services on larger geographic scales. It will provide resource management decisions, compliance and enforcement, monitoring and assessment using a new risk-based approach. Some stocked fishing and park-based recreational activities will be reduced to support other fish and wildlife management and recreational priorities.
18

Report on Expense Management Measures
($ Millions) 2012–13 2013–14 2014–15 3-year
total
Stewardship and Partnership Funding Reduction (2.9) (4.4) (4.4) (11.6)
The ministry is developing a new model to support stewardship delivery and partnerships. The model will reorient ministry stewardship assistance away from direct staff support to stewardship incentives and grants focused on achieving government priorities and enabling partnerships that support biodiversity conservation. In addition, the ministry will focus on reducing its involvement where other stewardship-related organizations are already active, thus reducing duplication and overlap.
($ Millions) 2012–13 2013–14 2014–15 3-year
total
Science and Information Rationalization (0.6) (3.2) (7.5) (11.2)
Science and information functions will continue to be delivered in the ministry, with a stronger focus on ecosystems than on individual species, and in a smaller, more consolidated organization.
Consistent with the changes in field delivery approaches and technology-enabled advances in science and monitoring, the ministry will:
• re-engineer existing resource monitoring and applied research programs consistent with a risk-based approach; and
• focus applied research and resource monitoring activities on ecosystems and move away, where appropriate, from ongoing individual species-related activities.
19

Addendum to the 2012 Ontario Budget
Ministry of Tourism, Culture and Sport
($ Millions) 2012–13 2013–14 2014–15 3-year
total
Ontario Travel Information Centre Closures (0.3) (1.5) (1.5) (3.3)
The government will realign its tourism marketing services by focusing on online travel marketing activities to meet consumers’ travel research preferences through a major redevelopment of its tourism information website, call centre and brochure distribution service.
Visits to the Province’s Ontario Travel Information Centres have dropped by half in the last decade, as travellers adopt a self-service approach and increasingly rely on the Internet to undertake their tourism research. Closing seven Centres with low and declining visitation will allow savings to be redirected to providing consumers with the tools and information they demand to make their travel decisions.
Ministry of Transportation
($ Millions) 2012–13 2013–14 2014–15 3-year
total
Streamline Transportation Funding (2.0) (2.4) (107.4) (111.8)
The ministry delivers programs to support sustainable transportation across Ontario. These programs include environmental assessment activities, transit initiatives and support for the Ontario Highway Transport Board (OHTB), which regulates and oversees intercity bus transportation.
The ministry is reviewing Ontario’s intercity bus regulatory regime to achieve greater efficiencies; innovative approaches to the next steps in planning the proposed high-speed rail link between Windsor and Quebec City; and other transit initiatives to achieve greater value for money.
20

Report on Expense Management Measures
($ Millions) 2012–13 2013–14 2014–15 3-year
total
Streamline Road-User Safety Programs – (1.4) (2.7) (4.1)
The ministry delivers a variety of programs related to support for road-user safety. Many of these are peripheral to the ministry’s core business. For example, it currently conducts demerit-point interviews for drivers who accumulate nine demerit points on their driving record. These interviews are to determine the appropriate course of action for such drivers, but few drivers are suspended after the interview. Reducing support for programs like this will allow the ministry to focus its road-user safety efforts on its core commitments.
Various Ministries
($ Millions) 2012–13 2013–14 2014–15 3-year
total
Other Ministry Measures – (1.5) (0.7) (2.1)
Other ministry measures include pursuing alternative delivery methods and other actions to ensure that programs and services are delivered as effectively and efficiently as possible.
21

Addendum to the 2012 Ontario Budget
Focusing on Core Business
Overview
Focusing on core business means scaling back on non-priority programs, eliminating programs that the government should not be delivering and identifying programs that the private sector could deliver more efficiently. Some of the choices are difficult. But a dollar saved through refocusing from non-core priorities is a dollar that could be used on health care, education or job creation measures, or to help balance the budget.
22

Report on Expense Management Measures
Ministry of Aboriginal Affairs
($ Millions) 2012–13 2013–14 2014–15 3-year
total
New Relationship Fund Reduction – (0.5) (0.4) (0.9)
The government assists First Nations/Métis to develop expertise and capacity related to land and resource issues. Total funding is $14.5 million.
The government will focus on achieving tangible outcomes in the most critical priority areas through the Fund. Although the overall Fund will be reduced, funding for key consultation activities will remain at current levels.
($ Millions) 2012–13 2013–14 2014–15 3-year
total
Participation Fund Reduction – (0.5) (0.4) (0.9)
The government supports First Nations/Métis organization participation in bilateral processes and community development related to socioeconomic priorities, community-identified needs and youth initiatives. Although funding to this program will be reduced, the ministry continues to work with organizations to build strong and effective capacity and economic development opportunities in First Nations/Métis communities.
($ Millions) 2012–13 2013–14 2014–15 3-year
total
Administrative Efficiencies – (0.5) (0.5) (1.0)
The ministry has reviewed its overall administrative requirements and identified opportunities to achieve operational efficiencies by constraining its spending in the areas of services, supplies and equipment.
Service costs will decrease by reducing the number of planned information technology projects and relying less on purchased services.
23

Addendum to the 2012 Ontario Budget
($ Millions) 2012–13 2013–14 2014–15 3-year
total
Aboriginal Community Capital Grants Program Reduction
– (0.5) – (0.5)
This program promotes community, economic and business development in Aboriginal communities and organizations through supporting the construction of capital infrastructure as a foundation for community capacity building and business initiatives. This program has delivered approximately $27 million in project funding to Aboriginal communities and organizations through over 100 major and minor capital projects in the past decade.
Funding to this program will be reduced for one year. It is anticipated that overall impacts will be minimal, given the planning cycle related to capital projects.
Ministry of Agriculture, Food and Rural Affairs
($ Millions) 2012–13 2013–14 2014–15 3-year
total
Rethinking Business Risk Management Programs – (19.8) (20.0) (39.7)
Business Risk Management Programs provide income stability to Ontario’s farmers. These programs are demand driven, with expenditures that can fluctuate from year to year depending on commodity prices.
Given the Province’s fiscal challenges, the Ontario government will work with farmers to redesign these programs to focus on supporting productivity while capping the overall program at a sustainable level to manage taxpayer exposure and leverage federal dollars.
24

Report on Expense Management Measures
($ Millions) 2012–13 2013–14 2014–15 3-year
total
Modernizing Research and Innovation Programs – – – –
The ministry’s research and innovation programs can be modernized to intensify their focus on consumer, market and economic outcomes in partnership with governments, industry and academia. Modernization will help provide cost avoidance of up to $30 million arising from deferred maintenance in existing research facilities.
The ministry plans to better support industry and consumer needs by moving products from research to commercialization sooner and bringing more value-added products to the marketplace, as has been done with Omega-3 eggs and nutritionally enhanced milk.
($ Millions) 2012–13 2013–14 2014–15 3-year
total
Administrative and Service Delivery Efficiencies – (3.0) (5.4) (8.4)
The ministry plans to undertake several internal reviews to enhance productivity.
Potential areas for review include a comprehensive look at how services are delivered, transfer payment accountability, and the operations of Agricorp. As a result, the ministry expects to improve efficiency of service delivery.
25

Addendum to the 2012 Ontario Budget
Ministry of the Attorney General
($ Millions) 2012–13 2013–14 2014–15 3-year
total
Capital Asset Management Strategy – – – –
The government will pursue a new strategy to meet the long-term infrastructure requirements of maintaining Provincial courthouses.
The intent of a new capital strategy for courthouses is to maintain sustainability beyond 2014–15 by exploring new opportunities that include alternative strategies for constructing courthouses (e.g., partnering with developers to build shared space) and reviewing existing facilities.
($ Millions) 2012–13 2013–14 2014–15 3-year
total
Efficiency Measures (15.3) (38.9) (62.7) (116.9)
The ministry is undertaking a variety of efficiency measures across various programs to generate savings and improve outcomes.
Cabinet Office
($ Millions) 2012–13 2013–14 2014–15 3-year
total
Review of Core Services, Processes and Procedures
– (0.7) (0.5) (1.2)
Cabinet Office will review its core services, processes and procedures in 2012–13 to achieve greater efficiencies in future operating costs.
26

Report on Expense Management Measures
Ministry of Children and Youth Services
($ Millions) 2012–13 2013–14 2014–15 3-year
total
Containing Child Protection Costs through Transformation
(16.0) (16.2) (16.2) (48.4)
Building on transformation to date, the government is working with children’s aid societies and the Commission to Promote Sustainable Child Welfare. The goal of this work is to find creative solutions to further improve the delivery of services to protect children, while containing costs through agency amalgamations; back-office consolidations; shared service delivery; developing a new funding model; establishing new approaches to accountability and outcome management; and improving service and financial management through implementation of the Child Protection Information Network.
This transformation will support children’s aid societies as they manage costs while continuing to provide services that protect children.
($ Millions) 2012–13 2013–14 2014–15 3-year
total
Implementation of a Staged Increase to the Ontario Child Benefit
– (87.4) 8.4 (79.0)
The maximum benefit level provided through the Ontario Child Benefit (OCB) will be increased in two stages, from $1,100 to $1,210 on July 1, 2013 and then to $1,310 on July 1, 2014.
This meets the government’s commitment to increase the maximum annual per-child benefit level to $1,310. This increase will extend benefits to an additional 90,000 children in 46,000 families. This is a slower increase to the OCB than the government hoped for or planned.
27

Addendum to the 2012 Ontario Budget
Ministry of Citizenship and Immigration
($ Millions) 2012–13 2013–14 2014–15 3-year
total
Ensuring Sustainable and Effective Newcomer Programs
– – (1.7) (1.7)
The government provides language training and newcomer settlement through its immigration programs and will seek efficiencies within these services to achieve savings, while minimizing the impact on client services.
Ministry of Community Safety and Correctional Services
($ Millions) 2012–13 2013–14 2014–15 3-year
total
Savings Measures (12.1) (23.3) (32.0) (67.4)
The efficiency measures and savings targets form part of the ministry’s plan, which includes the reallocation of funding to ensure the sustainability of core programs.
These measures will enable the ministry to optimize efficiency with existing resources, without adversely affecting service delivery.
($ Millions) 2012–13 2013–14 2014–15 3-year
total
Overtime Reduction (3.5) (3.5) (3.5) (10.5)
The government is working with its partners to reduce overtime costs in Correctional Services and the Ontario Provincial Police (OPP) for correctional officers, operational managers and uniformed OPP officers.
28

Report on Expense Management Measures
($ Millions) 2012–13 2013–14 2014–15 3-year
total
Extend OPP Cruiser Mileage Replacement – – (2.0) (2.0)
The ministry will explore the potential financial savings of any change in OPP fleet management policy. At a minimum, the government will evaluate operating costs, capital costs, and revenue generated from the sale of vehicles after their useful police life. Savings may also be realized through other related efficiencies created through improved engineering and technology (e.g., fuel efficiency).
($ Millions) 2012–13 2013–14 2014–15 3-year
total
Efficiency Measures (9.0) (35.8) (54.8) (99.6)
The ministry is undertaking a variety of efficiency measures across various programs to generate savings and improve outcomes.
Ministry of Economic Development and Innovation
($ Millions) 2012–13 2013–14 2014–15 3-year
total
Ontario Research Fund — Research Infrastructure and Research Excellence
– – – –
The Ministry of Economic Development and Innovation is capping funding under the operating and capital components of the Ontario Research Fund (ORF).
A cap on the ORF program would not yield savings but would provide greater flexibility to continue matching federal awards to invest in research infrastructure and ensure the continuation of the program. This would allow the government to continue funding large-scale, transformational research at Ontario’s universities, hospitals and research institutions.
29

Addendum to the 2012 Ontario Budget
($ Millions) 2012–13 2013–14 2014–15 3-year
total
Restrict Contract Extensions for Next Generation of Jobs Fund
(10.0) (38.1) (9.0) (57.1)
The ministry is not extending Next Generation of Jobs Fund (NGOJF) contracts. Most contracts are five years in duration, and contract extensions have been provided in the past when projects were delayed at start-up as a result of unforeseen circumstances or because of the recession. Not extending further contracts would yield savings of approximately $57 million over three years.
The NGOJF was launched in 2008 as a $1.15 billion fund supporting research, development and commercialization in innovative industries and attracting new investments in strategic areas of Ontario’s economy. The program stopped accepting applications in December 2009.
As some companies are currently not expecting to meet their investment commitment in the period specified in the contract, they will not be able to claim the full grant amount allowed under the contract.
($ Millions) 2012–13 2013–14 2014–15 3-year
total
Reduce Funding to Transfer Payment Recipients (2.0) (18.3) (5.0) (25.3)
Since 2003, the government has supported businesses and programs in research and innovation. The ministry is scaling back funding in selected transfer payments, including the Commercialization and Innovation Network Support.
This initiative would provide savings of approximately $25 million over three years.
30

Report on Expense Management Measures
Ministry of Education
($ Millions) 2012–13 2013–14 2014–15 3-year
total
Continuing Existing Savings Measures in the Grants for Student Needs
– – – –
Savings measures related to school board funding for classroom computers (implemented in 2009–10) and staff professional development (implemented in 2009–10 and 2011–12) will be maintained. The continuation of savings measures already in place avoids $121 million in costs over three years in a manner that does not jeopardize advances in student achievement.
($ Millions) 2012–13 2013–14 2014–15 3-year
total
Reductions to Low-Impact Grants (30.0) (38.5) (38.5) (107.0)
Opportunities have been identified to reduce or eliminate discretionary grants to school boards provided through the Education Programs — Other transfer payment. This measure impacts non-core programs, programs with other potential funding sources, and programs where impacts can be mitigated through related programs and initiatives. Reductions will be applied to funding for special projects and to grants provided to third parties for delivering programs that support ministry initiatives.
($ Millions) 2012–13 2013–14 2014–15 3-year
total
Reductions to Ministry Administration (5.8) (5.8) (5.8) (17.4)
The 2011 Budget announced efforts to make public services more effective and improve value for money by consolidating programs, services and other administrative functions, including savings of $5 million per year from the Ministry of Education.
31

Addendum to the 2012 Ontario Budget
The 2012 Budget provides an additional $5 million in annual administrative savings from the ministry, as well as a 2.5 per cent reduction in the transfer payment to the Education Quality and Accountability Office. By exploring ways to increase efficiencies, the ministry expects to further lower its operational costs without affecting its ability to deliver programs and fulfil commitments.
($ Millions) 2012–13 2013–14 2014–15 3-year
total
School Facility Operations and Renewal Grant Update
(8.1) (12.2) (11.7) (32.0)
Savings will be realized by updating benchmarks to reflect the current age and size of schools. These savings will be reallocated to fund school renewal projects, to support higher construction costs in some regions since the benchmark was last updated.
($ Millions) 2012–13 2013–14 2014–15 3-year
total
Program Enhancement Grant (15.8) (25.1) (25.1) (65.9)
The Program Enhancement Grant currently provides school boards with flexible funding to enrich existing programs or offer new programs. The grant will be discontinued, with $20 million reallocated to the Education Programs – Other transfer payment to support outdoor education. School boards may continue to offer programs previously funded by the Program Enhancement Grant by internally reallocating funds.
32

Report on Expense Management Measures
($ Millions) 2012–13 2013–14 2014–15 3-year
total
Curriculum and Teaching Specialists (21.8) (34.6) (34.6) (91.1)
Since 2002–03, school boards have hired an additional 656 curriculum and teaching specialist full-time equivalents (FTEs) to help implement board improvement plans. A reduction in the number of funded positions for curriculum and teaching specialists will be implemented for the 2012–13 school year.
($ Millions) 2012–13 2013–14 2014–15 3-year
total
Reduce Unallocated Capital Funding for Schools – – – – This savings measure represents a $75 million reduction in capital grants to school boards over the next six years, with fiscal savings of $2 million. This protects funding to support full-day kindergarten. Fiscal savings begin in 2015–16.
Ministry of Energy
($ Millions) 2012–13 2013–14 2014–15 3-year
total
Reduction in Operating Expense through Internal Efficiencies
– (1.9) (1.2) (3.1)
The ministry is pursuing internal efficiency measures to reduce program administration costs.
($ Millions) 2012–13 2013–14 2014–15 3-year
total
Ontario Clean Energy Benefit Cap of 3,000 kWh per Month
(170.0) (200.0) (100.0) (470.0)
The Ontario Clean Energy Benefit (OCEB) provides residential, farm, small business and other small users with a benefit equal to 10 per cent of the total cost of electricity on their bills, including tax, effective from January 1, 2011 to December 31, 2015.
33

Addendum to the 2012 Ontario Budget
The 2012 Budget proposes a monthly 3,000 kilowatt-hour (kWh) eligibility cap on payments made under the OCEB. This balanced approach would continue to provide the full 10 per cent benefit to almost all residential customers, while capping the benefit to the largest users.
Ministry of the Environment
($ Millions) 2012–13 2013–14 2014–15 3-year
total
Waste Program (1.7) (3.5) (3.5) (8.7)
The ministry has funding to manage hazardous wastes through a new grant program under the Selected Household Hazardous Waste Initiative.
Funding was allocated to support the collection and management of some selected wastes through retail locations, such as pharmacies. The ministry is working on options for continued management of these wastes at a reduced cost.
($ Millions) 2012–13 2013–14 2014–15 3-year
total
Water Opportunities and Water Conservation Act Savings
(7.4) (3.0) – (10.4)
As part of the 2011 Budget, the ministry announced funding of $30 million over three years to support the Water Opportunities and Water Conservation Act, 2010, including community demonstration projects, municipal water sustainability planning, and education and public awareness.
The municipal water sustainability planning support was intended to help municipalities offset the costs of developing these plans. However, regulation requiring municipalities to develop these plans is not in place and funding is not expected to flow to municipalities. Consequently, the ministry will refocus these resources on other government priorities.
34
Report on Expense Management Measures
Ministry of Finance
($ Millions) 2012–13 2013–14 2014–15 3-year
total
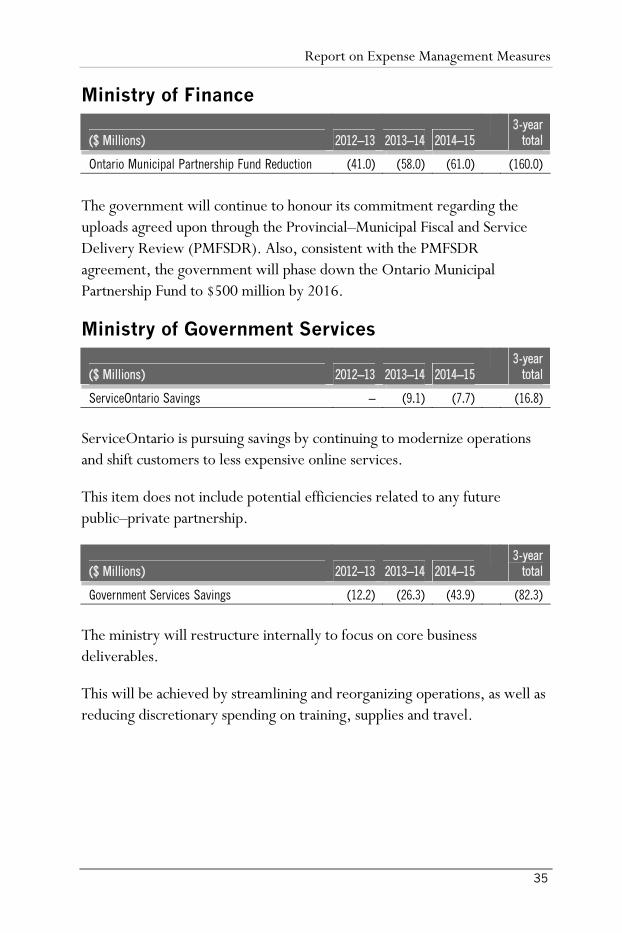
Ontario Municipal Partnership Fund Reduction (41.0) (58.0) (61.0) (160.0)
The government will continue to honour its commitment regarding the uploads agreed upon through the Provincial–Municipal Fiscal and Service Delivery Review (PMFSDR). Also, consistent with the PMFSDR agreement, the government will phase down the Ontario Municipal Partnership Fund to $500 million by 2016.
Ministry of Government Services
($ Millions) 2012–13 2013–14 2014–15 3-year
total
ServiceOntario Savings – (9.1) (7.7) (16.8)
ServiceOntario is pursuing savings by continuing to modernize operations and shift customers to less expensive online services.
This item does not include potential efficiencies related to any future public–private partnership.
($ Millions) 2012–13 2013–14 2014–15 3-year
total
Government Services Savings (12.2) (26.3) (43.9) (82.3)
The ministry will restructure internally to focus on core business deliverables.
This will be achieved by streamlining and reorganizing operations, as well as reducing discretionary spending on training, supplies and travel.
35
Addendum to the 2012 Ontario Budget
($ Millions) 2012–13 2013–14 2014–15 3-year
total
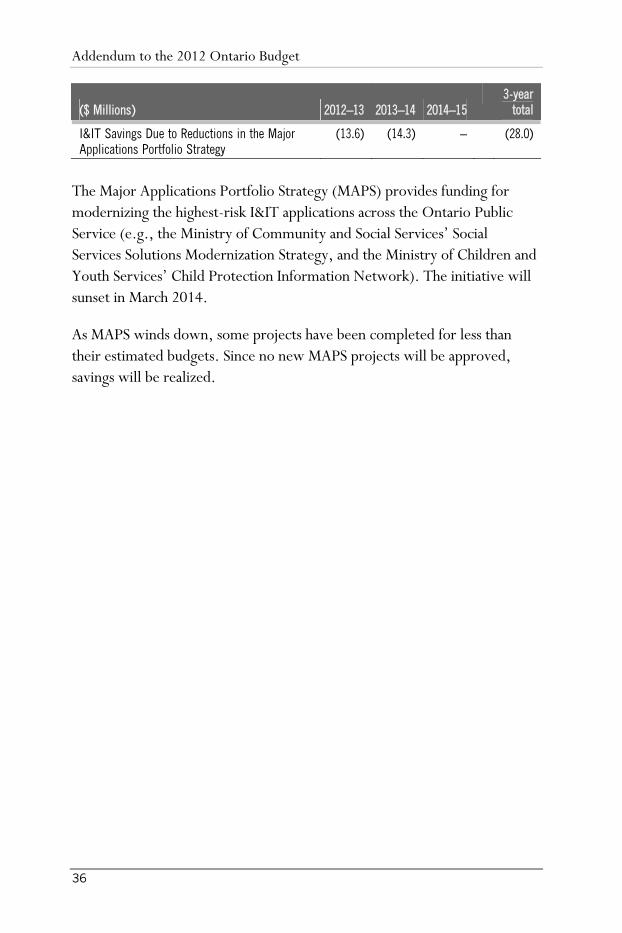
I&IT Savings Due to Reductions in the Major Applications Portfolio Strategy
(13.6) (14.3) – (28.0)
The Major Applications Portfolio Strategy (MAPS) provides funding for modernizing the highest-risk I&IT applications across the Ontario Public Service (e.g., the Ministry of Community and Social Services’ Social Services Solutions Modernization Strategy, and the Ministry of Children and Youth Services’ Child Protection Information Network). The initiative will sunset in March 2014.
As MAPS winds down, some projects have been completed for less than their estimated budgets. Since no new MAPS projects will be approved, savings will be realized.
36

Report on Expense Management Measures
Ministry of Health and Long-Term Care
($ Millions) 2012–13 2013–14 2014–15 3-year
total
Drug Programs: Savings from the Ontario Public Drug Programs
(100.0) (100.0) (100.0) (300.0)
The Ontario Drug Benefit (ODB) program provides funding for pharmaceutical products for Ontarians aged 65 and older, residents of long-term care homes and homes for special care, recipients of professional home care services and recipients of the Trillium Drug Program. Expenses in the Ontario Public Drug programs have been growing by 5.2 per cent annually since 2003–04.
These savings reflect the multi-year impact of lower-than-expected drug program spending in 2011–12.
($ Millions) 2012–13 2013–14 2014–15 3-year
total
Drug Programs: Income Testing for High-Income Seniors
– – (30.0) (30.0)
The ODB for seniors is a universal program: all seniors except for those with the lowest incomes are eligible for the same benefits regardless of income. This means that someone with an annual income of $300,000 gets the same benefits as someone with an income of $30,000 per year.
To improve the fairness of the program, high-income seniors will pay a new income-tested deductible, which will increase gradually with income. This change will be effective beginning August 2014. Savings in the program will be achieved as high-income seniors pay a larger share of prescription drug costs now covered by the ODB. About five per cent of senior ODB recipients will be paying more under this change.
37

Addendum to the 2012 Ontario Budget
($ Millions) 2012–13 2013–14 2014–15 3-year
total
OHIP – Out-of-Country/Out-of-Province Savings (35.6) (29.0) (29.0) (93.6)
Ontario currently has a prior-approval program in place for Ontarians requesting health services outside Canada. Ontario has signed interprovincial hospital billing agreements with all provinces and territories. Hospital services provided by other provinces/territories to Ontario residents are reimbursed by Ontario. There are no charges to the patient when insured services are provided in a publicly funded hospital.
Savings will be achieved through more efficient management of the program.
($ Millions) 2012–13 2013–14 2014–15 3-year
total
Long-Term Care Homes: Savings From Lower-than-Expected Long-Term Care Homes Spending
(70.0) (70.0) (70.0) (210.0)
Long-term care (LTC) homes provide care and services for people who are no longer able to live independently in their own homes, and who require 24-hour personal care, support and supervision.
These savings represent the multi-year impact of lower-than-expected long-term care home spending in 2011–12.
38
Report on Expense Management Measures
($ Millions) 2012–13 2013–14 2014–15 3-year
total
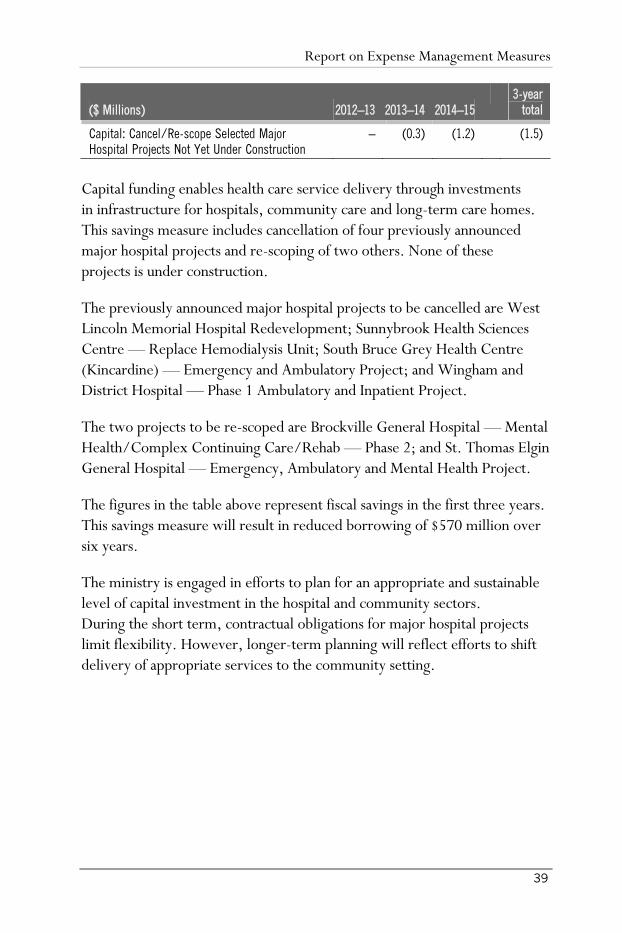
Capital: Cancel/Re-scope Selected Major Hospital Projects Not Yet Under Construction
– (0.3) (1.2) (1.5)
Capital funding enables health care service delivery through investments in infrastructure for hospitals, community care and long-term care homes. This savings measure includes cancellation of four previously announced major hospital projects and re-scoping of two others. None of these projects is under construction.
The previously announced major hospital projects to be cancelled are West Lincoln Memorial Hospital Redevelopment; Sunnybrook Health Sciences Centre — Replace Hemodialysis Unit; South Bruce Grey Health Centre (Kincardine) — Emergency and Ambulatory Project; and Wingham and District Hospital — Phase 1 Ambulatory and Inpatient Project.
The two projects to be re-scoped are Brockville General Hospital — Mental Health/Complex Continuing Care/Rehab — Phase 2; and St. Thomas Elgin General Hospital — Emergency, Ambulatory and Mental Health Project.
The figures in the table above represent fiscal savings in the first three years. This savings measure will result in reduced borrowing of $570 million over six years.
The ministry is engaged in efforts to plan for an appropriate and sustainable level of capital investment in the hospital and community sectors. During the short term, contractual obligations for major hospital projects limit flexibility. However, longer-term planning will reflect efforts to shift delivery of appropriate services to the community setting.
39

Addendum to the 2012 Ontario Budget
($ Millions) 2012–13 2013–14 2014–15 3-year
total
Agency Efficiency (14.1) (14.1) (14.1) (42.2)
The ministry will require all classified agencies to find efficiency savings by reducing their administrative costs. Classified agencies that receive more than $5 million in ministry funding will be given a five per cent constraint to their administrative expense allocation, and all other classified agencies that receive less than $5 million will see a two per cent cut to this allocation. This initiative will result in annual savings of $14.1 million, beginning in 2012–13.
($ Millions) 2012–13 2013–14 2014–15 3-year
total
Clinical Education (13.5) (14.2) (15.0) (42.8)
The Province is committed to working with its partners to continually improve the quality of medical education and demonstrate results to citizens. The government also provides various streams of funding to support the expansion of community-based medical education.
The government will achieve savings by reducing per-resident funding to medical schools to reflect the amount required to support quality health outcomes from new professionals. Funding for indirect teaching costs will also be reduced.
($ Millions) 2012–13 2013–14 2014–15 3-year
total
Other Ministry Savings (37.7) (33.9) (106.3) (178.0)
The goal of reforms under Ontario’s Action Plan for Health Care is to achieve better patient care through better value from health care dollars. This will be achieved through reallocating funding to areas of greatest value. As a result, programs with historical underspending or discretionary funding are being right-sized to achieve additional savings.
40

Report on Expense Management Measures
Ministry of Infrastructure
($ Millions) 2012–13 2013–14 2014–15 3-year
total
Refocusing Federal-Provincial Projects (59.8) (29.1) (12.4) (101.3)
The ministry proposes to use funding from other parts of the provincial capital plan to leverage federal funding for priority projects under the federal Building Canada Plan.
($ Millions) 2012–13 2013–14 2014–15 3-year
total
Renewal Investment in Government Buildings (6.8) (13.2) (74.4) (94.4)
The ministry will reduce investments for the ongoing capital repair and upgrade of government buildings.
41

Addendum to the 2012 Ontario Budget
Ministry of Municipal Affairs and Housing
($ Millions) 2012–13 2013–14 2014–15 3-year
total
End the Dr. Albert Rose Bursary (1.2) (1.2) (1.2) (3.5)
The Dr. Albert Rose bursary was established to provide one-time support for postsecondary students living in social housing. Ending this bursary will not affect the support provided to current bursary recipients.
Through the introduction of the 30% Off Ontario Tuition grant in January 2012, the government is providing eligible students with financial support. The elimination of the Dr. Albert Rose bursary is consistent with the government’s approach to streamline student financial assistance.
($ Millions) 2012–13 2013–14 2014–15 3-year
total
Social Housing Transfer Reductions – (3.8) (11.2) (15.0)
Under the Canada–Ontario Social Housing Agreement (SHA), municipalities receive annual payments for eligible social housing projects, based on the historical funding requirements for those projects. The federal revenue to support these payments is provided to the Province and the Province flows the funding through to municipalities. As social housing projects mature, federal revenue to support the SHA declines. Scheduled reductions reflect the decrease in provincial expense as a result of decreases in projected federal funding.
These reductions do not alter the existing agreements with municipalities.
42

Report on Expense Management Measures
Ministry of Natural Resources
($ Millions) 2012–13 2013–14 2014–15 3-year
total
Reduce Capital Funding for Ontario Parks (0.9) (1.2) (1.6) (3.7)
Ontario Parks capital funding is used to support infrastructure such as washroom and shower facilities, administrative buildings, water systems, electrical systems, roads, trails, docks, picnic tables, and waste disposal facilities. The ministry is prioritizing rehabilitation and repairs to the Ontario Parks system to ensure the most efficient use of public funding.
Ministry of Northern Development and Mines
($ Millions) 2012–13 2013–14 2014–15 3-year
total
Northern Industrial Electricity Rate Program Savings
(12.8) – – (12.8)
The Northern Industrial Electricity Rate Program was announced as part of the 2010 Budget as a three-year, $150 million per year program that would provide electricity price rebates to northern industrial facilities.
The ministry is projecting lower-than-expected demand for 2012–13, resulting in fiscal savings.
($ Millions) 2012–13 2013–14 2014–15 3-year
total
Ontario Northland Transportation Commission – (131.2) (134.7) (265.9)
The ministry provides a subsidy to the Ontario Northland Transportation Commission (ONTC) to support its operating and capital expenses, which have risen by an unsustainable 274 per cent since 2003.
43

Addendum to the 2012 Ontario Budget
With government subsidies to the agency rising to these unsustainable levels, some parts of the ONTC will be divested and an alternative business model will be developed for key transportation services in northern Ontario.
Savings associated with the ONTC will result from a combination of no longer subsidizing the ONTC and its expenses no longer being consolidated with the ministry’s expenses.
($ Millions) 2012–13 2013–14 2014–15 3-year
total
Reprioritize Northern Highways Rehabilitation Funding
– (0.4) (1.8) (2.2)
The ministry will continue to work with the Ministry of Transportation to prioritize rehabilitation work based on comprehensive asset management systems. This helps ensure continued public safety while delivering the greatest value for each dollar invested. The ministry will continue to seek efficiencies while prioritizing rehabilitation projects to achieve the reductions.
The figures in the table above represent the fiscal savings in the first three years. Investments in northern highways rehabilitation will be reduced by $208 million over the next six years.
Office of the Premier
($ Millions) 2012–13 2013–14 2014–15 3-year
total
Administrative Efficiencies – (0.1) (0.1) (0.2)
The Office of the Premier will achieve efficiencies in operating costs.
44

Report on Expense Management Measures
Ministry of Tourism, Culture and Sport
($ Millions) 2012–13 2013–14 2014–15 3-year
total
Implement Constraints on Agencies (0.9) (1.9) (1.9) (4.7)
The ministry will reduce seven cultural attraction agency operating grants and one tourism attraction agency operating grant by one per cent in 2012–13, and by a further one per cent in 2013–14 and ongoing for 2014–15.
The cultural attraction agencies are the Art Gallery of Ontario, McMichael Canadian Art Collection, Ontario Heritage Trust, Ontario Science Centre, Royal Botanical Gardens, Royal Ontario Museum and Science North. The St. Lawrence Parks Commission is the impacted tourism agency.
($ Millions) 2012–13 2013–14 2014–15 3-year
total
Ontario Tourism Marketing Partnership Corporation Efficiencies
(0.9) (1.1) (1.4) (3.4)
The Ontario Tourism Marketing Partnership Corporation (OTMPC) is a government agency that collaborates with tourism partners locally and internationally to showcase Ontario as a premier all-season travel destination.
A review of OTMPC’s internal operations has resulted in savings.
($ Millions) 2012–13 2013–14 2014–15 3-year
total
Luminato Reduction (1.5) (2.0) – (3.5)
The government provides time-limited funding to support the Luminato festival, but will reduce funding over the next two years to redirect savings to other priority areas.
45

Addendum to the 2012 Ontario Budget
($ Millions) 2012–13 2013–14 2014–15 3-year
total
Convention Development Fund – (0.3) – (0.3)
The Convention Development Fund helps eligible Ontario cities offset key costs to attract increased convention business and visitor spending, and received funding as part of the 2010 Budget. The ministry is sunsetting the program one year early.
The long-term funding model for Regional Tourism Organizations will be in place by early 2013–14 and will mitigate the termination of this program.
($ Millions) 2012–13 2013–14 2014–15 3-year
total
Efficiency Measures (0.5) (1.5) (12.4) (14.4)
The ministry is undertaking efficiency measures across various programs, including those arising as a result of the merger of the Sport program.
($ Millions) 2012–13 2013–14 2014–15 3-year
total
Flatline Renewal Funding for Tourism Agencies – – (1.7) (1.7)
Capital renewal funding supports infrastructure improvements at attractions such as the St. Lawrence Parks Commission, Huronia Historical Parks and Fort William Historical Park. The ministry will continue to work with tourism agencies and attractions to seek efficiencies and prioritize investments.
The figures in the table above represent the fiscal savings in the first three years. Investments in renewal will be reduced by $21 million over the next six years.
46

Report on Expense Management Measures
($ Millions) 2012–13 2013–14 2014–15 3-year
total
Partial Closure of Ontario Place – – – –
On February 1, 2012, the government announced the transformation and revitalization of Ontario Place, which will be completed by 2017, in time to celebrate Canada’s 150th anniversary. This transformation will require partial closure of the site, starting in 2012.
Partial closure of some of the facilities at Ontario Place (i.e., the water park, amusement rides and Cinesphere) is estimated to avoid potential costs of up to $20 million in operating and capital requirements.
Ministry of Training, Colleges and Universities
($ Millions) 2012–13 2013–14 2014–15 3-year
total
Policy Levers – (40.0) (81.0) (121.0)
The government will work with the postsecondary sector to enhance innovation and productivity to support efficiency targets while supporting quality education for students. Further details will be available by early this summer.
($ Millions) 2012–13 2013–14 2014–15 3-year
total
Scaling Back or Discontinuing Non-Core Grants and Bursaries
(26.7) (27.1) (30.4) (84.2)
The ministry has identified savings primarily from the discontinuation of some scholarships and bursaries to streamline student financial assistance following the introduction of the 30% Off Ontario Tuition grant.
In addition, savings include the discontinuation of some special grants such as phased elimination of the Small, Northern and Rural Grant for some colleges.
47

Addendum to the 2012 Ontario Budget
($ Millions) 2012–13 2013–14 2014–15 3-year
total
Eliminating Study-Abroad Scholarships and Reducing Support to Institutions for Non-PhD International Students
(4.0) (27.4) (44.1) (75.4)
The ministry has identified a reduction in indirect support, through operating grants that the government provides to non-PhD international students, as well as the elimination of subsidies for non-PhD international students provided to institutions to pay for municipal taxation in lieu of property taxes.
In addition, the government is eliminating subsidies for international recruitment and study-abroad scholarships.
($ Millions) 2012–13 2013–14 2014–15 3-year
total
Capital Reprofile (14.8) (10.1) (3.5) (28.4)
Capital funding for colleges and university projects will be realigned with expected construction and completion timelines.
($ Millions) 2012–13 2013–14 2014–15 3-year
total
Capital: Reduce Unallocated Postsecondary Capacity Funding
– – – –
This savings measure represents fiscal savings of $164 million over the next six years, resulting from a reduction in unallocated funding to further expand capacity at postsecondary institutions. This protects funding for the postsecondary capacity expansion projects announced in 2011. Fiscal savings begin in 2015–16.
48

Report on Expense Management Measures
Ministry of Transportation
($ Millions) 2012–13 2013–14 2014–15 3-year
total
Provincial Highways Management Transformation (15.6) (18.2) (19.3) (53.2)
The ministry will return certain contract oversight and engineering services in-house. These had been outsourced to the private sector, but the ministry has faced difficulty in achieving value for money in this regard: the limited market for such services, especially in northern Ontario, has resulted in the ministry paying above-market prices in recent years. Returning these services to internal production will lead to savings.
($ Millions) 2012–13 2013–14 2014–15 3-year
total
Metrolinx Fare Collection Efficiencies (1.5) (3.4) (3.4) (8.3)
Metrolinx has indicated it is capable of carrying out its internal operations with more efficiency. The implementation of the PRESTO Farecard, which automates fare collection and processing work, reduces reliance on ticket-taking staff. Consequently, Metrolinx can provide the same level of service for less cost.
($ Millions) 2012–13 2013–14 2014–15 3-year
total
Reprioritize Highway Expansion and HOV Projects (1.1) (3.1) (10.0) (14.2)
The ministry is delaying a small number of previously approved highway expansion and high-occupancy vehicle (HOV) lane projects. Other planned HOV projects will be delayed until fiscal capacity allows them to proceed. The reductions do not affect commitments including the Windsor-Essex Parkway, 407 East Extension and new HOV lanes on Highway 417 in Ottawa.
Investments in the ministry’s highway expansion and HOV projects will be reduced by $229 million over the next six years. The figures in the table above represent the fiscal savings over the first three years.
49

Addendum to the 2012 Ontario Budget
50
($ Millions) 2012–13 2013–14 2014–15 3-year
total
Reprioritize Highway Rehabilitation and GO Transit Funding
(0.5) (3.0) (13.1) (16.6)
The ministry and Metrolinx prioritize rehabilitation work on provincial highways and on the GO Transit network based on comprehensive asset management systems. This helps ensure continued public safety while delivering the greatest value for each dollar invested. The ministry will continue to seek efficiencies while prioritizing highway rehabilitation projects. Metrolinx will review GO Transit projects as part of this work.
The figures in the table above represent the fiscal savings in the first three years. Investments in highway rehabilitation and in GO Transit will be reduced by $1.4 billion over the next six years.
Various Ministries
($ Millions) 2012–13 2013–14 2014–15 3-year
total
Other Ministry Measures (12.0) (5.9) (2.5) (20.5)
Other ministry measures include actions across government, such as scaling back non-priority programs, implementing administrative efficiencies, eliminating programs that ministries should not be delivering, or identifying programs that the private sector could deliver more efficiently.