Embed Size (px)
Citation preview

Oracle® CloudAdministering Planning for Oracle Planningand Budgeting Cloud
E94139-05

Oracle Cloud Administering Planning for Oracle Planning and Budgeting Cloud,
E94139-05
Copyright © 2001, 2018, Oracle and/or its affiliates. All rights reserved.
Primary Author: EPM Information Development Team
This software and related documentation are provided under a license agreement containing restrictions onuse and disclosure and are protected by intellectual property laws. Except as expressly permitted in yourlicense agreement or allowed by law, you may not use, copy, reproduce, translate, broadcast, modify,license, transmit, distribute, exhibit, perform, publish, or display any part, in any form, or by any means.Reverse engineering, disassembly, or decompilation of this software, unless required by law forinteroperability, is prohibited.
The information contained herein is subject to change without notice and is not warranted to be error-free. Ifyou find any errors, please report them to us in writing.
If this is software or related documentation that is delivered to the U.S. Government or anyone licensing it onbehalf of the U.S. Government, then the following notice is applicable:
U.S. GOVERNMENT END USERS: Oracle programs, including any operating system, integrated software,any programs installed on the hardware, and/or documentation, delivered to U.S. Government end users are"commercial computer software" pursuant to the applicable Federal Acquisition Regulation and agency-specific supplemental regulations. As such, use, duplication, disclosure, modification, and adaptation of theprograms, including any operating system, integrated software, any programs installed on the hardware,and/or documentation, shall be subject to license terms and license restrictions applicable to the programs.No other rights are granted to the U.S. Government.
This software or hardware is developed for general use in a variety of information management applications.It is not developed or intended for use in any inherently dangerous applications, including applications thatmay create a risk of personal injury. If you use this software or hardware in dangerous applications, then youshall be responsible to take all appropriate fail-safe, backup, redundancy, and other measures to ensure itssafe use. Oracle Corporation and its affiliates disclaim any liability for any damages caused by use of thissoftware or hardware in dangerous applications.
Oracle and Java are registered trademarks of Oracle and/or its affiliates. Other names may be trademarks oftheir respective owners.
Intel and Intel Xeon are trademarks or registered trademarks of Intel Corporation. All SPARC trademarks areused under license and are trademarks or registered trademarks of SPARC International, Inc. AMD, Opteron,the AMD logo, and the AMD Opteron logo are trademarks or registered trademarks of Advanced MicroDevices. UNIX is a registered trademark of The Open Group.
This software or hardware and documentation may provide access to or information about content, products,and services from third parties. Oracle Corporation and its affiliates are not responsible for and expresslydisclaim all warranties of any kind with respect to third-party content, products, and services unless otherwiseset forth in an applicable agreement between you and Oracle. Oracle Corporation and its affiliates will not beresponsible for any loss, costs, or damages incurred due to your access to or use of third-party content,products, or services, except as set forth in an applicable agreement between you and Oracle.
Contents
Documentation Accessibility
Documentation Feedback
1 Getting Started
About Planning 1-1
About the Application 1-1
Application Features 1-1
About the Home Page 1-2
Launching the Application 1-5
Considerations When Using the Application Interface 1-5
Managing Application Access 1-5
Enabling Access to Application Artifacts On Mobile Devices 1-5
About Cell Formatting 1-6
Copying and Pasting Data Between Microsoft Excel and Application Web Forms1-6
About Instant Save 1-6
About Autosave 1-7
2 Creating an Application
About Creating an Application 2-1
Selecting the Application Type 2-1
Creating a Reporting Application 2-2
Creating a Sample Application 2-3
Creating a Standard Application 2-4
Choosing Setup Options 2-5
Setting Up Currencies 2-5
About Simplified Multicurrency 2-5
About Standard Multicurrency 2-7
Customizing the Cube Names 2-8
iii
Setting Up the Calendar 2-9
Setting Up Custom Dimensions and Metadata 2-10
Taking the Product Tour 2-11
3 Setting Up Access Permissions
About User and Role Management 3-1
Application Artifacts That Can Be Assigned Permissions 3-1
Types of Access Permissions 3-2
Managing Permissions to Artifacts 3-3
About Assigning Permissions to Forms, Rules, and Folders 3-4
Adding, Changing, and Removing Permissions to Forms and Folders 3-5
Adding, Changing, and Removing Permissions to Rules and Rules Folders 3-5
Adding, Changing, and Removing Permissions to Dashboards and Infolets 3-6
Reporting on Access Permissions 3-6
Working with Access Permissions Reports 3-8
Retrieving Changed Information from Access Control 3-8
4 Managing Applications
Application Overview 4-1
Refreshing the Application 4-2
Managing Cubes 4-2
Viewing and Managing Cubes 4-2
Adding Cubes 4-3
Clearing Cubes 4-3
About Clearing Cubes 4-3
Creating Clear Cube Jobs 4-4
Starting and Deleting Clear Cube Jobs 4-5
Scheduling Clear Cube Jobs 4-5
Improving Cube Performance 4-5
Managing Dimensions 4-7
Filtering the Dimension View by Cube 4-8
Creating Dimensions 4-8
Viewing Activity Reports 4-8
Importing and Exporting Data and Metadata 4-9
Importing Metadata 4-9
Creating the Import File 4-9
Loading the Import File 4-13
Exporting Metadata 4-14
Importing and Exporting Data 4-15
iv
Importing Data 4-15
Driver Member Casting Errors 4-17
Exporting Data 4-18
Viewing Data Import and Export Status 4-19
Importing Exchange Rates for a Simplified Multicurrency Application 4-19
Creating and Refreshing Application Databases 4-20
Creating Application Databases 4-20
Before Refreshing the Database 4-20
Refreshing Application Databases 4-20
Adding an Aggregate Storage Outline to an Application 4-21
About Aggregate Storage 4-21
Aggregate Storage Outline Cube Characteristics 4-21
Process for Adding an Aggregate Storage Database to an Application 4-22
Converting to a Standard Application 4-22
Converting an Oracle Planning and Budgeting Cloud Application to an OracleEnterprise Planning and Budgeting Cloud Application 4-23
Conversion Considerations 4-24
Removing an Application 4-24
Setting Service Maintenance Time 4-24
Uploading and Downloading Files Using the Application Inbox and Outbox 4-25
5 Using the Member Selector
Working with Members 5-1
Making Selections 5-1
Member Relationships 5-4
Using Wildcards in Searches 5-4
Selecting Attribute Values as Members 5-5
Selecting Members for Forms 5-8
Selecting Substitution Variables as Members 5-9
Selecting User Variables as Members 5-10
6 Connecting Subscriptions in EPM Cloud
About Connecting EPM Cloud Subscriptions 6-1
Considerations When Migrating Cross-Subscription Connections 6-3
Creating, Editing, and Deleting Connections to Other EPM Cloud Subscriptions 6-3
Navigating Across EPM Cloud Subscriptions 6-5
Customizing Navigation Flows to Access Other EPM Cloud Subscriptions 6-6
Grouping Cards from Other EPM Cloud Subscriptions into Clusters 6-6
Configuring Cards with Tabs from Multiple EPM Cloud Subscriptions 6-9
v
7 Designing Custom Navigation Flows
Understanding Navigation Flows 7-1
What Can Be Customized in the Application Interface? 7-1
Navigation Flow Customization Categories 7-2
Navigation Flow Permissions 7-2
Predefined Navigation Flows 7-2
Viewing and Working with Navigation Flows 7-3
Creating and Duplicating Navigation Flows 7-3
Editing a Navigation Flow 7-4
Activating and Deactivating Navigation Flows 7-5
Customizing Labels for Cards, Tabs, and Clusters 7-5
Customizing Icons for Cards and Vertical Tabs 7-6
Hiding and Unhiding Cards and Tabs 7-6
Changing the Display Order of Cards on the Home Page 7-7
Adding Cards 7-7
Adding Tabs to a Tabular Page 7-9
Removing Navigation Flows, Cards, and Tabs 7-10
Grouping Cards into Clusters 7-11
Reloading a Navigation Flow 7-12
Switching Navigation Flows at Runtime 7-12
Why Is My Referenced Card, Tab, or Cluster Not Visible? 7-13
8 Editing Dimensions in the Simplified Dimension Editor
About Editing Dimensions in the Simplified Dimension Editor 8-1
Dimension Overview 8-1
About Dimensions and Members 8-2
About Sparse and Dense Dimensions 8-2
About Dimension Hierarchies 8-2
About Custom Dimensions 8-2
Aggregation Options 8-3
Storage Options 8-3
About Entities 8-5
About Accounts 8-5
Account Types 8-6
Saved Assumptions 8-8
Data Type and Exchange Rate Type 8-9
Accounts, Entities, Periods, and Cubes 8-9
Accessing the Simplified Dimension Editor 8-10
Working with the Simplified Dimension Editor Grid 8-10
Switching to Another Dimension 8-10
vi
Customizing the Column Layout 8-11
Viewing Ancestors 8-11
Showing Member Usage in an Application 8-12
Focusing Your Editing 8-12
Finding Members 8-12
Moving Members 8-13
Sorting Members 8-13
Moving Members to Another Hierarchy 8-13
Working with Member Formulas 8-14
Copying Member Names from Microsoft Excel 8-14
Editing Dimension Properties in the Simplified Dimension Editor 8-15
Editing Member Properties in the Simplified Dimension Editor 8-18
Accessing Edit Member Properties 8-18
Adding Members in the Simplified Dimension Editor 8-23
Editing Members in the Simplified Dimension Editor 8-24
Deleting Members in the Simplified Dimension Editor 8-25
Adding Shared Members in the Simplified Dimension Editor 8-26
Assigning Access to Members 8-27
Adding, Editing, and Removing Access to Members 8-27
About Effective Access Permissions to Shared Members 8-28
Setting Up Scenarios and Specifying Versions 8-29
Setting Up Scenarios 8-29
About Scenarios 8-29
Creating, Editing, and Deleting Scenarios 8-30
Copying Scenarios 8-31
Specifying Versions 8-32
About Versions 8-32
Target and Bottom Up Versions 8-32
Creating, Editing, and Deleting Versions 8-32
Viewing Version Types 8-34
9 Designing Dashboards
The Power of Dashboards 9-1
Concepts in Designing Dashboards 9-3
Designing Dashboards 9-4
About Your Dashboard's Layout 9-5
About the Gauge Chart Type 9-5
About the Tile Chart Type 9-8
Customizing Dashboard Colors 9-9
Setting Line Width in Line and Combination Charts 9-10
vii
About Global and Local POVs 9-11
Dashboard POVs and Valid Intersections 9-13
Comparing Dashboards to Composite Forms 9-13
10
Designing Infolets
About Infolets 10-1
Anatomy of an Infolet 10-3
Determining Infolet Content 10-6
Designing Forms for Infolets 10-7
Designing Charts for Infolets 10-7
Using the Infolets Designer 10-8
Creating Infolets 10-10
Working with Infolets 10-10
Customizing the Application Interface to Access Infolets 10-11
11
Managing Sandboxes
About Sandboxes 11-1
Enabling Sandboxes 11-2
Enabling Version Members 11-3
How Sandboxes Work with HSP_View and Version Members 11-4
The HSP_View Dimension 11-4
Sample Formula for the ConsolidatedData Member 11-4
Sandbox Version Members 11-5
Sandbox Implications on Member Formulas 11-5
What Happens When a Sandbox is Published? 11-6
Managing Sandboxes 11-6
Sandboxes and Other Functionality 11-7
12
Defining Valid Intersections
Understanding Valid Intersections 12-1
Valid Intersection Groups 12-2
Valid Intersection Rules 12-2
Anchor and Nonanchor Dimensions 12-2
Valid Intersection Examples 12-3
Redundancy or Overlap in Valid Intersection Rules 12-6
Shared Members and Valid Intersection Rules 12-6
Substitution Variables and Valid Intersection Rules 12-6
Evaluation Order 12-6
Creating Valid Intersections 12-7
viii
Managing Valid Intersections 12-8
Viewing Valid Intersections 12-8
Changing the Valid Intersection Group Evaluation Order 12-8
Disabling and Enabling Valid Intersection Groups 12-9
Editing Details for a Valid Intersection Group 12-9
Duplicating Valid Intersection Groups 12-10
Deleting a Valid Intersection Group 12-10
Suppressing Invalid Data in Forms 12-11
Clearing Invalid Data 12-11
About Invalid Data 12-11
Working With Invalid Intersection Reports 12-11
Clearing Data at Invalid Intersections 12-12
Working with Valid Intersections 12-12
Working with Valid Intersections in Application Forms 12-12
Working with Valid Intersections in Calculation Manager Rule Runtime Prompts 12-15
13
Defining Data Maps
Understanding Data Maps 13-1
About Applications 13-1
About Reporting Cubes 13-2
Unsupported Features with Data Maps 13-2
Data Maps and Substitution Variables 13-2
Creating Data Maps 13-2
Refreshing Data Maps 13-3
Managing Data Maps 13-3
Changing Mapping Information 13-4
Mapping Unmapped Dimensions 13-4
Defining Data Map Options 13-4
Editing Details for a Data Map 13-5
Duplicating a Data Map 13-6
Deleting a Data Map 13-6
Synchronizing Smart Lists in Reporting Applications 13-6
Setting Data Options 13-7
Validation Rules for Default Members 13-7
Moving Data 13-8
Moving Data to a Reporting Cube 13-8
Moving Data from One Cube to Another Cube Using Smart Push 13-9
About Smart Push 13-10
Considerations When Using Smart Push 13-10
Configuring Smart Push for a Form 13-10
ix
Configuring Merge Options 13-12
Moving Data After Configuring Smart Push 13-12
Viewing the Smart Push Status 13-13
Running Data Mapping and Smart Push Processes Simultaneously 13-13
14
Managing Jobs
How Jobs Save You Time 14-1
Viewing Pending Jobs and Recent Activity 14-1
Scheduling Jobs 14-2
Editing and Canceling Jobs 14-3
Canceling Rules Jobs and Ruleset Jobs 14-4
Downloading Export Files From Your Outbox 14-4
15
Auditing Tasks and Data
Auditing Overview 15-1
Enabling Audit Tracking 15-3
Viewing Audit Details 15-3
16
Managing Data Validation
Creating and Updating Data Validation Rules 16-1
Formatting Cells and Setting the Promotional Path 16-4
Viewing Data Validation Rules 16-5
Order of Evaluation and Execution for Data Validation Rules 16-5
Conditions Supported by the Rule Builder 16-6
If Condition Values 16-6
Then Condition Values 16-13
Range Condition Values 16-14
Data Validation Conditional Operators 16-15
Data Validation Rule Scenarios 16-16
17
Managing Application Settings
What Application Settings Can I Specify? 17-1
Defining User Variables 17-1
Customizing Your Display 17-2
Announcing Upcoming Events 17-2
Specifying Artifact Labels 17-2
Which Artifact Labels Can be Localized? 17-3
Working With the Artifact Labels Grid 17-4
x
Adding Languages and Defining Localized Artifact Labels 17-4
Exporting and Importing Artifact Labels for Editing 17-5
18
Accessing More Administrative Tasks
About the Navigator Menu 18-1
Administering Application Settings 18-2
Setting Application Defaults 18-2
Specifying System Settings 18-3
Limiting Use of an Application 18-5
Specifying Custom Tools 18-5
Administering Data Load Settings 18-5
Importing Using Data Management 18-6
Importing Data Using Data Management 18-7
Import Scenario Case 1: Importing Data when Member Names Match 18-7
Import Scenario Case 2: Importing Data when Member Names Do NotMatch 18-7
Scheduling Jobs in Data Management 18-11
Drilling Through to Source Data 18-12
For More Information 18-12
Administering Action Menus 18-14
Creating and Updating Action Menus 18-15
Working with Action Menu Items 18-15
Defining Action Menu Items 18-16
Administering Alias Tables 18-19
About Aliases 18-19
About Alias Tables 18-20
Working with Alias Tables 18-20
Specifying a Default Alias Table and Setting Member and Alias Display Options 18-21
Administering Dimensions 18-22
About Dimensions 18-22
Working with Dimension Hierarchies 18-23
Filtering the Dimension View by Cube 18-23
Finding Dimensions or Members 18-23
Sorting Members 18-23
About Assigning Access to Members 18-24
Viewing a Member’s Ancestors 18-24
Determining Where Members Are Used in an Application 18-24
About Custom Dimensions, Entities, Accounts, Periods, and Cubes 18-24
Adding or Editing User-Defined Custom Dimensions 18-25
Setting Dimension Properties 18-25
Setting Dimension Density and Order 18-26
xi
Setting the Evaluation Order 18-27
Working with Members 18-27
About Dynamic Members 18-27
Adding or Editing Members 18-29
Deleting Members 18-36
Deleting Parent Members 18-37
Viewing Member Properties from Forms 18-37
Working with Shared Members 18-37
Creating Shared Members 18-38
Working with Attributes 18-38
Understanding Attribute Data Types 18-39
Deleting Attributes 18-40
Working with Attribute Values 18-40
Creating Attribute Values 18-40
Assigning Attribute Values to Members 18-41
Editing and Deleting Attribute Values 18-41
Customizing Calendars 18-42
Defining How Calendars Roll Up 18-42
Creating and Editing Summary Time Periods 18-43
Deleting Summary Time Periods 18-43
Working with the Years Dimension 18-44
Adding Years to the Calendar 18-44
Editing Year Information 18-45
Renaming Time Periods 18-45
Assigning Aliases to Summary Time Periods 18-45
Editing the BegBalance Member 18-46
Setting Up Currencies 18-46
Enabling Multiple Currencies 18-46
Specifying Exchange Rates 18-54
Setting up Dynamic Time Series Members 18-56
Additional Supported Application Features 18-57
Considerations for Alternate Hierarchies in Period Dimensions 18-58
Working with UDAs 18-58
Working with Member Formulas 18-59
Viewing Details of Formula Validation 18-60
Working with Formula Expressions 18-61
Administering Forms 18-64
About Forms 18-65
Form Components 18-65
Form Design Considerations 18-66
Understanding Implied Sharing in Forms 18-68
xii
Creating Simple Forms 18-68
Defining the Layout 18-69
About Precision Settings 18-78
Setting Form Precision and Other Options 18-78
Creating Asymmetric Rows and Columns 18-79
Adding Formula Rows and Columns 18-79
Defining Simple Form Page and Point of View 18-80
Creating Composite Forms 18-81
Setting Composite Form Layout 18-81
Setting Composite Form Section Properties 18-84
Setting Composite Form Point of View and Page Dimensions 18-85
Creating Master Composite Forms 18-86
Embedding Charts in Composite Forms 18-87
Designing Specific Types of Forms 18-90
Designing Forms for Multiple Currencies 18-90
Designing Forms with Formula Rows and Columns 18-90
Designing Forms with Data Validation 18-90
Designing Forms with Global Assumptions 18-90
Designing Forms for Rolling Forecasts 18-91
Working with Forms and Form Components 18-94
Selecting and Opening Forms and Folders 18-94
Previewing Forms 18-95
Printing Form Definitions 18-95
Searching for Forms 18-96
Editing Forms 18-96
Moving, Deleting, and Renaming Forms 18-97
How Cell Formatting in Smart View Persists in Planning 18-98
Managing Forms and Folders 18-98
Creating Folders 18-98
Working with Folders 18-99
Administering Rules 18-100
About Rules 18-100
Selecting Business Rules 18-100
Setting Business Rule Properties 18-101
Viewing Rules Usage 18-102
About Runtime Prompts 18-105
Understanding Runtime Prompts 18-105
About Runtime Prompts and Approvals Security 18-110
Designing Secure Runtime Prompts 18-110
Using Groovy Rules 18-111
About Creating a Groovy Business Rule 18-112
xiii
Groovy Business Rule Examples 18-113
Administering Rules Security 18-113
Assigning Access to Rules 18-113
Adding, Editing, and Removing Access to Rules 18-114
Administering Smart Lists 18-114
Working with Smart Lists 18-115
Adding or Changing Smart List Properties 18-116
Adding or Changing Smart List Entries 18-117
Previewing Smart Lists 18-118
Displaying #MISSING with Smart Lists 18-118
Administering Task Lists 18-119
Working with Task Lists 18-119
Adding Instructions to Task Lists 18-120
Adding Tasks to Task Lists 18-120
Editing Task Lists 18-123
Editing Tasks 18-123
Copying and Moving Tasks 18-123
Moving and Reordering Task Lists 18-124
Clearing Task Lists 18-125
Deleting Tasks and Task Lists 18-125
Assigning Access to Task Lists 18-125
Adding Access to Task Lists 18-126
Changing and Removing Access to Task Lists 18-126
Setting User Preferences 18-127
Administering Variables 18-127
Working with Substitution Variables 18-128
About Substitution Variables 18-128
Creating and Assigning Values to Substitution Variables 18-128
Deleting Substitution Variables 18-129
Working with User Variables 18-129
About User Variables 18-129
Managing User Variables 18-130
Creating User Variables 18-130
Setting Limits for User Variables on Forms 18-131
Deleting User Variables 18-131
Clearing Cell Details 18-132
Copying Data 18-133
Administering the Application Monitor 18-135
About the Application Monitor 18-135
Assumptions 18-135
How the Application Monitor Works 18-135
xiv
Using the Application Monitor Graphs 18-136
Launching the Application Monitor 18-137
Modifying Artifacts for Optimal Performance 18-138
Managing Approvals 18-139
About the Approvals Process 18-139
About Approval Units 18-139
Approvals Process 18-139
Data Validation Rules 18-140
Task Lists 18-140
Setting Up Email for Approvals Notification 18-141
Defining the Approvals Process 18-141
Budget Process 18-141
Approval Operations and Data Validations 18-142
Starting and Supporting the Review Process 18-142
Printing Approval Unit Annotations 18-143
Creating Approval Status Reports 18-143
Approval Unit Promotional Path 18-145
Modifying the Approval Unit Promotional Path 18-145
Design Considerations for Approval Unit Promotional Path Data ValidationRules 18-147
Managing Approval Unit Hierarchies 18-148
About Approval Unit Hierarchies 18-148
Working with Approval Unit Hierarchies 18-148
Creating Approval Unit Hierarchies 18-149
Selecting Approval Unit Hierarchy Scenario and Version 18-155
Editing Approval Unit Hierarchies 18-156
Deleting and Renaming Approval Unit Hierarchies 18-157
Viewing Approval Unit Hierarchy Usage 18-157
Synchronizing Approval Unit Hierarchies 18-158
Exporting Approval Unit Hierarchies 18-159
Importing Approval Unit Hierarchies 18-159
Assigning Approval Unit Hierarchy Scenario and Version Combinations 18-160
A Naming Restrictions
Restrictions for Applications and Databases A-1
Restrictions for Dimensions, Members, Aliases, and Forms A-2
Dimension and Member Names in Calculation Scripts, Report Scripts, Formulas,Filters, and Substitution Variables A-5
Restrictions for User and Group Names A-6
xv
B Form Formula Functions
About Form Formula Functions B-1
Working with Formulas B-1
Creating Formulas B-1
Editing Formulas B-2
Deleting Formulas B-2
Formula Functions B-2
Arguments B-4
Numeric Arguments B-4
Row, Column, or Cell Reference Arguments B-4
Property Arguments B-6
Embedded Functions as Arguments B-8
Abs B-9
Average B-9
AverageA B-10
Count B-11
CountA B-12
Difference B-13
Eval B-14
IfThen, If B-14
Notes on Conditions B-17
Complex Conditions B-17
Max B-18
Min B-18
Mod B-19
PercentOfTotal B-19
Pi B-21
Product B-21
Random B-21
Round B-22
Sqrt B-22
Sum B-23
Truncate/Trunc B-24
Variance/Var B-25
VariancePercent/VarPer B-26
C Optimizing the Application
Optimizing Performance C-1
About Reordering Dimensions C-1
Writing #MISSING Values C-1
xvi
Other Performance Optimization Tips C-2
D Understanding Application Artifacts
Planning Artifacts D-1
Configuration Artifacts D-1
Essbase Data Artifacts D-2
Global Artifacts D-2
Cube Artifacts D-4
Relational Data Artifacts D-4
Security Artifacts D-5
E Using Smart View to Manage Applications
About Managing Applications in Smart View E-1
Controlling the Display of Application Management Options in Smart View E-2
Downloading the Application Templates E-2
Downloading the Template in Smart View E-2
Downloading the Application Template Zip File from the Cloud Service E-3
Creating an Application E-4
Working with Artifacts in the Application Template E-5
About Working with Artifacts in the Application Template E-5
Application Definition E-6
Dimension Definition E-10
Attribute Dimension Definition E-11
Data Definition E-13
Substitution Variable Definition E-14
Security Definition E-15
Advanced Settings Definition E-17
Updating an Application in Smart View E-20
Deleting an Application E-21
F Using Smart View to Import and Edit Application Metadata
About Smart View F-1
Importing Planning Dimensions in Smart View F-2
Importing Dimensions in Smart View F-2
Using Smart View Grids F-2
Overview of the Smart View Grid F-2
The Smart View Grid and Ribbon Display F-3
Guidelines for Using the Smart View Grid F-4
Default Metadata Dimension Member Properties F-4
xvii
Editing Members in Smart View F-7
Adding Application Members in Smart View F-7
Adding Members in Smart View F-7
Guidelines for Adding Members in Smart View F-9
Moving Members in Smart View F-9
Guidelines for Moving Members in Smart View F-10
Working with Attribute Dimensions F-10
Adding Attribute Dimension Members F-10
Associating Attribute Dimension Members with Dimension Members F-12
Designating Shared Members in Smart View F-13
Refreshing and Creating Databases in Smart View F-14
G Migrating an On-Premises Planning Application to Oracle Planningand Budgeting Cloud
Overview G-1
Supported Migration Paths G-1
Prerequisites and Notes G-1
General Prerequisites G-2
Default Application Properties G-2
Required Roles G-2
Artifacts Not Supported G-2
Modules and Applications Not Supported G-2
Reserved Words G-3
Report Mapping Artifacts and Aggregate Storage Database G-3
Business Rules G-3
Process Flow G-5
Step 1: Migrate the Security Model G-5
Steps in an On-Premises Environment G-5
Steps in an Oracle Planning and Budgeting Cloud Environment G-9
Step 2: Export Artifacts from the On-Premises Deployment G-10
Step 3: Zip the Exported Artifacts and Upload the ZIP File to the ServiceInstance G-11
Step 4: Import Artifacts to the Oracle Planning and Budgeting Cloud Instance G-12
Manually Migrate Data From Release 11.1.2.x to the Service Instance G-12
Manually Define Business Rules Security if the Calculation Module WasBusiness Rules in Release 11.1.2.1.x G-14
Step 5: Validate and Troubleshoot G-15
H Designing Your Application
Getting Started H-1
xviii

Planning Your Application H-3
Putting It All Together H-4
Design Walkthrough H-5
I Frequently Asked Questions
xix
Documentation Accessibility
For information about Oracle's commitment to accessibility, visit the OracleAccessibility Program website at http://www.oracle.com/pls/topic/lookup?ctx=acc&id=docacc.
Access to Oracle Support
Oracle customers that have purchased support have access to electronic supportthrough My Oracle Support. For information, visit http://www.oracle.com/pls/topic/lookup?ctx=acc&id=info or visit http://www.oracle.com/pls/topic/lookup?ctx=acc&id=trsif you are hearing impaired.
Documentation Accessibility
xx
Documentation Feedback
To provide feedback on this documentation, send email to [email protected],or, in an Oracle Help Center topic, click the Feedback button located beneath theTable of Contents (you may need to scroll down to see the button).
Follow EPM Information Development on these social media sites:
LinkedIn - http://www.linkedin.com/groups?gid=3127051&goback=.gmp_3127051
Twitter - http://twitter.com/hyperionepminfo
Facebook - http://www.facebook.com/pages/Hyperion-EPM-Info/102682103112642
Google+ - https://plus.google.com/106915048672979407731/#106915048672979407731/posts
YouTube - https://www.youtube.com/oracleepminthecloud
xxi
1Getting Started
Related Topics
• About Planning
• About the Application
• Application Features
• About the Home Page
• Launching the Application
• Considerations When Using the Application Interface
• Managing Application Access
About PlanningUse Planning to drive collaborative, event-based planning processes. Decision-makersand managers collaborate with budget holders to optimize the planning process,adapting rapidly and ensuring optimal plans.
About the ApplicationAn application is a related set of dimensions and dimension members used to meet aset of planning needs. Each application has its own accounts, entities, scenarios, andother data elements.
See this guide for application administration tasks, including:
• Creating, deleting, and managing an application
• Creating forms, task lists, and menus
• Managing currency conversions and exchange rates
• Identifying the review and approval process, requirements, and participants, andmanaging the budgeting process
Application FeaturesThe application:
• Facilitates collaboration, communication, and control across multidivisional globalenterprises
• Provides a framework for perpetual planning, to manage volatility and frequentplanning cycles
• Decreases the total cost of ownership through a shorter roll out andimplementation phase, and easier maintenance for an application
• Enhances decision-making with reporting, analysis, and planning
1-1
• Promotes modeling with complex business rules and allocations
• Integrates with other systems to load data
Watch this overview video for an introduction to the key features in the application.
Overview Video
Links to topics about the key application features described in the video:
• Designing Dashboards
• Managing Sandboxes
• Editing Dimension Properties in the Simplified Dimension Editor
• Focusing Your Analysis with Ad Hoc Grids
• Defining Valid Intersections
• Moving Data from One Cube to Another Cube Using Smart Push
• Using Your Own Excel Formulas in Planning
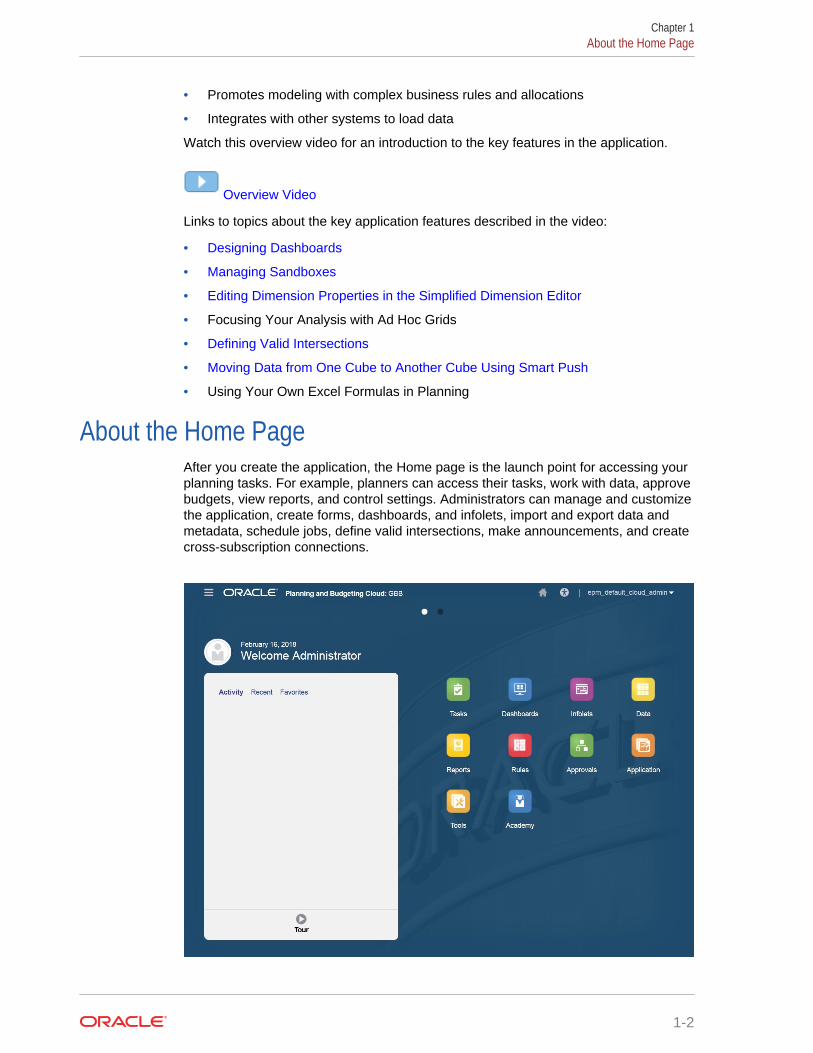
About the Home PageAfter you create the application, the Home page is the launch point for accessing yourplanning tasks. For example, planners can access their tasks, work with data, approvebudgets, view reports, and control settings. Administrators can manage and customizethe application, create forms, dashboards, and infolets, import and export data andmetadata, schedule jobs, define valid intersections, make announcements, and createcross-subscription connections.
Chapter 1About the Home Page
1-2
Watch these overview videos to learn how to perform key tasks in the SimplifiedInterface.
Overview: Performing Key Tasks in Planning and Budgeting Cloud's SimplifiedInterface Part 1
Overview: Performing Key Tasks in Planning and Budgeting Cloud's SimplifiedInterface Part 2
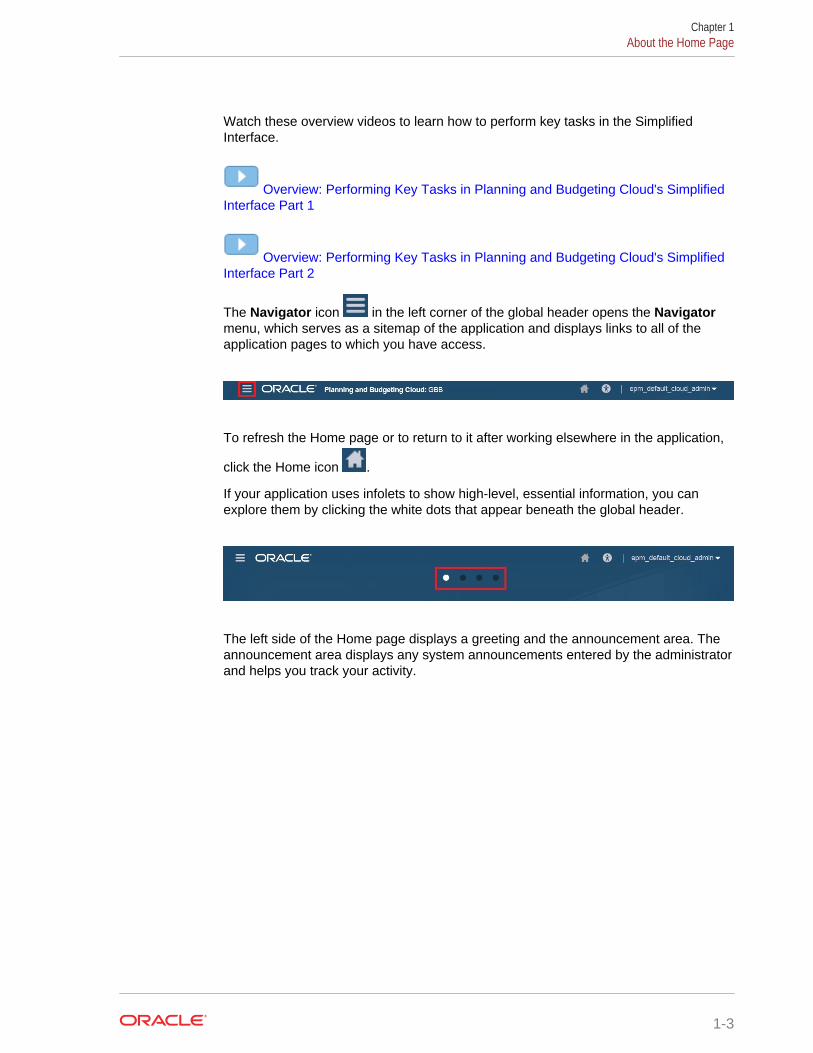
The Navigator icon in the left corner of the global header opens the Navigatormenu, which serves as a sitemap of the application and displays links to all of theapplication pages to which you have access.
To refresh the Home page or to return to it after working elsewhere in the application,
click the Home icon .
If your application uses infolets to show high-level, essential information, you canexplore them by clicking the white dots that appear beneath the global header.
The left side of the Home page displays a greeting and the announcement area. Theannouncement area displays any system announcements entered by the administratorand helps you track your activity.
Chapter 1About the Home Page
1-3
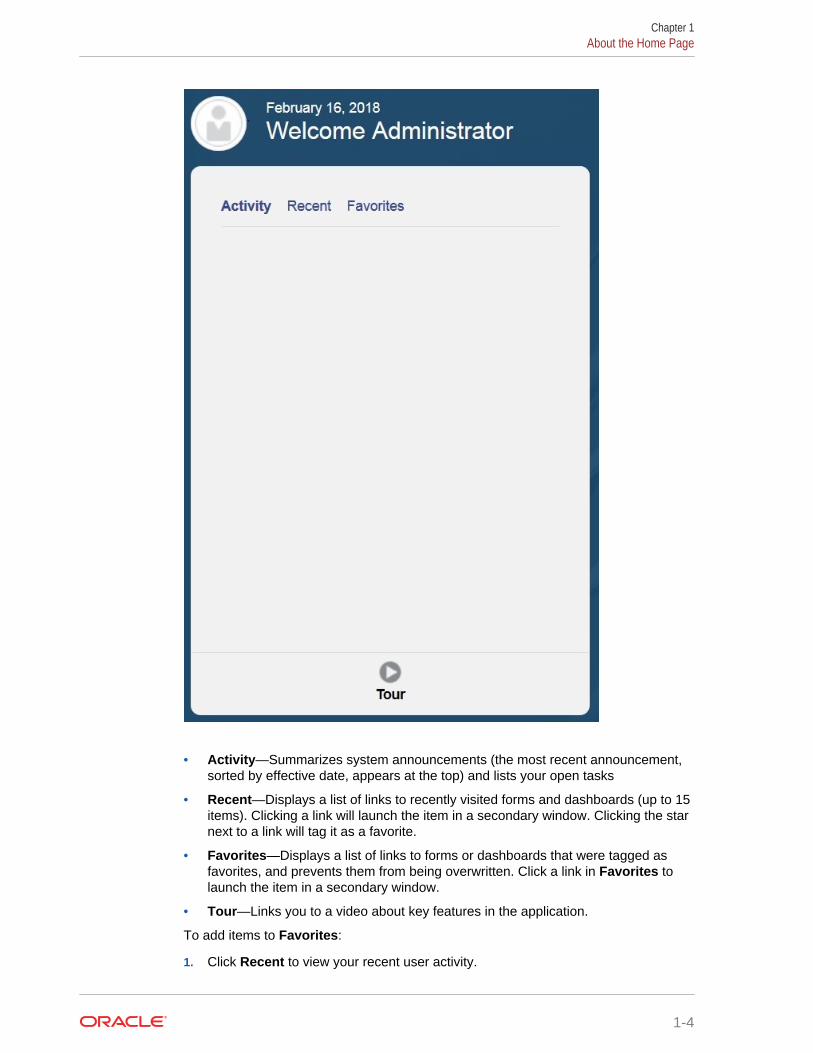
• Activity—Summarizes system announcements (the most recent announcement,sorted by effective date, appears at the top) and lists your open tasks
• Recent—Displays a list of links to recently visited forms and dashboards (up to 15items). Clicking a link will launch the item in a secondary window. Clicking the starnext to a link will tag it as a favorite.
• Favorites—Displays a list of links to forms or dashboards that were tagged asfavorites, and prevents them from being overwritten. Click a link in Favorites tolaunch the item in a secondary window.
• Tour—Links you to a video about key features in the application.
To add items to Favorites:
1. Click Recent to view your recent user activity.
Chapter 1About the Home Page
1-4
2. Click the star to the right of the item.
Launching the ApplicationTo launch the application, enter the following URL in a new browser window:
https://Oracle PBCS service name/HyperionPlanning;
For example:
https://testnew1-testnew1.pbcs.us1.oraclecloud.com/HyperionPlanning
For information about enabling access to application artifacts on mobile devices andfor considerations when using the application, see Managing Application Access.
Considerations When Using the Application InterfaceNote the following considerations when using the application interface:
• The interface supports only Landscape mode for iPad and Android tablets.
• The user experience on tablets is better on iPad than on Android devices.
• Oracle recommends using the Safari web browser with iPads and Google Chromewith Android devices.
• If you use Internet Explorer (IE) 11, Oracle recommends that you use IE 11 instandard mode.
• A PDF viewer is required to view reports on the tablet. Oracle recommends theAdobe PDF viewer, but it can be opened in Kindle or Polaris Office on Androiddevices or a similar application on the iPad.
• For information on copying and pasting data between Microsoft Excel andapplication web forms, see Copying and Pasting Data Between Microsoft Exceland Application Web Forms.
Managing Application AccessRelated Topics
• Enabling Access to Application Artifacts On Mobile Devices
• About Cell Formatting
• Copying and Pasting Data Between Microsoft Excel and Application Web Forms
• About Instant Save
• About Autosave
Enabling Access to Application Artifacts On Mobile DevicesTo work with artifacts such as forms, task lists, and business rules on mobile devices,administrators must enable access to those artifacts for users.
To enable access to application artifacts on mobile devices:
Chapter 1Launching the Application
1-5
1. From the Home page, click Navigator , and then under Setup, click AccessSimplified Interface.
2. In Access Simplified Interface, click to launch the forms, tasks, and rulesselector.
3. In the Selector, select the forms, tasks, and rules you want to enable for mobiledevice access, and then click OK.
4. Back in Access Simplified Interface, select the Forms, Tasks, and Rules tabsto view the artifacts that are enabled for mobile device access.
About Cell FormattingYou can apply either the formatting saved in Oracle Smart View for Office or theformatting set up in Planning for the form.
To select which formatting to apply:
1. In the form, click Actions, and then Apply.
2. Click:
• Cell Styles: To use Planning's formatting
• Custom Styles: To use the formatting saved in Smart View
Copying and Pasting Data Between Microsoft Excel and ApplicationWeb Forms
To copy and paste data from Microsoft Excel:
1. In Excel, highlight the data in one cell or in a range of cells, and press Ctrl+C tocopy the data onto the clipboard.
2. Highlight and select the target cell or cells in the application Web form, and thenpress Ctrl+V.
3. When the Clipboard helper is displayed, press Ctrl+V again. The data is pasted tothe Clipboard helper.
4. Click Paste to paste the data into the application Web form.
The following features are supported in Internet Explorer browser only:
• Copying data from application web forms and paste it into Microsoft Excel
• Copying data from one application web form to another
• Copying and pasting nonnumeric data, for example, Smart List, Date, and Textdata types
About Instant SaveWhen planners work in simple data forms and they click Save, their new or changeddata is saved instantly—without a confirmation message—if the structure of the dataform hasn't changed. For example, instant save works automatically unless any ofthese options is selected for the data form (because they change the structure of thedata form):
Chapter 1Managing Application Access
1-6
• Suppress missing data
• Suppress missing blocks
• A business rule is selected to launch on Save (other than the default CalculateForm and Calculate Currencies business rules).
About AutosaveIf the Grid Property option Enable Autosave is selected for a simple form, whenplanners move out of a cell, their changes are automatically saved, with no prompt ormessage. Cell values are aggregated to their parents, and the affected cells displaywith a green background. Also, with this option selected, planners can use Ctrl+Z toundo changes.
For autosave to work, the following suppress options must be turned off because theychange the structure of the form:
• Suppress missing data
• Suppress missing blocks
For more information on this option and its dependent option, Run Form Rules onAutosave, see Setting Form Grid Properties.
Chapter 1Managing Application Access
1-7
2Creating an Application
Create an application based on your planning needs. Reporting applications use basicapplication features. Standard applications use advanced custom features.
Related Topics
• About Creating an Application
• Selecting the Application Type
• Creating a Reporting Application
• Creating a Sample Application
• Creating a Standard Application
• Choosing Setup Options
• Taking the Product Tour
About Creating an ApplicationBefore you create the application, we've provided some guidelines and best practicesto help you determine your requirements and design your application so that it meetsyour business needs:
• See Designing Your Application.
• Click Take a quick tour. For more information, see Taking the Product Tour.
Watch this tutorial video to learn how to create an application.
Tutorial Video
To create an application:
1. Log in and select Start under Finance, and then select Planning & Budgeting.
2. Select the type of application you want to create. See Selecting the ApplicationType.
Related topics:
• Creating a Reporting Application
• Creating a Sample Application
• Creating a Standard Application
• Choosing Setup Options
Selecting the Application TypeSelect an application type:
2-1
• Standard—Builds advanced applications for any business process. Select fromtwo options:
– Sample—Quickly and automatically creates a demo application using thesample Vision application that's provided. See Creating a Sample Application.
– New—Builds an advanced custom application. See Creating a StandardApplication.
• Enterprise—Builds custom applications or uses predefined business processes tocreate applications for Financials, Workforce, Capital, and Projects. You can alsobuild a Strategic Modeling solution. See Administering Planning for OracleEnterprise Planning and Budgeting Cloud.
Note:
Only customers who purchase an Enterprise PBCS license or a PBCSPlus One Business Process option license can select the Enterpriseapplication type. See Frequently Asked Questions for an explanation ofthe PBCS Plus One Business Process option license.
• Reporting—Builds a basic application that you can expand over time. See Creating a Reporting Application.
Creating a Reporting ApplicationA Reporting application is a basic application with one cube and the core componentsthat you need to get up and running quickly. If you later decide that you need morecomplex business logic, you can convert a Reporting application into a Standard orEnterprise application.
A Reporting application:
• Consists of one cube
• Allows you to add more dimensions
• Allows MDX member formulas only
• Doesn't support business rules, map reporting, copy data, copy version, exchangerates, or currency conversion
• Can be converted into a Standard or Enterprise application
Note:
– To convert a Reporting application into a Standard application, see Converting to a Standard Application.
– To convert a Reporting application into an Enterprise application,see Converting an Oracle Planning and Budgeting Cloud Applicationto an Oracle Enterprise Planning and Budgeting Cloud Application.
Default dimensions and characteristics for a Reporting application:
Chapter 2Creating a Reporting Application
2-2
• Account—Only the root member is provided.
• Entity—Only the root member is provided.
• Period—Members are created based on the answers provided during setup. Userscan add an alternate hierarchy later. The Beginning Balance and Year Totalperiods are provided.
• Years—Number of years, history, and future years are broken up based on thevalues chosen during application creation. An All Year parent is provided. Moreyears can be added later. The default number of years is 10.
• Scenario—Five scenarios are provided: Plan, Actual, Forecast, Variance, andVariance Comments.
• Version—Three versions are provided: Base, What If, and Final. Hierarchicalversions are allowed, for example, Base (child member)+What If (childmember)=Final (parent member).
Note:
Generic members aren't added to the dimensions.
To create a Reporting application:
1. Click Reporting.
2. Name your application and enter a description.
Note:
Ensure that you adhere to the application naming restrictions outlined in Naming Restrictions.
3. The application provides setup options that you can select to help you create theinitial framework for your planning process. If you need help deciding whichoptions to choose, see Choosing Setup Options.
4. Review the summary screen, and, if the selections you made are correct, clickCreate.
After you create the application, populate it by performing these steps:
• Import metadata using the import feature. See Importing Metadata.
• Populate data by importing data from your source system. See Importing andExporting Data.
Creating a Sample ApplicationPlanning provides a Sample application, called Vision, that lets you quickly create anapplication with artifacts and data.
Chapter 2Creating a Sample Application
2-3
Note:
To create a Standard application, see Creating a Standard Application.
To automatically create the Sample application, click Standard, and then clickSample. When application creation is completed (this will take several minutes), you'llsee an Application created successfully message.
To manage the application after it's created, see Managing Applications.
Creating a Standard ApplicationA Standard application is an advanced application with two cubes and the option toadd more cubes. Complex business logic, such as business rules and allocations, issupported. You can't convert a Standard application into a Reporting application.
A Standard application:
• Allows you to add additional dimensions
• Enables sandboxes for the block storage cubes that are created when you createthe application. (You can also enable sandboxes for custom cubes when youcreate the cube.)
• Supports custom calendars (up to weeks of the month)
• Supports business rules
• Allows member formulas
• Can't be converted into a Reporting application
• Can be converted into an Enterprise application
Note:
To convert a Standard application into an Enterprise application, see Converting an Oracle Planning and Budgeting Cloud Application to anOracle Enterprise Planning and Budgeting Cloud Application.
To create a Standard application:
1. Click Standard.
2. Click New.
3. Name your application and enter a description.
Note:
Ensure that you adhere to the application naming restrictions outlined in Naming Restrictions.
Chapter 2Creating a Standard Application
2-4
4. The application provides setup options that you can select to help you create theinitial framework for your planning process. For descriptions of the setup options,see Choosing Setup Options.
5. Review the summary screen, and, if the selections you made are correct, clickCreate.
After you create a Standard application, populate it by performing these steps:
• Import application metadata using the import feature. See Importing Metadata.
• Populate application data by importing data from your source system. See Importing and Exporting Data.
Choosing Setup OptionsRelated Topics
• Setting Up Currencies
• Customizing the Cube Names
• Setting Up the Calendar
• Setting Up Custom Dimensions and Metadata
Setting Up CurrenciesSpecify the main currency for the application, and establish whether the applicationsupports multiple currencies.
To set up the currency:
1. In Create Application, select the main currency for the application.
2. Specify whether the application supports more than one currency, and if so, thenselect one of the following multiple currency options:
• Standard—Creates the Currency dimension and a hidden dimension calledHSP_Rates to store the exchange rates. See About Standard Multicurrency.
• Simplified—Creates the Currency dimension and additional accounts areadded to store the exchange rates. See About Simplified Multicurrency.
After the application is created, you can't change this option. Multiple currencysupport is available for level 0 members, regardless of base currency. The samecurrencies and exchange rates are used across cubes.
About Simplified MulticurrencyIn a Simplified multiple currency application, a single Currency dimension is added tothe application and exchange rates are stored in the Accounts dimension.
Here is the workflow for working with a Simplified multiple currency application:
1. During application creation, select a main currency against which the entireapplication will refer to when a currency conversion is done.
2. After the application is created, in the Currency dimension, create a Currencymember for each currency in the application. The Currency members you createare listed under Input Currencies. Data is entered or loaded in an input currency
Chapter 2Choosing Setup Options
2-5
and data can be entered or loaded into multiple input currencies for any givencombination; for example Entity and Account.
3. While creating a Currency member, you can specify whether the currency you'readding is also a reporting currency. Select the Reporting Currency option tomake a currency a reporting currency
Note:
Each application has one main currency, and is allowed to have manyreporting currencies.
4. For simplified multiple currency applications with a custom aggregate storagecube, you must enable the Account, Period, and Currency dimensions for thecustom aggregate storage cube. All dimensions in default aggregate storagecubes are enabled by default, but you must enable these dimensions manually forcustom aggregate storage cubes. To enable Account, Period, and Currencydimensions for custom aggregate storage cubes, edit dimension properties foreach dimension and select to enable them for the aggregate storage cube. See Editing Dimension Properties in the Simplified Dimension Editor.
5. Refresh the application. The Calculate Currency rule converts the input valuesfrom the current currency to the reporting currencies. Exchange rates arecalculated from the input currency to the main currency of the application.Triangulation is used to calculate from an input currency to all reporting currencies.
6. Enter exchange rate data to the exchange rate form that was automaticallycreated and seeded during application creation. The exchange rate form is calledExchange Rates to Main Currency; for example, Exchange Rates to USD.Enter the exchange rates by period for all input currencies against the maincurrency. You must enter the values across all intersections under which you wishto see the converted data.
Note:
You can also export the Exchange Rate Template to input and loadcurrency exchange rates. See Importing Exchange Rates for a SimplifiedMulticurrency Application.
Exchange rates are stored in the Account dimension and they contain the endingand average rates used to convert foreign currencies into the main currency.These rates are in FX Rates-Average and FX Rates-Ending. These rates arelocked and can't be deleted. Users with view permissions can view the rates forthe currencies on the Exchange Rates to Main Currency form.
Chapter 2Choosing Setup Options
2-6
Note:
You can't move an Account member that is under an Exchange Ratesaccount out from under Exchange Rates because the Exchange Ratesaccount is locked. To move an Exchange Rate member out of theExchange Rates account, you must delete the member and then re-addit to the new location.
7. There are two ways to view Reporting currency values:
• Calculate Currencies rule on a form—On the data input form, add theCalculate Currencies business rule. To add this rule, click the Action menu,and then select the Business Rule option. You can use the Run After Saveor Run Before Load business rule properties. When data is entered for theinput currency and the Calculate Currency rule is executed, the currency isconverted and displays in the reporting currency form.
Note:
– Ensure that any forms created have the same intersection asthat of the Exchange Rates to Main Currency form, withrespect to Scenario, Version, and Year.
– Ensure that both the input and converted forms have the samestructure, the only difference between the forms being thecurrency.
– Associate the Calculate Currencies rule to the forms where theinput is being provided. You can set up forms to automaticallyrun these rules when data in the form is saved. If not, users mustmanually launch the rule to convert data from one currency tothe reporting currencies. After the rule is run, view the convertedvalues by opening the form for which you want to see theconverted values or by selecting that currency's member fromthe Currency dimension.
– The Calculate Currencies rule is associated with forms in ablock storage cube. Simplified currency conversion isn'tsupported for aggregate storage cubes.
• Create and launch a custom rule—To create a custom rule, from the Home
page, click Navigator , and then under Create and Manage, clickCurrency Conversion. For Currency, enter the reporting currency. Thenenter the Scenario, Version Type, and Version details. Specify the Years forwhich you want to calculate the currency conversion rule. Click Save. Tolaunch the rule, from the Home page, click Rules. To the right of the businessrule, click Launch.
About Standard MulticurrencyIf you're familiar with Planning, then you're familiar with the Standard multiple currencyapproach. This is the approach that your current Planning applications use.
Chapter 2Choosing Setup Options
2-7
Selecting the standard multiple currency option during application creation creates twoadditional dimensions called Currency and HSP_Rates. You can add more currenciesas members of the Currency dimension. The HSP_Rates dimension is a hiddendimension that stores exchange rates. This dimension includes these members andothers that store currency rates:
• Hsp_InputValue—Stores data values
• Hsp_InputCurrency—Stores currency types for data values
For more information, see Hsp_Rates Dimension for Standard MulticurrencyApplications.
For an account with a currency data type, you can choose from one of the followingexchange rate types:
• Historical
• Average
• Ending
For more information, see Data Type and Exchange Rate Type.
Based on the exchange rate type, a user-defined attribute (UDA) is associated with theaccount that is used in the currency calculation. You can associate an entity to acurrency. For example, when you associate the entity USA to the currency USD, thelocal currency in the form for the USA entity is USD.
You can create multiple exchange rate tables, each representing a different businessscenario. Each scenario can be associated with only one exchange rate table.
You can run a calculate currency rule that generates the rule at runtime based on themembers included in the form. This rule can be set to run when the form is saved orloaded, based on the requirement.
For more information about using the standard multiple currency approach, see Administering Dimensions.
Customizing the Cube NamesYou can customize the names for the cubes during application creation only. If nocube names are specified during application creation, then the input (block storage)cube name defaults to "Plan1" and the reporting cube (aggregate storage) namedefaults to the application name.
Caution:
After a cube is added, you can't rename it or delete it.
To customize the cube names:
1. In Name of Input Cube, enter a name for the data entry (block storage) cube.
2. In Name of Reporting Cube, enter a for the reporting (aggregate storage) cube.
Chapter 2Choosing Setup Options
2-8
Setting Up the CalendarThe calendar establishes the application’s base time periods, first fiscal year andmonth, and total years. Select the base time period and monthly distribution patternbased on the number of fiscal weeks in a month. The base time period options are thebottom-level time periods in the application. You can create a custom base timeperiod, such as weeks or days. Use monthly distribution patterns to determine howdata entered into a summary time period is distributed or spread among the base timeperiod that you select. Users can enter data into summary time periods, such as yearsor quarters. The application distributes these values over the base time periods thatconstitute the summary time period.
For the fiscal year, set the fiscal year first month and specify whether the fiscal yearstarts from the same calendar year or the previous calendar year. You can later set upcalculations based on the calendar year, for example, using formula expressions.When setting up formulas for an application, consider that formula expressions suchas [TPDate] and [FirstDate] produce different results if the application starts in thesame calendar year or previous calendar year.
To set up the calendar:
1. In Create Application, to set how calendars roll up, select a Base Time Periodoption:
• 12 Months: Four quarters per year; months roll up into parent quarters andquarters into years.
• Quarters: Quarters roll up into years.
• Custom: A custom time period, such as weeks or days.
2. Select the First Fiscal Year.
This selection defines the starting fiscal year for the application. You can't changeit after creating the application. Before specifying the first fiscal year, consider yourhistorical data needs.
3. Select the Number of Fiscal Years for the application.
You can add years to the calendar after the application is created.
4. Enter or select the Fiscal Year Start Date.
5. If you set the base time period as 12 Months, select a Weekly Distributionoption: Even, 445, 454, or 544.
Weekly distribution sets the monthly distribution pattern, based on the number offiscal weeks in a month. This selection determines how data in summary timeperiods spreads within the base time period. When users enter data into summarytime periods, such as quarters, the value is distributed over base time periods inthe summary time period.
If you select a weekly distribution pattern other than Even, the application treatsquarterly values as if they were divided into 13 weeks and distributes weeksaccording to the selected pattern. For example, if you select 5-4-4, the first monthin a quarter has five weeks, and the last two months in the quarter have fourweeks.
6. To create an All Years parent member that includes all years, select Yes for AllYears parent.
Chapter 2Choosing Setup Options
2-9
The All Years parent member enables users to view the accumulated data acrossmultiple years, for example, a project's total cost up to its end date. The parentmember doesn't include the No Year member, if one is defined for the application.
7. Set up custom dimensions for the application. See Setting Up Custom Dimensionsand Metadata.
Setting Up Custom Dimensions and MetadataDimensions categorize data values. You can create up to 13 user-defined, customdimensions. The application includes two custom dimensions: Account and Entity. UseAccount and user-defined dimensions to specify data to gather from planners. UseEntity to model the flow of planning information in the organization and establish theplan review path.
If you selected the Standard multicurrency option during application creation, theapplication includes the Hsp_Rates dimension for storing exchange rates. Thisdimension includes these members and others that store currency rates:
• Hsp_InputValue—stores data values
• Hsp_InputCurrency—stores currency types for data values
For detailed information about custom dimensions and Hsp_Rates, see EditingDimensions in the Simplified Dimension Editor.
Note:
In the Metadata and Custom Dimensions section of the CreateApplication window, you have the option to either manually enter membernames or you can set up Account, Entity, and custom dimension membersby importing from metadata files. To import from metadata, you first exportthe metadata for each dimension to a flat file and then, on this window,import their metadata by browsing to that flat file. For instructions on creatingthe flat file, see Creating the Import File.
To set up custom dimensions:
1. To add a dimension or rename a prefilled dimension, to the right of DimensionType in the Dimension Name column, enter the name of the dimension.
Dimension names can have up to 80 characters and can include spaces.
2. For each dimension, enter its member names.
For example, for the Version dimension, you could enter Budget2014. You can addmembers later.
The Number of Records column displays the number of members either enteredor in the flat file.
3. Optional: To import metadata for Account, Entity, or a custom dimension from aflat file, click Browse.
Use this method for importing smaller dimensions (for example, 1,000 members orfewer); use the Import and Export method (described in Importing and ExportingData and Metadata) for incremental updates or for loading larger dimensions.
Chapter 2Choosing Setup Options
2-10
For instructions on creating flat files, see Creating the Import File. If the file has somany members that application performance would be impacted, an error displaysand the number of records displayed is 0 (zero).
4. Click Create.
5. If you have more metadata to load, continue to Importing Metadata.
Taking the Product TourClicking Take a quick tour links you to useful information about getting started withthe application. It also provides best practices for determining your requirements anddesigning your application, tutorials for administering the application, and links you tothe Help Center where the documentation library is located.
To take the product tour:
1. Click Take a quick tour.
2. Click the buttons at the bottom of the screen to page through the tour screens.
Chapter 2Taking the Product Tour
2-11
3Setting Up Access Permissions
Assign access permissions to application artifacts such as dimensions, forms,dashboards, and task lists.
Related Topics
• About User and Role Management
• Application Artifacts That Can Be Assigned Permissions
• Types of Access Permissions
• Managing Permissions to Artifacts
• Reporting on Access Permissions
• Retrieving Changed Information from Access Control
About User and Role ManagementThe application employs several security layers to ensure security. Infrastructurecomponents, which are implemented and managed by Oracle, create a secureenvironment for the application.
Service-level security is ensured by using the following mechanisms that permit onlyauthorized users to access the application:
• Single Sign-on (SSO)
• Role-based access to the application
Global roles are granted through the Oracle Cloud Identity Console. See GettingStarted with Oracle Enterprise Performance Management Cloud for Administrators.
Access permissions are granted through the application interface and are described inthis chapter.
Application Artifacts That Can Be Assigned PermissionsYou can assign permissions to:
• Dimensions, including user-defined dimensions
3-1
Note:
You can assign permissions to members by selecting the dimensionproperty Apply Security. If you omit or clear the Apply Security setting,all users can access the dimension's members. By default, the Account,Entity, Scenario, and Version dimensions are enabled for accesspermissions. Optionally, you can enable this option for Period, Years,and Custom dimensions.
• Launch privileges to rules
• Forms
• Form folders
• Rule folders
• Dashboards
• Infolets
• Task lists
Types of Access PermissionsAccess permissions include Read, Write, and None. You can also set who can launchwhich rules.
• Launch: Allow launch privileges
Note:
View user types have no Write permission to dimension members, socan't launch rules having runtime prompts that include members,dimensions, member ranges, or cross-dimension runtime prompt types.They can, however, launch rules having runtime prompts of other types(for example, date type).
• No Launch: Disallow launch privileges
Note:
If a user inherits Launch permission to a rule by belonging to a group,and is also assigned No Launch permissions by belonging to anothergroup, the more restrictive No Launch assignment takes precedence.
You can specify access permission for individual users and each group. When youassign a user to a group, that user acquires the group's access permissions. If anindividual's access permissions conflict with those of a group the user belongs to, useraccess permissions take precedence.
Chapter 3Types of Access Permissions
3-2
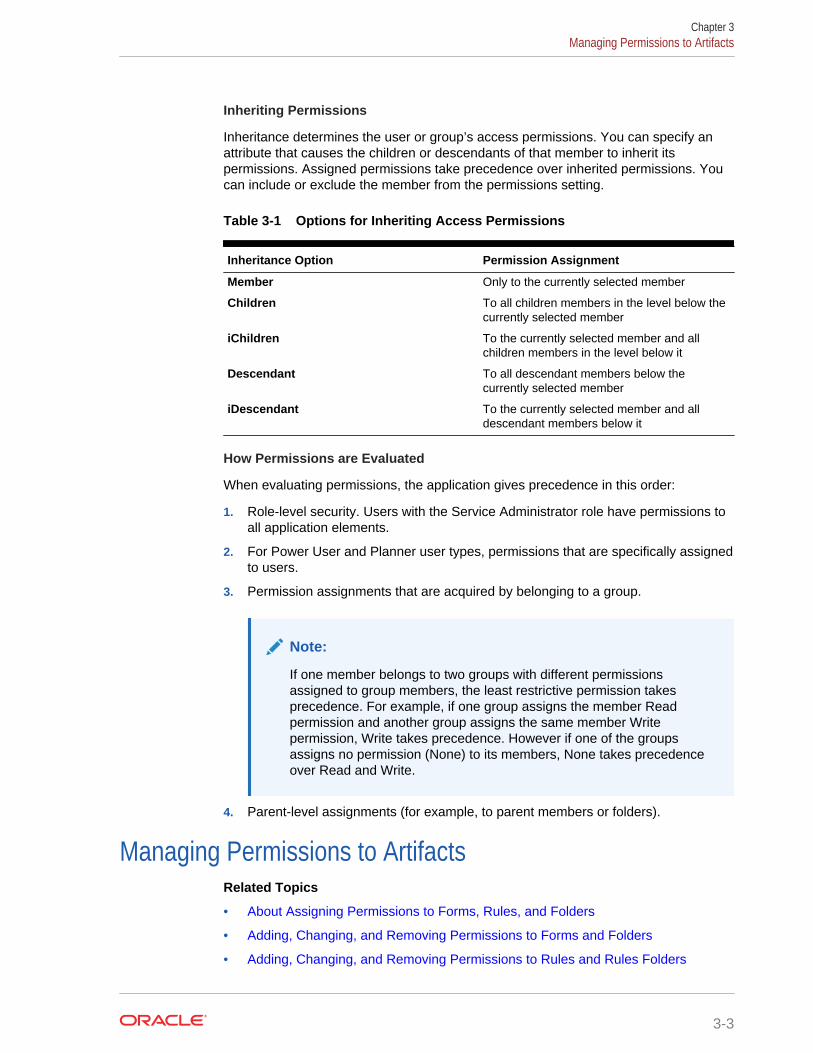
Inheriting Permissions
Inheritance determines the user or group’s access permissions. You can specify anattribute that causes the children or descendants of that member to inherit itspermissions. Assigned permissions take precedence over inherited permissions. Youcan include or exclude the member from the permissions setting.
Table 3-1 Options for Inheriting Access Permissions
Inheritance Option Permission Assignment
Member Only to the currently selected member
Children To all children members in the level below thecurrently selected member
iChildren To the currently selected member and allchildren members in the level below it
Descendant To all descendant members below thecurrently selected member
iDescendant To the currently selected member and alldescendant members below it
How Permissions are Evaluated
When evaluating permissions, the application gives precedence in this order:
1. Role-level security. Users with the Service Administrator role have permissions toall application elements.
2. For Power User and Planner user types, permissions that are specifically assignedto users.
3. Permission assignments that are acquired by belonging to a group.
Note:
If one member belongs to two groups with different permissionsassigned to group members, the least restrictive permission takesprecedence. For example, if one group assigns the member Readpermission and another group assigns the same member Writepermission, Write takes precedence. However if one of the groupsassigns no permission (None) to its members, None takes precedenceover Read and Write.
4. Parent-level assignments (for example, to parent members or folders).
Managing Permissions to ArtifactsRelated Topics
• About Assigning Permissions to Forms, Rules, and Folders
• Adding, Changing, and Removing Permissions to Forms and Folders
• Adding, Changing, and Removing Permissions to Rules and Rules Folders
Chapter 3Managing Permissions to Artifacts
3-3
• Adding, Changing, and Removing Permissions to Dashboards and Infolets
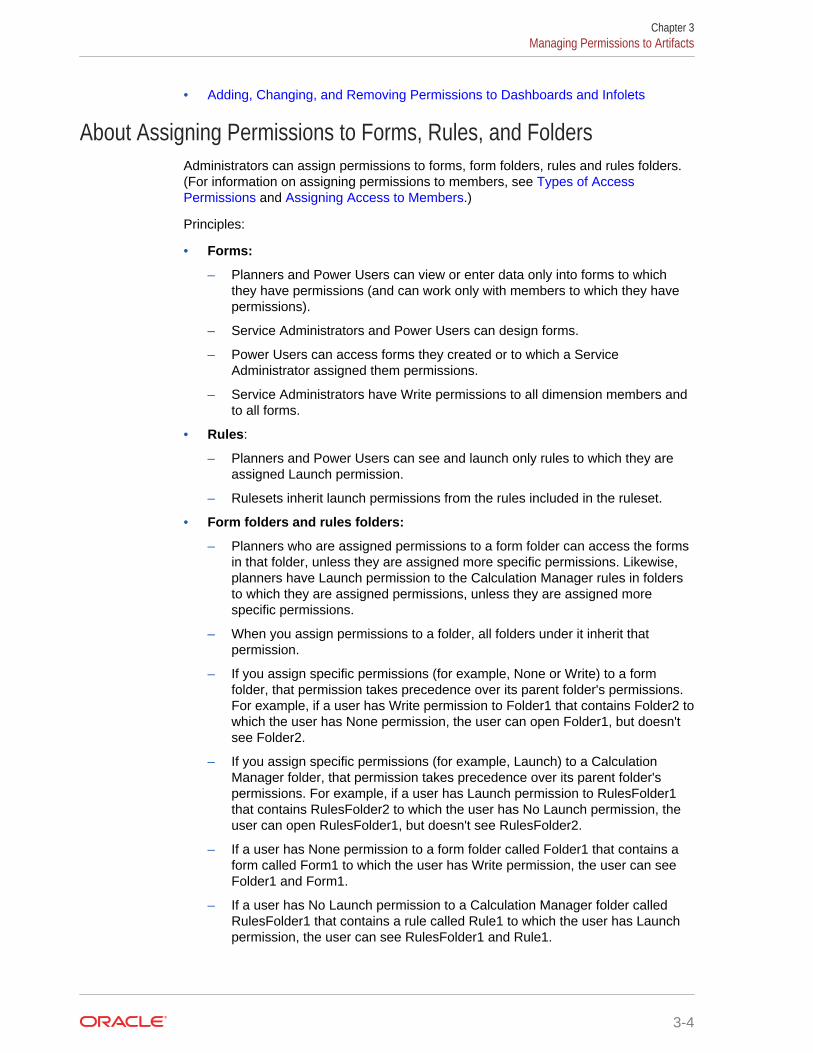
About Assigning Permissions to Forms, Rules, and FoldersAdministrators can assign permissions to forms, form folders, rules and rules folders.(For information on assigning permissions to members, see Types of AccessPermissions and Assigning Access to Members.)
Principles:
• Forms:
– Planners and Power Users can view or enter data only into forms to whichthey have permissions (and can work only with members to which they havepermissions).
– Service Administrators and Power Users can design forms.
– Power Users can access forms they created or to which a ServiceAdministrator assigned them permissions.
– Service Administrators have Write permissions to all dimension members andto all forms.
• Rules:
– Planners and Power Users can see and launch only rules to which they areassigned Launch permission.
– Rulesets inherit launch permissions from the rules included in the ruleset.
• Form folders and rules folders:
– Planners who are assigned permissions to a form folder can access the formsin that folder, unless they are assigned more specific permissions. Likewise,planners have Launch permission to the Calculation Manager rules in foldersto which they are assigned permissions, unless they are assigned morespecific permissions.
– When you assign permissions to a folder, all folders under it inherit thatpermission.
– If you assign specific permissions (for example, None or Write) to a formfolder, that permission takes precedence over its parent folder's permissions.For example, if a user has Write permission to Folder1 that contains Folder2 towhich the user has None permission, the user can open Folder1, but doesn'tsee Folder2.
– If you assign specific permissions (for example, Launch) to a CalculationManager folder, that permission takes precedence over its parent folder'spermissions. For example, if a user has Launch permission to RulesFolder1that contains RulesFolder2 to which the user has No Launch permission, theuser can open RulesFolder1, but doesn't see RulesFolder2.
– If a user has None permission to a form folder called Folder1 that contains aform called Form1 to which the user has Write permission, the user can seeFolder1 and Form1.
– If a user has No Launch permission to a Calculation Manager folder calledRulesFolder1 that contains a rule called Rule1 to which the user has Launchpermission, the user can see RulesFolder1 and Rule1.
Chapter 3Managing Permissions to Artifacts
3-4
For procedures, see Adding, Changing, and Removing Permissions to Forms andFolders and Adding, Changing, and Removing Permissions to Rules and RulesFolders.
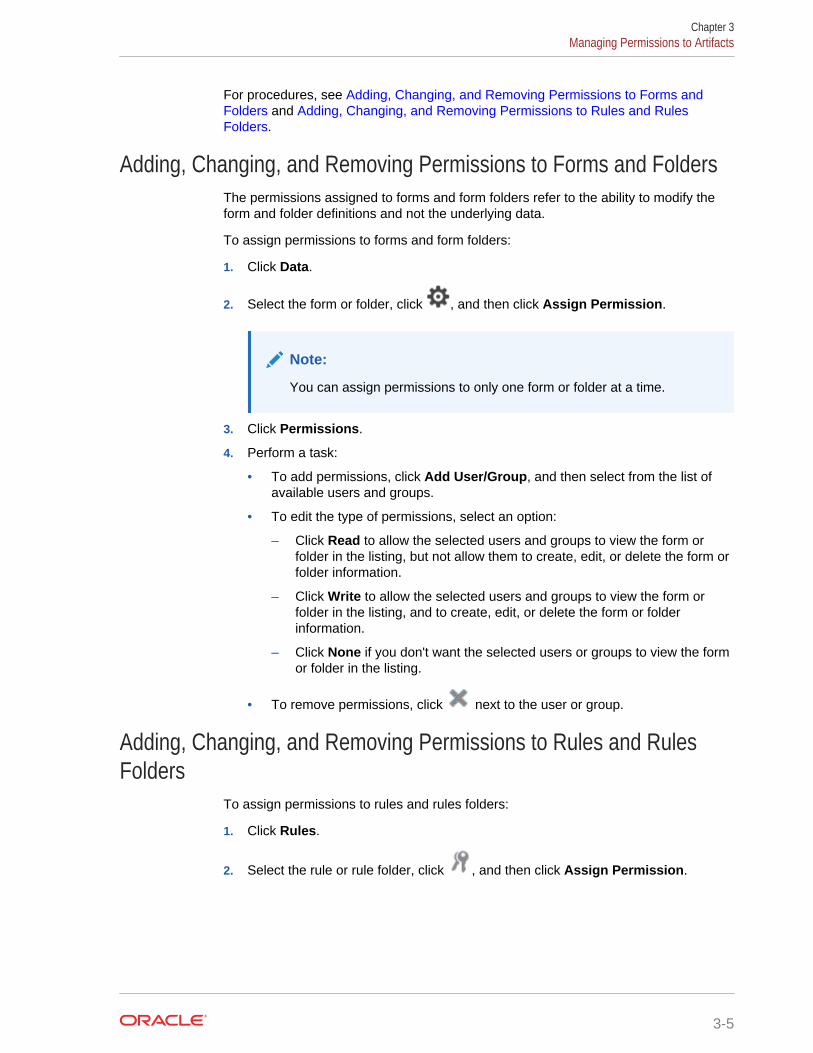
Adding, Changing, and Removing Permissions to Forms and FoldersThe permissions assigned to forms and form folders refer to the ability to modify theform and folder definitions and not the underlying data.
To assign permissions to forms and form folders:
1. Click Data.
2. Select the form or folder, click , and then click Assign Permission.
Note:
You can assign permissions to only one form or folder at a time.
3. Click Permissions.
4. Perform a task:
• To add permissions, click Add User/Group, and then select from the list ofavailable users and groups.
• To edit the type of permissions, select an option:
– Click Read to allow the selected users and groups to view the form orfolder in the listing, but not allow them to create, edit, or delete the form orfolder information.
– Click Write to allow the selected users and groups to view the form orfolder in the listing, and to create, edit, or delete the form or folderinformation.
– Click None if you don't want the selected users or groups to view the formor folder in the listing.
• To remove permissions, click next to the user or group.
Adding, Changing, and Removing Permissions to Rules and RulesFolders
To assign permissions to rules and rules folders:
1. Click Rules.
2. Select the rule or rule folder, click , and then click Assign Permission.
Chapter 3Managing Permissions to Artifacts
3-5
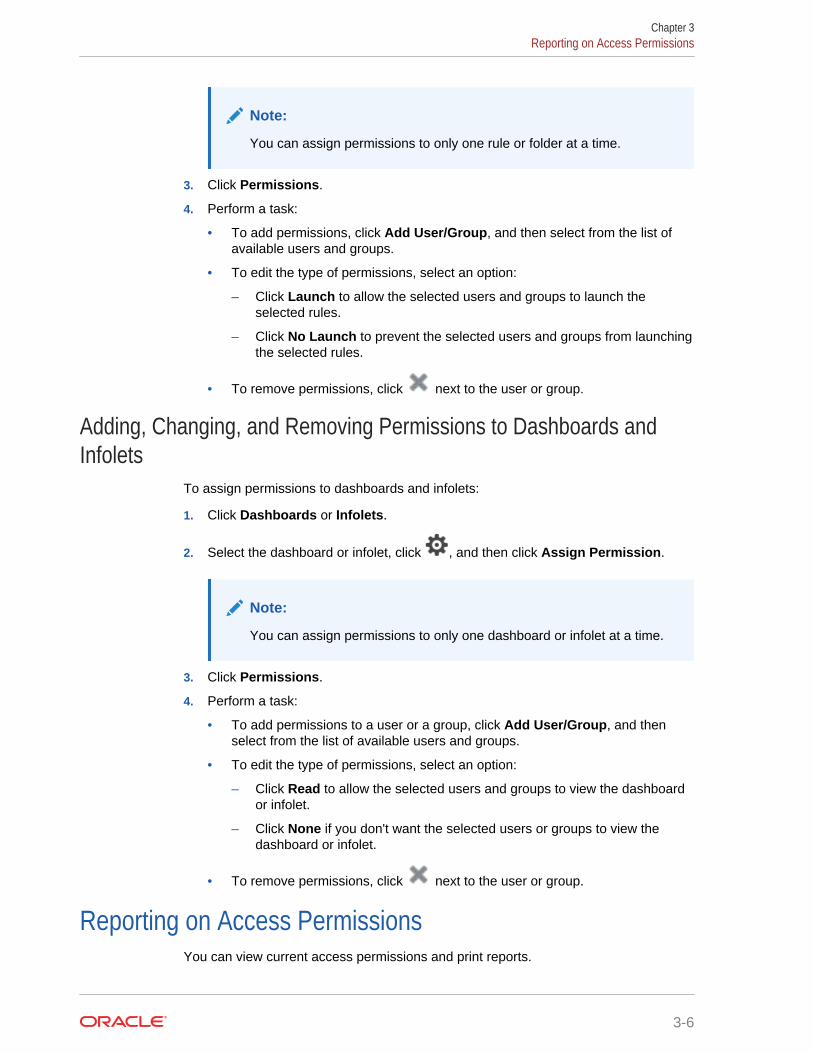
Note:
You can assign permissions to only one rule or folder at a time.
3. Click Permissions.
4. Perform a task:
• To add permissions, click Add User/Group, and then select from the list ofavailable users and groups.
• To edit the type of permissions, select an option:
– Click Launch to allow the selected users and groups to launch theselected rules.
– Click No Launch to prevent the selected users and groups from launchingthe selected rules.
• To remove permissions, click next to the user or group.
Adding, Changing, and Removing Permissions to Dashboards andInfolets
To assign permissions to dashboards and infolets:
1. Click Dashboards or Infolets.
2. Select the dashboard or infolet, click , and then click Assign Permission.
Note:
You can assign permissions to only one dashboard or infolet at a time.
3. Click Permissions.
4. Perform a task:
• To add permissions to a user or a group, click Add User/Group, and thenselect from the list of available users and groups.
• To edit the type of permissions, select an option:
– Click Read to allow the selected users and groups to view the dashboardor infolet.
– Click None if you don't want the selected users or groups to view thedashboard or infolet.
• To remove permissions, click next to the user or group.
Reporting on Access PermissionsYou can view current access permissions and print reports.
Chapter 3Reporting on Access Permissions
3-6
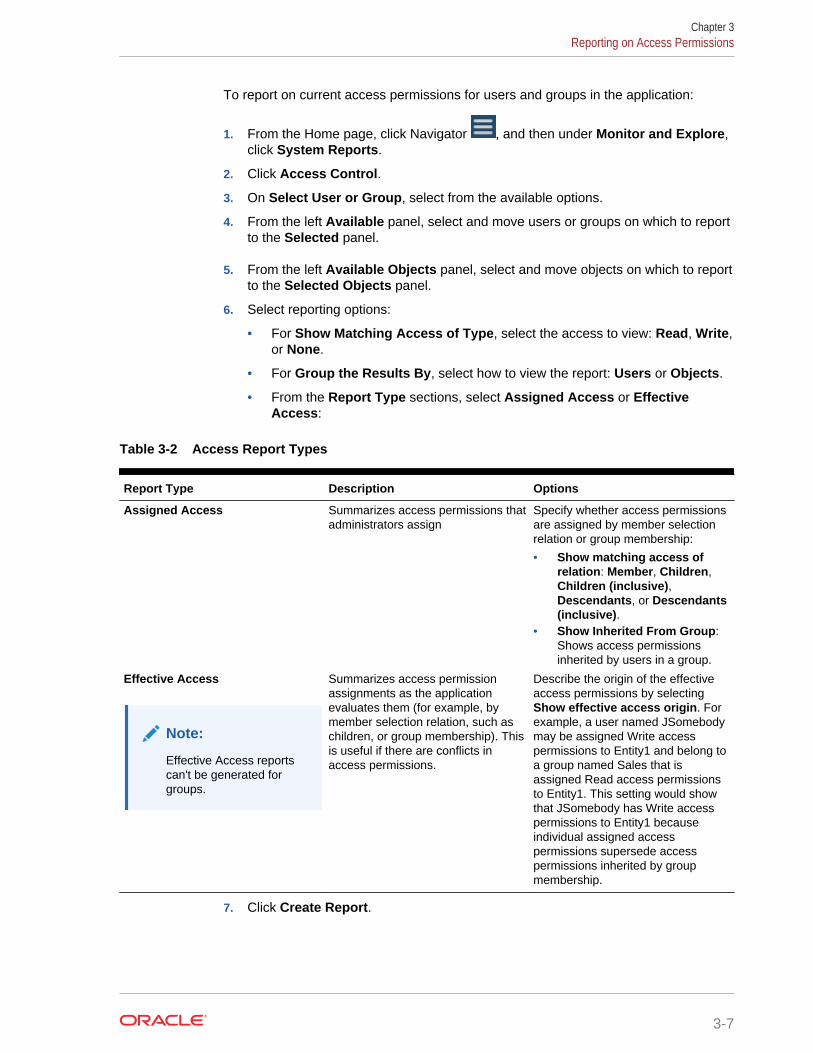
To report on current access permissions for users and groups in the application:
1. From the Home page, click Navigator , and then under Monitor and Explore,click System Reports.
2. Click Access Control.
3. On Select User or Group, select from the available options.
4. From the left Available panel, select and move users or groups on which to reportto the Selected panel.
5. From the left Available Objects panel, select and move objects on which to reportto the Selected Objects panel.
6. Select reporting options:
• For Show Matching Access of Type, select the access to view: Read, Write,or None.
• For Group the Results By, select how to view the report: Users or Objects.
• From the Report Type sections, select Assigned Access or EffectiveAccess:
Table 3-2 Access Report Types
Report Type Description Options
Assigned Access Summarizes access permissions thatadministrators assign
Specify whether access permissionsare assigned by member selectionrelation or group membership:
• Show matching access ofrelation: Member, Children,Children (inclusive),Descendants, or Descendants(inclusive).
• Show Inherited From Group:Shows access permissionsinherited by users in a group.
Effective Access
Note:
Effective Access reportscan't be generated forgroups.
Summarizes access permissionassignments as the applicationevaluates them (for example, bymember selection relation, such aschildren, or group membership). Thisis useful if there are conflicts inaccess permissions.
Describe the origin of the effectiveaccess permissions by selectingShow effective access origin. Forexample, a user named JSomebodymay be assigned Write accesspermissions to Entity1 and belong toa group named Sales that isassigned Read access permissionsto Entity1. This setting would showthat JSomebody has Write accesspermissions to Entity1 becauseindividual assigned accesspermissions supersede accesspermissions inherited by groupmembership.
7. Click Create Report.
Chapter 3Reporting on Access Permissions
3-7
Working with Access Permissions ReportsThe report on access permissions displays in Adobe Acrobat. You can use the AdobeAcrobat toolbar to work with the report.
Retrieving Changed Information from Access ControlChanges to group names or group membership from Access Control are not reflectedin the application. To apply changes, you must reimport security artifacts.
To synchronize information after modifying group properties:
1. Access the environment as a Service Administrator.
2. Click Application, and then Migration.
3. Export Security artifacts:
a. Click Planning, and then select Security.
b. Click Export.
c. Enter a file name and click OK.
d. Review the Migration Status Report to ensure that the export is successful.
e. Click Close.
4. Import the snapshot that you created:
a. Click Snapshots.
b. Click Actions next to the snapshot that you created in the preceding step, andthen click Import.
c. Click OK.
d. Review the Migration Status Report to ensure that the import is successful.
e. Click Close.
Chapter 3Retrieving Changed Information from Access Control
3-8
4Managing Applications
Related Topics
• Application Overview
• Refreshing the Application
• Managing Cubes
• Managing Dimensions
• Viewing Activity Reports
• Importing and Exporting Data and MetadataMove data and metadata in and out of the application using Planning.
• Importing Exchange Rates for a Simplified Multicurrency Application
• Creating and Refreshing Application Databases
• Adding an Aggregate Storage Outline to an Application
• Converting to a Standard Application
• Converting an Oracle Planning and Budgeting Cloud Application to an OracleEnterprise Planning and Budgeting Cloud Application
• Conversion Considerations
• Removing an Application
• Setting Service Maintenance Time
• Uploading and Downloading Files Using the Application Inbox and Outbox
Application OverviewAn application is a related set of dimensions and dimension members used to meet aset of planning needs. Each application has its own accounts, entities, scenarios, andother data elements.
To create an application, see Creating an Application.
After an application is created, you can view and manage it using the applicationconsole. To view the application console, click Application, and then click Overview.
The application console shows the application properties (including the applicationtype) and application statistics, such as the number of tasks, plans, rules, andapproval hierarchies in your application. It also lists the cubes (for Standardapplications) and dimensions (for Reporting applications) used by the application.
• To view the application overview, click Overview.
• To manage cubes, click Cubes. See Managing Cubes.
• To manage dimensions, click Dimensions. See Managing Dimensions.
• To view activity reports, click Activity. See Viewing Activity Reports.
4-1
Refreshing the ApplicationYou must refresh the application whenever you change the application structure.Changes made to the application are not reflected to users performing data entry andapprovals tasks until the application is refreshed. For example, when you modifyproperties of a dimension member, add a member, or change access permissions,these changes are reflected to users after you refresh the application.
To refresh the application:
1. Click Application, and then click Overview.
2. Click Refresh.
Note:
The application is automatically refreshed during an application upgrade. Ifany refresh errors occur during an application upgrade, you can view theerrors in the Jobs console. These errors are captured in the job calledContent Upgrade. See Viewing Pending Jobs and Recent Activity.
Managing CubesFor Standard applications, the cube editor lets you view or add cubes. You can add upto seven total cubes to a Standard application. After a cube is added, it will behave likeany other cube.
Watch this tutorial video to learn how to manage cubes.
Tutorial Video
• Viewing and Managing Cubes
• Adding Cubes
• Clearing Cubes
• Improving Cube Performance
Viewing and Managing CubesTo view and manage cubes:
1. Click Application, and then click Overview.
2. Click Cubes.
3. Perform one task:
• To view the details of a cube, click the name of the cube that you want to view.
• To add a cube, click Create, then complete the cube details, and then clickDone.
Chapter 4Refreshing the Application
4-2
Note:
When you create a new block storage cube, you can select theoption Enable Sandboxes. Selecting this option also provides theEnable Sandboxes option for Version members. See ManagingSandboxes.
For cube details, see Adding Cubes.
Note:
You can rename a cube only during application creation. After a cube isadded, you can't rename or delete it.
Adding CubesYou can add up to seven total cubes—three block storage cubes and threecorresponding aggregate storage cubes plus one consolidating aggregate storagecube, each with a unique aggregate storage application name.
After a cube is added, it behaves like any other application cube. If the cube maps toan aggregate storage database, then aggregate storage limitations apply.
Note:
For an aggregate storage cube, you must specify an application name tocontain the database since an aggregate storage database must reside in itsown application.
Clearing CubesRelated Topics
• About Clearing Cubes
• Creating Clear Cube Jobs
• Starting and Deleting Clear Cube Jobs
• Scheduling Clear Cube Jobs
About Clearing CubesThe application enables you to clear specific data within input and reporting cubes.You can start the Clear Cube job right away or schedule it to run later.
Chapter 4Managing Cubes
4-3
Note:
The Clear Cube job deletes the data you specify within input and reportingcubes, but it doesn't delete the application definition in the application’srelational tables.
Creating Clear Cube JobsTo create a Clear Cube job:
1. Click Application, and then click Overview.
2. Click Actions, and then Clear Cube.
3. On the Clear Cube page, click Create, complete the job name, select the cube,then select a clear option:
• Clear All—For both block storage and aggregate storage cubes, delete alldata within a cube that is associated with the entities you select:
– Supporting Details
– Comments
– Attachments
– Essbase Data
• For block storage cubes only:
– Upper-level blocks—Delete data in upper-level blocks
– Non-input blocks—Delete data in non-input blocks
– Dynamic blocks—Delete data in dynamic blocks
– Empty blocks—Delete blocks with #MISSING values
• For aggregate storage cubes only:
– All Aggregations—Delete all aggregate views
– Partial Data (Basic Mode)—Clear the data in the specified region. You
can select the point of view using the member selector .
* Supporting Details
* Comments
* Attachments
* Essbase Data Logical—In which the input cells in the specifiedregion are written to a new data slice with negative, compensatingvalues that result in a value of zero for the cells you want to clear. Theprocess for logically clearing data completes in a length of time that isproportional to the size of the data being cleared. Becausecompensating cells are created, this option increases the size of thedatabase.
* Essbase Data Physical—In which the input cells in the specifiedregion are physically removed from the aggregate storage database.The process for physically clearing data completes in a length of time
Chapter 4Managing Cubes
4-4
that is proportional to the size of the input data, not the size of the databeing cleared. Therefore, you might typically use this method onlywhen you need to remove large slices of data.
– Partial Data (Advanced Mode)—Clear Essbase data only by using anMDX expression in the text box provided.
* Essbase Data Logical—In which the input cells in the specifiedregion are written to a new data slice with negative, compensatingvalues that result in a value of zero for the cells you want to clear. Theprocess for logically clearing data completes in a length of time that isproportional to the size of the data being cleared. Becausecompensating cells are created, this option increases the size of thedatabase.
* Essbase Data Physical—In which the input cells in the specifiedregion are physically removed from the aggregate storage database.The process for physically clearing data completes in a length of timethat is proportional to the size of the input data, not the size of the databeing cleared. Therefore, you might typically use this method onlywhen you need to remove large slices of data.
4. Click Save and Close.
5. To view the job on the Clear Cube listing page, click Refresh.
To start the Clear Cube job right away or to delete a job, see Starting and DeletingClear Cube Jobs.
To schedule a Clear Cube job to run immediately, later, or at intervals, go to the Jobspage. See Scheduling Jobs .
Starting and Deleting Clear Cube JobsTo start a Clear Cube job right away or to delete a job:
1. Click Application, and then click Overview.
2. Click Actions, and then Clear Cube.
3. On the Clear Cube listing page, click next to the Clear Cube job that you wantto start or delete, and then select one of the following options:
• Click Submit to start the job right away.
• Click Delete to delete the job.
Scheduling Clear Cube JobsYou can schedule a Clear Cube job to run later or at intervals. To schedule a ClearCube job, go to the Jobs page. See Scheduling Jobs.
Improving Cube PerformanceThe application enables you to schedule jobs that improve cube performance. Thesejobs include:
Chapter 4Managing Cubes
4-5
• Restructure Cube—Performs a full restructure of a block storage cube toeliminate or reduce fragmentation. This will also remove empty blocks. Runningthis job won't push any changes from Planning to Essbase.
• Compact Outline—Compacts the outline file of an aggregate storage cube.Compaction helps keep the outline file at an optimal size. Compacting the outlinedoesn't clear the data. Running this job won't push any changes from Planning toEssbase.
• Merge Data Slices—Merges incremental data slices of an aggregate storagecube. Fewer slices improve a cube’s performance. You can merge all incrementaldata slices into the main database slice or merge all incremental data slices into asingle data slice without changing the main database slice. You can optionallyremove cells that have a value of zero.
• Optimize Aggregation—Generates optimized views based on collected querytracking information in an aggregate storage cube. This job has two actions:
– Enable Query Tracking—Records a meaningful set of queries, and then usesthe recorded query data to select the most appropriate set of aggregate viewsto materialize for that database. You must enable query tracking and allow itsufficient time to collect data before executing the aggregation process basedon query data.
Once enabled, query tracking continues until query tracking is disabled, thecube is reloaded or refreshed, the outline is compacted, the application is shutdown, or additional aggregate views are materialized for the database. Querytracking does not resume automatically after these actions occur.
Note:
The following actions clear the stored query tracking informationfrom the aggregate storage cube, but they do not disable querytracking:
* Merging incremental data slices
* Clearing data
* Clearing existing aggregations
* Clearing partial data
* Loading data into the aggregate storage cube
– Execute Aggregation Process—Calculates aggregations for aggregatestorage databases that contain data and to which you are granted Calculationpermission. To perform an aggregation, you use system recommended views.The selection of views and aggregation processes are combined into one,non-configurable operation performed by the server. You can optionallyspecify the maximum disk space for the resulting files, base the view selectionon user querying patterns, and include rollup hierarchies in the view selection.Select one or more of the following options:
* Based on query data?—Aggregate the views the server selects, basedon collected user querying patterns. This option is only available if querytracking is turned on.
Chapter 4Managing Cubes
4-6
* Include rollup option?—Include secondary hierarchies (with default levelusage) in the view selection process.
* Include growth size option?—Aggregate the views the server selects,until the maximum growth of the aggregated database exceeds limits youspecify. Enter the size (in megabytes) beyond which the server shouldstop the aggregation.
You can start the jobs right away or schedule them to run later.
Note:
Users can stay logged in during these actions.
To create a job that improves cube performance, see Scheduling Jobs.
Managing DimensionsDimensions categorize data values. These dimensions are provided with theapplication: Account, Entity, Scenario, Version, Period, Currency (for a multicurrencyapplication), and Years.
Dimensions on the Dimensions page are listed in order of precedence. The order ofdimensions is critical for the structure and performance of an application. The order ofyour dimensions determines how your data calculations will perform. EvaluationOrder enables you to specify which data type prevails when a data intersection hasconflicting data types. For example, if Account members are set to the Currency datatype, and Product members are set to the Smart List data type, you can set whetherthe Currency or Smart List data type prevails at an intersection.
To manage dimensions:
1. Click Application, click Overview, and then click Dimensions.
2. Perform a task:
• To filter the dimensions by cube, see Filtering the Dimension View by Cube.
• To view and edit the properties of dimensions and their members, click thename of the dimension. See Editing Dimensions in the Simplified DimensionEditor.
• To reorder the dimensions, click the up or down arrow in the Order columnnext to the dimension that you want to move.
• To set a different evaluation order, click the Evaluation Order field next to thedimension that you want to update.
• To rename a dimension, click the name of the dimension that you want torename, and then enter a new name in the Dimension field.
• To create a dimension, click Create. See Creating Dimensions.
• To import metadata, click Import. See Importing Metadata.
• To export metadata, click Export. See Exporting Metadata.
Chapter 4Managing Dimensions
4-7
Filtering the Dimension View by CubeFor a Standard application, you can filter the dimension view by cube. When youselect a cube, only dimensions used in that cube are displayed.
To filter the dimension view by cube:
1. Click Application, click Overview, and then click Dimensions.
2. Click the down arrow to the right of Cube to filter the list of dimensions by cube.
By default, the application displays all cubes for a standard application. If thedimension list is filtered, the application displays only the dimensions used in theselected cube.
Filtering by cube (rather than viewing all cubes) also enables you to view these detailsabout a dimension:
• Order of precedence
• Dimension density
• Evaluation order
For information about editing dimensions, see Editing Dimensions in the SimplifiedDimension Editor.
Creating DimensionsCreating a dimension adds it to the list of dimensions in the dimension view.
To create a dimension:
1. Click Application, click Overview, and then click Dimensions.
2. Click Create.
3. On the Create Dimension page, enter or select values for the properties that aredisplayed.
For descriptions of the properties, see Editing Member Properties in the SimplifiedDimension Editor.
For information about editing dimensions, see Editing Dimensions in the SimplifiedDimension Editor.
Viewing Activity ReportsAdministrators can view activity reports to monitor user activities. Activity reports areautomatically generated every day and enable administrators to understandapplication usage over a period of five, ten, thirty, or sixty days. They help streamlineapplication design by identifying calculation scripts and user requests that impactapplication performance. Information provided in these reports include:
• User information such as number of users who signed into the application eachday, each hour, last seven days, and last 30 days
• Percentage of requests that took more than 10 seconds to complete
• Ranking of requests by duration
Chapter 4Viewing Activity Reports
4-8
• Ranking the performance of requests that took more than 10 seconds to complete
• Number of application design changes that occurred over the reporting period
• Number and duration of user interface requests per hour
• Number and duration of Essbase operations per hour
• CPU and memory usage by hour
To view activity reports:
1. Click Application, and then click Overview.
2. Click Activity Reports.
3. Click the down arrow next to Reports from last to filter the list of reports.
4. To view the report details, click the name of the report that you want to view.
Importing and Exporting Data and MetadataMove data and metadata in and out of the application using Planning.
Related Topics
• Importing Metadata
• Exporting Metadata
• Importing and Exporting Data
Importing MetadataYou can import metadata from a flat file in a comma-delimited, tab-delimited, or otherformat. These artifacts are supported in the imports:
• Dimensions
• Smart Lists
• Exchange rate tables
To import metadata, perform these tasks:
• Create an import file for each artifact that you want to import. See Creating theImport File.
• Load the import file or files (you can import multiple dimension files at the sametime). See Loading the Import File.
Watch this tutorial video to learn how to import metadata.
Tutorial Video
Creating the Import FileRelated Topics
• About the Import File
• Example Entity Dimension Import File
Chapter 4Importing and Exporting Data and Metadata
4-9
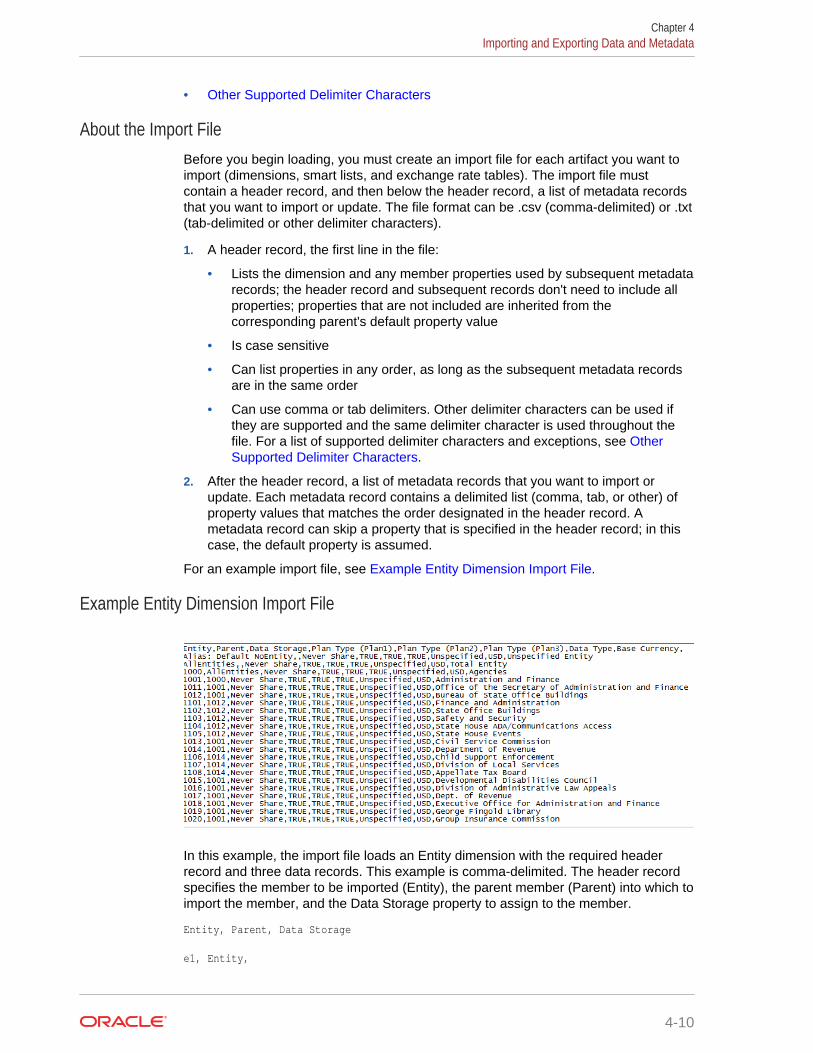
• Other Supported Delimiter Characters
About the Import FileBefore you begin loading, you must create an import file for each artifact you want toimport (dimensions, smart lists, and exchange rate tables). The import file mustcontain a header record, and then below the header record, a list of metadata recordsthat you want to import or update. The file format can be .csv (comma-delimited) or .txt(tab-delimited or other delimiter characters).
1. A header record, the first line in the file:
• Lists the dimension and any member properties used by subsequent metadatarecords; the header record and subsequent records don't need to include allproperties; properties that are not included are inherited from thecorresponding parent's default property value
• Is case sensitive
• Can list properties in any order, as long as the subsequent metadata recordsare in the same order
• Can use comma or tab delimiters. Other delimiter characters can be used ifthey are supported and the same delimiter character is used throughout thefile. For a list of supported delimiter characters and exceptions, see OtherSupported Delimiter Characters.
2. After the header record, a list of metadata records that you want to import orupdate. Each metadata record contains a delimited list (comma, tab, or other) ofproperty values that matches the order designated in the header record. Ametadata record can skip a property that is specified in the header record; in thiscase, the default property is assumed.
For an example import file, see Example Entity Dimension Import File.
Example Entity Dimension Import File
In this example, the import file loads an Entity dimension with the required headerrecord and three data records. This example is comma-delimited. The header recordspecifies the member to be imported (Entity), the parent member (Parent) into which toimport the member, and the Data Storage property to assign to the member.
Entity, Parent, Data Storage
e1, Entity,
Chapter 4Importing and Exporting Data and Metadata
4-10
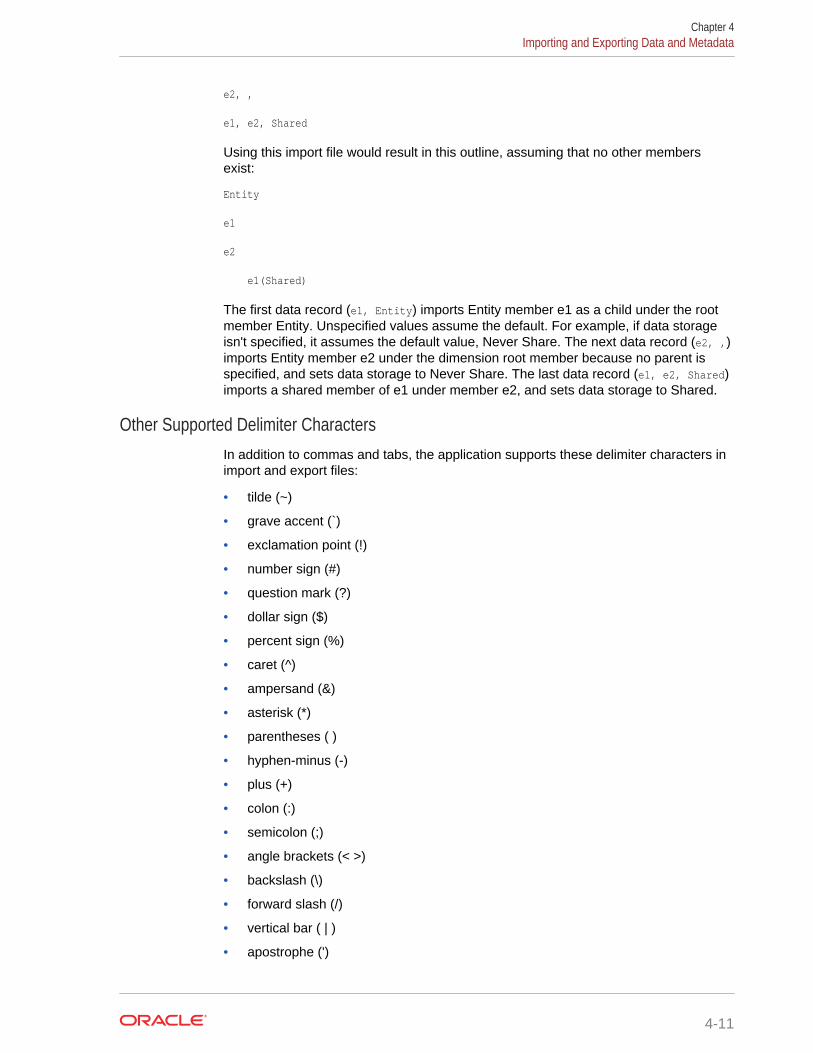
e2, ,
e1, e2, Shared
Using this import file would result in this outline, assuming that no other membersexist:
Entity
e1
e2
e1(Shared)
The first data record (e1, Entity) imports Entity member e1 as a child under the rootmember Entity. Unspecified values assume the default. For example, if data storageisn't specified, it assumes the default value, Never Share. The next data record (e2, ,)imports Entity member e2 under the dimension root member because no parent isspecified, and sets data storage to Never Share. The last data record (e1, e2, Shared)imports a shared member of e1 under member e2, and sets data storage to Shared.
Other Supported Delimiter CharactersIn addition to commas and tabs, the application supports these delimiter characters inimport and export files:
• tilde (~)
• grave accent (`)
• exclamation point (!)
• number sign (#)
• question mark (?)
• dollar sign ($)
• percent sign (%)
• caret (^)
• ampersand (&)
• asterisk (*)
• parentheses ( )
• hyphen-minus (-)
• plus (+)
• colon (:)
• semicolon (;)
• angle brackets (< >)
• backslash (\)
• forward slash (/)
• vertical bar ( | )
• apostrophe (')
Chapter 4Importing and Exporting Data and Metadata
4-11
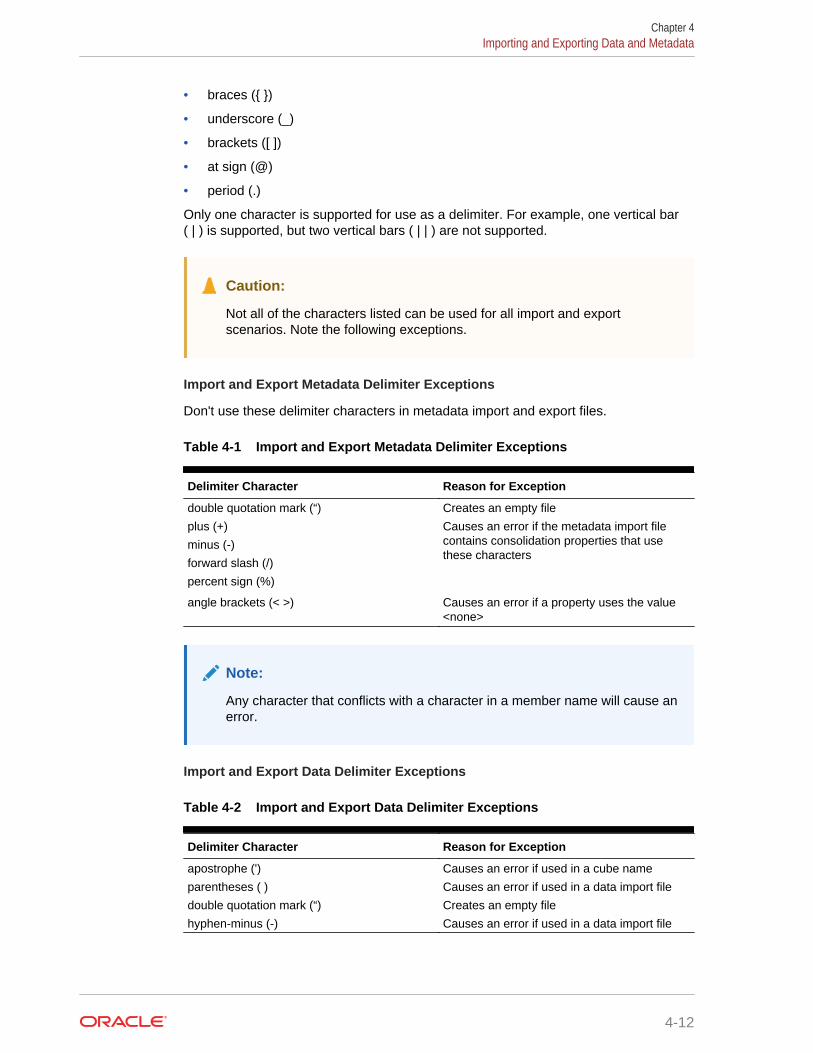
• braces ({ })
• underscore (_)
• brackets ([ ])
• at sign (@)
• period (.)
Only one character is supported for use as a delimiter. For example, one vertical bar( | ) is supported, but two vertical bars ( | | ) are not supported.
Caution:
Not all of the characters listed can be used for all import and exportscenarios. Note the following exceptions.
Import and Export Metadata Delimiter Exceptions
Don't use these delimiter characters in metadata import and export files.
Table 4-1 Import and Export Metadata Delimiter Exceptions
Delimiter Character Reason for Exception
double quotation mark (“) Creates an empty file
plus (+)
minus (-)
forward slash (/)
percent sign (%)
Causes an error if the metadata import filecontains consolidation properties that usethese characters
angle brackets (< >) Causes an error if a property uses the value<none>
Note:
Any character that conflicts with a character in a member name will cause anerror.
Import and Export Data Delimiter Exceptions
Table 4-2 Import and Export Data Delimiter Exceptions
Delimiter Character Reason for Exception
apostrophe (') Causes an error if used in a cube name
parentheses ( ) Causes an error if used in a data import file
double quotation mark (“) Creates an empty file
hyphen-minus (-) Causes an error if used in a data import file
Chapter 4Importing and Exporting Data and Metadata
4-12
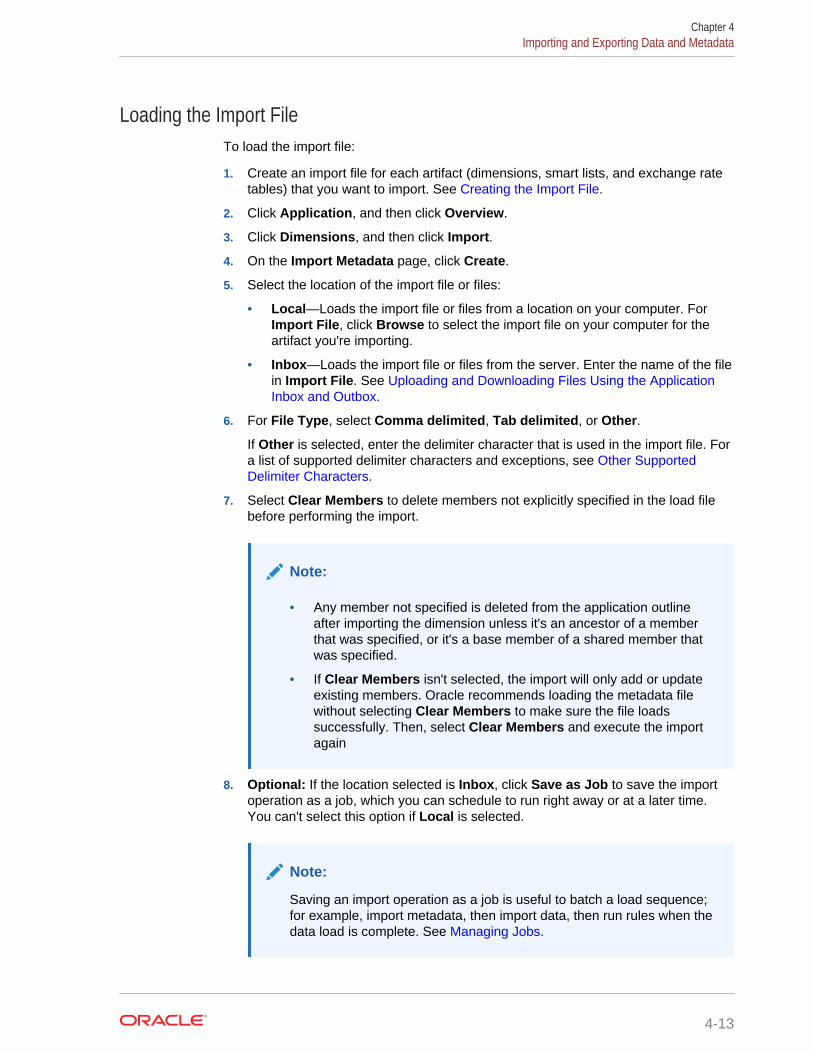
Loading the Import FileTo load the import file:
1. Create an import file for each artifact (dimensions, smart lists, and exchange ratetables) that you want to import. See Creating the Import File.
2. Click Application, and then click Overview.
3. Click Dimensions, and then click Import.
4. On the Import Metadata page, click Create.
5. Select the location of the import file or files:
• Local—Loads the import file or files from a location on your computer. ForImport File, click Browse to select the import file on your computer for theartifact you're importing.
• Inbox—Loads the import file or files from the server. Enter the name of the filein Import File. See Uploading and Downloading Files Using the ApplicationInbox and Outbox.
6. For File Type, select Comma delimited, Tab delimited, or Other.
If Other is selected, enter the delimiter character that is used in the import file. Fora list of supported delimiter characters and exceptions, see Other SupportedDelimiter Characters.
7. Select Clear Members to delete members not explicitly specified in the load filebefore performing the import.
Note:
• Any member not specified is deleted from the application outlineafter importing the dimension unless it's an ancestor of a memberthat was specified, or it's a base member of a shared member thatwas specified.
• If Clear Members isn't selected, the import will only add or updateexisting members. Oracle recommends loading the metadata filewithout selecting Clear Members to make sure the file loadssuccessfully. Then, select Clear Members and execute the importagain
8. Optional: If the location selected is Inbox, click Save as Job to save the importoperation as a job, which you can schedule to run right away or at a later time.You can't select this option if Local is selected.
Note:
Saving an import operation as a job is useful to batch a load sequence;for example, import metadata, then import data, then run rules when thedata load is complete. See Managing Jobs.
Chapter 4Importing and Exporting Data and Metadata
4-13
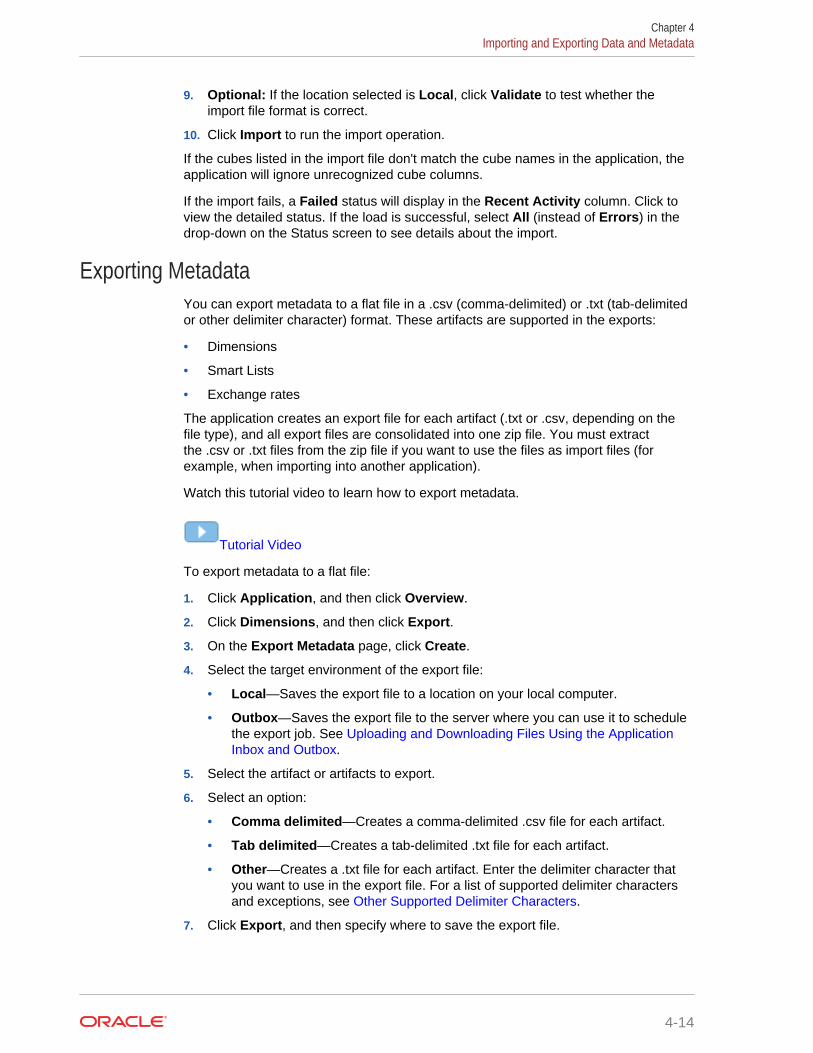
9. Optional: If the location selected is Local, click Validate to test whether theimport file format is correct.
10. Click Import to run the import operation.
If the cubes listed in the import file don't match the cube names in the application, theapplication will ignore unrecognized cube columns.
If the import fails, a Failed status will display in the Recent Activity column. Click toview the detailed status. If the load is successful, select All (instead of Errors) in thedrop-down on the Status screen to see details about the import.
Exporting MetadataYou can export metadata to a flat file in a .csv (comma-delimited) or .txt (tab-delimitedor other delimiter character) format. These artifacts are supported in the exports:
• Dimensions
• Smart Lists
• Exchange rates
The application creates an export file for each artifact (.txt or .csv, depending on thefile type), and all export files are consolidated into one zip file. You must extractthe .csv or .txt files from the zip file if you want to use the files as import files (forexample, when importing into another application).
Watch this tutorial video to learn how to export metadata.
Tutorial Video
To export metadata to a flat file:
1. Click Application, and then click Overview.
2. Click Dimensions, and then click Export.
3. On the Export Metadata page, click Create.
4. Select the target environment of the export file:
• Local—Saves the export file to a location on your local computer.
• Outbox—Saves the export file to the server where you can use it to schedulethe export job. See Uploading and Downloading Files Using the ApplicationInbox and Outbox.
5. Select the artifact or artifacts to export.
6. Select an option:
• Comma delimited—Creates a comma-delimited .csv file for each artifact.
• Tab delimited—Creates a tab-delimited .txt file for each artifact.
• Other—Creates a .txt file for each artifact. Enter the delimiter character thatyou want to use in the export file. For a list of supported delimiter charactersand exceptions, see Other Supported Delimiter Characters.
7. Click Export, and then specify where to save the export file.
Chapter 4Importing and Exporting Data and Metadata
4-14
Importing and Exporting DataAfter the dimensions are imported, you can populate the application data. You can't doa direct data load. You must import data from a file.
Watch this tutorial video to learn how to export and import data in the application.
Tutorial Video
• Importing Data
• Driver Member Casting Errors
• Exporting Data
• Viewing Data Import and Export Status
Importing DataWatch this video about loading data into the application.
Overview Video
To import data:
1. Click Application, and then click Overview.
2. Click Actions, and then click Import Data.
3. Click Create.
4. Select the location of the data import file:
• Local—Imports the data import file from a location on your computer.
• Inbox—Imports the data import file from the server. See Uploading andDownloading Files Using the Application Inbox and Outbox.
Note:
Valid data import file types are .csv, .txt, or .zip.
5. Select the Source Type of the data import file:
• Planning—Select this source type to load data in a Planning data file format.If you select this option, you must choose between Comma delimited, Tabdelimited, or Other.
Chapter 4Importing and Exporting Data and Metadata
4-15
Note:
– If an import error occurs during a Planning data load, the importwill continue to load valid data (partial load). Any errors will benoted in the import and export status. See Viewing Data Importand Export Status.
– For a list of supported delimiter characters and exceptions, see Other Supported Delimiter Characters.
– If data is exported to a file in Planning format, you can useNotepad to change the database name in the file; for example,ASOCube, and then import the data file into the aggregatestorage outline (provided all dimensions exist in the aggregatestorage outline).
• Essbase—Select this source type to load data in an Essbase data file format.If you select this option, you must choose a cube.
Note:
If any import errors occur during an Essbase data load, the importwill quit and no data will be loaded.
6. Enter or select the source file:
• If you selected Local, click Browse to navigate to the source file.
• If you selected Inbox, enter the name of the file in Source File.
7. Optional: Clear Include Metadata to improve data import performance and toprevent members from changing position in the outline during data import. If youopt to exclude metadata, the required metadata must already exist in theapplication before you can load the application data.
8. Click Save as Job to save the import operation as a job, which you can scheduleto run later.
Note:
• Save as Job is available only when Outbox is selected.
• Saving an import operation as a job is useful to batch a loadsequence, for example, import metadata, then import data, then runrules when the data load is complete. See Managing Jobs.
9. Optional: Click Validate to test whether the import file format is correct.
10. Click Import to run the import operation.
Chapter 4Importing and Exporting Data and Metadata
4-16
Note:
There is no option to clear data before import. Therefore, the import will notoverwrite existing data values with #MISSING values.
Caution:
If the evaluation order in the application is changed after exporting data, theimport may have unexpected results.
If a value in a data load input file doesn't match the evaluated driver member type; forexample, if the evaluated type of a driver member is "date" and it's corresponding inputvalue isn't a valid date format, a driver member casting error occurs. See DriverMember Casting Errors.
Driver Member Casting ErrorsA driver member casting error occurs when a value in a data load input file doesn'tmatch the evaluated driver member type. Here are some examples of driver membercasting errors:
• If a driver member is of type "Date" and it's corresponding input value isn't a validdate format
• If a nonexistent Smart List value is specified for a driver member of type "SmartList"
• If a nonnumeric value is supplied for a member of type "Currency," "Data," or"Percent."
A casting error can occur for each driver member specified in the input file and forevery occurrence in a data record, so the number of casting errors for a given inputrecord ranges from 0 to the number of drivers. Because successful driver memberbindings can occur along with driver member binding errors, the application will notreject the entire input record, but the error will be noted in the import and export status.See Viewing Data Import and Export Status.
Consider the following data record input file where a bad date value is specified:
Entity, aDate, aSl, aText, aCurr, aPercent, Point-of-View,Data Load Cube Name
e1, exampleBadDateValue, sl1, text11, 888, 0.99, "FY15,Current,""BUVersion_1"",Local,u1,Jan",Plan1
Error messages displayed:
• After loading the data, the status window will read:
Planning Outline data store load process finished (Invalid data values were not loaded). 7 data records were read, 7 data records were processed, 7 were accepted for loading (verify actual load with Essbase log files), 0 were rejected.
Chapter 4Importing and Exporting Data and Metadata
4-17
• The error is noted as an error in the import and export status with the followingentry details:
Category: Data record
Record Index: 2
Message: Unable to load specified data value in Record 2: (aDate: exampleBadDateValue)
• If multiple casting errors occur, each error is recorded in the same error message:
Unable to load specified data values in Record 2: (aSl: aaaaaaasl1), (aPercent: cc), (aDate: exampleBadDateValue), (aCurr: bb)
• If the error message count exceeds the maximum limit, it will issue the followingmessage:
The warning [Unable to load specified data values] message count limit (100) exceeded: no more warnings of this type will be issued.
Exporting DataTo export data to a file:
1. Click Application, and then click Overview.
2. Click Actions, and then click Export Data.
3. Click Create.
4. On the Export Data page, select the target environment of the data export file:
• Local—Saves the data export file to a location on your local computer.
• Outbox—Saves the data export file to the server. See Uploading andDownloading Files Using the Application Inbox and Outbox.
5. Select the cube.
6. Select the file type:
• Comma delimited—Creates a comma-delimited .csv file for each artifact.
• Tab delimited—Creates a tab-delimited .txt file for each artifact.
• Other—Creates a .txt file for each artifact. Enter the delimiter character thatyou want to use in the export file. For a list of supported delimiter charactersand exceptions, see Other Supported Delimiter Characters.
7. For Smart Lists, specify Export Labels or Export Names.
8. For Dynamic Members, select whether to Include or Exclude dynamiccalculation members during export.
Note:
Excluding dynamic members from exported data improves performanceduring data exports.
9. Select the slice of data to be exported.
Chapter 4Importing and Exporting Data and Metadata
4-18
Note:
If you're exporting data from an aggregate storage cube and you'reexporting multiple members simultaneously, make sure that at least oneof the members you select is a non-shared member. You can exportshared members individually because it's equivalent to selecting a basemember. However, selecting level 0 descendants of a parent memberwhose descendants are all shared members is equivalent to notselecting any members from a dimension and the export will not run.Therefore, you must ensure that one of the members selected is a non-shared member.
10. Optional: Click Save as Job to save the export operation as a job, which you canschedule to run immediately or at a later time.
Note:
• Save as Job is available only when Outbox is selected.
• For more information about scheduling jobs, see Managing Jobs.
11. Click Export, and then specify where to save the data export file.
Note:
To reduce the size of data export files, if a form has an entire row of#MISSING values, the row will be omitted from the data export file.
Viewing Data Import and Export StatusTo view the status of a data import and export:
1. Click Application, and then click Jobs.
2. Click the name of the import or export job under Recent Activity.
Importing Exchange Rates for a Simplified MulticurrencyApplication
To simplify managing exchange rates for a simplified multiple currency application, youcan export the provided template, enter exchange rates in a spreadsheet, and importthe rates to your application.
To import exchange rates using a template:
1. From the Home page, click Application, and then Overview.
2. From the Actions menu, select Export Exchange Rate Template, and then openExchangeRateTemplate.csv or save it locally.
Chapter 4Importing Exchange Rates for a Simplified Multicurrency Application
4-19
3. In the template file, enter average and ending currency exchange rates for eachperiod and each currency, specify members for the POV, and then save the file.
Note:
The number 1 represents the exchange rate for the default currency inthe application. Enter rates relative to the default currency.
4. From the Actions menu, select Import Exchange Rates, click Create, browse forthe file, and then click Import.
Creating and Refreshing Application DatabasesRelated Topics
• Creating Application Databases
• Before Refreshing the Database
• Refreshing Application Databases
Creating Application DatabasesThe application database, which stores data for each cube in the application, iscreated when the application is created. See Creating an Application.
If you need to clear the data, you can do so using Calculation Manager. To refresh thedata, see Refreshing Application Databases.
Before Refreshing the DatabaseYou must refresh the database after changing the application structure, and modifyingartifacts such as dimensions and members. Oracle recommends that you notify allusers, asking them to save their work and close the application, before you refresh thedatabase.
Before refreshing the database:
• Back up your outline file and export data from all databases.
• Decide if you want to enable all users or just the current administrator to use theapplication in administration mode during the refresh
• Decide if you want to log off all users
• Terminate any active application requests
Refreshing Application DatabasesTo refresh the database:
1. See Before Refreshing the Database.
2. Click Application, and then click Overview.
3. Click Actions, and then Refresh Database.
Chapter 4Creating and Refreshing Application Databases
4-20
4. On the Refresh Database page, click Create, and then select from the followingoptions:
• Enable use of the application for—Lets All users or Administrators (or thecurrent logged in administrator) access the application in administration modeduring the refresh
• Log off all users—Logs off all application users before starting the refresh
• Kill all active requests—Terminates any active requests in the Essbaseapplication before starting the refresh
• Update custom-defined functions
• Security Filters—Updates security filters simultaneously for all users. Ifselected, you can also select the following options:
– Shared Members—Applies security filters to shared members
– Validate Limit—Validates that the size of security filters doesn't exceedthe Essbase limit of 64 KB per row
• Enable use of the application for—Lets All users or Administrators usethe application after the refresh
5. To refresh the database now, click Refresh Database. To run the refresh later, asa job, click Save as Job. See Managing Jobs.
Adding an Aggregate Storage Outline to an ApplicationRelated Topics
• About Aggregate Storage
• Aggregate Storage Outline Cube Characteristics
• Process for Adding an Aggregate Storage Database to an Application
About Aggregate StorageAggregate storage is the database storage model that supports large-scale, sparselydistributed data that is categorized into many, potentially large dimensions. Selecteddata values are aggregated and stored, typically with improvements in aggregationtime. Aggregate storage is an alternative to block storage (dense-sparseconfiguration).
Aggregate Storage Outline Cube Characteristics• The application doesn't generate XREFs on aggregate storage databases. XREFs
can only be generated on block storage databases.
• Because the application doesn't require all base dimensions on an aggregatestorage database, approvals may not apply to the aggregate storage database ifan approvals dimension is missing. If this is the case, normal security would apply.
• Dynamic time series members are not applicable for the Period dimension in anaggregate storage application.
• Creating and refreshing security filters are not applicable for aggregate storagedatabases.
Chapter 4Adding an Aggregate Storage Outline to an Application
4-21
Process for Adding an Aggregate Storage Database to an ApplicationTo add an aggregate storage database to an application:
1. Create an aggregate storage cube. Perform one task:
• Create an aggregate storage cube during application creation.
See Creating an Application.
• Add a new cube using the cube editor.
See Managing Cubes.
2. Add dimensions to the aggregate storage cube.
See Editing Dimensions in the Simplified Dimension Editor.
• If a Currency, Years, Scenario, or Version dimension is valid for an aggregatestorage cube, the dimension members are also valid for an aggregate storagecube.
• To perform currency calculations in a simplified multiple currency applicationfor a custom aggregate storage cube, you must enable the Account, Period,and Currency dimensions for the aggregate storage cube. These dimensionsin default aggregate storage cubes are enabled by default, but you mustenable them manually for custom aggregate storage cubes. To enableAccount, Period, and Currency dimensions for custom aggregate storagecubes, edit dimension properties for each dimension and select to enablethem for the aggregate storage cube. See Editing Dimension Properties in theSimplified Dimension Editor.
3. Add dimension members. See Adding Members in the Simplified DimensionEditor.
4. Refresh the outline for the application. See Refreshing Application Databases.
5. Create a form using the dimensions associated with the aggregate storagedatabase. See Administering Forms
Converting to a Standard ApplicationIf you need additional cubes, and the logic required to support more extensivecalculations, convert your Reporting application to a Standard application. Duringconversion, one cube, and the associated dimensions are added to your application.After conversion, you can add up to six additional cubes (three aggregate storageoutline cubes and three block storage outline cubes).
The Enable Sandboxes option is available when converting a Reporting application toa Standard application. After you convert to a Standard application, however, you can'tlater enable it for sandboxes. See Enabling Sandboxes.
Caution:
Converting an application can't be undone. Be sure you back up your databefore converting.
Chapter 4Converting to a Standard Application
4-22
To convert to a Standard application:
1. Click Application, and then click Overview.
2. Click Actions, and then select Convert to Standard.
Converting an Oracle Planning and Budgeting CloudApplication to an Oracle Enterprise Planning and BudgetingCloud Application
To convert an Oracle Planning and Budgeting Cloud application to an OracleEnterprise Planning and Budgeting Cloud application:
1. Review the conversion considerations. See Conversion Considerations.
2. Back up the Standard or Reporting application.
3. Open the application, and then click Application , and then Overview
.
4. Click Actions, then Convert to Enterprise, and then Continue to proceed. Amessage lets you know if the Application is converted to Enterprise. If successful,log off.The application type is changed to "Enterprise", which includes options to enableand configure the business processes, and enables Groovy scripting. Metadataand data is not changed during the conversion.
5. Log on and enable features for the business processes that you use.
These validations are performed when you enable features:
• There can't be a member that already exists with the same name as any of thecustom and base dimensions you specify in Map/Rename Dimensions. Forexample, if you create a custom dimension called Market in Financials, therecan't be a member called Market in any other dimension.
• There can't be a member with the name NO_<<customDimension>>,Total_<Dimension>>, All_<<Dimension>>, where <<Dimension>> isthe actual dimension name you specified. For example, if you rename PlanElement in Financials to Element for a custom dimension, there can't be NoElement, Total Element. This is specific to business processes thatdepend on any non-prefixed member.
• Period and Account dimension data storage has to be set to Never Share.
• The Year dimension name has to be Years.
• 18 alias tables are predefined. The maximum supported is 32 (1 usedinternally). The conversion process attempts to merge the predefined aliastables with the alias tables in the existing application; if the count goes above30, you'll see a validation error.
Chapter 4Converting an Oracle Planning and Budgeting Cloud Application to an Oracle Enterprise Planning and Budgeting Cloud
Application
4-23
• The conversion process calculates the number of existing dimensions in theapplication and the number of new dimensions that would be created if thebusiness process is initialized. If resulting sum of both is greater than 32 (themaximum allowed), you'll see a validation error.
• For Projects, the name you specify for Program (a custom dimension option)shouldn’t already exist as a non-attribute dimension.
• For Workforce, none of the version members can be Label only.
When you convert an on-premise Oracle Hyperion Planning R11.1.2.1 (supportedversion) application to Oracle Enterprise Planning and Budgeting Cloud usingMigration, the same rules above apply.
Conversion ConsiderationsYou can convert a Standard or Reporting application created in Oracle Planning andBudgeting Cloud to an Oracle Enterprise Planning and Budgeting Cloud application.
You can convert a Standard application to an Oracle Enterprise Planning andBudgeting Cloud application if:
• You are commercially authorized to implement an application of type "Enterprise".
• It does not use weekly, quarterly, or custom time periods.
• You rename the Year dimension to Years prior to converting.
• It uses simplified multicurrency (that is, it's not a standard currency application), ifit's a multicurrency application.
• Artifact names don't use these prefixes:
– oep_—Prefix for artifacts common to all business processes
– ofs_—Prefix for Financials artifacts
– owp_—Prefix for Workforce artifacts
– opf_—Prefix for Projects artifacts
– ocx_—Prefix for Capital artifacts
Removing an ApplicationBecause removing an application will delete all of its contents and any scheduled jobs,make a backup of your application.
To remove an application:
1. Click the Application, then click Overview.
2. Click Actions, and then Remove Application.
Setting Service Maintenance TimeA service instance requires one hour every day to perform routine maintenance.Service Administrators can select (and change) the most convenient time to start thehour-long maintenance window. In addition to routine maintenance, Oracle appliesrequired patches to the service instance during this maintenance window.
Chapter 4Conversion Considerations
4-24
Because the service instance isn't available to users during the maintenance window,the Service Administrator should identify a one-hour period when no one uses theservice. Any connected user will be logged off and will lose unsaved data.
The default maintenance start time is midnight Pacific Standard Time (PST). If youdon't reset the default start time for your instance, Oracle resets it to a random timebetween 10:00 p.m. and 2:00 a.m. PST to reduce the service maintenance duration.
Note:
If you really want the maintenance time to start at midnight PST, you shouldselect it using the following procedure. In such cases, Oracle will not changeyour selection.
To manage maintenance window:
1. Access a service instance.
2. Tap or click Tools and then Daily Maintenance.
3. In Start Time, select the time at which the daily maintenance process should start.Also, select your time zone from the drop-down list.
4. Click Apply.
Uploading and Downloading Files Using the ApplicationInbox and Outbox
Use the Inbox/Outbox Explorer to upload files to the server or download them to yourcomputer. You can also use it to schedule import and export jobs.
To schedule an import or export job, see Scheduling Jobs.
To upload and download files using the Inbox/Outbox Explorer:
1. Click Application, and then click Overview.
2. Click Actions, and then Inbox/Outbox Explorer.
3. Filter by name, refresh the listing, and upload files from the server.
Chapter 4Uploading and Downloading Files Using the Application Inbox and Outbox
4-25
5Using the Member Selector
Related Topics
• Working with Members
• Making Selections
• Member Relationships
• Using Wildcards in Searches
• Selecting Attribute Values as Members
• Selecting Members for Forms
• Selecting Substitution Variables as Members
• Selecting User Variables as Members
Working with MembersUse the Select Members dialog box to select the members to use with the followingfeatures:
• Business rule runtime prompts
• User variables
• Dynamic variables
• Data export
• Ad hoc forms
• Point of view and page axis where valid intersection rules are applied
• Valid intersections
If variables and attributes are defined, you can select variables and attributes. You candisplay and select members by member name or alias. The display options that youdefine for the Member Selection dialog box override those defined as an applicationdefault by an administrator, and those specified as an application preference.
Making SelectionsOnly members, substitution variables, and attributes to which you have access aredisplayed. The Selections pane only displays if you invoke the member selector formultiple member selection.
If valid intersection rules are used, only valid members are displayed in applicationforms and in runtime prompts for Calculation Manager rules. In ad hoc forms, both onthe Web and in Oracle Smart View for Office, the application doesn't filter by validintersections rules in point of view and page axis. Only cells in grids honor validintersection rules in ad hoc forms.
5-1
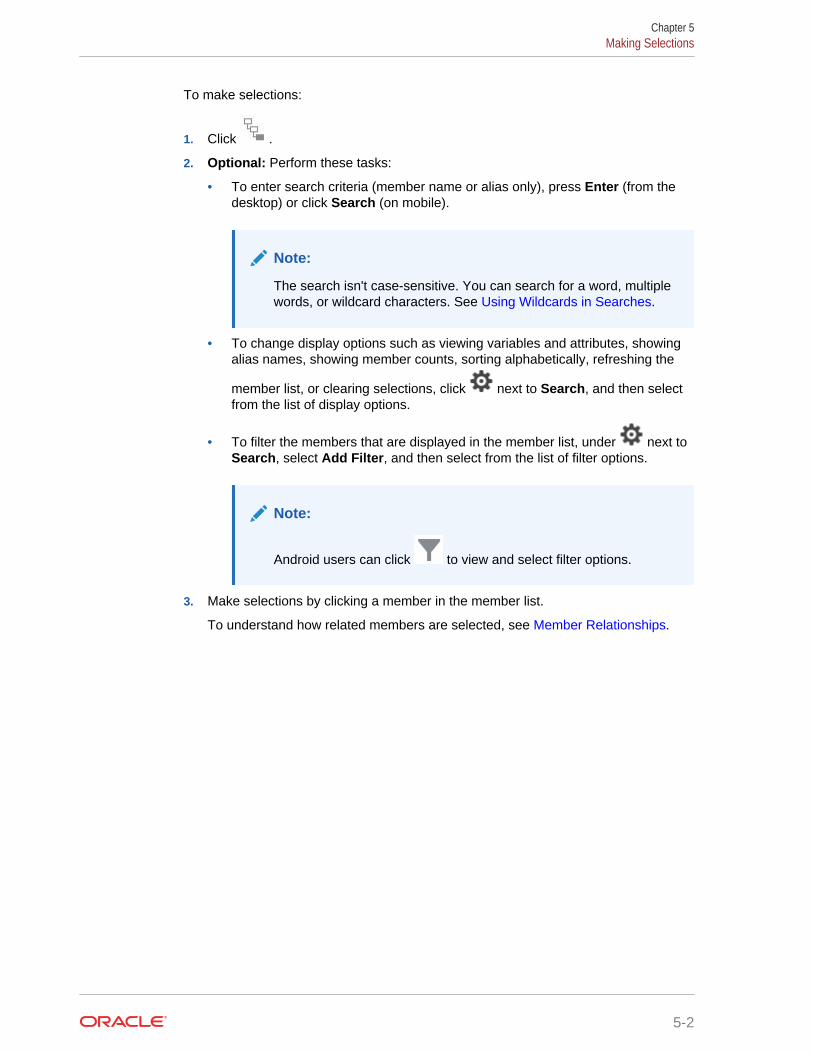
To make selections:
1. Click .
2. Optional: Perform these tasks:
• To enter search criteria (member name or alias only), press Enter (from thedesktop) or click Search (on mobile).
Note:
The search isn't case-sensitive. You can search for a word, multiplewords, or wildcard characters. See Using Wildcards in Searches.
• To change display options such as viewing variables and attributes, showingalias names, showing member counts, sorting alphabetically, refreshing the
member list, or clearing selections, click next to Search, and then selectfrom the list of display options.
• To filter the members that are displayed in the member list, under next toSearch, select Add Filter, and then select from the list of filter options.
Note:
Android users can click to view and select filter options.
3. Make selections by clicking a member in the member list.
To understand how related members are selected, see Member Relationships.
Chapter 5Making Selections
5-2
Note:
• Selected members display a check mark and are moved to theSelections pane, if applicable.
• To expand a parent member to see its child members, click theexpansion icon to the right of the parent member name. Clicking theexpansion icon will not select the parent member.
• To clear selections you have made, click and then select ClearSelection.
At times, you may find that a point of view and page axis memberyou want to select is suppressed. This occurs because a dimensionselection in the point of view and page axis has invalidated otherdimensions due to valid intersections that were applied. To resolvethis issue, use the Clear Selection option to clear the point of viewand page axis members you previously selected. Then you can usethe point of view and page axis again to select members that werepreviously suppressed.
• To show all the members that are suppressed due to valid
intersection rules, click and then select Show Invalid Members.Invalid members are displayed but are unavailable for selection.
4. Optional: Perform these tasks:
• To further refine which related members are selected in the Selections pane,
click to the right of the member.
• If substitution variables or attributes are defined, below the member selection
area, click next to Members, and then select Substitution Variables orAttributes to select members for substitution variables or attributes. Membersare displayed as children. Only members to which the user has read accessare displayed in forms.
• To move or remove members in the Selections pane, click next toSelections.
• To highlight the location of a selected member within the dimension hierarchy,double-click the member name in the Selections pane.
Note:
To highlight the location of a selected member on a mobile device,tap the member name in the Selections pane, and then tap Locate
under next to Selections.
5. When you're done making selections, click OK.
Chapter 5Making Selections
5-3
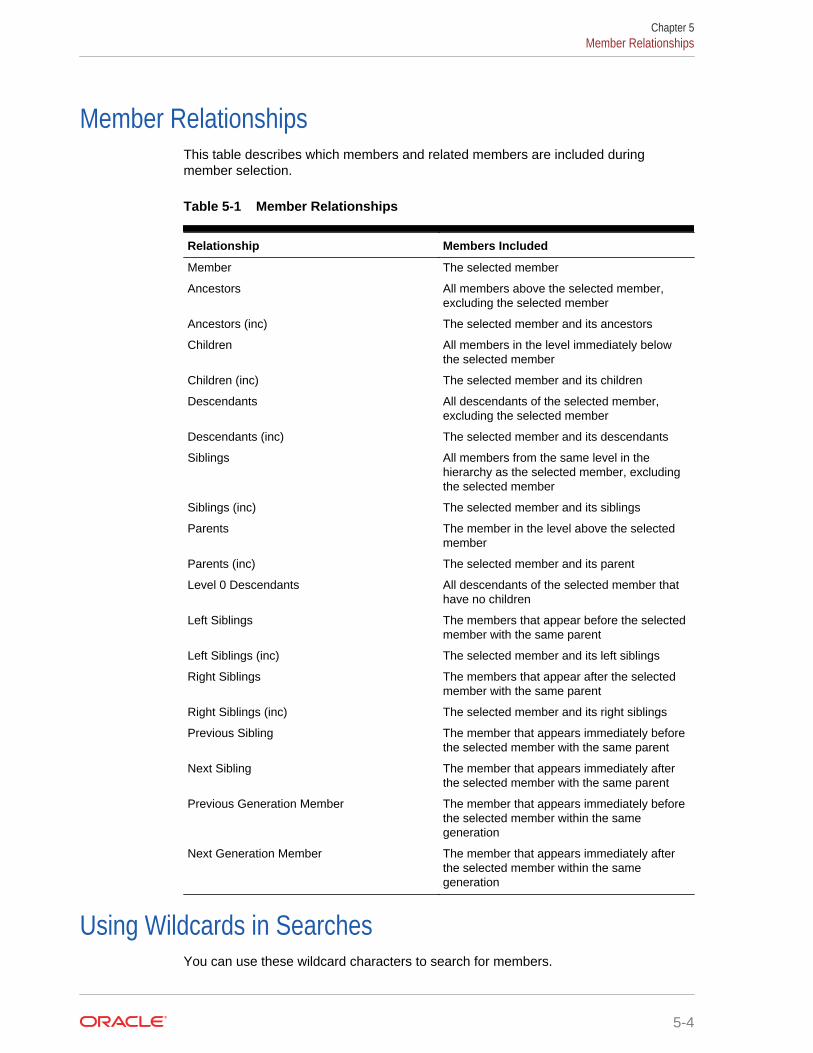
Member RelationshipsThis table describes which members and related members are included duringmember selection.
Table 5-1 Member Relationships
Relationship Members Included
Member The selected member
Ancestors All members above the selected member,excluding the selected member
Ancestors (inc) The selected member and its ancestors
Children All members in the level immediately belowthe selected member
Children (inc) The selected member and its children
Descendants All descendants of the selected member,excluding the selected member
Descendants (inc) The selected member and its descendants
Siblings All members from the same level in thehierarchy as the selected member, excludingthe selected member
Siblings (inc) The selected member and its siblings
Parents The member in the level above the selectedmember
Parents (inc) The selected member and its parent
Level 0 Descendants All descendants of the selected member thathave no children
Left Siblings The members that appear before the selectedmember with the same parent
Left Siblings (inc) The selected member and its left siblings
Right Siblings The members that appear after the selectedmember with the same parent
Right Siblings (inc) The selected member and its right siblings
Previous Sibling The member that appears immediately beforethe selected member with the same parent
Next Sibling The member that appears immediately afterthe selected member with the same parent
Previous Generation Member The member that appears immediately beforethe selected member within the samegeneration
Next Generation Member The member that appears immediately afterthe selected member within the samegeneration
Using Wildcards in SearchesYou can use these wildcard characters to search for members.
Chapter 5Member Relationships
5-4
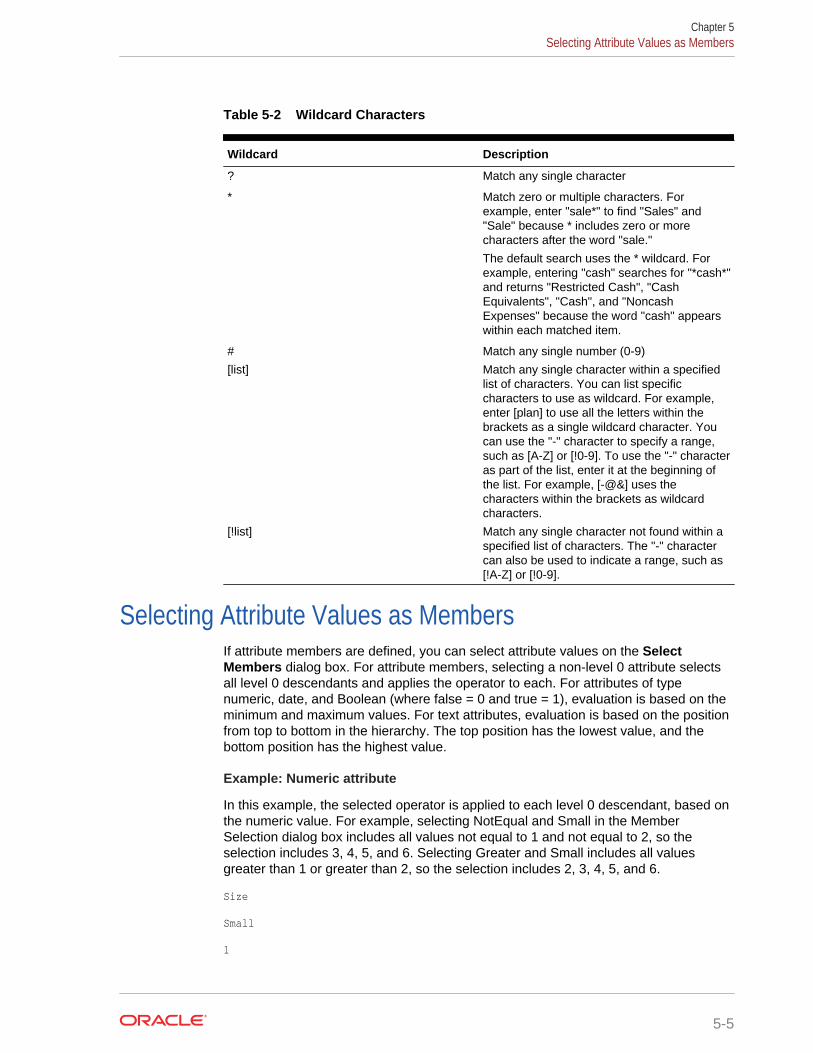
Table 5-2 Wildcard Characters
Wildcard Description
? Match any single character
* Match zero or multiple characters. Forexample, enter "sale*" to find "Sales" and"Sale" because * includes zero or morecharacters after the word "sale."
The default search uses the * wildcard. Forexample, entering "cash" searches for "*cash*"and returns "Restricted Cash", "CashEquivalents", "Cash", and "NoncashExpenses" because the word "cash" appearswithin each matched item.
# Match any single number (0-9)
[list] Match any single character within a specifiedlist of characters. You can list specificcharacters to use as wildcard. For example,enter [plan] to use all the letters within thebrackets as a single wildcard character. Youcan use the "-" character to specify a range,such as [A-Z] or [!0-9]. To use the "-" characteras part of the list, enter it at the beginning ofthe list. For example, [-@&] uses thecharacters within the brackets as wildcardcharacters.
[!list] Match any single character not found within aspecified list of characters. The "-" charactercan also be used to indicate a range, such as[!A-Z] or [!0-9].
Selecting Attribute Values as MembersIf attribute members are defined, you can select attribute values on the SelectMembers dialog box. For attribute members, selecting a non-level 0 attribute selectsall level 0 descendants and applies the operator to each. For attributes of typenumeric, date, and Boolean (where false = 0 and true = 1), evaluation is based on theminimum and maximum values. For text attributes, evaluation is based on the positionfrom top to bottom in the hierarchy. The top position has the lowest value, and thebottom position has the highest value.
Example: Numeric attribute
In this example, the selected operator is applied to each level 0 descendant, based onthe numeric value. For example, selecting NotEqual and Small in the MemberSelection dialog box includes all values not equal to 1 and not equal to 2, so theselection includes 3, 4, 5, and 6. Selecting Greater and Small includes all valuesgreater than 1 or greater than 2, so the selection includes 2, 3, 4, 5, and 6.
Size
Small
1
Chapter 5Selecting Attribute Values as Members
5-5
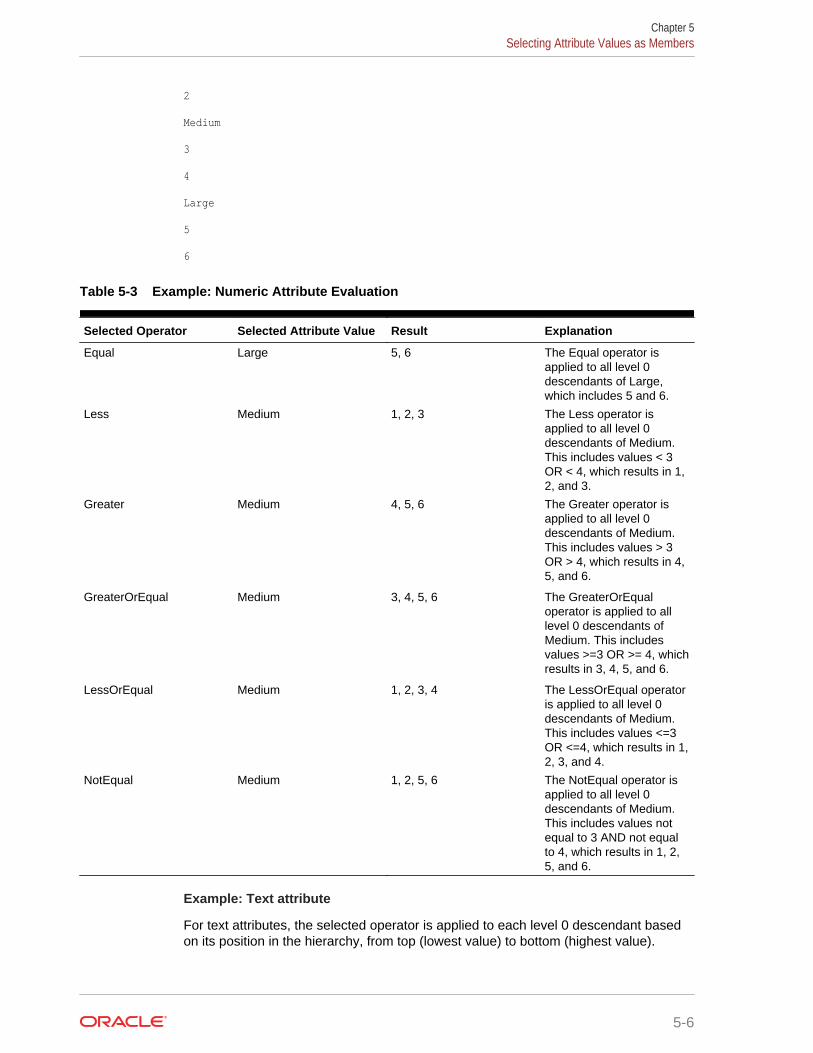
2
Medium
3
4
Large
5
6
Table 5-3 Example: Numeric Attribute Evaluation
Selected Operator Selected Attribute Value Result Explanation
Equal Large 5, 6 The Equal operator isapplied to all level 0descendants of Large,which includes 5 and 6.
Less Medium 1, 2, 3 The Less operator isapplied to all level 0descendants of Medium.This includes values < 3OR < 4, which results in 1,2, and 3.
Greater Medium 4, 5, 6 The Greater operator isapplied to all level 0descendants of Medium.This includes values > 3OR > 4, which results in 4,5, and 6.
GreaterOrEqual Medium 3, 4, 5, 6 The GreaterOrEqualoperator is applied to alllevel 0 descendants ofMedium. This includesvalues >=3 OR >= 4, whichresults in 3, 4, 5, and 6.
LessOrEqual Medium 1, 2, 3, 4 The LessOrEqual operatoris applied to all level 0descendants of Medium.This includes values <=3OR <=4, which results in 1,2, 3, and 4.
NotEqual Medium 1, 2, 5, 6 The NotEqual operator isapplied to all level 0descendants of Medium.This includes values notequal to 3 AND not equalto 4, which results in 1, 2,5, and 6.
Example: Text attribute
For text attributes, the selected operator is applied to each level 0 descendant basedon its position in the hierarchy, from top (lowest value) to bottom (highest value).
Chapter 5Selecting Attribute Values as Members
5-6
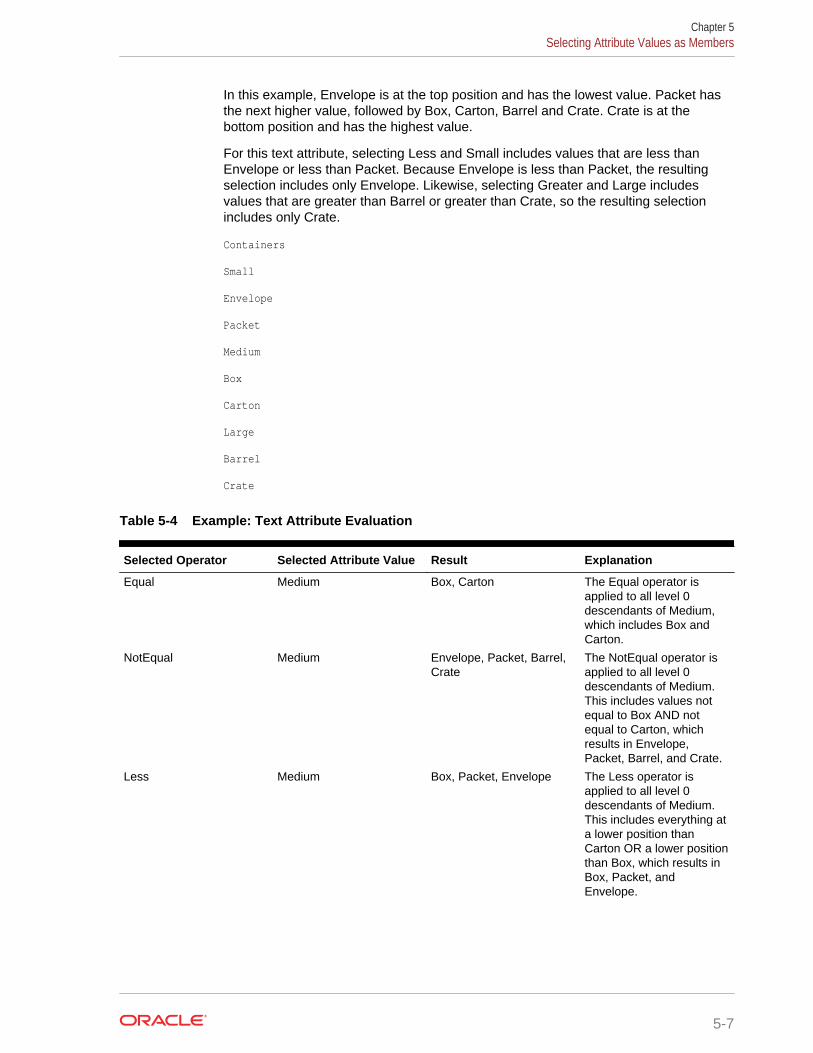
In this example, Envelope is at the top position and has the lowest value. Packet hasthe next higher value, followed by Box, Carton, Barrel and Crate. Crate is at thebottom position and has the highest value.
For this text attribute, selecting Less and Small includes values that are less thanEnvelope or less than Packet. Because Envelope is less than Packet, the resultingselection includes only Envelope. Likewise, selecting Greater and Large includesvalues that are greater than Barrel or greater than Crate, so the resulting selectionincludes only Crate.
Containers
Small
Envelope
Packet
Medium
Box
Carton
Large
Barrel
Crate
Table 5-4 Example: Text Attribute Evaluation
Selected Operator Selected Attribute Value Result Explanation
Equal Medium Box, Carton The Equal operator isapplied to all level 0descendants of Medium,which includes Box andCarton.
NotEqual Medium Envelope, Packet, Barrel,Crate
The NotEqual operator isapplied to all level 0descendants of Medium.This includes values notequal to Box AND notequal to Carton, whichresults in Envelope,Packet, Barrel, and Crate.
Less Medium Box, Packet, Envelope The Less operator isapplied to all level 0descendants of Medium.This includes everything ata lower position thanCarton OR a lower positionthan Box, which results inBox, Packet, andEnvelope.
Chapter 5Selecting Attribute Values as Members
5-7
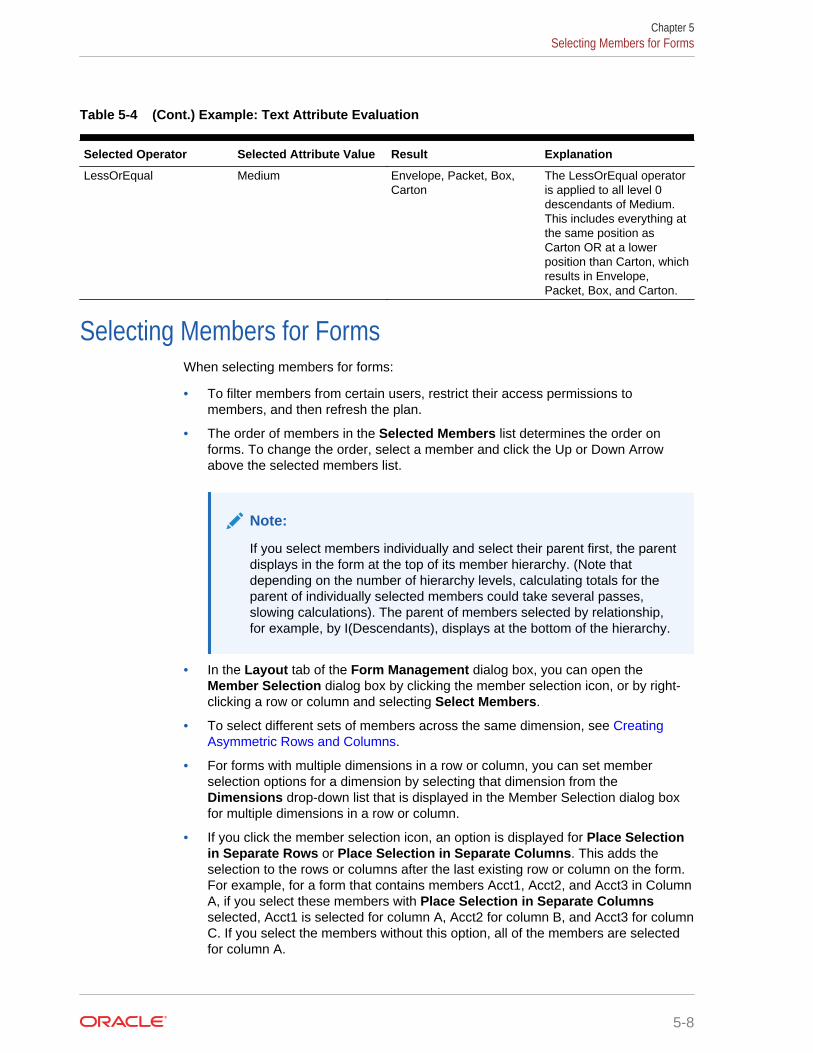
Table 5-4 (Cont.) Example: Text Attribute Evaluation
Selected Operator Selected Attribute Value Result Explanation
LessOrEqual Medium Envelope, Packet, Box,Carton
The LessOrEqual operatoris applied to all level 0descendants of Medium.This includes everything atthe same position asCarton OR at a lowerposition than Carton, whichresults in Envelope,Packet, Box, and Carton.
Selecting Members for FormsWhen selecting members for forms:
• To filter members from certain users, restrict their access permissions tomembers, and then refresh the plan.
• The order of members in the Selected Members list determines the order onforms. To change the order, select a member and click the Up or Down Arrowabove the selected members list.
Note:
If you select members individually and select their parent first, the parentdisplays in the form at the top of its member hierarchy. (Note thatdepending on the number of hierarchy levels, calculating totals for theparent of individually selected members could take several passes,slowing calculations). The parent of members selected by relationship,for example, by I(Descendants), displays at the bottom of the hierarchy.
• In the Layout tab of the Form Management dialog box, you can open theMember Selection dialog box by clicking the member selection icon, or by right-clicking a row or column and selecting Select Members.
• To select different sets of members across the same dimension, see CreatingAsymmetric Rows and Columns.
• For forms with multiple dimensions in a row or column, you can set memberselection options for a dimension by selecting that dimension from theDimensions drop-down list that is displayed in the Member Selection dialog boxfor multiple dimensions in a row or column.
• If you click the member selection icon, an option is displayed for Place Selectionin Separate Rows or Place Selection in Separate Columns. This adds theselection to the rows or columns after the last existing row or column on the form.For example, for a form that contains members Acct1, Acct2, and Acct3 in ColumnA, if you select these members with Place Selection in Separate Columnsselected, Acct1 is selected for column A, Acct2 for column B, and Acct3 for columnC. If you select the members without this option, all of the members are selectedfor column A.
Chapter 5Selecting Members for Forms
5-8
This feature is available for single members only, not for members selected withfunctions, such as Children (inc). For example, if you select Q/IChildren forColumn A and select Place Selection in Separate Columns, the form layout isn'tchanged.
• All settings except Count are retained after the Member Selection dialog box isclosed, and members in the Member Selection dialog box are displayed based onuser-defined settings. Members displayed on the Layout tab don't inherit thedisplay settings defined in Member Selection dialog box. Instead, they aredisplayed using the member name.
• To define different sets of members for a dimension, see Creating AsymmetricRows and Columns.
• To set display, functionality, and printing options, see Setting Form Precision andOther Options.
Selecting Substitution Variables as MembersSubstitution variables act as global placeholders for information that changesregularly. Substitution variables are especially useful for developing and reporting onrolling forecasts. When you select substitution variables as members on the form, theirvalues are based on dynamically generated information. For example, you could setthe current month member to the substitution variable CurMnth so that when the monthchanges, you need not update the month value manually in the form or the reportscript.
Chapter 5Selecting Substitution Variables as Members
5-9
Note:
• When you open or calculate values on forms, the application replacessubstitution variables with values assigned to them.
• You create and assign values to substitution variables within theapplication. These substitution variables are then available in theapplication when you select members for a form. For instructions oncreating and assigning values to substitution variables using theapplication, see Working with Substitution Variables.
• Substitution variables must be appropriate for the context in forms. Forexample, you could select a substitution variable named CurrQtr with avalue of Qtr2 as a member of the Time Period dimension. It's not valid toselect a substitution variable named CurrYr for the Years dimension if itsvalue is Feb. You can set substitution variables at the application ordatabase level.
The same substitution variable can exist on multiple levels; theapplication uses the first one it finds as it searches in this order:
1. Database
2. Application
• You can select from substitution variables if they are enabled for runtimeprompts in business rules, and their values match a member set in theruntime prompt for a business rule.
• The application checks the validity of substitution variables when theyare used (for example, when the form is opened). It doesn't check whenyou design forms, so you should test substitution variables by saving andopening forms.
• If you migrated an application that uses Global variables, you can view,but not edit, them in Planning.
To specify substitution variables in forms:
1. Create the form (see Creating Simple Forms).
2. In Member Selection, select substitution variables the same way you selectmembers, to move substitution variables to and from Selected Members.
When selected, a substitution variable is preceded by an ampersand (&). Forexample:
&CurrentScenario
3. Click OK.
Selecting User Variables as MembersUser variables act as filters in forms, enabling planners to focus only on certainmembers, such as a department. Before you can associate a user variable with aform, you must create the user variable. See Managing User Variables.
Chapter 5Selecting User Variables as Members
5-10
When you create forms with user variables, planners must select values for thevariable before opening forms. For example, if you create a user variable calledDivision, planners must select a division before working in the form. The first time youselect a variable for a form, you do it in preferences. Afterward, you can update thevariable in preferences or in the form.
To select user variables for forms:
1. Create the form (see Creating Simple Forms).
2. On Member Selection, select user variables the same way you select members,using the arrows to move substitution variables to and from Selected Members.
User variables are displayed for the current dimension. For example, uservariables for the Entity dimension might display as follows:
Division = [User Variable]
When selected, a user variable is preceded by an ampersand. For example:
Idescendants(&Division)
3. Click OK.
Chapter 5Selecting User Variables as Members
5-11
6Connecting Subscriptions in EPM Cloud
Related Topics
• About Connecting EPM Cloud Subscriptions
• Considerations When Migrating Cross-Subscription Connections
• Creating, Editing, and Deleting Connections to Other EPM Cloud Subscriptions
• Navigating Across EPM Cloud Subscriptions
• Customizing Navigation Flows to Access Other EPM Cloud Subscriptions
About Connecting EPM Cloud SubscriptionsOverview
Service Administrators can connect multiple EPM Cloud subscriptions of the followingtypes:
• Planning and Budgeting
• Enterprise Planning and Budgeting
• Financial Close and Consolidation
• Tax Reporting
• Profitability and Cost Management
• Account Reconciliation
• Enterprise Performance Reporting
• Strategic Workforce Planning
Once administrators set up the connections, users who have access across EPMCloud subscriptions can navigate across them from a single access point with onelogin. Also artifacts such as forms, dashboards, and so on, from across subscriptionscan be co-mingled within a cluster or within tabs on a card in navigation flows. Artifactsin the target subscription are accessible based on the user's role.
Watch this overview video to learn how to integrate EPM business process flows.
Overview Video
Which EPM Cloud subscriptions can I connect?
The source subscription is the subscription from which you're creating the connection.The target subscription is the subscription to which you're connecting from the sourcesubscription.
You can connect these source subscriptions (these subscriptions can also be targetsubscriptions):
6-1
• Oracle Planning and Budgeting Cloud
• Oracle Enterprise Planning and Budgeting Cloud
• Oracle Financial Consolidation and Close Cloud
• Oracle Tax Reporting Cloud
Source subscriptions can also connect to these target subscriptions (thesesubscriptions can't be source subscriptions):
• Oracle Account Reconciliation Cloud
• Oracle Profitability and Cost Management Cloud
• Oracle Enterprise Performance Reporting Cloud
• Oracle Strategic Workforce Planning Cloud
What are the ways I can connect to other EPM Cloud subscriptions?
• Toggle between the source subscription and the target subscription on the
Navigator menu. See Navigating Across EPM Cloud Subscriptions.
• Customize navigation flows in the source subscription to access clusters, cards,and artifacts in other target subscriptions from the Home page. See CustomizingNavigation Flows to Access Other EPM Cloud Subscriptions.
Considerations
• Only Service Administrators create cross-subscription connections.
Users click a navigation link to open the linked subscription. Access within thelinked subscription is determined by the predefined role and access permissions, ifany, assigned to the user.
• For cross-subscription navigation to be seamless, all subscription instances towhich cross-subscription navigation flows are setup must belong to the sameidentity domain.
Note:
If the target and source subscription instances are not on the sameidentity domain, then you'll not be able to establish a connection betweenthem.
• Service Administrators cannot configure cross-subscription connections usingcorporate SSO (identity provider) credentials.
If your subscriptions are configured for SSO, ensure that identity domaincredentials are maintained for the Service Administrators who configure cross-subscription connections. See Enabling Sign In With Identity Domain Credentials.
• Migrating cross-subscription connections between test and productionenvironments can cause issues in certain use case scenarios. For moreinformation, see Considerations When Migrating Cross-Subscription Connections.
Chapter 6About Connecting EPM Cloud Subscriptions
6-2
Considerations When Migrating Cross-SubscriptionConnections
Oracle recognizes that it's common practice for administrators to try out new features,such as connecting subscriptions, on test environments and then migrate to productionenvironments. However, in doing so, it could cause some issues after migration. We'lldescribe some use case scenarios that you need to be aware of.
In the following scenarios, assume you have subscriptions for Oracle FinancialConsolidation and Close Cloud and Oracle Enterprise Planning and Budgeting Cloud.
Use Case Scenario 1: Test to Production
In this scenario, the administrator has defined a connection between the OracleEnterprise Planning and Budgeting Cloud test instance and the Oracle FinancialConsolidation and Close Cloud test instance. The administrator then uses thisconnection to build a navigation flow in the Oracle Enterprise Planning and BudgetingCloud test environment that refers to a card in the Oracle Financial Consolidation andClose Cloud test environment. If the administrator chooses to export all artifacts in thetest environment, the export will include connections and navigation flows, includingthe connection to the Oracle Financial Consolidation and Close Cloud test instance.
When the administrator imports this snapshot into the Oracle Enterprise Planning andBudgeting Cloud production environment, they will have an undesirable connection tothe Oracle Financial Consolidation and Close Cloud test instance from the OracleEnterprise Planning and Budgeting Cloud production environment.
When migrating connections from test environments to production environments, it'simportant to ensure that any connections that were defined in the test environment arechanged to point to the corresponding production instances.
Use Case Scenario 2: Production to Production or Test to Test
This scenario doesn't have any caveats.
Use Case Scenario 3: Production to Test
In this scenario, the administrator might be trying to replicate an issue on a testinstance. In this case it's important that the administrator remember to change anyconnections that point to a production instance to a test instance. Connections thatpoint to a production instance from a test environment could inadvertently tamper withproduction.
Creating, Editing, and Deleting Connections to Other EPMCloud Subscriptions
Before you can create connections to other EPM Cloud subscriptions, you mustensure you have access to the source and target subscriptions you're connecting. Youmust also have URLs for the other subscriptions you're connecting and login details foreach subscription such as user ID (Service Administrator) and password.
To create, edit, and delete connections:
Chapter 6Considerations When Migrating Cross-Subscription Connections
6-3
1. Login to the source subscription.
2. From the Home page, click Tools, and then click Connections.
3. Choose an action:
• To add a connection:
a. On the Manage Connections page, click , and then select AddConnection.
b. Select the target subscription you want to add.
c. Enter the target subscription connection details:
– In URL, enter the URL of the target subscription instance; forexample, http(s)://your-target-host-url.com. This is the URL thatyou normally use to sign in to the target subscription instance.
– In Connection Name enter name for this navigation link; for example,Consolidation Application.
– Enter an optional description for the link.
– Use Service Administrator and Password to specify the credentialsof a Service Administrator.
Note:
These credentials are used only to define and validate thenavigation link. When a user logs in, their own role andaccess will be applied to access the target subscription.
– The Domain field is automatically populated based on the URL youenter. If there is no domain in the URL, then the Domain field is leftblank.
d. Click Validate.
e. If the validation is successful, click Save and Close.
• To edit connections:
a. On the Manage Connections page, click the name of a connection.
b. Edit connection details.
c. Click Validate.
d. If the validation is successful, click Save and Close.
• To delete a connection:
a. On the Manage Connections page next to the connection you want to
delete, click .
b. Alternatively, on the Manage Connections page, select the subscription
you want to delete, click , and then click Delete Connection.
Chapter 6Creating, Editing, and Deleting Connections to Other EPM Cloud Subscriptions
6-4
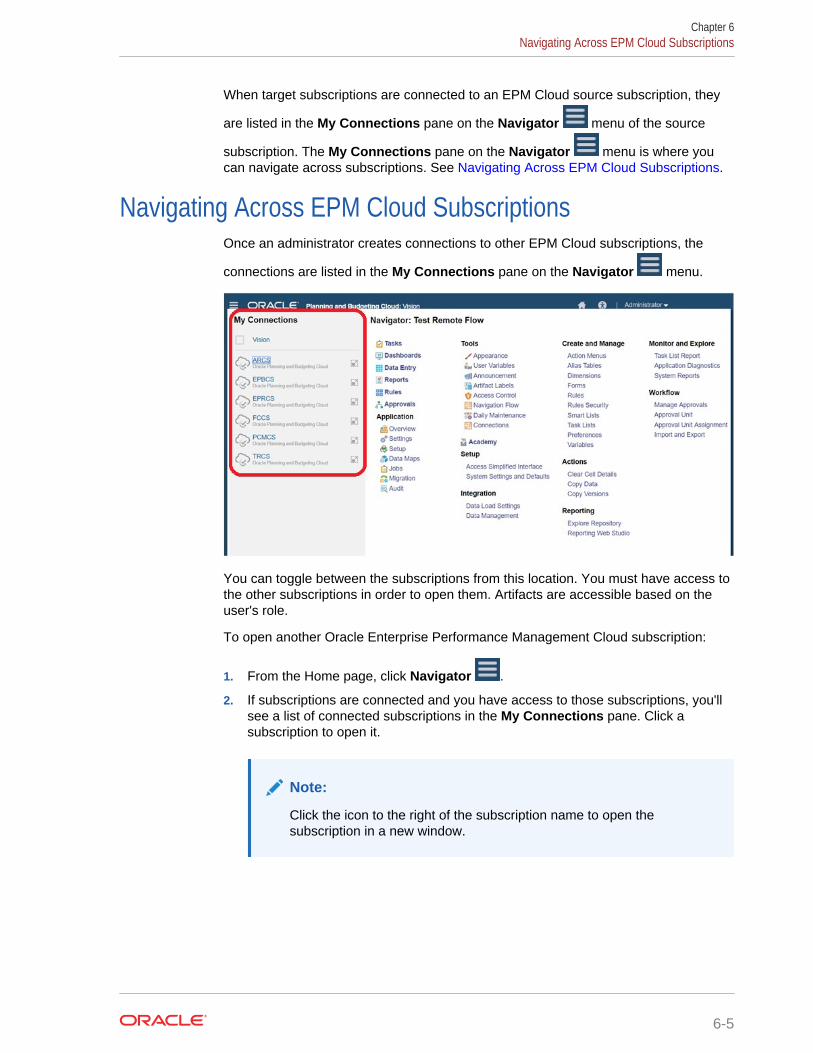
When target subscriptions are connected to an EPM Cloud source subscription, they
are listed in the My Connections pane on the Navigator menu of the source
subscription. The My Connections pane on the Navigator menu is where youcan navigate across subscriptions. See Navigating Across EPM Cloud Subscriptions.
Navigating Across EPM Cloud SubscriptionsOnce an administrator creates connections to other EPM Cloud subscriptions, the
connections are listed in the My Connections pane on the Navigator menu.
You can toggle between the subscriptions from this location. You must have access tothe other subscriptions in order to open them. Artifacts are accessible based on theuser's role.
To open another Oracle Enterprise Performance Management Cloud subscription:
1. From the Home page, click Navigator .
2. If subscriptions are connected and you have access to those subscriptions, you'llsee a list of connected subscriptions in the My Connections pane. Click asubscription to open it.
Note:
Click the icon to the right of the subscription name to open thesubscription in a new window.
Chapter 6Navigating Across EPM Cloud Subscriptions
6-5
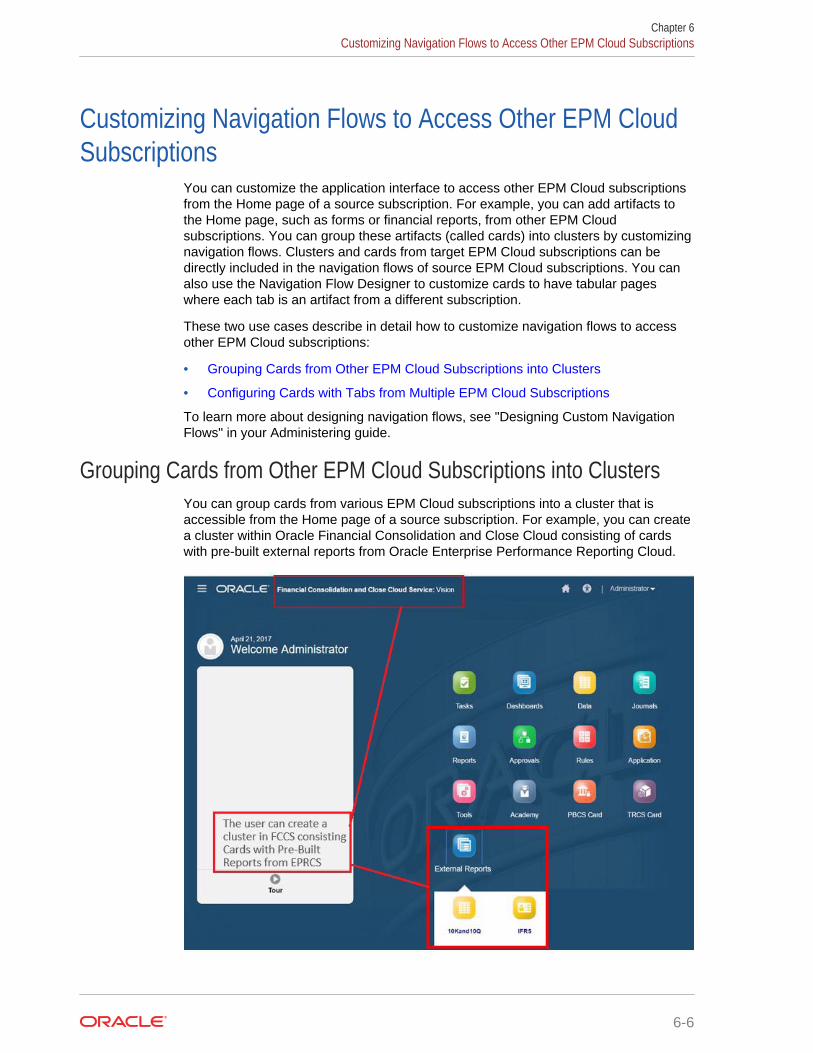
Customizing Navigation Flows to Access Other EPM CloudSubscriptions
You can customize the application interface to access other EPM Cloud subscriptionsfrom the Home page of a source subscription. For example, you can add artifacts tothe Home page, such as forms or financial reports, from other EPM Cloudsubscriptions. You can group these artifacts (called cards) into clusters by customizingnavigation flows. Clusters and cards from target EPM Cloud subscriptions can bedirectly included in the navigation flows of source EPM Cloud subscriptions. You canalso use the Navigation Flow Designer to customize cards to have tabular pageswhere each tab is an artifact from a different subscription.
These two use cases describe in detail how to customize navigation flows to accessother EPM Cloud subscriptions:
• Grouping Cards from Other EPM Cloud Subscriptions into Clusters
• Configuring Cards with Tabs from Multiple EPM Cloud Subscriptions
To learn more about designing navigation flows, see "Designing Custom NavigationFlows" in your Administering guide.
Grouping Cards from Other EPM Cloud Subscriptions into ClustersYou can group cards from various EPM Cloud subscriptions into a cluster that isaccessible from the Home page of a source subscription. For example, you can createa cluster within Oracle Financial Consolidation and Close Cloud consisting of cardswith pre-built external reports from Oracle Enterprise Performance Reporting Cloud.
Chapter 6Customizing Navigation Flows to Access Other EPM Cloud Subscriptions
6-6
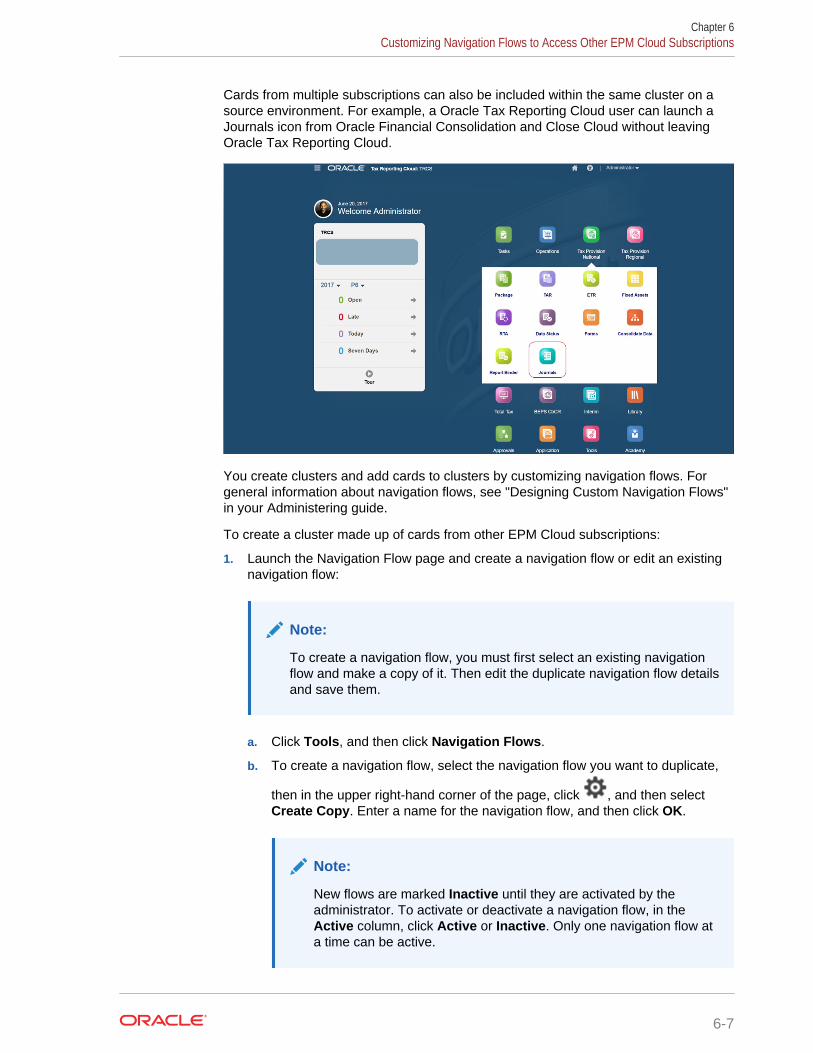
Cards from multiple subscriptions can also be included within the same cluster on asource environment. For example, a Oracle Tax Reporting Cloud user can launch aJournals icon from Oracle Financial Consolidation and Close Cloud without leavingOracle Tax Reporting Cloud.
You create clusters and add cards to clusters by customizing navigation flows. Forgeneral information about navigation flows, see "Designing Custom Navigation Flows"in your Administering guide.
To create a cluster made up of cards from other EPM Cloud subscriptions:
1. Launch the Navigation Flow page and create a navigation flow or edit an existingnavigation flow:
Note:
To create a navigation flow, you must first select an existing navigationflow and make a copy of it. Then edit the duplicate navigation flow detailsand save them.
a. Click Tools, and then click Navigation Flows.
b. To create a navigation flow, select the navigation flow you want to duplicate,
then in the upper right-hand corner of the page, click , and then selectCreate Copy. Enter a name for the navigation flow, and then click OK.
Note:
New flows are marked Inactive until they are activated by theadministrator. To activate or deactivate a navigation flow, in theActive column, click Active or Inactive. Only one navigation flow ata time can be active.
Chapter 6Customizing Navigation Flows to Access Other EPM Cloud Subscriptions
6-7
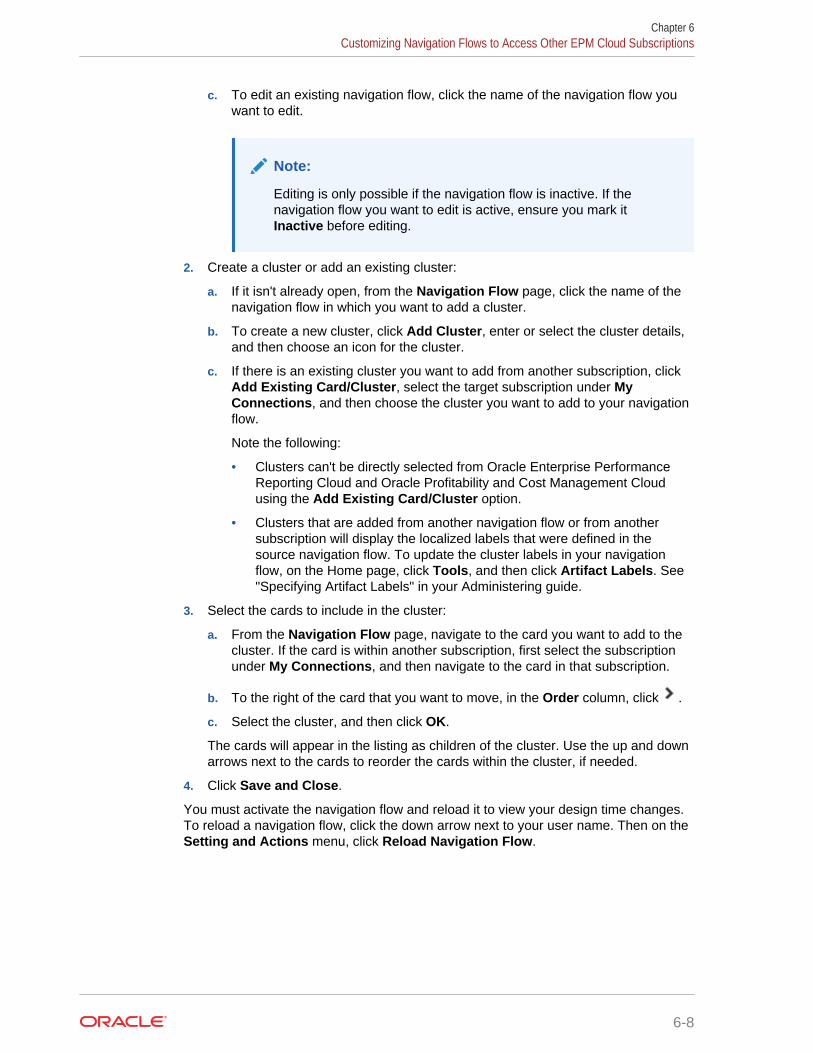
c. To edit an existing navigation flow, click the name of the navigation flow youwant to edit.
Note:
Editing is only possible if the navigation flow is inactive. If thenavigation flow you want to edit is active, ensure you mark itInactive before editing.
2. Create a cluster or add an existing cluster:
a. If it isn't already open, from the Navigation Flow page, click the name of thenavigation flow in which you want to add a cluster.
b. To create a new cluster, click Add Cluster, enter or select the cluster details,and then choose an icon for the cluster.
c. If there is an existing cluster you want to add from another subscription, clickAdd Existing Card/Cluster, select the target subscription under MyConnections, and then choose the cluster you want to add to your navigationflow.
Note the following:
• Clusters can't be directly selected from Oracle Enterprise PerformanceReporting Cloud and Oracle Profitability and Cost Management Cloudusing the Add Existing Card/Cluster option.
• Clusters that are added from another navigation flow or from anothersubscription will display the localized labels that were defined in thesource navigation flow. To update the cluster labels in your navigationflow, on the Home page, click Tools, and then click Artifact Labels. See"Specifying Artifact Labels" in your Administering guide.
3. Select the cards to include in the cluster:
a. From the Navigation Flow page, navigate to the card you want to add to thecluster. If the card is within another subscription, first select the subscriptionunder My Connections, and then navigate to the card in that subscription.
b. To the right of the card that you want to move, in the Order column, click .
c. Select the cluster, and then click OK.
The cards will appear in the listing as children of the cluster. Use the up and downarrows next to the cards to reorder the cards within the cluster, if needed.
4. Click Save and Close.
You must activate the navigation flow and reload it to view your design time changes.To reload a navigation flow, click the down arrow next to your user name. Then on theSetting and Actions menu, click Reload Navigation Flow.
Chapter 6Customizing Navigation Flows to Access Other EPM Cloud Subscriptions
6-8
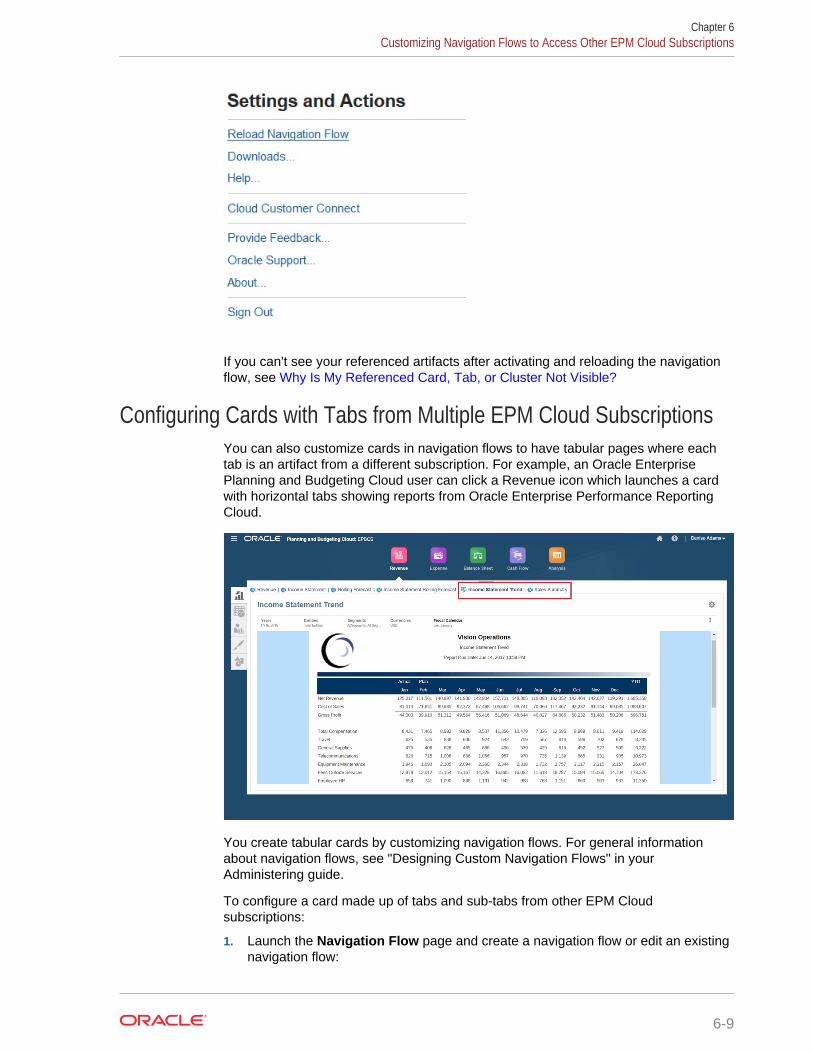
If you can't see your referenced artifacts after activating and reloading the navigationflow, see Why Is My Referenced Card, Tab, or Cluster Not Visible?
Configuring Cards with Tabs from Multiple EPM Cloud SubscriptionsYou can also customize cards in navigation flows to have tabular pages where eachtab is an artifact from a different subscription. For example, an Oracle EnterprisePlanning and Budgeting Cloud user can click a Revenue icon which launches a cardwith horizontal tabs showing reports from Oracle Enterprise Performance ReportingCloud.
You create tabular cards by customizing navigation flows. For general informationabout navigation flows, see "Designing Custom Navigation Flows" in yourAdministering guide.
To configure a card made up of tabs and sub-tabs from other EPM Cloudsubscriptions:
1. Launch the Navigation Flow page and create a navigation flow or edit an existingnavigation flow:
Chapter 6Customizing Navigation Flows to Access Other EPM Cloud Subscriptions
6-9
Note:
To create a navigation flow, you must first select an existing navigationflow and make a copy of it. Then edit the duplicate navigation flow detailsand save them.
a. Click Tools, and then click Navigation Flows.
b. To create a navigation flow, select the navigation flow you want to duplicate,
then in the upper right-hand corner of the page, click , and then selectCreate Copy. Enter a name for the navigation flow, and then click OK.
Note:
New flows are marked Inactive until they are activated by theadministrator. To activate or deactivate a navigation flow, in theActive column, click Active or Inactive. Only one navigation flow ata time can be active.
c. To edit an existing navigation flow, click the name of the navigation flow youwant to edit.
2. Add a tabular card with artifacts from various target subscriptions:
a. If there is an existing card you want to add from another subscription, from theNavigation Flow page, click Add Existing Card/Cluster, select the targetsubscription under My Connections, and then choose the card you want toadd to your navigation flow.
Note the following:
• Cards can't be directly selected from Oracle Enterprise PerformanceReporting Cloud and Oracle Profitability and Cost Management Cloudusing the Add Existing Card/Cluster option.
• Cards that are added from another navigation flow or from anothersubscription will display the localized labels that were defined in thesource navigation flow. To update the card labels in your navigation flow,on the Home page, click Tools, and then click Artifact Labels. See"Specifying Artifact Labels" in your Administering guide.
b. To add a new tabular card to the navigation flow, from the Navigation Flowpage, click Add Card, and then select details for the card:
• Name—Enter a label for the card.
• Visible—Select whether the card is visible to users on the Home page.
• Cluster—If clusters exist, select a cluster for the card or select None.
• Icon—Select the icon that will be displayed for the card you're creating.Choose from the available icons provided in the icon library.
• Content—Select from the following options:
– Page Type—Select a multiple page (tabular) format.
Chapter 6Customizing Navigation Flows to Access Other EPM Cloud Subscriptions
6-10
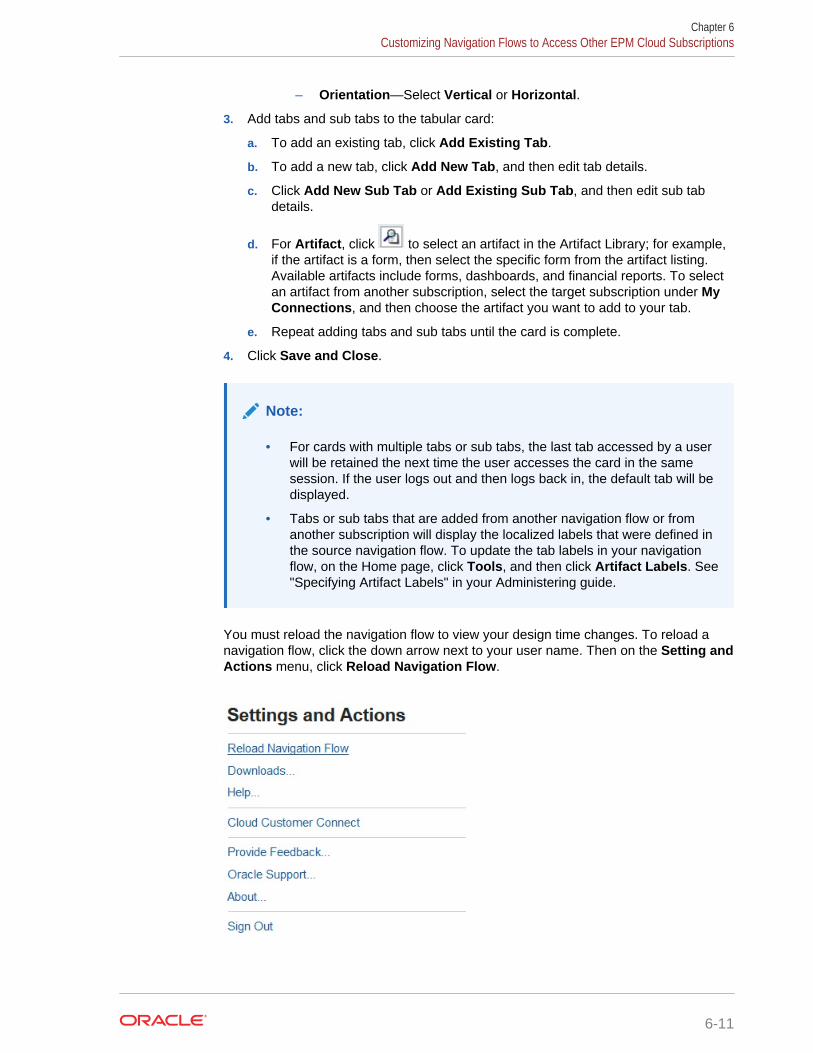
– Orientation—Select Vertical or Horizontal.
3. Add tabs and sub tabs to the tabular card:
a. To add an existing tab, click Add Existing Tab.
b. To add a new tab, click Add New Tab, and then edit tab details.
c. Click Add New Sub Tab or Add Existing Sub Tab, and then edit sub tabdetails.
d. For Artifact, click to select an artifact in the Artifact Library; for example,if the artifact is a form, then select the specific form from the artifact listing.Available artifacts include forms, dashboards, and financial reports. To selectan artifact from another subscription, select the target subscription under MyConnections, and then choose the artifact you want to add to your tab.
e. Repeat adding tabs and sub tabs until the card is complete.
4. Click Save and Close.
Note:
• For cards with multiple tabs or sub tabs, the last tab accessed by a userwill be retained the next time the user accesses the card in the samesession. If the user logs out and then logs back in, the default tab will bedisplayed.
• Tabs or sub tabs that are added from another navigation flow or fromanother subscription will display the localized labels that were defined inthe source navigation flow. To update the tab labels in your navigationflow, on the Home page, click Tools, and then click Artifact Labels. See"Specifying Artifact Labels" in your Administering guide.
You must reload the navigation flow to view your design time changes. To reload anavigation flow, click the down arrow next to your user name. Then on the Setting andActions menu, click Reload Navigation Flow.
Chapter 6Customizing Navigation Flows to Access Other EPM Cloud Subscriptions
6-11
If you can't see your referenced artifacts after reloading the navigation flow, see WhyIs My Referenced Card, Tab, or Cluster Not Visible?
Chapter 6Customizing Navigation Flows to Access Other EPM Cloud Subscriptions
6-12
7Designing Custom Navigation Flows
Customize the application interface using navigation flows. Navigation flows enabledesigners to control how roles or groups interact with the application.
Related Topics
• Understanding Navigation Flows
• Viewing and Working with Navigation Flows
Understanding Navigation FlowsNavigation flows give application designers control over how various roles, or groups,interact with the application. The Navigation Flow Designer enables you to customizethe application interface. For example, you can change the names of the cards andclusters that display on the Home page and the order in which they are displayed. Youcan hide cards, create new cards, and group cards into clusters. You can alsocustomize the vertical and horizontal tabs that display on a card.
Watch these videos to better understand navigation flows.
• Overview Video
• Tutorial Video
Related Topics:
• What Can Be Customized in the Application Interface?
• Navigation Flow Customization Categories
• Navigation Flow Permissions
• Predefined Navigation Flows
• Viewing and Working with Navigation Flows
What Can Be Customized in the Application Interface?• Labels for cards or tabs
• Icons that are used for cards or tabs
• Hide and unhide cards and tabs
• Display order of cards and tabs
• Add new cards
• Add existing cards
• Add new horizontal or vertical tabs
7-1
• Remove navigation flows, cards, and tabs
• Group cards into clusters
• Add existing clusters
See Viewing and Working with Navigation Flows.
Navigation Flow Customization CategoriesNavigation flows are categorized as follows for customization:
1. Global—Navigation flows are seen by all users
2. Role—Navigation flows are seen only by users in a specific role; for example,Planner or Interactive User
3. Group—Navigation flows are seen only by users belonging to a specific group
Navigation flows can be defined at any of these levels. In cases where navigationflows exist at multiple levels, updates are applied in the order of highest (global) tolowest (groups).
For example, if you create a navigation flow that displays an icon on the Home pagenamed "My Tasks", and then another administrator duplicates the navigation flow,makes the following changes to the card, and then associates the navigation flow witha group:
• At the global level, they rename "My Tasks" to "Company Tasks"
• At the group level, for a group named Sales, they rename "My Tasks" to "SalesTasks"
Users who belong to the group called Sales will see the label "Sales Tasks" in thenavigation flow instead of "My Tasks," and all other users will see the label "CompanyTasks".
Navigation Flow PermissionsThe application offers three levels of permissions for navigation flows:
• Role-based—Permissions are granted to users or groups assigned to a specificrole; for example, a Planner will see different cards displayed on the Home pagethan an Administrator
• Artifact-based—Permissions are granted to users or groups who can see certainartifacts; for example, a Planner will see only the forms to which they have beenassigned permission
• Global—Permissions are granted to all users
Predefined Navigation FlowsThe application comes with one predefined navigation flow, called Default. The Defaultnavigation flow is read only; therefore, you can't make any modifications to it.
These are the operations you can and cannot perform on the Default navigation flow:
• Name—You can't modify the name.
• Delete—You can't delete the navigation flow.
Chapter 7Understanding Navigation Flows
7-2
• Edit—You can view the navigation flow details, but you can't change anything.
• Activate or Deactivate—You can activate or deactivate the navigation flow.
• Duplicate—You can make a copy of the navigation flow.
Viewing and Working with Navigation FlowsAdministrators can view a list of navigation flows, including the predefined navigationflow, within the Navigation Flow page.
The Navigation Flow page lists each navigation flow by name, indicates the role or thegroup that has access to the navigation flow (if assigned), and provides a descriptionof the navigation flow (if provided). The listing also indicates whether the navigationflow is active or not.
To view the navigation flow:
1. Click Tools, and then click Navigation Flows.
2. To work with a navigation flow, perform an action:
• To create and duplicate navigation flows, see Creating and DuplicatingNavigation Flows.
• To edit a navigation flow, see Editing a Navigation Flow.
• To activate or deactivate a navigation flow, see Activating and DeactivatingNavigation Flows.
• To rename cards and tabs, see Customizing Labels for Cards, Tabs, andClusters.
• To customize the graphics used for cards and tabs, see Customizing Icons forCards and Vertical Tabs.
• To hide and unhide cards and tabs, see Hiding and Unhiding Cards and Tabs.
• To change the display order of cards on the Home page, see Changing theDisplay Order of Cards on the Home Page.
• To add cards, see Adding Cards.
• To add tabs, see Adding Tabs to a Tabular Page.
• To remove navigation flows, cards, and tabs, see Removing Navigation Flows,Cards, and Tabs.
• To group cards into clusters, see Grouping Cards into Clusters.
• To see why remote artifacts might not be visible, see Why Is My ReferencedCard, Tab, or Cluster Not Visible?.
Creating and Duplicating Navigation FlowsTo create a navigation flow, you must first select an existing navigation flow and makea copy of it. Then edit the duplicate navigation flow details and save them.
To create and duplicate a navigation flow:
1. Open the Navigation Flow page. See Viewing and Working with NavigationFlows.
Chapter 7Viewing and Working with Navigation Flows
7-3
2. Select the navigation flow you want to copy, then in the upper right-hand corner of
the page, click , and then select Create Copy.
3. Enter a name for the navigation flow, and then click OK.
4. Edit details for the navigation flow. See Editing a Navigation Flow.
Note:
New flows are marked Inactive until they are activated by theadministrator. To activate a navigation flow, see Activating andDeactivating Navigation Flows.
To reload a navigation flow to view design time changes, see Reloading a NavigationFlow.
Editing a Navigation FlowTo edit a navigation flow:
1. Open the Navigation Flow page. See Viewing and Working with NavigationFlows.
2. Click the name of the navigation flow you want to edit.
Note:
The predefined navigation flow isn't editable. However, you can create acopy of a predefined navigation flow and edit the copy. See PredefinedNavigation Flows.
3. Edit details of the navigation flow:
• Name—The name is editable if the navigation flow isn't a predefinednavigation flow.
• Assign To—Click to assign the navigation flow to a group of users or to arole.
• Visible—Indicates whether a card in the navigation flow is visible on the Homepage to the users in the group.
• Order—The cards within the navigation flow are listed in the order in whichthey are displayed on the Home page, if visible. Selecting an up or down arrowoption repositions the cards in the listing and changes the display order of thecards on the Home page. Selecting the right arrow moves a card into a cluster.
• Remove—Removes a card or cluster from the navigation flow.
• Add Card—Adds a new card to the navigation flow. See Adding Cards.
• Add Cluster—Adds a new cluster to the navigation flow. See Grouping Cardsinto Clusters.
Chapter 7Viewing and Working with Navigation Flows
7-4
• Add Existing Card/Cluster—Adds an existing card or cluster to thenavigation flow.
To reload a navigation flow to view design time changes, see Reloading a NavigationFlow.
Activating and Deactivating Navigation FlowsYou can create multiple navigation flows for each category (global, role, or group), butonly one navigation flow can be active in each category. Whenever you make anavigation flow active, the other navigation flows in the same category will becomeinactive.
Note:
The application requires one active global navigation flow. To make adifferent global navigation flow active, select another global navigation flowand activate it.
For information about categories, see Navigation Flow Customization Categories.
These are the operations users can and cannot perform on an active navigation flow:
• Name—Users can't modify the name.
• Delete—Users can't delete the navigation flow.
• Edit:
– Users can view the navigation flow definition, but they can't change anything.
– If the application is in administration mode, then users can save anymodifications.
• Activate or Deactivate—Users can activate or deactivate a navigation flow.
• Duplicate—Users can make a copy of a navigation flow.
To activate or deactivate a navigation flow:
1. Open the Navigation Flow page. See Viewing and Working with NavigationFlows.
2. In the Active column, click Active or Inactive. An active flow will be markedinactive. Conversely, an inactive flow will be marked active.
Customizing Labels for Cards, Tabs, and ClustersYou can customize the labels for cards (the icons that display on the Home page),tabs, and clusters. Labels are limited to 25 characters or less. For vertical tabs, thereis no character limitation since the label for vertical tabs displays as hover text.
To customize labels for cards, tabs, and clusters:
1. Open the Navigation Flow page and click the name of the navigation flow youwant to edit. See Viewing and Working with Navigation Flows.
2. If customizing the label for a card or cluster:
Chapter 7Viewing and Working with Navigation Flows
7-5
a. Click the name of the card or cluster you want to edit.
b. Enter a new name and save it.
Note:
You can edit the label here. However, if the label is defined in theArtifact Labels page on the Tools cluster, that definition will takeprecedence and will display during runtime. To change a labelpermanently, redefine it in the Artifact Labels page. See "SpecifyingArtifact Labels" in your Administering guide.
3. If customizing the label for a tab:
a. Click the name of the card you want to edit.
b. In the tab listing on the Manage Tab page, click the name of the tab you wantto edit.
c. Enter a new name for the tab and save it.
To reload a navigation flow to view design time changes, see Reloading a NavigationFlow.
Customizing Icons for Cards and Vertical TabsYou can change the icons used for cards and vertical tabs. You must pick from theavailable icons provided in the icon library.
To customize the icons for cards and vertical tabs:
1. Open the Navigation Flow page and click the name of the navigation flow youwant to edit. See Viewing and Working with Navigation Flows.
2. If customizing the icon for a card:
a. Click the name of the card you want to edit.
b. Click the icon for the card, select a new icon from the library, and then save it.
3. If customizing the icon for a tab:
a. Click the name of the icon you want to edit.
b. In the tab listing on the Manage Tab page, click the name of the tab you wantto edit.
c. Click the icon for the tab, select a new icon from the library, and then save it.
To reload a navigation flow to view design time changes, see Reloading a NavigationFlow.
Hiding and Unhiding Cards and TabsYou can't hide the following navigation elements:
• The Application cluster and the Settings icon in the Application cluster.
• The Tools cluster and these icons in the Tools cluster:
– User Variables
Chapter 7Viewing and Working with Navigation Flows
7-6
– Access Control
– Navigation Flows
– Daily Maintenance
– Migration
To hide and unhide cards and tabs:
1. Click the Navigation Flow icon and click the name of the navigation flow you wantto edit. See Viewing and Working with Navigation Flows.
2. If hiding or unhiding a card:
a. Click the name of the card you want to edit.
b. Set Visible to Yes or No.
3. If hiding or unhiding a tab:
a. Click the name of the card you want to edit.
b. In the tab listing on the Manage Tab page, click the name of the tab you wantto edit.
c. Set Visible to Yes or No.
To reload a navigation flow to view design time changes, see Reloading a NavigationFlow.
Changing the Display Order of Cards on the Home PageYou can change the display order of cards in the Navigation Flow Designer. Cardsdisplay on the Home page in the order they appear within the listing
To change the display order of the cards on the Home page:
1. Open the Navigation Flow page. See Viewing and Working with NavigationFlows.
2. In the listing, use the up and down arrows in the Order column to move cards upor down in the navigation flow order.
To reload a navigation flow to view design time changes, see Reloading a NavigationFlow.
Adding CardsThe icons you see on the application Home page are called cards. Cards are specificto each functional area of the application. Each card navigates users to thecorresponding area, where other information is displayed as one or more tabbedpages. You can create single page or multiple page (tabular) cards.
You can also group cards into clusters. See Grouping Cards into Clusters.
To add cards to a navigation flow:
1. Open the Navigation Flow page and click the name of the navigation flow youwant to edit. See Viewing and Working with Navigation Flows.
2. To add an existing card to the navigation flow, click , click Add Existing Card/Cluster, and then select a card. If there is an existing card you want to add from
Chapter 7Viewing and Working with Navigation Flows
7-7
another subscription, click , click Add Existing Card/Cluster, select the targetsubscription under My Connections, and then choose the card you want to add toyour navigation flow.
Note the following:
• Cards can't be directly selected from Oracle Enterprise PerformanceReporting Cloud and Oracle Profitability and Cost Management Cloud usingthe Add Existing Card/Cluster option.
• Cards that are added from another navigation flow or from anothersubscription will display the localized labels that were defined in the sourcenavigation flow. To update the card labels in your navigation flow, on theHome page, click Tools, and then click Artifact Labels. See "SpecifyingArtifact Labels" in your Administering guide.
3. To add a new card to the navigation flow, click , click Add Card, and thenselect details for the new card:
• Name—Enter a label for the card.
• Visible—Select whether the card is visible to users on the Home page.
• Cluster—If clusters exist, select a cluster for the card or select None.
• Icon—Select the graphic that will be displayed for the card you're creating.Choose from the available graphics provided in the graphics library.
• Content—Select from the following options:
– Page Type—Select a single page or a multiple page (tabular) format.
– Artifact—Click to select an artifact in the Artifact Library; forexample, if the artifact is a form, then select the specific form from theartifact listing. Available artifacts include simple forms, dashboards, andfinancial reports. To select an artifact from another subscription, select thetarget subscription under My Connections, and then choose the artifactyou want to add.
Note:
Composite forms are not supported in navigation flows. Oraclerecommends that you create a dashboard instead.
– Orientation—For a card with a tabular page format, select Vertical orHorizontal.
• For a page with a tabular format, add new or existing tabs and sub tabs. See Adding Tabs to a Tabular Page.
4. Click Save and Close.
To reload a navigation flow to view design time changes, see Reloading a NavigationFlow.
Chapter 7Viewing and Working with Navigation Flows
7-8
Adding Tabs to a Tabular PageTabs can be horizontal or vertical. For example, the Valid Intersections card (underthe Application cluster) is a tabular page with two horizontal tabs at the top of thepage: Setup and Reports.
You can also create tabular pages with vertical tabs. Vertical tabs display a graphicand text appears when the cursor is hovered over the tab. Horizontal tabs display textlabels only.
To add tabs to a tabular page:
1. Open the Navigation Flow page and click the name of the navigation flow youwant to edit. See Viewing and Working with Navigation Flows.
2. Add a new card by clicking Add Card or edit an existing card by clicking the nameof the card you want to edit.
3. On the Manage Card page, for Page Type, select Tabular Page.
A tab listing displays at the bottom of the Manage Card page.
4. To edit an existing tab, click a tab name from the tab listing, and edit tab details.
5. To add a new or existing tab:
a. To add an existing tab, click Add Existing Tab.
b. To add a new tab, click Add New Tab, and then edit tab details.
c. For Artifact, click to select an artifact in the Artifact Library; for example,if the artifact is a form, then select the specific form from the artifact listing.Available artifacts include simple forms, dashboards, and financial reports. Toselect an artifact from another subscription, select the target subscriptionunder My Connections, and then choose the artifact you want to add.
6. To add new or existing sub tabs to a tab:
a. Click the name of a tab in the in the tab listing.
b. For Page Type, select Tabular Page.
c. Click Add New Sub Tab or Add Existing Sub Tab, and then edit sub tabdetails.
d. For Artifact, click to select an artifact in the Artifact Library; for example,if the artifact is a form, then select the specific form from the artifact listing.Available artifacts include simple forms, dashboards, and financial reports. Toselect an artifact from another subscription, select the target subscriptionunder My Connections, and then choose the artifact you want to add.
7. Click Save and Close.
To reload a navigation flow to view design time changes, see Reloading a NavigationFlow.
Chapter 7Viewing and Working with Navigation Flows
7-9
Note:
• For cards with multiple tabs or sub tabs, the last tab accessed by a userwill be retained the next time the user accesses the card in the samesession. If the user logs out and then logs back in, the default tab will bedisplayed.
• Tabs or sub tabs that are added from another navigation flow or fromanother subscription will display the localized labels that were defined inthe source navigation flow. To update the tab labels in your navigationflow, on the Home page, click Tools, and then click Artifact Labels. See"Specifying Artifact Labels" in your Administering guide.
Removing Navigation Flows, Cards, and TabsYou can't remove the following navigation elements:
• The Application cluster and the Settings icon in the Application cluster.
• The Tools cluster and these icons in the Tools cluster:
– User Variables
– Access Control
– Navigation Flows
– Daily Maintenance
– Migration
To remove navigation flows, cards, and tabs:
1. Open the Navigation Flow page. See Viewing and Working with NavigationFlows.
2. If removing a navigation flow:
a. Select the navigation flow you want to remove.
b. In the upper right-hand corner of the page, click , and then select Delete.
Note:
You can't delete the predefined navigation flow, called Default.
3. If removing a card:
a. Click the name of the navigation flow you want to edit.
b. In the Remove column for the card you want to remove, click .
4. If removing a tab:
a. Click the name of the navigation flow you want to edit.
b. Click the name of the card you want to edit.
Chapter 7Viewing and Working with Navigation Flows
7-10
c. In the tab listing at the bottom of the Manage Tab page, in the Remove
column for the tab you want to remove, click .
To reload a navigation flow to view design time changes, see Reloading a NavigationFlow.
Grouping Cards into ClustersA cluster is a grouping of cards. You must first create a cluster and then you canassign cards to it. You can also add existing clusters to navigation flows.
To group cards into clusters:
1. Create a new cluster or add an existing cluster:
a. Open the Navigation Flow page and click the name of the navigation flow inwhich you want to add a cluster. See Viewing and Working with NavigationFlows.
b. To create a new cluster, click , click Add Cluster, enter or select thecluster details, and then choose a graphic for the cluster.
c. To add an existing cluster, click , click Add Existing Card/Cluster. If there
is an existing cluster you want to add from another subscription, click , clickAdd Existing Card/Cluster, select the target subscription under MyConnections, and then choose the cluster you want to add to your navigationflow.
Note the following:
• Clusters can't be directly selected from Oracle Enterprise PerformanceReporting Cloud and Oracle Profitability and Cost Management Cloudusing the Add Existing Card/Cluster option.
• Clusters that are added from another navigation flow or from anothersubscription will display the localized labels that were defined in thesource navigation flow. To update the cluster labels in your navigationflow, on the Home page, click Tools, and then click Artifact Labels. See"Specifying Artifact Labels" in your Administering guide.
d. Click Save and Close.
The newly added cluster displays in the listing.
2. Select the cards to include in the cluster:
a. To the right of each card that you want to move, in the Order column, click .
b. Select the cluster, and then click OK.
The cards will appear in the listing as children of the cluster. Use the up and downarrows next to the cards to reorder the cards within the cluster, if needed.
To reload a navigation flow to view design time changes, see Reloading a NavigationFlow.
Chapter 7Viewing and Working with Navigation Flows
7-11
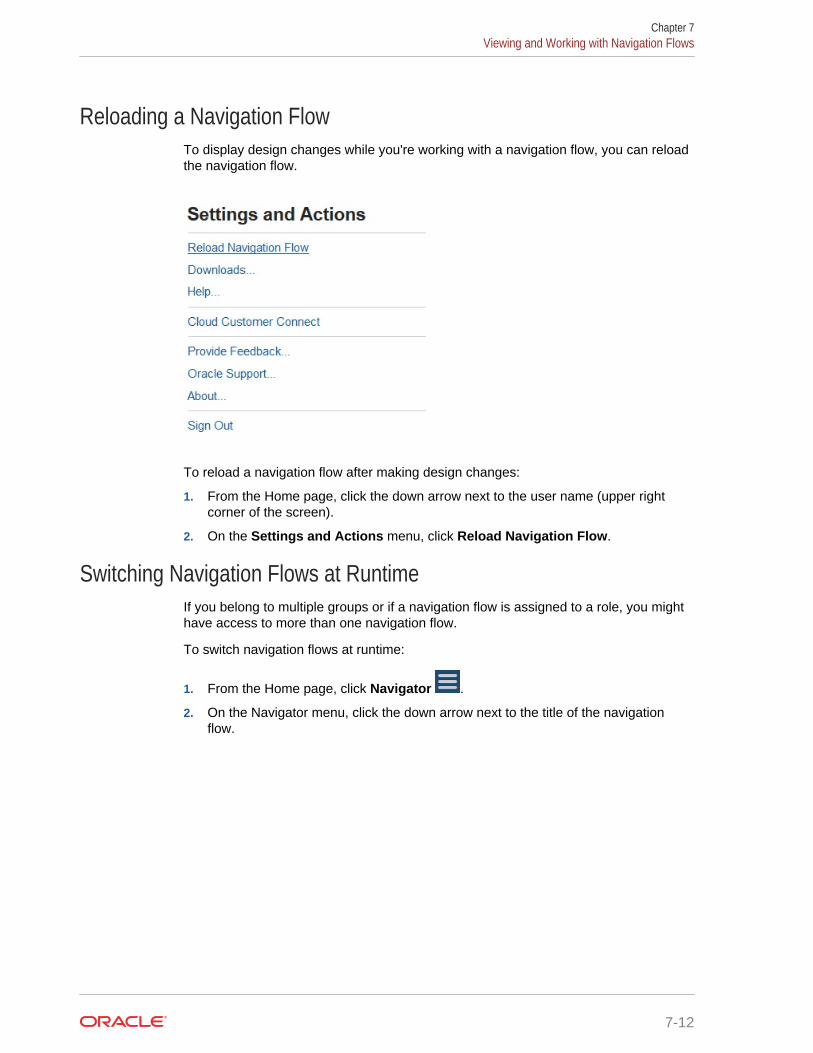
Reloading a Navigation FlowTo display design changes while you're working with a navigation flow, you can reloadthe navigation flow.
To reload a navigation flow after making design changes:
1. From the Home page, click the down arrow next to the user name (upper rightcorner of the screen).
2. On the Settings and Actions menu, click Reload Navigation Flow.
Switching Navigation Flows at RuntimeIf you belong to multiple groups or if a navigation flow is assigned to a role, you mighthave access to more than one navigation flow.
To switch navigation flows at runtime:
1. From the Home page, click Navigator .
2. On the Navigator menu, click the down arrow next to the title of the navigationflow.
Chapter 7Viewing and Working with Navigation Flows
7-12
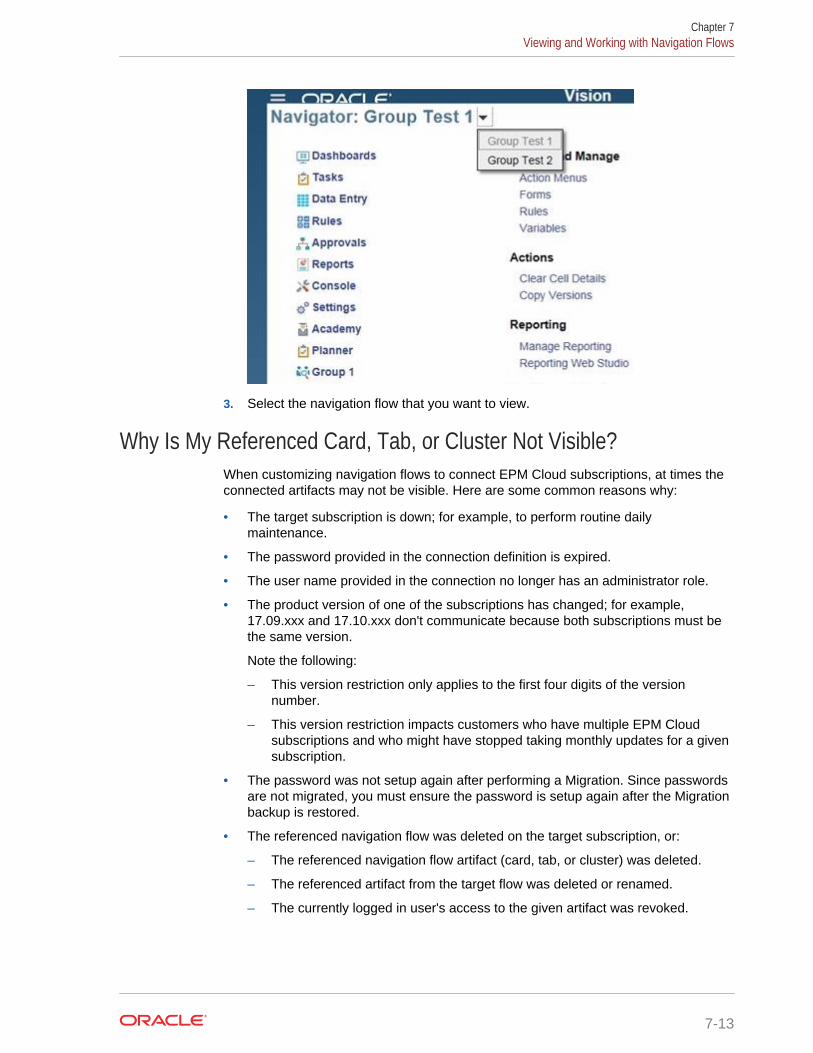
3. Select the navigation flow that you want to view.
Why Is My Referenced Card, Tab, or Cluster Not Visible?When customizing navigation flows to connect EPM Cloud subscriptions, at times theconnected artifacts may not be visible. Here are some common reasons why:
• The target subscription is down; for example, to perform routine dailymaintenance.
• The password provided in the connection definition is expired.
• The user name provided in the connection no longer has an administrator role.
• The product version of one of the subscriptions has changed; for example,17.09.xxx and 17.10.xxx don't communicate because both subscriptions must bethe same version.
Note the following:
– This version restriction only applies to the first four digits of the versionnumber.
– This version restriction impacts customers who have multiple EPM Cloudsubscriptions and who might have stopped taking monthly updates for a givensubscription.
• The password was not setup again after performing a Migration. Since passwordsare not migrated, you must ensure the password is setup again after the Migrationbackup is restored.
• The referenced navigation flow was deleted on the target subscription, or:
– The referenced navigation flow artifact (card, tab, or cluster) was deleted.
– The referenced artifact from the target flow was deleted or renamed.
– The currently logged in user's access to the given artifact was revoked.
Chapter 7Viewing and Working with Navigation Flows
7-13
8Editing Dimensions in the SimplifiedDimension Editor
Related Topics
• About Editing Dimensions in the Simplified Dimension EditorWork with application dimensions and members in the simplified grid interface.
• Dimension Overview
• Accessing the Simplified Dimension Editor
• Working with the Simplified Dimension Editor Grid
• Editing Dimension Properties in the Simplified Dimension Editor
• Editing Member Properties in the Simplified Dimension Editor
• Setting Up Scenarios and Specifying Versions
About Editing Dimensions in the Simplified Dimension EditorWork with application dimensions and members in the simplified grid interface.
The Simplified dimension editor displays dimensions and members in a grid format.With the grid format, dimensions and members are editable on a single page. You canedit member properties directly on the grid and you can perform ad hoc operationssuch as zooming in, zooming out, keep selected, remove selected, and freeze.
Watch this overview video for an introduction to the Simplified dimension editor.
Overview Video
Related topics:
• Creating Dimensions
• Dimension Overview
• Accessing the Simplified Dimension Editor
• Working with the Simplified Dimension Editor Grid
• Editing Dimension Properties in the Simplified Dimension Editor
• Editing Member Properties in the Simplified Dimension Editor
Dimension OverviewRelated Topics
• About Dimensions and Members
• About Sparse and Dense Dimensions
8-1
• About Dimension Hierarchies
• About Custom Dimensions
• About Entities
• About Accounts
• Accounts, Entities, Periods, and Cubes
About Dimensions and MembersDimensions categorize data values. Seven dimensions are included with theapplication: Account, Entity, Scenario, Version, Period, Years, and Currency. You cancreate up to 13 user-defined custom dimensions.
Members are components of dimensions.
About Sparse and Dense DimensionsSparse dimensions lack data values for the majority of member combinations. Densedimensions have data values for the majority of member combinations. At least onedense dimension is required. Custom attributes can't be assigned to densedimensions. The application designates the Account and Period dimensions as dense,and the remaining dimensions as sparse. To optimize performance for sparsedimensions, the application searches for and calculates only occupied data values ineach dimension combination, reducing calculation time and disk usage. You canmodify these settings.
About Dimension HierarchiesDimension hierarchies define structural and mathematical relationships, andconsolidations between members in the application. Relationships are representedgraphically in a collapsible hierarchy diagram. The levels below the cube name aredimensions, and the levels below each dimension are members.
The Period dimension can contain the member YearTotal, which contains membersQ1, Q2, Q3, and Q4. Members Q1, Q2, Q3, and Q4 contain their own members for thecorresponding months in the year. To consolidate data values in the Period dimension,roll up monthly data values to get quarterly data values, and quarterly data values toget yearly data values.
Members of the same level that belong to the same dimension or member are calledsiblings. For example, Q1, Q2, Q3, and Q4 are siblings because they are at the samelevel in the hierarchy, and are members of the same member, YearTotal.
The members of a dimension are called children of the dimension. Members thatbelong to a member are called children of that member. The member YearTotal is achild of Period, the members of Q1, Q2, Q3, and Q4 are children of YearTotal, andJan, Feb, and Mar are children of Q1. Q1 is the parent of Jan, Feb, and Mar,YearTotal is the parent of Q1, Q2, Q3, and Q4, and Period is the parent of YearTotal.
About Custom DimensionsThe application includes two custom dimensions: Account and Entity. You can edit thenames of these dimensions, and create up to 13 user-defined dimensions.
Chapter 8Dimension Overview
8-2
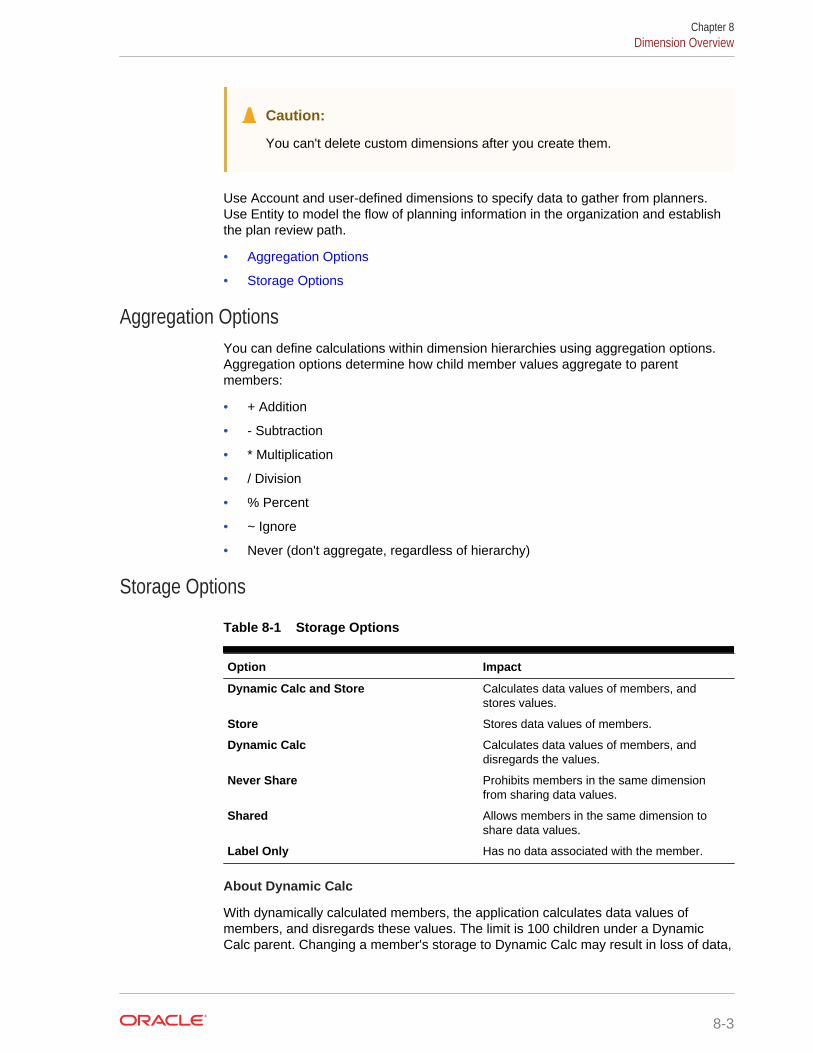
Caution:
You can't delete custom dimensions after you create them.
Use Account and user-defined dimensions to specify data to gather from planners.Use Entity to model the flow of planning information in the organization and establishthe plan review path.
• Aggregation Options
• Storage Options
Aggregation OptionsYou can define calculations within dimension hierarchies using aggregation options.Aggregation options determine how child member values aggregate to parentmembers:
• + Addition
• - Subtraction
• * Multiplication
• / Division
• % Percent
• ~ Ignore
• Never (don't aggregate, regardless of hierarchy)
Storage Options
Table 8-1 Storage Options
Option Impact
Dynamic Calc and Store Calculates data values of members, andstores values.
Store Stores data values of members.
Dynamic Calc Calculates data values of members, anddisregards the values.
Never Share Prohibits members in the same dimensionfrom sharing data values.
Shared Allows members in the same dimension toshare data values.
Label Only Has no data associated with the member.
About Dynamic Calc
With dynamically calculated members, the application calculates data values ofmembers, and disregards these values. The limit is 100 children under a DynamicCalc parent. Changing a member's storage to Dynamic Calc may result in loss of data,
Chapter 8Dimension Overview
8-3
depending on how the data was originally derived. You may need to update outlines,calculations, or both to get the dynamically calculated value.
Dynamic Calc Versus Dynamic Calc and Store
In most cases, you can optimize calculations and lower disk usage by using DynamicCalc instead of Dynamic Calc and Store when calculating members of sparsedimensions. Use Dynamic Calc and Store for members of sparse dimensions withcomplex formulas, or that users retrieve frequently.
For members of dense dimensions, use Dynamic Calc. Dynamic Calc and Storeprovides only a small decrease in retrieval time and regular calculation time, anddoesn't significantly lower disk usage. For data values accessed concurrently by manyusers, use Dynamic Calc. Retrieval time may be significantly lower than for DynamicCalc and Store.
Note:
• Don't use Dynamic Calc for base-level members for which users enterdata.
• Don't use Dynamic Calc for a parent member if you enter data for thatmember in a target version. Parent members set to Dynamic Calc areread-only in target versions.
• Data values are not saved for Dynamic Calc members.
About Store Data Storage
Don't set parent members to Store if their children are set to Dynamic Calc. With thiscombination, new totals for parents are not calculated when users save and refreshforms.
About Shared Data Storage
Use Shared to allow alternate rollup structures in the application.
About Never Share Data Storage
The default data storage type is Never Share when you add user-defined customdimensions. You can use Never Share for parent members with only one childmember that aggregates to the parent, to apply access to the child member.
About Label Only Data Storage
Label-only members are virtual members; they are typically used for navigation andhave no associated data.
Chapter 8Dimension Overview
8-4
Note:
• You can't assign level 0 members as label-only.
• Label-only members can display values.
• Making dimension members label-only minimizes database space bydecreasing block size.
• You can't assign attributes to label-only members.
• In a multicurrency application, you can't apply label-only storage tomembers of these dimensions: Entity, Versions, Currencies, and user-defined custom dimensions. To store exchange rates, use Never Share.
• Data Storage for children of label-only parents is set to Never Share bydefault.
Caution:
Don't design forms in which label-only parents follow their firstchild member, as you can't save data in the first child member.Instead, create forms with label-only parents selected beforetheir children, or don't select label-only parents for forms.
About EntitiesEntities typically match your organization’s structure, such as geographical regions,departments, or divisions. Create entity members for groups that submit plans forapproval. Entity members help define budget review, or approvals (see ManagingApprovals).
For example, you may have regional centers preparing budgets for countryheadquarters. The country headquarters may prepare plans for corporateheadquarters. To match this structure, create members for the regions, countries andheadquarters. Specify regions as children of country members, and country membersas children of headquarters.
Forms support multiple currencies per entity, enabling data entry for multiplecurrencies and reporting against one currency. However, the application supports abase entity for each entity. You can set the currency for entered values, which areconverted to other currencies having defined exchange rates.
About AccountsAccount dimension members specify the information needed from budget planners.Create an account structure that lets budget preparers input data for budget items.You can define calculations in the account structure.
• Account Types
• Saved Assumptions
Chapter 8Dimension Overview
8-5
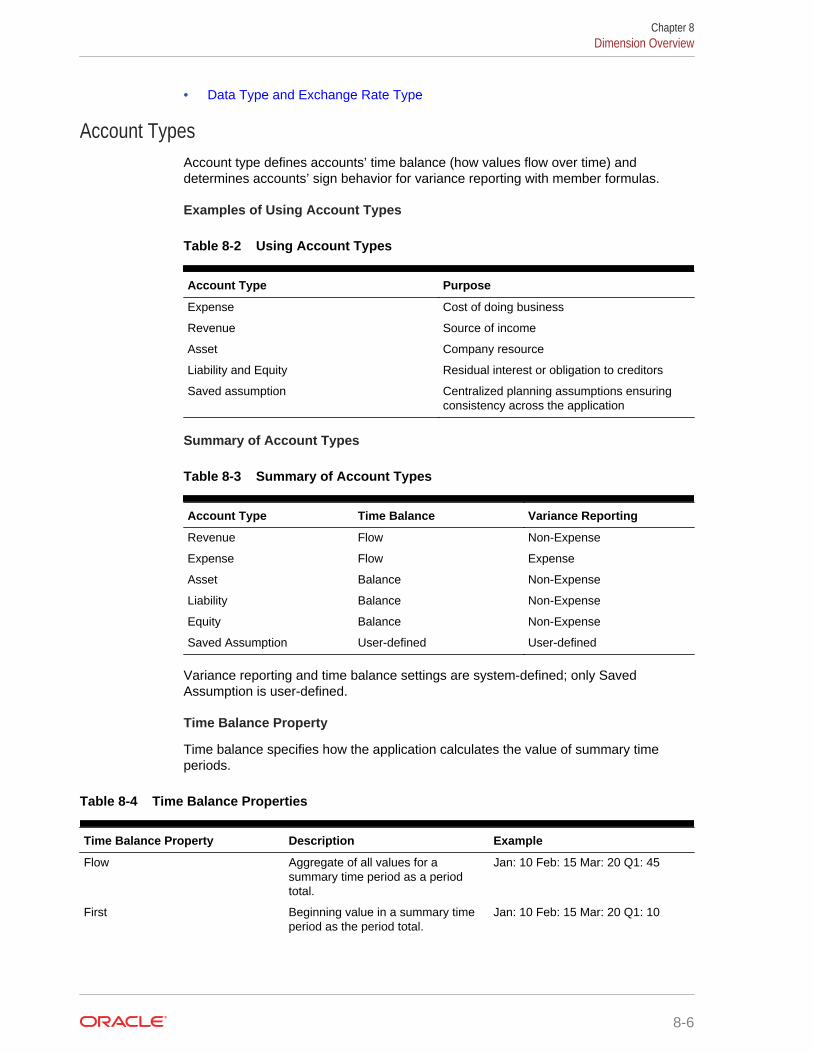
• Data Type and Exchange Rate Type
Account TypesAccount type defines accounts’ time balance (how values flow over time) anddetermines accounts’ sign behavior for variance reporting with member formulas.
Examples of Using Account Types
Table 8-2 Using Account Types
Account Type Purpose
Expense Cost of doing business
Revenue Source of income
Asset Company resource
Liability and Equity Residual interest or obligation to creditors
Saved assumption Centralized planning assumptions ensuringconsistency across the application
Summary of Account Types
Table 8-3 Summary of Account Types
Account Type Time Balance Variance Reporting
Revenue Flow Non-Expense
Expense Flow Expense
Asset Balance Non-Expense
Liability Balance Non-Expense
Equity Balance Non-Expense
Saved Assumption User-defined User-defined
Variance reporting and time balance settings are system-defined; only SavedAssumption is user-defined.
Time Balance Property
Time balance specifies how the application calculates the value of summary timeperiods.
Table 8-4 Time Balance Properties
Time Balance Property Description Example
Flow Aggregate of all values for asummary time period as a periodtotal.
Jan: 10 Feb: 15 Mar: 20 Q1: 45
First Beginning value in a summary timeperiod as the period total.
Jan: 10 Feb: 15 Mar: 20 Q1: 10
Chapter 8Dimension Overview
8-6
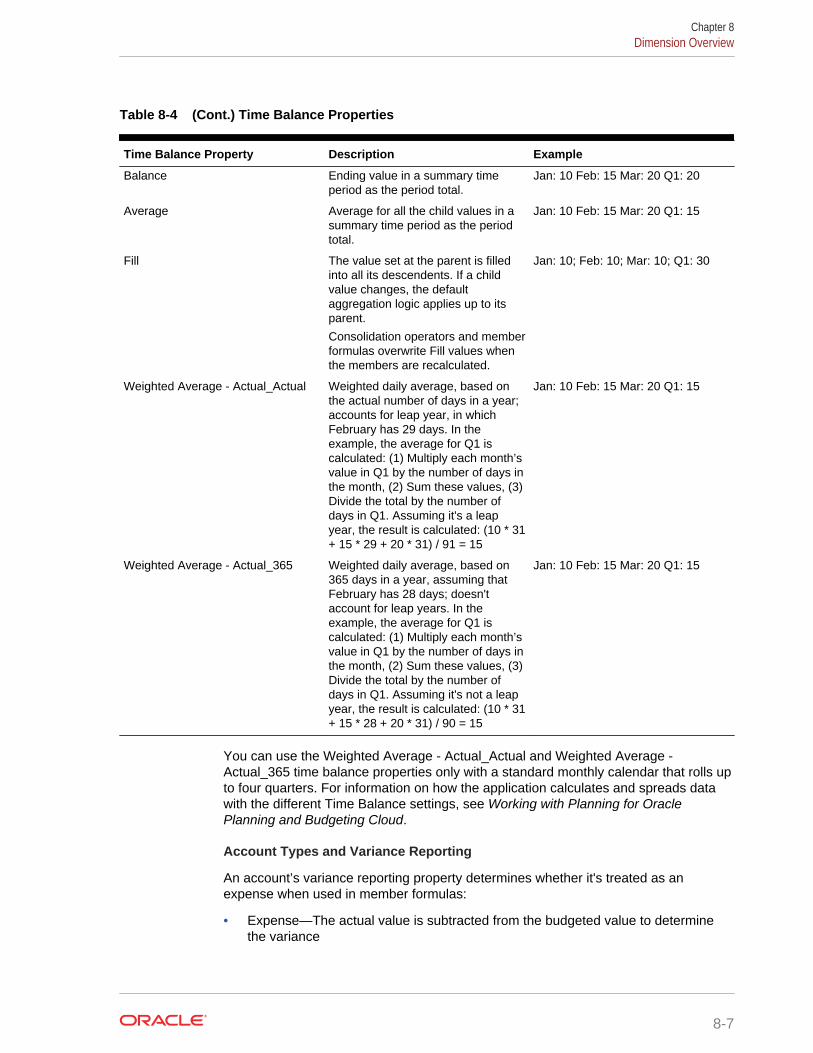
Table 8-4 (Cont.) Time Balance Properties
Time Balance Property Description Example
Balance Ending value in a summary timeperiod as the period total.
Jan: 10 Feb: 15 Mar: 20 Q1: 20
Average Average for all the child values in asummary time period as the periodtotal.
Jan: 10 Feb: 15 Mar: 20 Q1: 15
Fill The value set at the parent is filledinto all its descendents. If a childvalue changes, the defaultaggregation logic applies up to itsparent.
Consolidation operators and memberformulas overwrite Fill values whenthe members are recalculated.
Jan: 10; Feb: 10; Mar: 10; Q1: 30
Weighted Average - Actual_Actual Weighted daily average, based onthe actual number of days in a year;accounts for leap year, in whichFebruary has 29 days. In theexample, the average for Q1 iscalculated: (1) Multiply each month’svalue in Q1 by the number of days inthe month, (2) Sum these values, (3)Divide the total by the number ofdays in Q1. Assuming it's a leapyear, the result is calculated: (10 * 31+ 15 * 29 + 20 * 31) / 91 = 15
Jan: 10 Feb: 15 Mar: 20 Q1: 15
Weighted Average - Actual_365 Weighted daily average, based on365 days in a year, assuming thatFebruary has 28 days; doesn'taccount for leap years. In theexample, the average for Q1 iscalculated: (1) Multiply each month’svalue in Q1 by the number of days inthe month, (2) Sum these values, (3)Divide the total by the number ofdays in Q1. Assuming it's not a leapyear, the result is calculated: (10 * 31+ 15 * 28 + 20 * 31) / 90 = 15
Jan: 10 Feb: 15 Mar: 20 Q1: 15
You can use the Weighted Average - Actual_Actual and Weighted Average -Actual_365 time balance properties only with a standard monthly calendar that rolls upto four quarters. For information on how the application calculates and spreads datawith the different Time Balance settings, see Working with Planning for OraclePlanning and Budgeting Cloud.
Account Types and Variance Reporting
An account’s variance reporting property determines whether it's treated as anexpense when used in member formulas:
• Expense—The actual value is subtracted from the budgeted value to determinethe variance
Chapter 8Dimension Overview
8-7
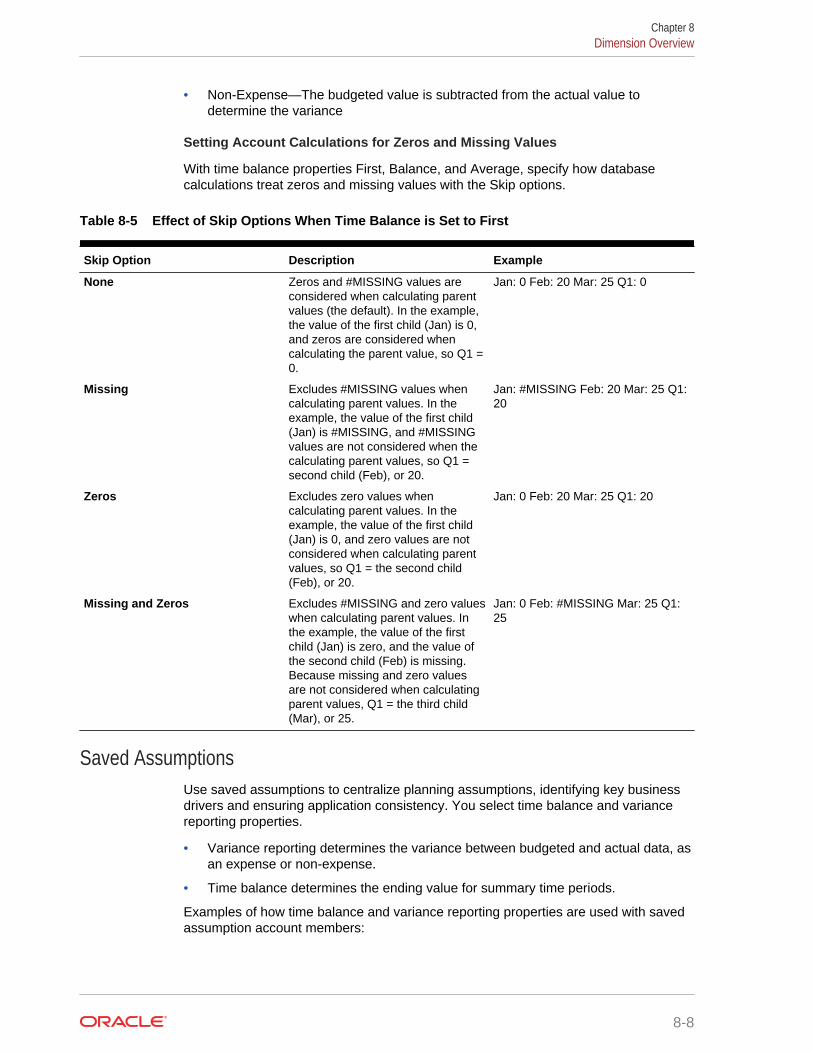
• Non-Expense—The budgeted value is subtracted from the actual value todetermine the variance
Setting Account Calculations for Zeros and Missing Values
With time balance properties First, Balance, and Average, specify how databasecalculations treat zeros and missing values with the Skip options.
Table 8-5 Effect of Skip Options When Time Balance is Set to First
Skip Option Description Example
None Zeros and #MISSING values areconsidered when calculating parentvalues (the default). In the example,the value of the first child (Jan) is 0,and zeros are considered whencalculating the parent value, so Q1 =0.
Jan: 0 Feb: 20 Mar: 25 Q1: 0
Missing Excludes #MISSING values whencalculating parent values. In theexample, the value of the first child(Jan) is #MISSING, and #MISSINGvalues are not considered when thecalculating parent values, so Q1 =second child (Feb), or 20.
Jan: #MISSING Feb: 20 Mar: 25 Q1:20
Zeros Excludes zero values whencalculating parent values. In theexample, the value of the first child(Jan) is 0, and zero values are notconsidered when calculating parentvalues, so Q1 = the second child(Feb), or 20.
Jan: 0 Feb: 20 Mar: 25 Q1: 20
Missing and Zeros Excludes #MISSING and zero valueswhen calculating parent values. Inthe example, the value of the firstchild (Jan) is zero, and the value ofthe second child (Feb) is missing.Because missing and zero valuesare not considered when calculatingparent values, Q1 = the third child(Mar), or 25.
Jan: 0 Feb: #MISSING Mar: 25 Q1:25
Saved AssumptionsUse saved assumptions to centralize planning assumptions, identifying key businessdrivers and ensuring application consistency. You select time balance and variancereporting properties.
• Variance reporting determines the variance between budgeted and actual data, asan expense or non-expense.
• Time balance determines the ending value for summary time periods.
Examples of how time balance and variance reporting properties are used with savedassumption account members:
Chapter 8Dimension Overview
8-8
• Create a saved assumption of an expense type for variance reporting, assumingthat the actual amount spent on headcount is less than the amount budgeted. Todetermine the variance, the application subtracts the actual amount from thebudgeted amount.
• Determine the value for office floor space by using the time period’s last value.
• Make an assumption about the number of product units sold at the end of the timeperiod. Determine the final value for the summary time period by aggregating thenumber of units sold across time periods.
Data Type and Exchange Rate TypeData type and exchange rate type determine how values are stored in accountmembers, and the exchange rates used to calculate values. Available data type foraccount members’ values:
• Currency—Stores and displays in the default currency.
• Non-currency—Stores and displays as a numeric value.
• Percentage—Stores a numeric value and displays as a percent.
• Date—Displays as a date.
• Text—Displays as text.
In a multiple currency application, for accounts with the Currency data type, availableExchange Rate types (valid for any time period):
• Average—Average exchange rate
• Ending—Ending exchange rate
• Historical—Exchange rate in effect when, for example, earnings for a RetainedEarnings account were earned or assets for a Fixed Assets account werepurchased.
In a Simplified multiple currency application, for accounts with the Currency data type,available Exchange Rate types (valid for any time period):
• FX Rates - Average
• FX Rates - Ending
Accounts, Entities, Periods, and CubesBy assigning cubes for Account, Entity, and Period members, you set to which cubesthe members’ children have access. For example, Total Sales Account may be validfor Revenue and P&L, but Fixed Assets Account may be valid for only Balance Sheet.Not assigning a cube to a member prevents that member’s children from accessingthat cube.
When moving members, if the new parent is valid for different cubes, members remainvalid only for cubes they have in common with the new parent. If the new parent of anaccount member has another source cube, the member’s source cube is set to the firstnew valid cube of that member.
Chapter 8Dimension Overview
8-9
Entities and Cubes
Typically, entity members prepare different plans. When defining entity members,specify cubes for which they are valid. Because forms are associated with cubes, youcan control which entity members can enter data for each cube.
Accounts and Cubes
If accounts are valid for multiple cubes, specify the source cube to determine whichcube’s database stores the account value for them.
Accessing the Simplified Dimension EditorTo access the Simplified dimension editor:
1. From the Home page, click Application, and then click Overview.
2. Click Dimensions.
3. Click the down arrow to the right of Cube to filter the list of dimensions by cube.
4. Click the name of the dimension that you want to view.
5. Select from the following tabs:
• Edit Dimension Properties—Click to view and edit dimension details. See Editing Dimension Properties in the Simplified Dimension Editor.
• Edit Member Properties—Click to view and edit dimension members. See Editing Member Properties in the Simplified Dimension Editor.
Working with the Simplified Dimension Editor GridRelated Topics
• Switching to Another Dimension
• Customizing the Column Layout
• Viewing Ancestors
• Showing Member Usage in an Application
• Focusing Your Editing
• Finding Members
• Moving Members
• Sorting Members
• Moving Members to Another Hierarchy
• Working with Member Formulas
• Copying Member Names from Microsoft Excel
Switching to Another DimensionTo switch to another dimension while viewing the Simplified dimension editor grid:
1. View Edit Member Properties.
Chapter 8Accessing the Simplified Dimension Editor
8-10
See Accessing the Simplified Dimension Editor.
2. Click the down arrow next to the dimension name at the top of the page.
Customizing the Column LayoutEach column in the Simplified dimension editor grid represents a member property(Member Name, Parent Member, Default Data Storage, and so on). The columnsthat initially display on the grid can be different based on which dimension type you'reediting. You can customize the layout of columns in the Simplified dimension editorgrid by hiding, unhiding, or resizing columns. You can also display the complete set ofproperties (all columns) by clearing the Default mode option; for example, by clearingDefault mode, you can view the UDA column for the Account dimension (the UDAcolumn is hidden in Default mode).
To customize the column layout in the Simplified dimension editor grid:
1. View Edit Member Properties.
See Accessing the Simplified Dimension Editor.
2. On the dimension grid, right-click any column heading.
A checklist of columns displays. Also displayed are column or grid resizingoptions.
3. Select or clear the check boxes for the columns you want to hide or unhide on thegrid.
Note:
To view all property columns in the grid, clear the Default mode checkbox. Default mode is selected by default, and limits the properties thatare displayed. Clearing this option displays a larger (complete) set ofproperties (as columns).
4. To change the size of the grid or the columns that are displayed on the grid, selector clear the following resizing options:
• Force fit columns—Resizes the columns so that all columns are visible onthe grid without scrolling.
• Synchronous resize—Resets the size of the grid to original settings.
Viewing AncestorsAncestors are all the members above the selected member in the dimensionhierarchy.
To view the ancestors for the selected member in the Simplified dimension editor grid:
1. View Edit Member Properties.
See Accessing the Simplified Dimension Editor.
2. Select a member on the dimension editor grid.
3. Click Show Ancestors.
Chapter 8Working with the Simplified Dimension Editor Grid
8-11
Showing Member Usage in an ApplicationBefore performing such operations as deleting members, it's important to understandwhere in the application the members are used (in which forms, approval units,exchange rates, and so on) by using Show Usage.
To view where members are used in an application using the Simplified dimensioneditor:
1. View Edit Member Properties.
See Accessing the Simplified Dimension Editor.
2. Select a member on the dimension editor grid.
3. Click Show Usage.
Focusing Your EditingUse zoom in, zoom out, keep selected, remove selected, and freeze to focus yourediting while working in the Simplified dimension editor grid.
To perform these operations while viewing the dimension editor grid:
1. View Edit Member Properties.
See Accessing the Simplified Dimension Editor.
2. To focus your editing on specific members in the grid, select a member, and thenclick one of the following zoom operations:
• Zoom In Next level—Displays all members one level below the selectedmember
• Zoom In All levels—Displays all descendant members below the selectedmember
• Zoom In Bottom level—Displays all descendant members of the selectedmember that have no children
• Zoom Out—Displays the member one level above the selected member
3. To focus your editing on specific rows or columns in the grid, select a row orcolumn, and then choose from the following operations:
• Keep Selected—Displays only the selected row or column on the grid
• Remove Selected—Removes the selected row or column from the grid
• Freeze (Columns only)—Keeps the selected column and all columns to the leftof the selected column stationary so the column or columns can't be scrolled.Only columns to the right of the frozen column can be scrolled. For example,you can freeze the first column that includes the member name so that youcan scroll and edit that member's properties and still see the member name.To unfreeze columns, click Freeze once again.
Finding MembersTo find dimension members in the Simplified dimension editor grid:
1. View Edit Member Properties for a dimension.
Chapter 8Working with the Simplified Dimension Editor Grid
8-12
See Accessing the Simplified Dimension Editor.
2. For Search, select Name, Alias, or Both.
3. Enter the search text (member name, alias, or partial string) for which to search.
4. Click Search Up or Search Down.
Moving MembersTo move members:
1. View Edit Member Properties.
See Accessing the Simplified Dimension Editor.
2. Select the member to move.
3. To move the member up one position, click . To move the member down oneposition, click .
Sorting MembersYou can sort members in ascending or descending order, by children or descendants.Sorting members affects the outline.
To sort members using the Simplified dimension editor:
1. View Edit Member Properties.
See Accessing the Simplified Dimension Editor.
2. On the dimension grid, select the members whose children or descendants youwant to sort.
3. For Sort, select Children or Descendants.
Note:
• If you do not see the Sort options at the top of the page, click .
• Sorting by children affects only members in the level immediatelybelow the selected member. Sorting by descendants affects alldescendants of the selected member.
4. Click or .
Moving Members to Another HierarchyTo move members to another hierarchy in the Simplified dimension editor:
1. View Edit Member Properties.
See Accessing the Simplified Dimension Editor.
2. In the Parent Member column of the grid, type a new parent name for the memberyou want to move.
Chapter 8Working with the Simplified Dimension Editor Grid
8-13
3. Click Save.
Working with Member FormulasYou can define or edit member formulas directly in the Simplified dimension editorgrid, in the formula bar, or in the Member Formula dialog where you can validatemember formulas.
You can define member formulas to combine operators, calculation functions,dimension and member names, and numeric constants to perform calculations onmembers. Member formulas can also include:
• Operator type, function, value, member name, UDA, and so on allowed informulas.
• Predefined formula expressions, including Smart List values, that expand into aformula or value upon database refresh.
To define or edit member formulas in the Simplified dimension editor:
1. View Edit Member Properties.
See Accessing the Simplified Dimension Editor.
2. In the Default Formula column of the grid, select the member for which you wantto define or edit a formula. Define or edit the formula for the member using one ofthe following options:
• Click the cell once more in the dimension editor grid to enter or edit theformula.
• Click within the formula bar above the dimension editor grid, and then enter oredit the formula.
• Click next to the formula bar, and then enter or edit the formula.
Tip:
To include member names in formulas, keep the focus on the formulacell in the grid. Press Ctrl while clicking the member name you want toinclude in the formula. The member name will display in the formula bar.
3. Optional: To check the validity of a member formula, click next to theformula bar, and then click Validate.
4. Click Save.
Copying Member Names from Microsoft ExcelTo copy and paste member names from Microsoft Excel:
1. In Excel, highlight the member names in one cell or in a range of cells, and pressCtrl+C to copy the data onto the clipboard.
2. Highlight and select the target cell or cells in the Simplified dimension editor, andthen press Ctrl+V.
Chapter 8Working with the Simplified Dimension Editor Grid
8-14
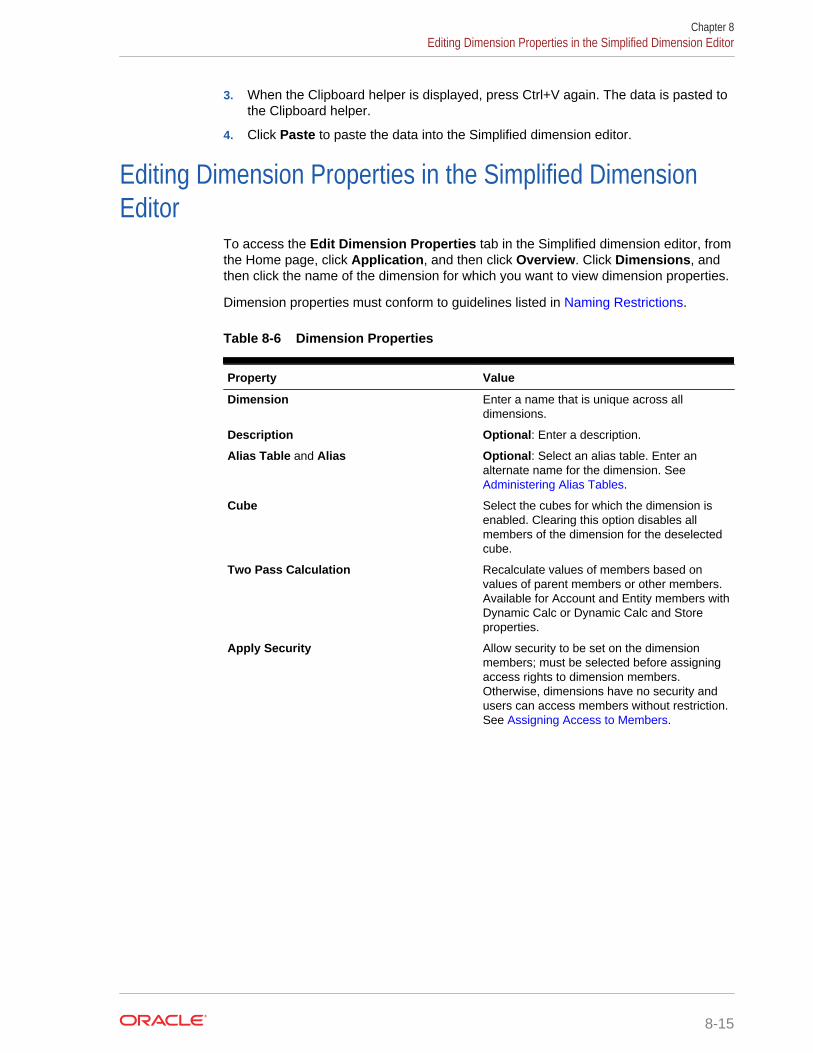
3. When the Clipboard helper is displayed, press Ctrl+V again. The data is pasted tothe Clipboard helper.
4. Click Paste to paste the data into the Simplified dimension editor.
Editing Dimension Properties in the Simplified DimensionEditor
To access the Edit Dimension Properties tab in the Simplified dimension editor, fromthe Home page, click Application, and then click Overview. Click Dimensions, andthen click the name of the dimension for which you want to view dimension properties.
Dimension properties must conform to guidelines listed in Naming Restrictions.
Table 8-6 Dimension Properties
Property Value
Dimension Enter a name that is unique across alldimensions.
Description Optional: Enter a description.
Alias Table and Alias Optional: Select an alias table. Enter analternate name for the dimension. See Administering Alias Tables.
Cube Select the cubes for which the dimension isenabled. Clearing this option disables allmembers of the dimension for the deselectedcube.
Two Pass Calculation Recalculate values of members based onvalues of parent members or other members.Available for Account and Entity members withDynamic Calc or Dynamic Calc and Storeproperties.
Apply Security Allow security to be set on the dimensionmembers; must be selected before assigningaccess rights to dimension members.Otherwise, dimensions have no security andusers can access members without restriction.See Assigning Access to Members.
Chapter 8Editing Dimension Properties in the Simplified Dimension Editor
8-15
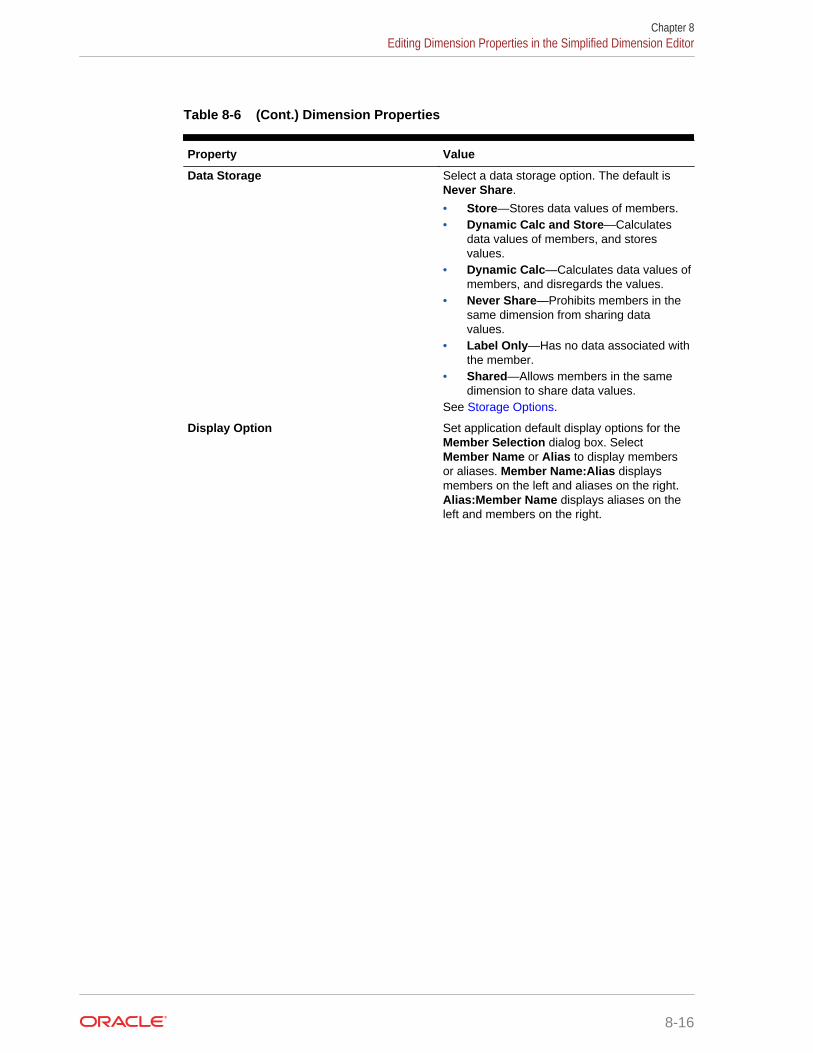
Table 8-6 (Cont.) Dimension Properties
Property Value
Data Storage Select a data storage option. The default isNever Share.
• Store—Stores data values of members.• Dynamic Calc and Store—Calculates
data values of members, and storesvalues.
• Dynamic Calc—Calculates data values ofmembers, and disregards the values.
• Never Share—Prohibits members in thesame dimension from sharing datavalues.
• Label Only—Has no data associated withthe member.
• Shared—Allows members in the samedimension to share data values.
See Storage Options.
Display Option Set application default display options for theMember Selection dialog box. SelectMember Name or Alias to display membersor aliases. Member Name:Alias displaysmembers on the left and aliases on the right.Alias:Member Name displays aliases on theleft and members on the right.
Chapter 8Editing Dimension Properties in the Simplified Dimension Editor
8-16
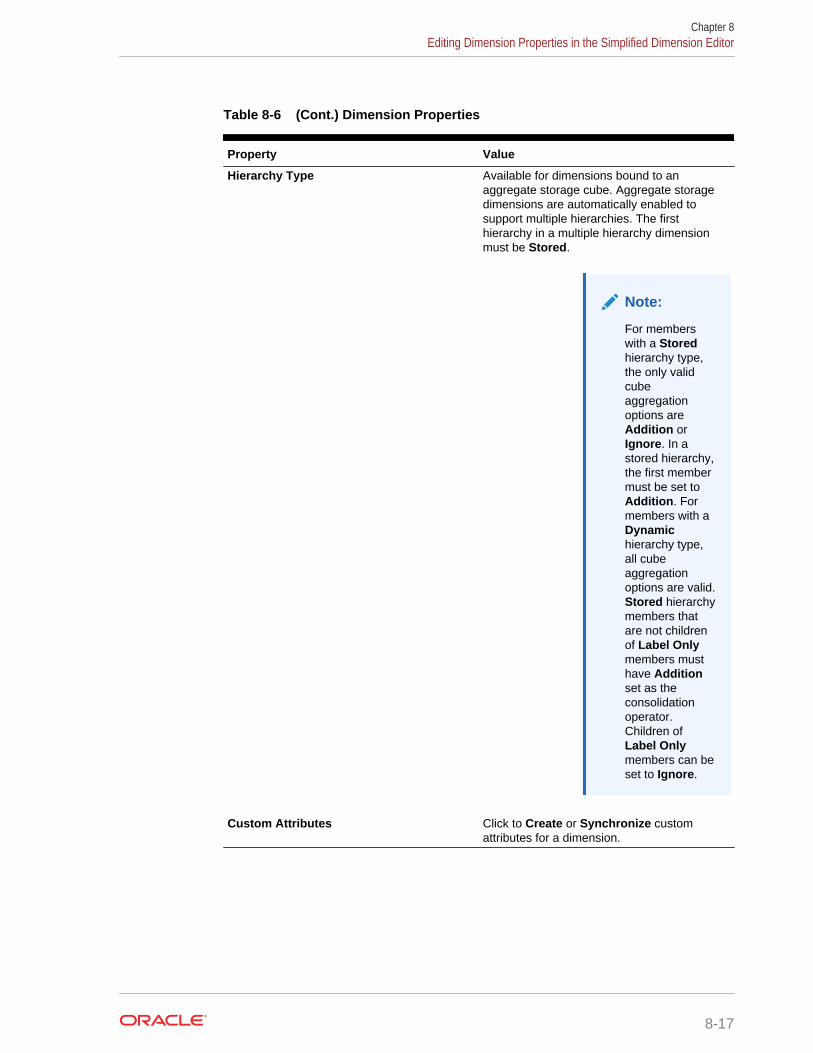
Table 8-6 (Cont.) Dimension Properties
Property Value
Hierarchy Type Available for dimensions bound to anaggregate storage cube. Aggregate storagedimensions are automatically enabled tosupport multiple hierarchies. The firsthierarchy in a multiple hierarchy dimensionmust be Stored.
Note:
For memberswith a Storedhierarchy type,the only validcubeaggregationoptions areAddition orIgnore. In astored hierarchy,the first membermust be set toAddition. Formembers with aDynamichierarchy type,all cubeaggregationoptions are valid.Stored hierarchymembers thatare not childrenof Label Onlymembers musthave Additionset as theconsolidationoperator.Children ofLabel Onlymembers can beset to Ignore.
Custom Attributes Click to Create or Synchronize customattributes for a dimension.
Chapter 8Editing Dimension Properties in the Simplified Dimension Editor
8-17
Editing Member Properties in the Simplified DimensionEditor
Related Topics
• Accessing Edit Member Properties
• Adding Members in the Simplified Dimension Editor
• Editing Members in the Simplified Dimension Editor
• Deleting Members in the Simplified Dimension Editor
• Adding Shared Members in the Simplified Dimension Editor
• Assigning Access to Members
Accessing Edit Member PropertiesTo access the Edit Member Properties tab in the Simplified dimension editor:
1. From the Home page, click Application, and then click Overview.
2. Click Dimensions, and then click the name of the dimension for which you want toview member properties.
3. Click Edit Member Properties.
4. To edit member properties in the Simplified dimension editor grid, click within agrid cell to edit text or to view a drop-down menu from which you can choosemember properties. You can also drag and drop member property values over torows and columns to fill in properties that are the same. See the MemberProperties table below for property options and descriptions.
See Working with the Simplified Dimension Editor Grid
Note:
Each column in the Simplified dimension editor grid represents a memberproperty. The list of properties (columns) that initially displays on the grid canbe different based on which dimension type you're editing. You cancustomize the layout of columns by hiding, unhiding, or resizing columns.You can also display the complete set of properties (all columns) by clearingthe Default mode option. To customize the column layout in the Simplifieddimension editor grid, see Customizing the Column Layout.
Members must conform to guidelines listed in Naming Restrictions. Shared membersmust be consistent with Adding Shared Members in the Simplified Dimension Editor.
Chapter 8Editing Member Properties in the Simplified Dimension Editor
8-18
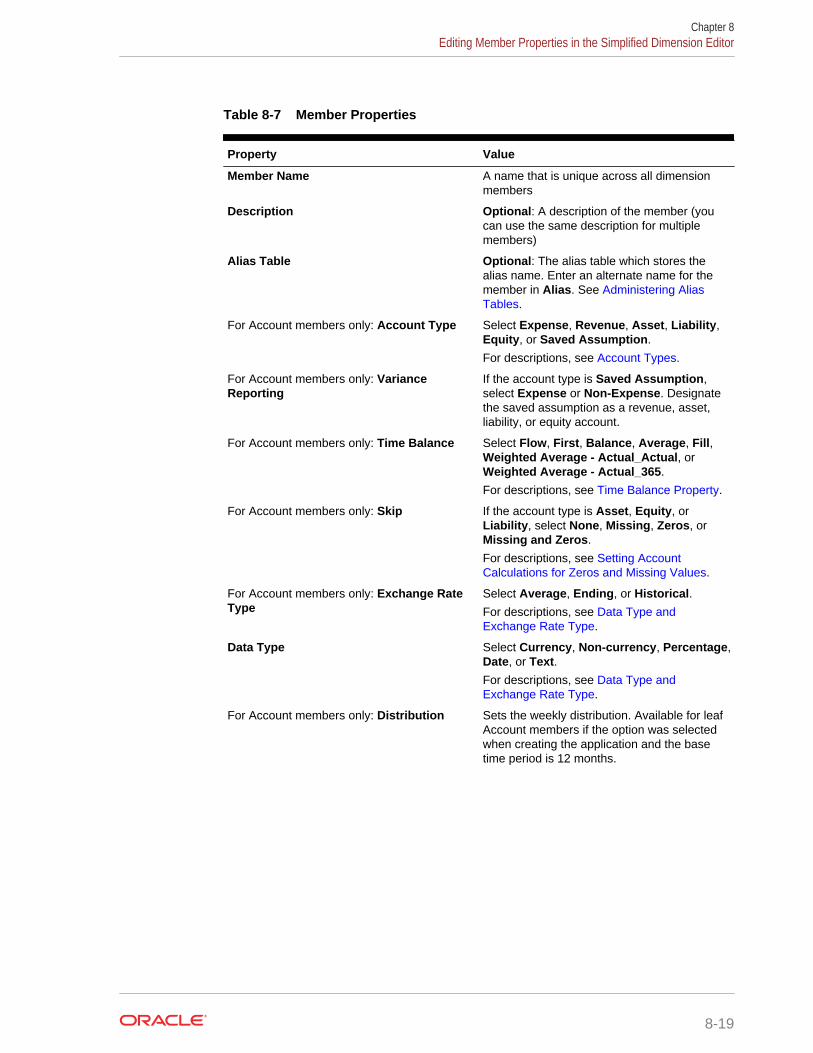
Table 8-7 Member Properties
Property Value
Member Name A name that is unique across all dimensionmembers
Description Optional: A description of the member (youcan use the same description for multiplemembers)
Alias Table Optional: The alias table which stores thealias name. Enter an alternate name for themember in Alias. See Administering AliasTables.
For Account members only: Account Type Select Expense, Revenue, Asset, Liability,Equity, or Saved Assumption.
For descriptions, see Account Types.
For Account members only: VarianceReporting
If the account type is Saved Assumption,select Expense or Non-Expense. Designatethe saved assumption as a revenue, asset,liability, or equity account.
For Account members only: Time Balance Select Flow, First, Balance, Average, Fill,Weighted Average - Actual_Actual, orWeighted Average - Actual_365.
For descriptions, see Time Balance Property.
For Account members only: Skip If the account type is Asset, Equity, orLiability, select None, Missing, Zeros, orMissing and Zeros.
For descriptions, see Setting AccountCalculations for Zeros and Missing Values.
For Account members only: Exchange RateType
Select Average, Ending, or Historical.For descriptions, see Data Type andExchange Rate Type.
Data Type Select Currency, Non-currency, Percentage,Date, or Text.For descriptions, see Data Type andExchange Rate Type.
For Account members only: Distribution Sets the weekly distribution. Available for leafAccount members if the option was selectedwhen creating the application and the basetime period is 12 months.
Chapter 8Editing Member Properties in the Simplified Dimension Editor
8-19

Table 8-7 (Cont.) Member Properties
Property Value
Hierarchy Type Available for dimensions bound to anaggregate storage cube. Aggregate storagedimensions are automatically enabled tosupport multiple hierarchies. The firsthierarchy in a multiple hierarchy dimensionmust be stored.
Note:
For memberswith a storedhierarchy type,the only validcubeaggregationoptions areAddition orIgnore. In astored hierarchy,the first membermust be set toAddition. Formembers with adynamichierarchy type,all cubeaggregationoptions are valid.Stored hierarchymembers thatare not childrenof Label Onlymembers musthave Addition setas theconsolidationoperator.Children of LabelOnly memberscan be set toIgnore.
Data Storage The data storage property. Never Share is thedefault for new custom dimension members(except root members).
Two Pass Calculation Recalculate values of members based onvalues of parent members or other members.Available for Account and Entity members withDynamic Calc or Dynamic Calc and Storeproperties.
Chapter 8Editing Member Properties in the Simplified Dimension Editor
8-20
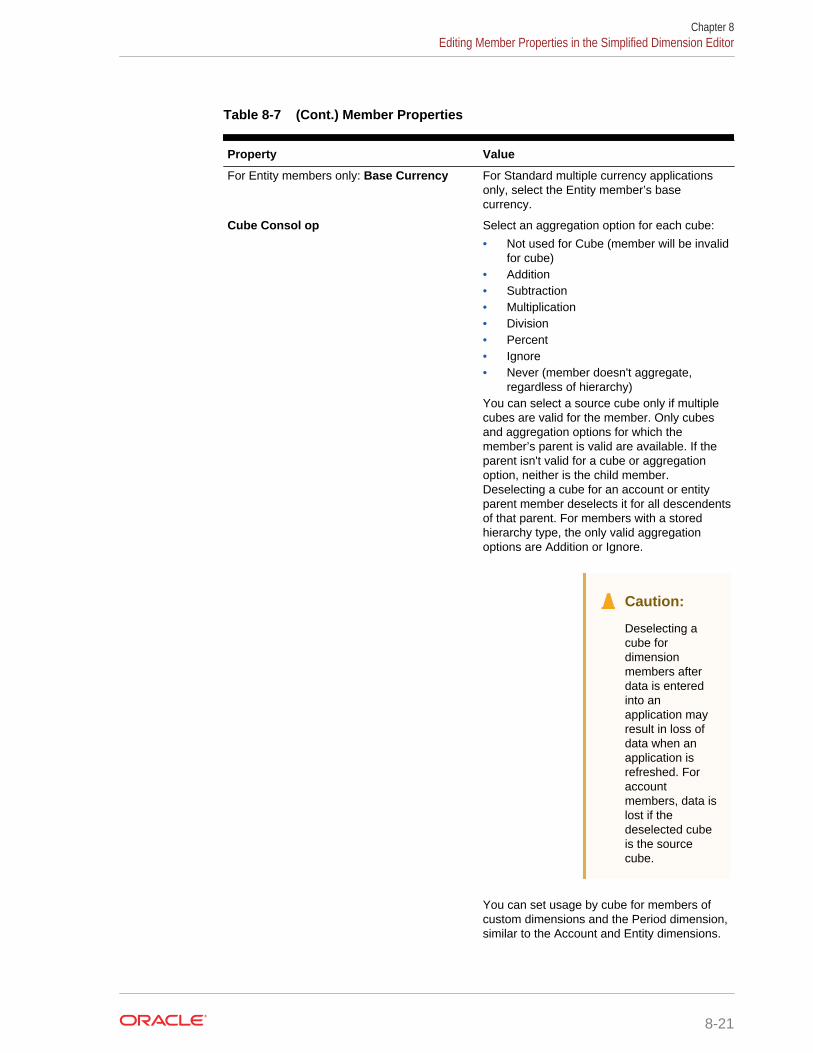
Table 8-7 (Cont.) Member Properties
Property Value
For Entity members only: Base Currency For Standard multiple currency applicationsonly, select the Entity member’s basecurrency.
Cube Consol op Select an aggregation option for each cube:
• Not used for Cube (member will be invalidfor cube)
• Addition• Subtraction• Multiplication• Division• Percent• Ignore• Never (member doesn't aggregate,
regardless of hierarchy)You can select a source cube only if multiplecubes are valid for the member. Only cubesand aggregation options for which themember’s parent is valid are available. If theparent isn't valid for a cube or aggregationoption, neither is the child member.Deselecting a cube for an account or entityparent member deselects it for all descendentsof that parent. For members with a storedhierarchy type, the only valid aggregationoptions are Addition or Ignore.
Caution:
Deselecting acube fordimensionmembers afterdata is enteredinto anapplication mayresult in loss ofdata when anapplication isrefreshed. Foraccountmembers, data islost if thedeselected cubeis the sourcecube.
You can set usage by cube for members ofcustom dimensions and the Period dimension,similar to the Account and Entity dimensions.
Chapter 8Editing Member Properties in the Simplified Dimension Editor
8-21
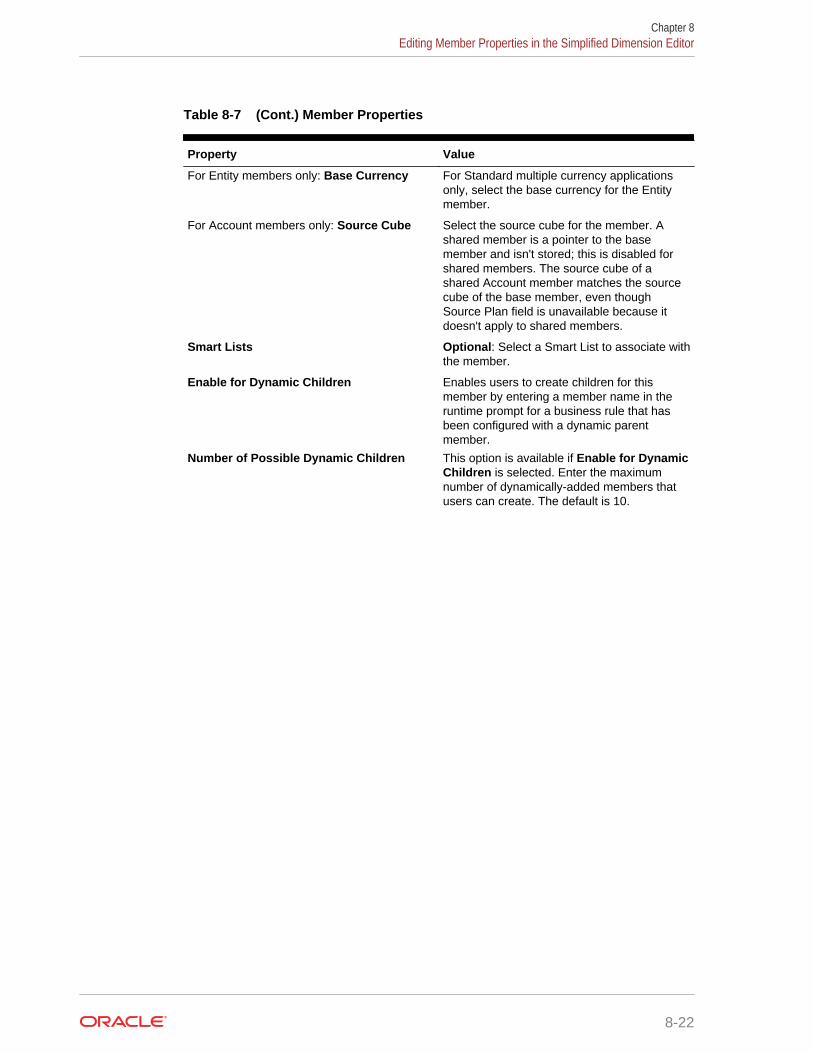
Table 8-7 (Cont.) Member Properties
Property Value
For Entity members only: Base Currency For Standard multiple currency applicationsonly, select the base currency for the Entitymember.
For Account members only: Source Cube Select the source cube for the member. Ashared member is a pointer to the basemember and isn't stored; this is disabled forshared members. The source cube of ashared Account member matches the sourcecube of the base member, even thoughSource Plan field is unavailable because itdoesn't apply to shared members.
Smart Lists Optional: Select a Smart List to associate withthe member.
Enable for Dynamic Children Enables users to create children for thismember by entering a member name in theruntime prompt for a business rule that hasbeen configured with a dynamic parentmember.
Number of Possible Dynamic Children This option is available if Enable for DynamicChildren is selected. Enter the maximumnumber of dynamically-added members thatusers can create. The default is 10.
Chapter 8Editing Member Properties in the Simplified Dimension Editor
8-22
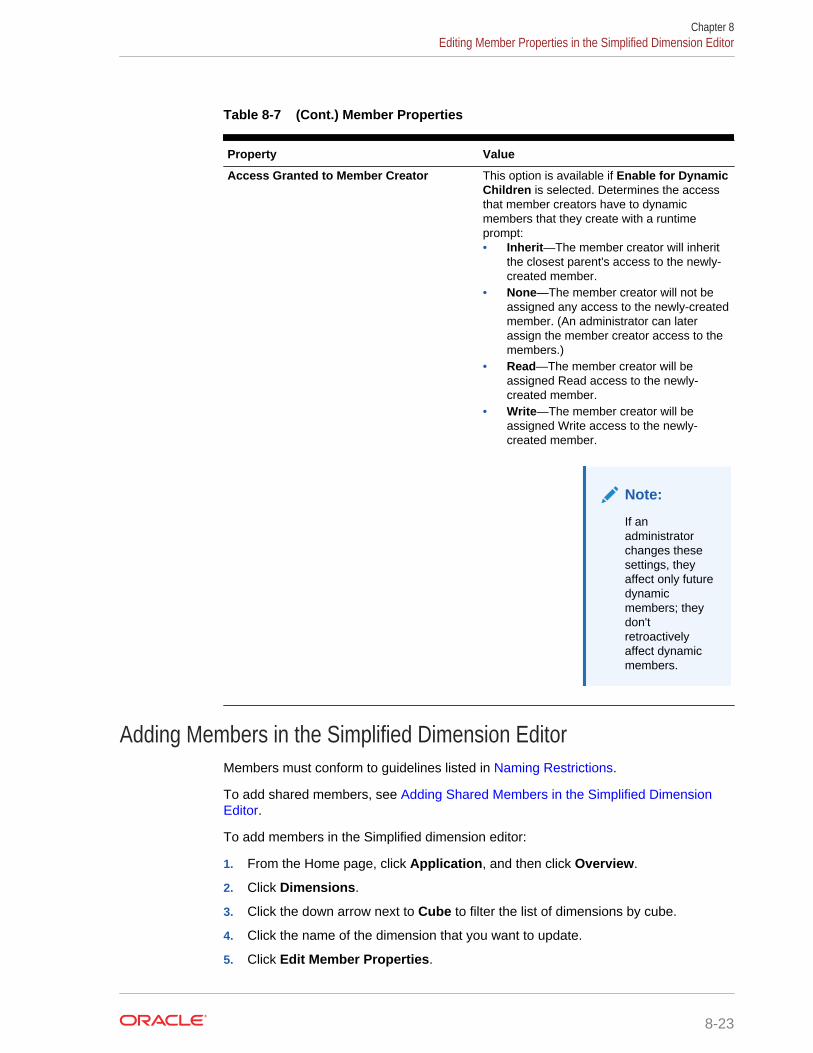
Table 8-7 (Cont.) Member Properties
Property Value
Access Granted to Member Creator This option is available if Enable for DynamicChildren is selected. Determines the accessthat member creators have to dynamicmembers that they create with a runtimeprompt:• Inherit—The member creator will inherit
the closest parent's access to the newly-created member.
• None—The member creator will not beassigned any access to the newly-createdmember. (An administrator can laterassign the member creator access to themembers.)
• Read—The member creator will beassigned Read access to the newly-created member.
• Write—The member creator will beassigned Write access to the newly-created member.
Note:
If anadministratorchanges thesesettings, theyaffect only futuredynamicmembers; theydon'tretroactivelyaffect dynamicmembers.
Adding Members in the Simplified Dimension EditorMembers must conform to guidelines listed in Naming Restrictions.
To add shared members, see Adding Shared Members in the Simplified DimensionEditor.
To add members in the Simplified dimension editor:
1. From the Home page, click Application, and then click Overview.
2. Click Dimensions.
3. Click the down arrow next to Cube to filter the list of dimensions by cube.
4. Click the name of the dimension that you want to update.
5. Click Edit Member Properties.
Chapter 8Editing Member Properties in the Simplified Dimension Editor
8-23
Tip:
To choose a different dimension, click the down arrow next to thedimension name at the top of the page.
6. Add members:
• To add a child member, select the parent level member, and then click AddChild.
• To add a sibling member, select a member, and then click Add Sibling.
• To add an All Years parent member that includes all members of the Yearsdimension, select the Years dimension and then click Add All Years.
The All Years parent member enables users to view the accumulated dataacross multiple years, for example, a project's total cost up to its end date. TheAll Years member doesn't include the No Year member, if one is defined forthe application.
7. To set or change member properties, click a cell in the Edit Member Propertiesgrid and make updates. See Editing Members in the Simplified Dimension Editor.
8. To undo the last change you made before saving, click Undo.
9. To undo all changes that were made since the last save, click Refresh.
10. To save your changes, click Save.
11. To apply your changes across the application after a save, click RefreshDatabase.
12. After creating a dimension member, you typically complete these tasks:
• Assign access. Click Actions, and then click Assign Permissions.
• Assign custom attributes. See Editing Dimension Properties in the SimplifiedDimension Editor.
Editing Members in the Simplified Dimension EditorYou can edit members directly in the Simplified dimension editor grid.
To edit members:
1. From the Home page, click Application, and then click Overview.
2. Click Dimensions.
3. Click the down arrow next to Cube to filter the list of dimensions by cube.
4. Click the name of the dimension that you want to edit.
5. Click Edit Member Properties.
Tip:
To choose a different dimension, click the down arrow next to thedimension name at the top of the page.
Chapter 8Editing Member Properties in the Simplified Dimension Editor
8-24
6. Take an action:
• To add members, see Adding Members in the Simplified Dimension Editor
• To navigate the dimension editor grid and to focus your editing on certainmembers, rows, or columns, see Working with the Simplified Dimension EditorGrid.
• To modify member properties, click within a cell on the dimension editor gridand select an option from the drop-down list. For example, to edit the AccountType for an Account dimension member, click within a cell in the Account Typecolumn. Click the down arrow that appears within the cell, and then select anAccount Type option. For descriptions of member properties, see EditingMember Properties in the Simplified Dimension Editor.
• To delete members, see Deleting Members in the Simplified Dimension Editor.
7. To undo the last change you made before saving, click Undo.
8. To undo all changes that were made since the last save, click Refresh.
9. To save your changes, click Save.
10. To apply your changes across the application after a save, click RefreshDatabase.
Deleting Members in the Simplified Dimension EditorEach data value is identified by a set of dimension member values and a cube.Deleting dimension members or deselecting the cube results in data loss whenrefreshing an application. Deleting entity members deletes all approval units (includingdata) associated with them.
Before deleting members, understand where in the application they are used (in whichforms, approval units, exchange rates, and so on) by using Show Usage. See Showing Member Usage in an Application.
You must delete the entity member throughout the application before deleting it fromdimension. For example, if the entity member is used in a form, you must delete it fromthe form before deleting it from dimensions.
When deleting a large subtree of entities, you can improve performance if you firstexclude approval units for the subtree (by excluding the root member) for all scenariosand versions. See Approvals Process.
To delete members:
1. From the Home page, click Application, and then click Overview.
2. Click Dimensions.
3. Click the down arrow next to Cube to filter the list of dimensions by cube.
4. Click the name of the dimension that contains the member you want to delete.
5. Click Edit Member Properties.
Chapter 8Editing Member Properties in the Simplified Dimension Editor
8-25
Tip:
To choose a different dimension, click the down arrow next to thedimension name at the top of the page.
6. From the dimension editor grid, select the member to delete.
7. Click Delete Member.
Note:
Deleting a base member also deletes its shared members.
8. In the Delete Member query, click OK.
9. Update and validate business rules and reports.
Adding Shared Members in the Simplified Dimension EditorSharing members allow alternate rollup structures within an application. A basemember must exist before you can create a shared member. You can create multipleshared members for the base member. A base member must display before its sharedmembers in position from top to bottom.
Shared members are available for Entity, Account, and user-defined customdimensions. Shared member values can be ignored to avoid double-counting valueswhen you roll up the outline.
Shared members share some property definitions with base members, such asmember name, alias name, base currency, and cubes for which members are valid.Shared members must have unique parent members and different rollup aggregationsettings. Custom attributes, custom attribute values, and member formulas are notallowed for shared members. Renaming base members renames all shared members.
Shared members can't be moved to another parent member. You must delete sharedmembers and recreate them under different parent members. The base member neednot be level zero. You can enter data in shared members, and values are stored withbase members.
To add shared members in the Simplified dimension editor:
1. View Edit Member Properties.
See Accessing the Simplified Dimension Editor.
2. Add shared members:
a. Add a child member with the same name as the base member.
b. For Parent Name of the new member, type a new parent name.
c. For Default Data Storage of the new member, select Shared.
3. Click Save.
Data storage properties for all other cubes will automatically be set to Shared.
Chapter 8Editing Member Properties in the Simplified Dimension Editor
8-26
Assigning Access to MembersBefore you can assign access to members of user-defined custom dimensions, youmust select the Apply Security check box on the dimension’s Edit DimensionProperties page. See Editing Dimension Properties in the Simplified DimensionEditor.
To assign access to members:
1. View Edit Member Properties.
See Accessing the Simplified Dimension Editor.
2. Select the member, and then click .
3. Click Permissions.
4. Add, edit, or remove permissions.
• Adding, Editing, and Removing Access to Members
• About Effective Access Permissions to Shared Members
Adding, Editing, and Removing Access to MembersYou can specify which users and groups can access the selected member.
To assign, edit, and remove access permissions to members:
1. View Edit Member Properties.
See Accessing the Simplified Dimension Editor.
2. Select the member, and then click .
3. Click Permissions.
4. Click Add User/Group.
5. To add access:
a. Click to select the users and groups to access the selected member.
Click Users to display all user names; click Groups to display all groups.
b. Optional: Select a relationship.
For example, select Children to assign access to the children of the selectedmember.
6. To modify access:
a. Select the access type for the displayed users or groups.
Click Users to display all user names; click Groups to display all groups.
b. Optional: Select a relationship.
For example, select Children to assign access to children of the selectedmember.
7. To remove access, click .
Chapter 8Editing Member Properties in the Simplified Dimension Editor
8-27
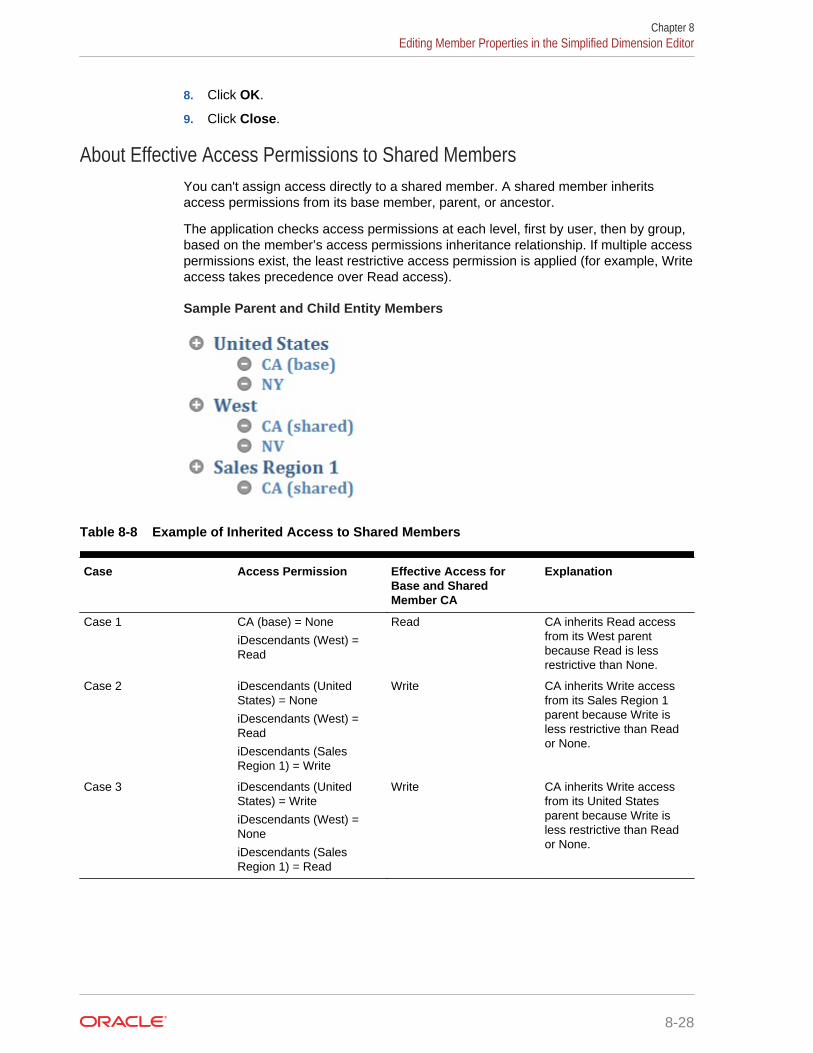
8. Click OK.
9. Click Close.
About Effective Access Permissions to Shared MembersYou can't assign access directly to a shared member. A shared member inheritsaccess permissions from its base member, parent, or ancestor.
The application checks access permissions at each level, first by user, then by group,based on the member’s access permissions inheritance relationship. If multiple accesspermissions exist, the least restrictive access permission is applied (for example, Writeaccess takes precedence over Read access).
Sample Parent and Child Entity Members
Table 8-8 Example of Inherited Access to Shared Members
Case Access Permission Effective Access forBase and SharedMember CA
Explanation
Case 1 CA (base) = None
iDescendants (West) =Read
Read CA inherits Read accessfrom its West parentbecause Read is lessrestrictive than None.
Case 2 iDescendants (UnitedStates) = None
iDescendants (West) =Read
iDescendants (SalesRegion 1) = Write
Write CA inherits Write accessfrom its Sales Region 1parent because Write isless restrictive than Reador None.
Case 3 iDescendants (UnitedStates) = Write
iDescendants (West) =None
iDescendants (SalesRegion 1) = Read
Write CA inherits Write accessfrom its United Statesparent because Write isless restrictive than Reador None.
Chapter 8Editing Member Properties in the Simplified Dimension Editor
8-28
Setting Up Scenarios and Specifying VersionsRelated Topics
• Setting Up Scenarios
• Specifying Versions
Setting Up ScenariosEach scenario/version combination contains data for accounts and other dimensionsof each entity. After users enter data for an entity for a scenario and version, they cansubmit or promote the data for the entity to other users for review and approval.
• About Scenarios
• Creating, Editing, and Deleting Scenarios
• Copying Scenarios
About ScenariosUse scenarios to:
• Apply different planning methods
• Create forecasts
• Enter data into scenarios
• Associate scenarios with different time periods or exchange rates
• Assign user access rights by scenario
• Report on scenarios
• Compare and analyze scenarios
Time Periods
Assign each scenario a range of years and time periods, and specify the BeginningBalance time period. When users access forms, they can enter into that scenario onlyyears and periods within the range. Years and periods outside of the range display asread-only. You can modify the time range.
Exchange Rate Table
If a Standard multicurrency application converts currencies, assign an exchange ratetable to the scenario. By assigning different exchange rate tables to scenarios, youcan model the effects of currency rate assumptions.
Access Permissions
Specify access permissions to Scenario dimension members for groups or users todetermine who can view or modify data. A user or group can have only one of theseaccess permissions: Read, Write, or None. Access permissions for a user can becombined based on groups to which the user belongs.
Chapter 8Setting Up Scenarios and Specifying Versions
8-29
Creating, Editing, and Deleting ScenariosTo create, edit, or delete scenarios:
1. From the Home page, click Application, and then click Overview.
2. Click Dimensions, click the Scenario dimension, and then click the Edit MemberProperties tab.
3. Choose an action:
• To create a scenario, click , and then go to step 4.
• To delete a scenario, select the scenario to delete, then click , and thenconfirm the deletion.
Note:
When you delete scenarios, all approval units that use the scenario(including data) are deleted. You can't delete scenarios used inapproval units that are started, or assigned to an axis on a form. Youmust first remove references to scenarios from forms and assigndifferent scenarios.
• To edit a scenario, click within the grid cells in the Simplified dimension editorgrid to edit text or to view a drop-down menu from which you can choosemember properties. Go to step 4.
Note:
Each column in the Simplified dimension editor grid represents amember property. The columns that initially display on the grid willdiffer based on which dimension type you're editing. You cancustomize the layout of columns in the Simplified dimension editorgrid by hiding, unhiding, or resizing columns. You can also displaythe complete set of properties (all columns) by clearing the Defaultmode option. To clear the Default mode option, on the dimensiongrid, right-click any column heading, scroll down until you see theDefault mode option, and then clear it.
See Working with the Simplified Dimension Editor Grid.
4. In the Member Name column, enter a name for the scenario.
5. In the Start Yr., End Yr., Start Period, and End Period columns, define the timeperiods to associate with the scenario.
6. You can also perform these optional steps:
• In the Description column, enter a description for the scenario.
• To update the alias, select one of the Alias Table columns (choose default ora language) to associate with the scenario, and enter an alias name.
Chapter 8Setting Up Scenarios and Specifying Versions
8-30
• In the Beg.Bal. as Time Period column, specify whether to include theBegBalance time period in this scenario for currency conversion.
• In the Enabled for Process Management column, specify whether to includethis scenario in approvals.
• In the Exchange Rate Table, select an exchange rate table to associate withthe scenario.
Note:
If an application uses multiple currencies, associate a scenario withan exchange rate table to enable currency conversions.
7. Click Save.
Copying ScenariosOnly scenario properties are copied. Data values and access rights associated withthe original scenario are not copied to the new scenario.
To copy scenarios:
1. From the Home page, click Application, and then click Overview.
2. Click Dimensions, click the Scenario dimension, and then click the Edit MemberProperties tab.
3. In the Simplified dimension editor grid, select the scenario to copy.
4. Click .
The duplicate scenario is added to the Simplified dimension editor grid and _copyis appended after the member name.
5. In the Member Name column, enter a new name for the duplicate scenario.
6. In the Start Yr., End Yr., Start Period, and End Period columns, define the timeperiods to associate with the scenario.
7. You can also perform these optional steps:
• In the Description column, enter a description for the scenario.
• To update the alias, select one of the Alias Table columns (choose default ora language) to associate with the scenario, and enter an alias name.
• In the Beg.Bal. as Time Period column, specify whether to include theBegBalance time period in this scenario for currency conversion.
• In the Enabled for Process Management column, specify whether to includethis scenario in approvals.
• In the Exchange Rate Table, select an exchange rate table to associate withthe scenario.
Chapter 8Setting Up Scenarios and Specifying Versions
8-31
Note:
If an application uses multiple currencies, associate a scenario withan exchange rate table to enable currency conversions.
8. Click Save.
Specifying VersionsUse versions to group data used by an application.
• About Versions
• Target and Bottom Up Versions
• Creating, Editing, and Deleting Versions
• Viewing Version Types
About VersionsUse the Scenario and Version dimensions to create plans to be reviewed andapproved. Each scenario/version combination contains data for accounts and otherdimensions of each entity. After users enter data for an entity for a scenario andversion, they can submit or promote the data for the entity to other users for reviewand approval. Use versions to:
• Allow multiple iterations of a plan
• Model possible outcomes based on different assumptions
• Manage dissemination of plan data
• Facilitate target settings
Target and Bottom Up VersionsYou can create target and bottom up versions. With bottom up versions, you enterdata into bottom level members; parent level members are display-only and don'tpermit data entry. Parent member values are aggregated from bottom level members.
For target versions, you can enter data for members at any level in the hierarchy. Youcan use business rules to distribute values from parent members to their descendants.Use target versions to set high-level targets for your plan. Planners working withbottom up versions can reference these targets when they enter plan data.
Target versions use top-down budgeting. Manage Approvals Tasks are not allowed,and children of target members must be blank (for example, #MISSING) to enabledata input at the top level. Target members must be set to Store (Dynamic Calcoverrides data input with sum of children).
Creating, Editing, and Deleting VersionsTo create, edit, or delete versions:
1. From the Home page, click Application, and then click Overview.
Chapter 8Setting Up Scenarios and Specifying Versions
8-32
2. Click Dimensions, click the Version dimension, and then click the Edit MemberProperties tab.
3. Choose an action:
• To create a version, click , and then go to step 4.
• To delete a version, select the version to delete, then click , and thenconfirm the deletion.
Note:
You can't delete versions that are used in approval units that arestarted or are assigned to axes on forms. You must removereferences to versions from forms and assign another version toaxes. At least one version must remain in the application.
• To edit a version, click within the grid cells in the Simplified dimension editorgrid to change the version name and access rights. Go to step 4.
Note:
Each column in the Simplified dimension editor grid represents amember property. The columns that initially display on the grid willdiffer based on which dimension type you're editing. You cancustomize the layout of columns in the Simplified dimension editorgrid by hiding, unhiding, or resizing columns. You can also displaythe complete set of properties (all columns) by clearing the Defaultmode option. To clear the Default mode option, on the dimensiongrid, right-click any column heading, scroll down until you see theDefault mode option, and then clear it.
See Working with the Simplified Dimension Editor Grid.
4. In the Member Name column, enter a name for the version.
5. In the Type column, select the type of version to display for the application:
• Standard Target—Values are entered from the parent level down
• Standard Bottom Up—Values are entered at the lowest member level andaggregated upward
6. You can also perform these optional steps:
• In the Description column, enter a description for the scenario.
• To update the alias, select one of the Alias Table columns (choose default ora language) to associate with the version, and enter an alias name.
• In the Beg.Bal. as Time Period column, specify whether to include theBegBalance time period in this scenario for currency conversion.
• In the Enabled for Process Management column, specify whether to includethis version in approvals.
Chapter 8Setting Up Scenarios and Specifying Versions
8-33
Note:
This option isn't available for target versions.
7. Click Save.
8. Update and validate business rules and reports.
Viewing Version TypesTo view version types:
1. From the Home page, click Application, and then click Overview.
2. Click Dimensions, click the Version dimension, and then click the Edit MemberProperties tab.
3. In the Simplified dimension editor grid, the Type column displays these versiontypes:
• Standard Target—Values are entered from the parent level down.
• Standard Bottom Up—Values are entered at the lowest member level andaggregated up.
Chapter 8Setting Up Scenarios and Specifying Versions
8-34
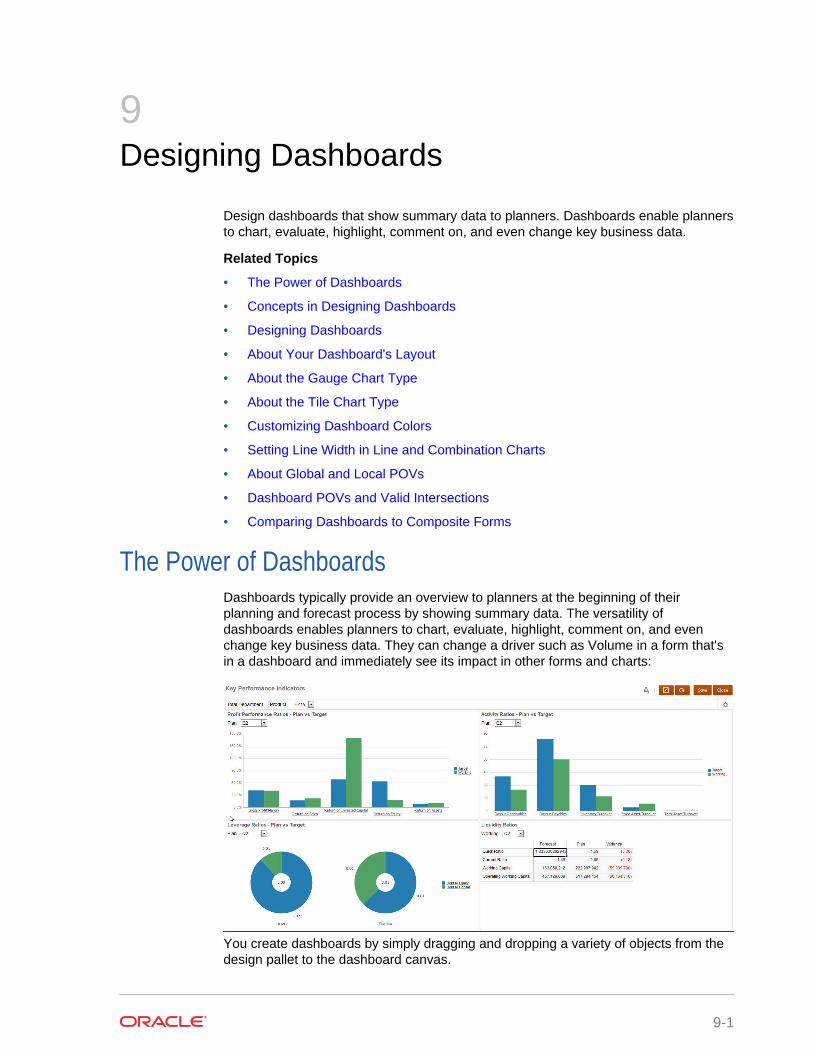
9Designing Dashboards
Design dashboards that show summary data to planners. Dashboards enable plannersto chart, evaluate, highlight, comment on, and even change key business data.
Related Topics
• The Power of Dashboards
• Concepts in Designing Dashboards
• Designing Dashboards
• About Your Dashboard's Layout
• About the Gauge Chart Type
• About the Tile Chart Type
• Customizing Dashboard Colors
• Setting Line Width in Line and Combination Charts
• About Global and Local POVs
• Dashboard POVs and Valid Intersections
• Comparing Dashboards to Composite Forms
The Power of DashboardsDashboards typically provide an overview to planners at the beginning of theirplanning and forecast process by showing summary data. The versatility ofdashboards enables planners to chart, evaluate, highlight, comment on, and evenchange key business data. They can change a driver such as Volume in a form that'sin a dashboard and immediately see its impact in other forms and charts:
You create dashboards by simply dragging and dropping a variety of objects from thedesign pallet to the dashboard canvas.
9-1
With dashboards, you can:
• Include up to six forms that dynamically update, including their associated charts,as planners change data in the form.
• Include up to nine charts or tiles. Tiles display a specific value from the cube. Toprovide the value for each tile, you can specify a form or a cell intersection as adata source.
• Switch between using the design pallet and runtime mode, so you can see exactlywhat the dashboard user will see.
• Depict data interactively with a wide variety of chart types such as area, bar,bubble, column, combination bar and line, doughnut, funnel, gauge, scatter, radar,and so on.
• Add links to dynamically display external Web pages.
• Finely control the dashboard’s layout. For example, two forms can consume thetop half of a dashboard and three charts can each consume 33% of the bottomhalf.
• Depending on the form design, enable users to drill down into underlying detailand select which members to work with.
• Include user variables in the global POV bar and the local POV.
• Include explanations of data called Commentary in the dashboard.
• In certain charts:
– Customize the colors and line width.
– Show gridlines (the default is to hide gridlines).
When planners use a dashboard (referred to as runtime), they can set many aspectsof the object, such as the type of chart displayed, the dashboard’s title, and so on. Atoolbar is available for each object type. Dashboard users can change and save data,run rules, and so on. However, changes made in runtime to the chart type optionsaren't saved for the next session. Clicking Save in runtime saves the data, but not thedashboard definition.
Administrators create, redesign, delete, and assign permissions to dashboards.
Watch this tutorial video to learn how to create dashboards.
Tutorial Video
Related Topics:
• Concepts in Designing Dashboards
• Designing Dashboards
• About Your Dashboard's Layout
• About the Gauge Chart Type
• Customizing Dashboard Colors
• Setting Line Width in Line and Combination Charts
• About Global and Local POVs
• Comparing Dashboards to Composite Forms
Chapter 9The Power of Dashboards
9-2

Concepts in Designing DashboardsHelpful information as you design dashboards:
• On the left is the design palette. Simply drag and drop objects from the palette tothe canvas.
Tip:
Drag an object to a border line. The drag icon changes to a plus signwhen you can drop the object in an allowed space. See About YourDashboard's Layout.
• On the top right are settings for the entire dashboard:
• Use Settings to set these aspects of the dashboard:
Note:
When a new dashboard is created, the borders are hidden by default. Toshow borders in newly created dashboards, you must change theborders setting to Show.
For more information about POVs, see About Global and Local POVs.
• At the top right of each object is a toolbar for that object that displays when you
hover over it:
• As you create a dashboard, click Runtime so that you can immediately seehow the dashboard looks and works to a dashboard user. To return to designermode to continue designing the dashboard, click Designer.
Chapter 9Concepts in Designing Dashboards
9-3
Designing Dashboards
1. From the Home page, click , and then Create.
2. Enter a name.
• To change the default dashboard name, click its name, and enter a new namein the input box.
• To give the dashboard a title with custom formatting, click Settings, clear Usename as title, and then enter the title and set formatting the dialog box.
3. From the design palette on the left, drag and drop objects onto the dashboardcanvas.
Select from these objects:
Table 9-1 Dashboard Objects
Object Description
Forms Select simple forms to include in the dashboard by navigatingthe forms folders or by searching for them by name.
Note:
The access permissions set for forms are honored indashboards.
Chart Types Select the chart types to include in the dashboard. When firstadded, a selected chart has sample data. You then associate itwith a form as its data source. When you link a chart to a form,users can immediately see the impact of changing data in theform on the associated charts.
The Combination chart type alternates displaying row data withvertical bars and lines in the chart. For example, the data inrow 1 of a form is displayed as a bar and the data in row 2 as aline, with alternating chart types for even and odd-numberedrows. Although the Combination chart type can display up to 20rows of data, it’s particularly useful when you want to comparetwo categories of data. For example, you want to compareGermany and France’s average exchange rates over severalyears, so the form has Germany rates in row 1 of the form, andFrance’s rates are in row 2.
For information on the Gauge chart type, see About the GaugeChart Type.
Tile Sometimes called performance tiles, a tile is a chart type thatlets you select specific values from the cube to display. See About the Tile Chart Type.
Chapter 9Designing Dashboards
9-4
Table 9-1 (Cont.) Dashboard Objects
Object Description
Commentary Select External Artifacts, and then Commentary. Enter textthat explains the data or charts.
URL Dynamic web page summary. Select External Artifacts, andthen URL. Insert only external site URLs starting with thehttps:// security protocol. Don't use internal or relativeURLs or URLs for unconsenting third party sites such asgoogle.com.
4. Customize the dashboard using the dashboards settings and the objects’ hovertoolbar, and then click Save.
See About Your Dashboard's Layout.
You can easily duplicate and modify a dashboard using Copy As on the Dashboard
list page. Select the dashboard, and then click Actions .
About Your Dashboard's LayoutAbout setting up a dashboard layout:
• The first object you drag occupies the whole canvas.
• Then drag objects to the left, the right, the top, or the bottom of the existing object.
• The dashboard canvas provides two types of drop zones: One to place two objectsnext to each other, each occupying half the space, and the other to place threeobjects, each occupying a third of the space.
• You can design a dashboard with objects to display vertically, horizontally, andeach can have its own size.
• To resize an object that uses Flexible layout, drag the object’s border.
• To resize an object that uses Fixed layout, set its width or height percentage inSettings.
• The form layout can be asymmetric.
• In runtime mode, if a user doesn't have access to a form or if the form is missing,then an adjacent object takes its space. In designer mode, all empty objects aredisplayed so that the designer can choose to remove them.
About the Gauge Chart TypeGauge chart types are handy for showing whether data values fall within anacceptable range or not. You set the maximum value, the range maximums, and thegauge displays ranges as red, yellow, and green to help you quickly assess a currentvalue. So, gauge chart types help you identify problems in important data points ormeasures. For example, you could use a gauge to display the current sales, where thethresholds are set to represent the sales targets.
If the form has multiple values, you can display multiple gauges, up to a maximum of36 (the values in the first 6 rows and the first 6 columns in the form). The remaining
Chapter 9About Your Dashboard's Layout
9-5
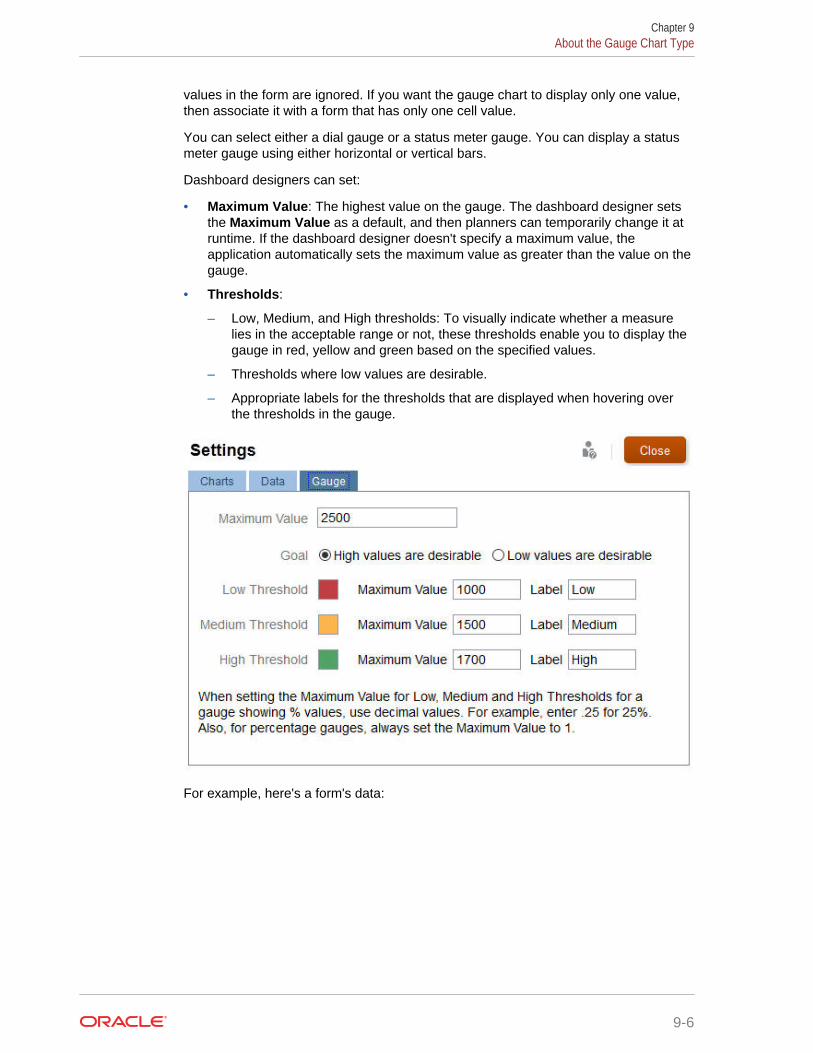
values in the form are ignored. If you want the gauge chart to display only one value,then associate it with a form that has only one cell value.
You can select either a dial gauge or a status meter gauge. You can display a statusmeter gauge using either horizontal or vertical bars.
Dashboard designers can set:
• Maximum Value: The highest value on the gauge. The dashboard designer setsthe Maximum Value as a default, and then planners can temporarily change it atruntime. If the dashboard designer doesn't specify a maximum value, theapplication automatically sets the maximum value as greater than the value on thegauge.
• Thresholds:
– Low, Medium, and High thresholds: To visually indicate whether a measurelies in the acceptable range or not, these thresholds enable you to display thegauge in red, yellow and green based on the specified values.
– Thresholds where low values are desirable.
– Appropriate labels for the thresholds that are displayed when hovering overthe thresholds in the gauge.
For example, here's a form's data:
Chapter 9About the Gauge Chart Type
9-6
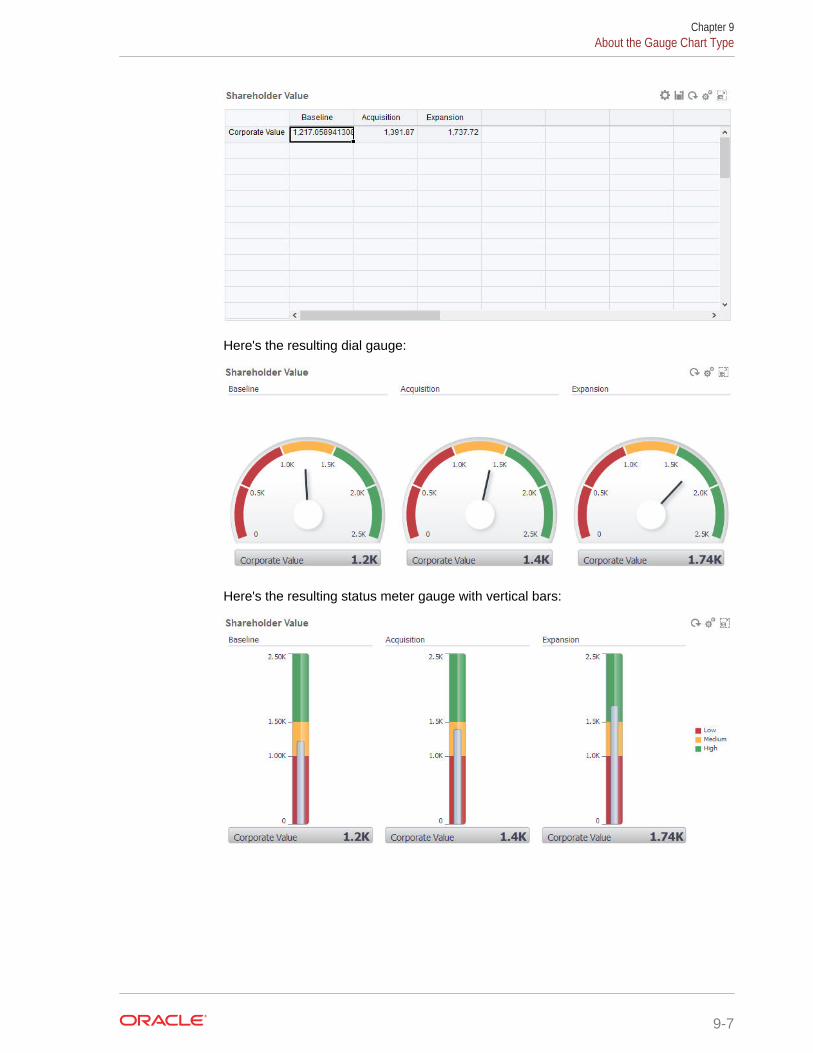
Here's the resulting dial gauge:
Here's the resulting status meter gauge with vertical bars:
Chapter 9About the Gauge Chart Type
9-7
Note:
If a cell in the form is missing a value, no gauge is displayed for that cell.Also, you must specify at least 2 consecutive thresholds. The applicationneeds the middle threshold value to calculate the chart.
About the Tile Chart TypeA tile is a chart type that lets you select specific values from the cube to display. Inaddition to using a form as a data source, you can directly enter a cell intersection thatprovides the value for a tile. You can have up to 6 tiles across, and 4 rows down in adashboard, and give them a title. Until you associate a tile with data, it displays sampledata.
With a form as the data source for a tile:
• You can have up to six tiles per object.
• The values in the first column (up to the sixth row) are used to create the tiles.
Note:
Sometimes in a form, the first column may be collapsed (hidden) whenviewed as a grid. But the collapsed column is still considered when thetile gets its values from the form.
• The tile’s title is the row’s title, and it gets its values from the first column, then byrow.
• You can set the tile’s title, the tile’s height percentage, legend, and can selectwhich axes from the form to include. For example, if you select a form with threerows, the tile displays three values.
With a cell intersection as the data source for a tile, you can have only one tile perobject.
Tip:
To select a tile chart type, expand the list of chart types by clicking the link atthe bottom of the list.
Here are options you can set for a tile chart type. Note that you can set whether thedisplayed value is horizontally aligned in the tile to the left, the center, or the right.
Chapter 9About the Tile Chart Type
9-8
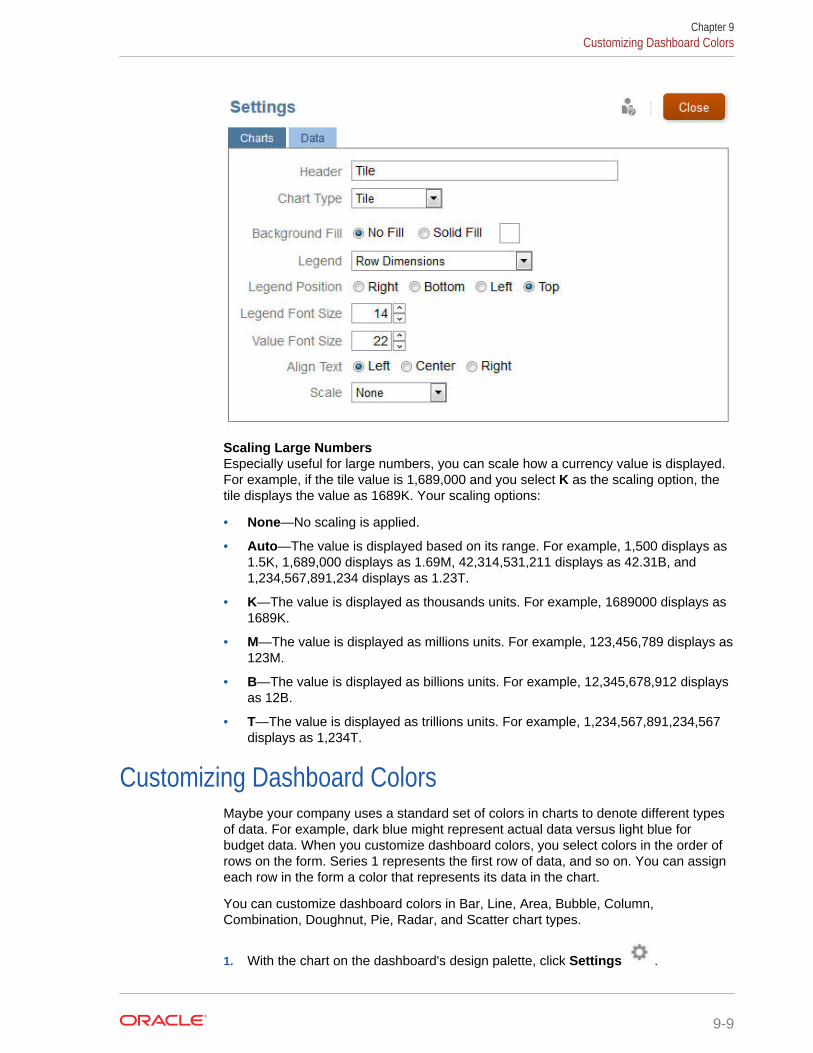
Scaling Large NumbersEspecially useful for large numbers, you can scale how a currency value is displayed.For example, if the tile value is 1,689,000 and you select K as the scaling option, thetile displays the value as 1689K. Your scaling options:
• None—No scaling is applied.
• Auto—The value is displayed based on its range. For example, 1,500 displays as1.5K, 1,689,000 displays as 1.69M, 42,314,531,211 displays as 42.31B, and1,234,567,891,234 displays as 1.23T.
• K—The value is displayed as thousands units. For example, 1689000 displays as1689K.
• M—The value is displayed as millions units. For example, 123,456,789 displays as123M.
• B—The value is displayed as billions units. For example, 12,345,678,912 displaysas 12B.
• T—The value is displayed as trillions units. For example, 1,234,567,891,234,567displays as 1,234T.
Customizing Dashboard ColorsMaybe your company uses a standard set of colors in charts to denote different typesof data. For example, dark blue might represent actual data versus light blue forbudget data. When you customize dashboard colors, you select colors in the order ofrows on the form. Series 1 represents the first row of data, and so on. You can assigneach row in the form a color that represents its data in the chart.
You can customize dashboard colors in Bar, Line, Area, Bubble, Column,Combination, Doughnut, Pie, Radar, and Scatter chart types.
1. With the chart on the dashboard's design palette, click Settings .
Chapter 9Customizing Dashboard Colors
9-9
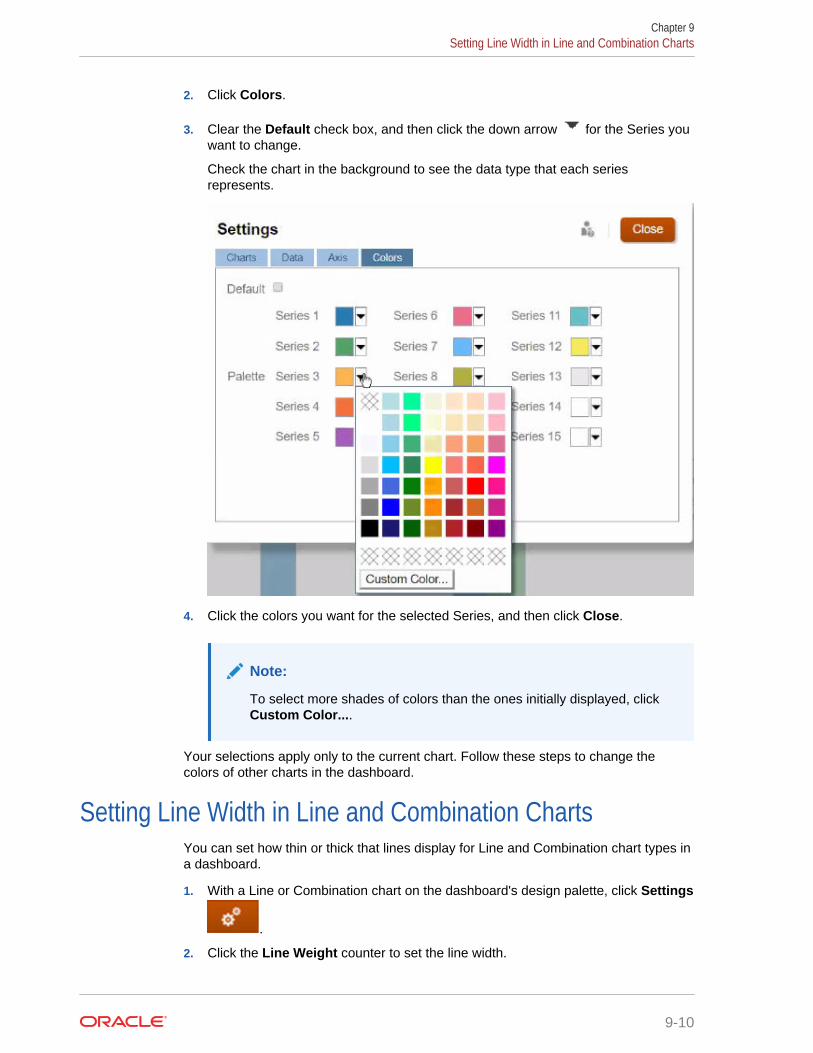
2. Click Colors.
3. Clear the Default check box, and then click the down arrow for the Series youwant to change.
Check the chart in the background to see the data type that each seriesrepresents.
4. Click the colors you want for the selected Series, and then click Close.
Note:
To select more shades of colors than the ones initially displayed, clickCustom Color....
Your selections apply only to the current chart. Follow these steps to change thecolors of other charts in the dashboard.
Setting Line Width in Line and Combination ChartsYou can set how thin or thick that lines display for Line and Combination chart types ina dashboard.
1. With a Line or Combination chart on the dashboard's design palette, click Settings
.
2. Click the Line Weight counter to set the line width.
Chapter 9Setting Line Width in Line and Combination Charts
9-10
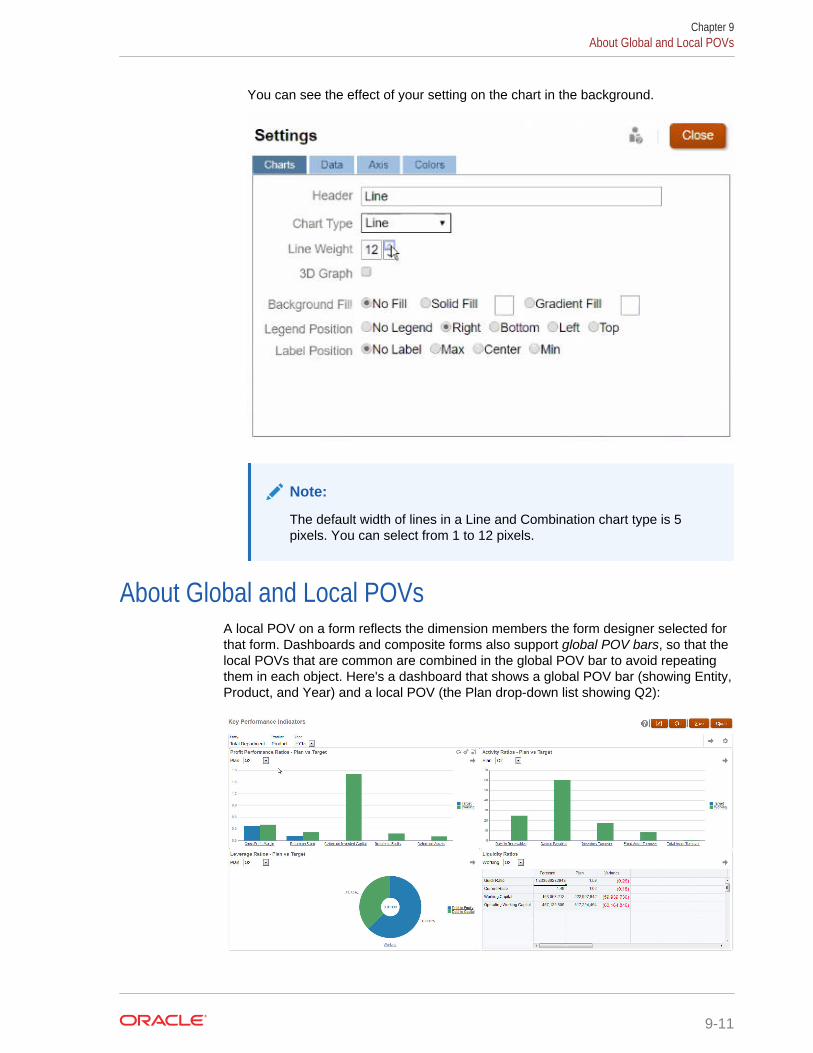
You can see the effect of your setting on the chart in the background.
Note:
The default width of lines in a Line and Combination chart type is 5pixels. You can select from 1 to 12 pixels.
About Global and Local POVsA local POV on a form reflects the dimension members the form designer selected forthat form. Dashboards and composite forms also support global POV bars, so that thelocal POVs that are common are combined in the global POV bar to avoid repeatingthem in each object. Here's a dashboard that shows a global POV bar (showing Entity,Product, and Year) and a local POV (the Plan drop-down list showing Q2):
Chapter 9About Global and Local POVs
9-11
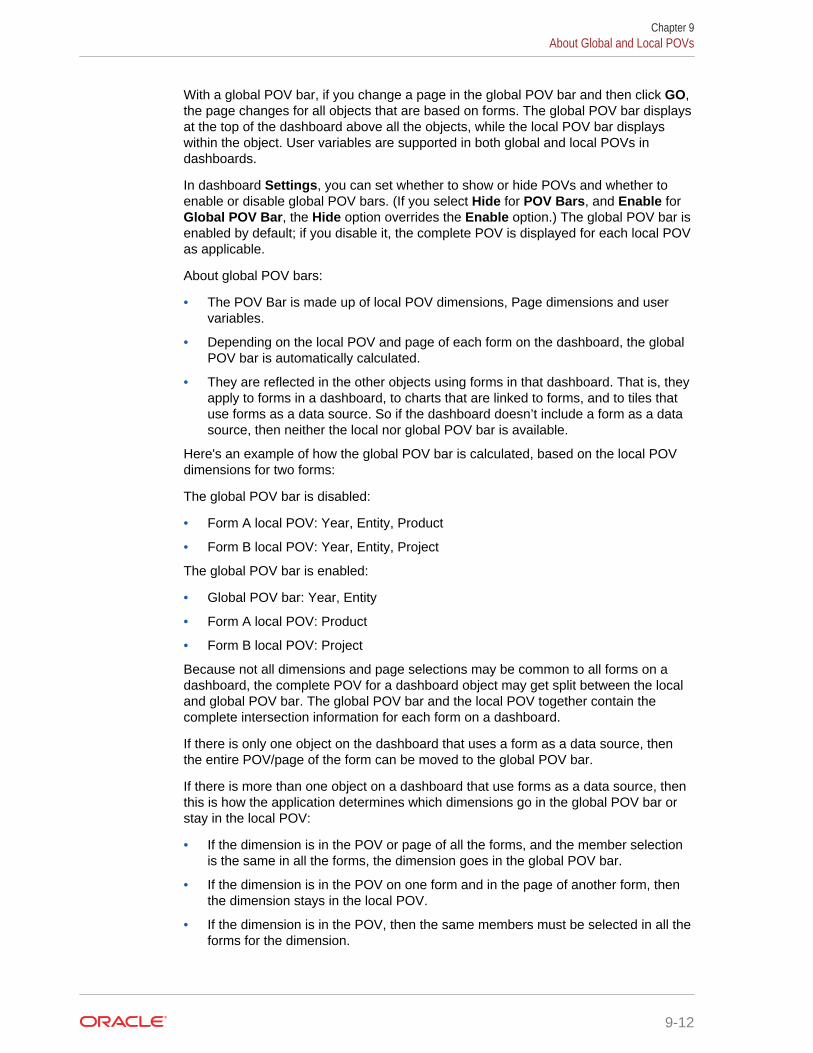
With a global POV bar, if you change a page in the global POV bar and then click GO,the page changes for all objects that are based on forms. The global POV bar displaysat the top of the dashboard above all the objects, while the local POV bar displayswithin the object. User variables are supported in both global and local POVs indashboards.
In dashboard Settings, you can set whether to show or hide POVs and whether toenable or disable global POV bars. (If you select Hide for POV Bars, and Enable forGlobal POV Bar, the Hide option overrides the Enable option.) The global POV bar isenabled by default; if you disable it, the complete POV is displayed for each local POVas applicable.
About global POV bars:
• The POV Bar is made up of local POV dimensions, Page dimensions and uservariables.
• Depending on the local POV and page of each form on the dashboard, the globalPOV bar is automatically calculated.
• They are reflected in the other objects using forms in that dashboard. That is, theyapply to forms in a dashboard, to charts that are linked to forms, and to tiles thatuse forms as a data source. So if the dashboard doesn’t include a form as a datasource, then neither the local nor global POV bar is available.
Here's an example of how the global POV bar is calculated, based on the local POVdimensions for two forms:
The global POV bar is disabled:
• Form A local POV: Year, Entity, Product
• Form B local POV: Year, Entity, Project
The global POV bar is enabled:
• Global POV bar: Year, Entity
• Form A local POV: Product
• Form B local POV: Project
Because not all dimensions and page selections may be common to all forms on adashboard, the complete POV for a dashboard object may get split between the localand global POV bar. The global POV bar and the local POV together contain thecomplete intersection information for each form on a dashboard.
If there is only one object on the dashboard that uses a form as a data source, thenthe entire POV/page of the form can be moved to the global POV bar.
If there is more than one object on a dashboard that use forms as a data source, thenthis is how the application determines which dimensions go in the global POV bar orstay in the local POV:
• If the dimension is in the POV or page of all the forms, and the member selectionis the same in all the forms, the dimension goes in the global POV bar.
• If the dimension is in the POV on one form and in the page of another form, thenthe dimension stays in the local POV.
• If the dimension is in the POV, then the same members must be selected in all theforms for the dimension.
Chapter 9About Global and Local POVs
9-12
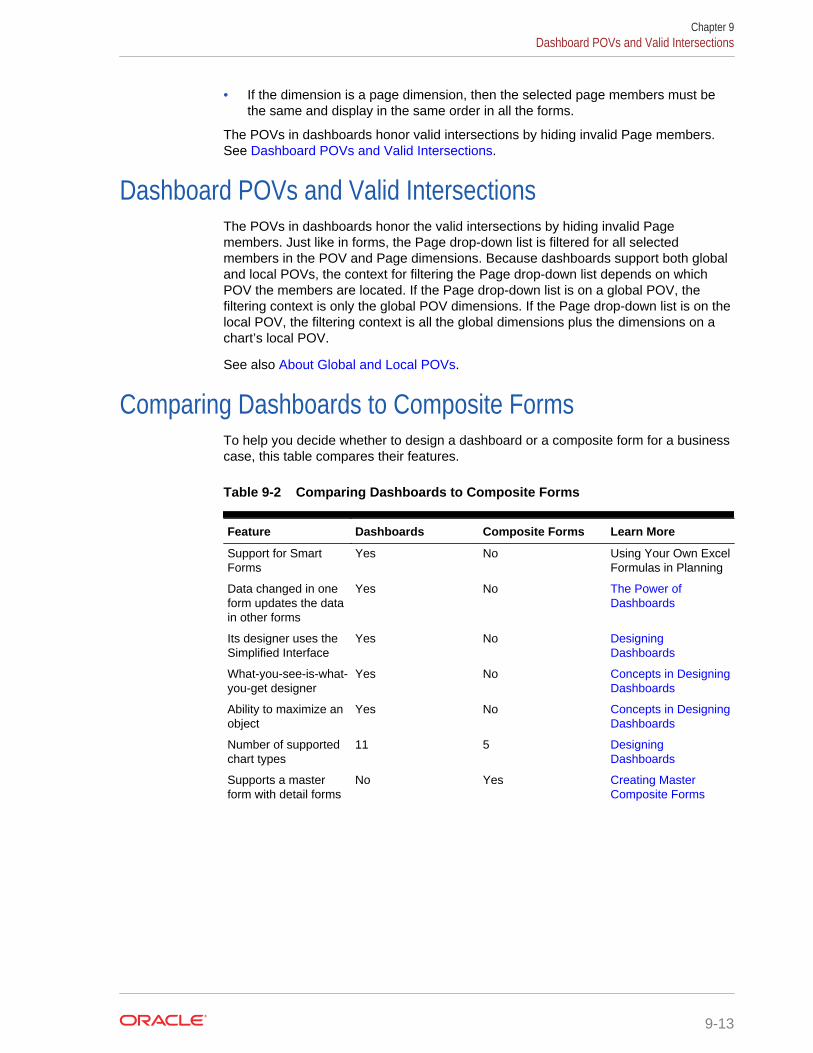
• If the dimension is a page dimension, then the selected page members must bethe same and display in the same order in all the forms.
The POVs in dashboards honor valid intersections by hiding invalid Page members.See Dashboard POVs and Valid Intersections.
Dashboard POVs and Valid IntersectionsThe POVs in dashboards honor the valid intersections by hiding invalid Pagemembers. Just like in forms, the Page drop-down list is filtered for all selectedmembers in the POV and Page dimensions. Because dashboards support both globaland local POVs, the context for filtering the Page drop-down list depends on whichPOV the members are located. If the Page drop-down list is on a global POV, thefiltering context is only the global POV dimensions. If the Page drop-down list is on thelocal POV, the filtering context is all the global dimensions plus the dimensions on achart’s local POV.
See also About Global and Local POVs.
Comparing Dashboards to Composite FormsTo help you decide whether to design a dashboard or a composite form for a businesscase, this table compares their features.
Table 9-2 Comparing Dashboards to Composite Forms
Feature Dashboards Composite Forms Learn More
Support for SmartForms
Yes No Using Your Own ExcelFormulas in Planning
Data changed in oneform updates the datain other forms
Yes No The Power ofDashboards
Its designer uses theSimplified Interface
Yes No DesigningDashboards
What-you-see-is-what-you-get designer
Yes No Concepts in DesigningDashboards
Ability to maximize anobject
Yes No Concepts in DesigningDashboards
Number of supportedchart types
11 5 DesigningDashboards
Supports a masterform with detail forms
No Yes Creating MasterComposite Forms
Chapter 9Dashboard POVs and Valid Intersections
9-13
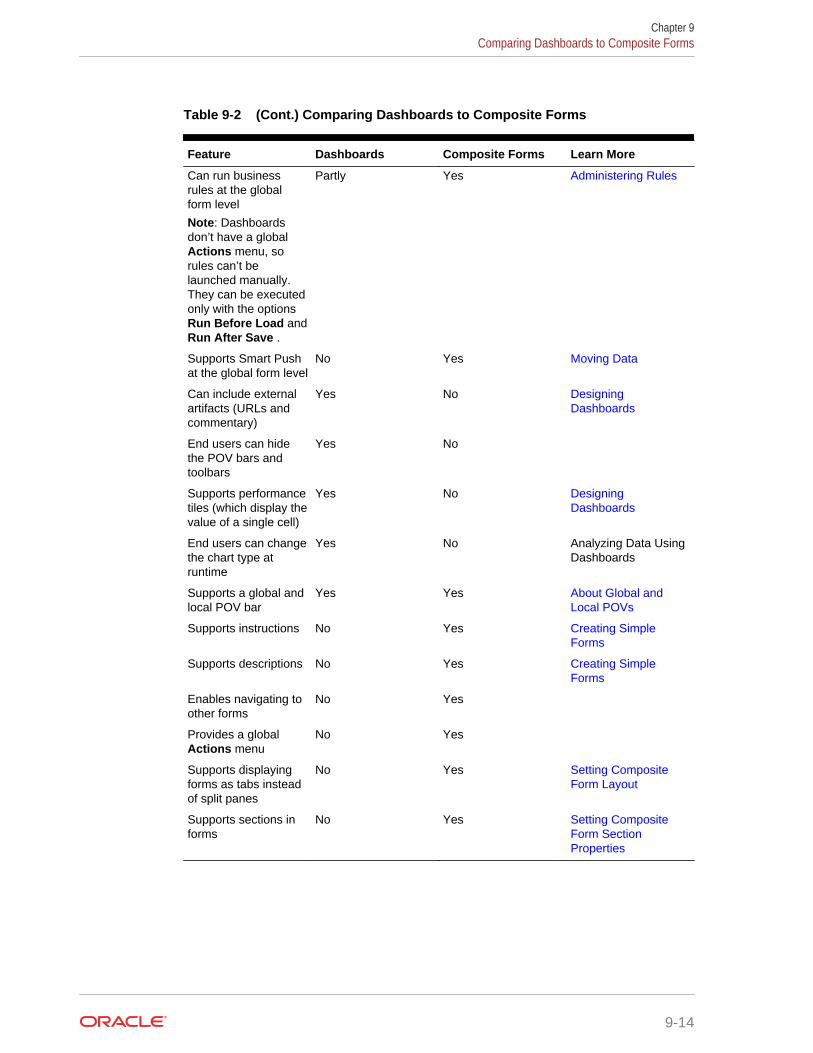
Table 9-2 (Cont.) Comparing Dashboards to Composite Forms
Feature Dashboards Composite Forms Learn More
Can run businessrules at the globalform level
Note: Dashboardsdon’t have a globalActions menu, sorules can’t belaunched manually.They can be executedonly with the optionsRun Before Load andRun After Save .
Partly Yes Administering Rules
Supports Smart Pushat the global form level
No Yes Moving Data
Can include externalartifacts (URLs andcommentary)
Yes No DesigningDashboards
End users can hidethe POV bars andtoolbars
Yes No
Supports performancetiles (which display thevalue of a single cell)
Yes No DesigningDashboards
End users can changethe chart type atruntime
Yes No Analyzing Data UsingDashboards
Supports a global andlocal POV bar
Yes Yes About Global andLocal POVs
Supports instructions No Yes Creating SimpleForms
Supports descriptions No Yes Creating SimpleForms
Enables navigating toother forms
No Yes
Provides a globalActions menu
No Yes
Supports displayingforms as tabs insteadof split panes
No Yes Setting CompositeForm Layout
Supports sections informs
No Yes Setting CompositeForm SectionProperties
Chapter 9Comparing Dashboards to Composite Forms
9-14
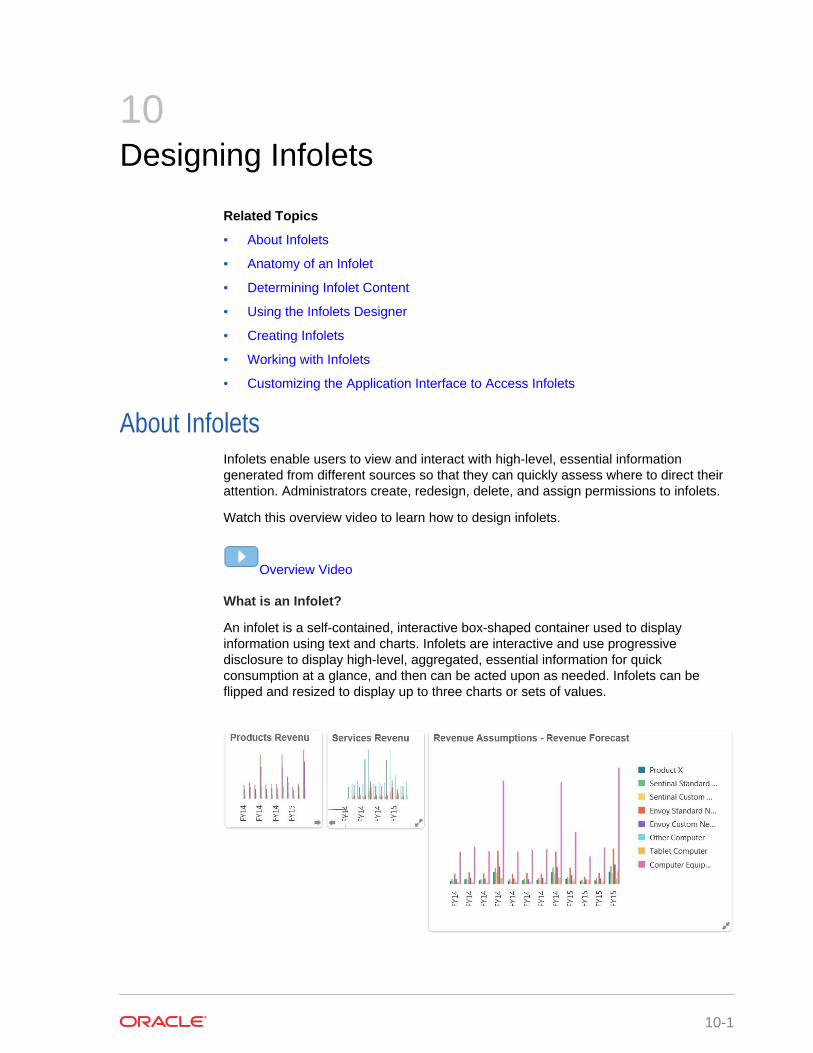
10Designing Infolets
Related Topics
• About Infolets
• Anatomy of an Infolet
• Determining Infolet Content
• Using the Infolets Designer
• Creating Infolets
• Working with Infolets
• Customizing the Application Interface to Access Infolets
About InfoletsInfolets enable users to view and interact with high-level, essential informationgenerated from different sources so that they can quickly assess where to direct theirattention. Administrators create, redesign, delete, and assign permissions to infolets.
Watch this overview video to learn how to design infolets.
Overview Video
What is an Infolet?
An infolet is a self-contained, interactive box-shaped container used to displayinformation using text and charts. Infolets are interactive and use progressivedisclosure to display high-level, aggregated, essential information for quickconsumption at a glance, and then can be acted upon as needed. Infolets can beflipped and resized to display up to three charts or sets of values.
10-1
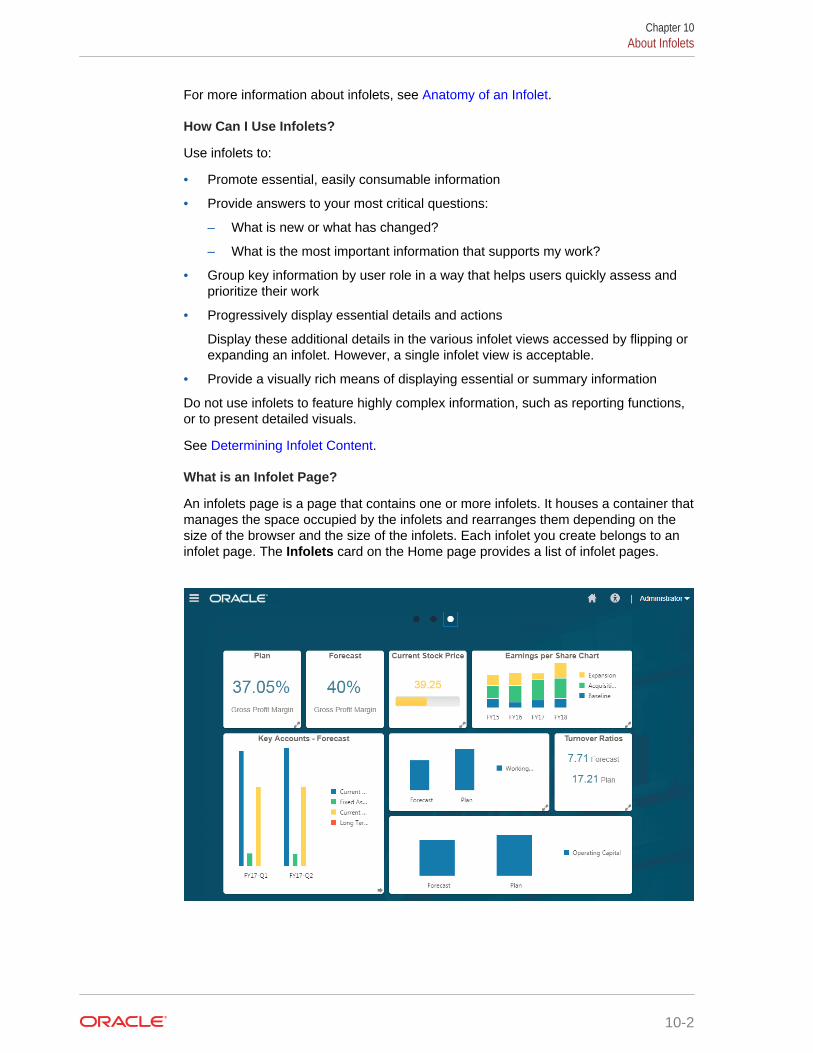
For more information about infolets, see Anatomy of an Infolet.
How Can I Use Infolets?
Use infolets to:
• Promote essential, easily consumable information
• Provide answers to your most critical questions:
– What is new or what has changed?
– What is the most important information that supports my work?
• Group key information by user role in a way that helps users quickly assess andprioritize their work
• Progressively display essential details and actions
Display these additional details in the various infolet views accessed by flipping orexpanding an infolet. However, a single infolet view is acceptable.
• Provide a visually rich means of displaying essential or summary information
Do not use infolets to feature highly complex information, such as reporting functions,or to present detailed visuals.
See Determining Infolet Content.
What is an Infolet Page?
An infolets page is a page that contains one or more infolets. It houses a container thatmanages the space occupied by the infolets and rearranges them depending on thesize of the browser and the size of the infolets. Each infolet you create belongs to aninfolet page. The Infolets card on the Home page provides a list of infolet pages.
Chapter 10About Infolets
10-2
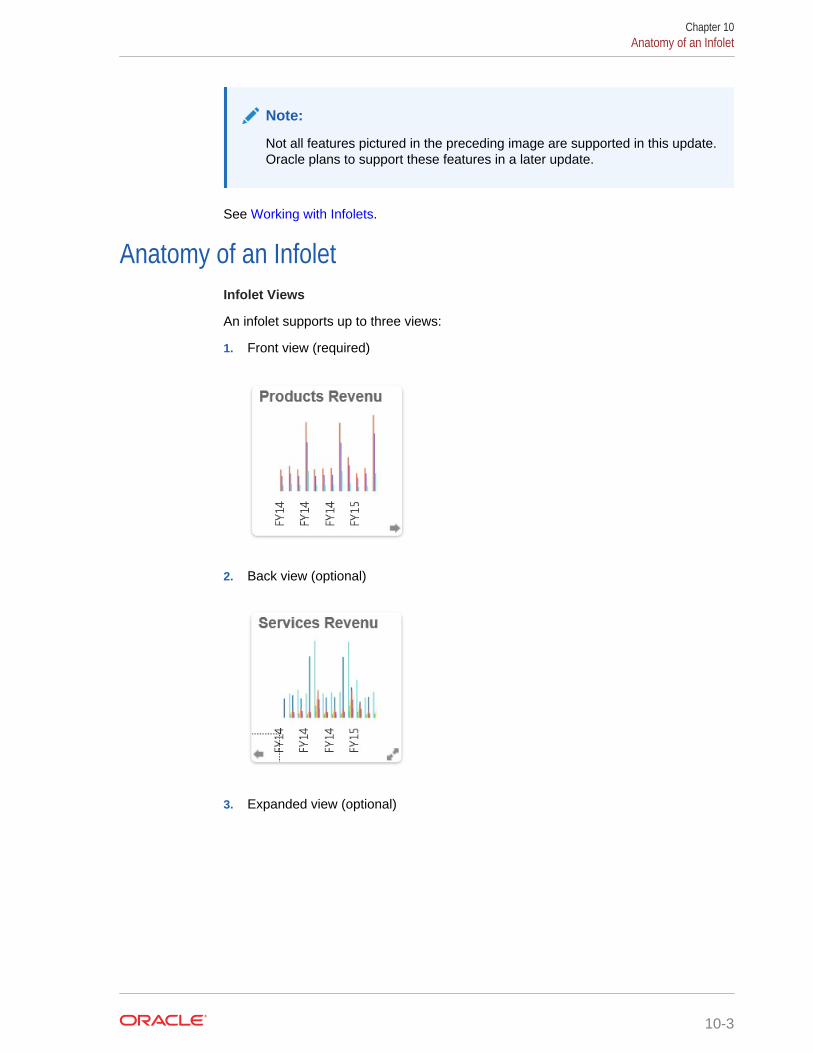
Note:
Not all features pictured in the preceding image are supported in this update.Oracle plans to support these features in a later update.
See Working with Infolets.
Anatomy of an InfoletInfolet Views
An infolet supports up to three views:
1. Front view (required)
2. Back view (optional)
3. Expanded view (optional)
Chapter 10Anatomy of an Infolet
10-3
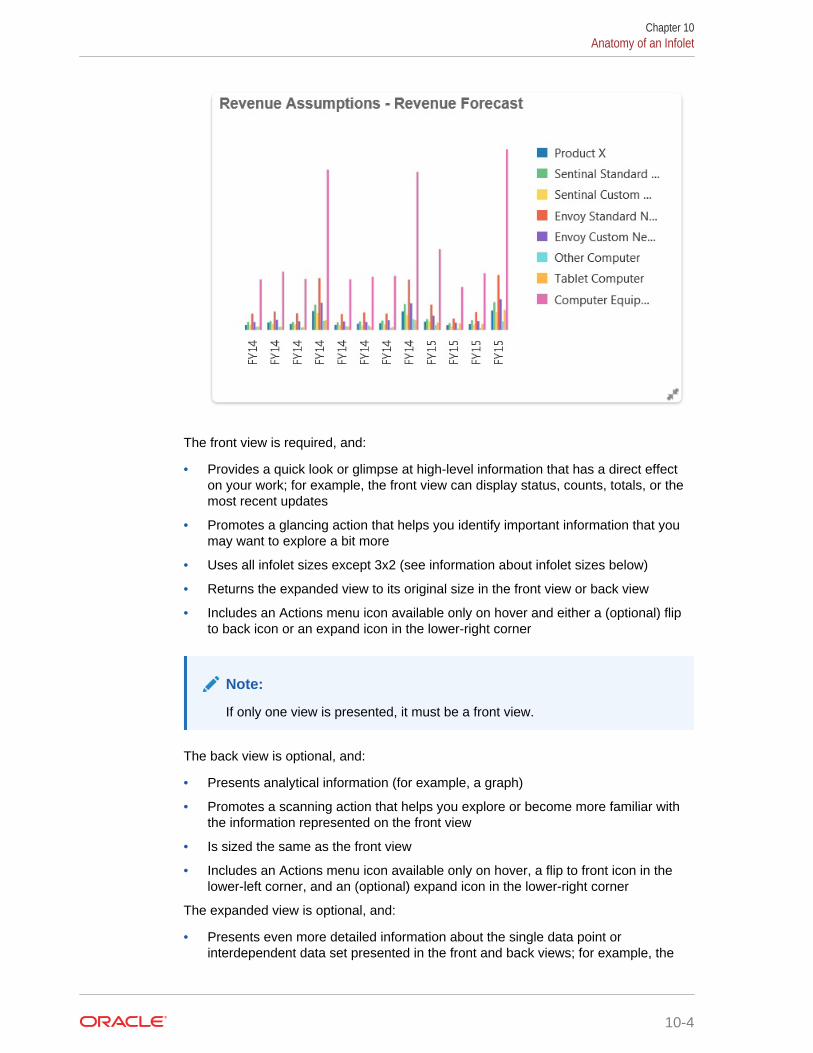
The front view is required, and:
• Provides a quick look or glimpse at high-level information that has a direct effecton your work; for example, the front view can display status, counts, totals, or themost recent updates
• Promotes a glancing action that helps you identify important information that youmay want to explore a bit more
• Uses all infolet sizes except 3x2 (see information about infolet sizes below)
• Returns the expanded view to its original size in the front view or back view
• Includes an Actions menu icon available only on hover and either a (optional) flipto back icon or an expand icon in the lower-right corner
Note:
If only one view is presented, it must be a front view.
The back view is optional, and:
• Presents analytical information (for example, a graph)
• Promotes a scanning action that helps you explore or become more familiar withthe information represented on the front view
• Is sized the same as the front view
• Includes an Actions menu icon available only on hover, a flip to front icon in thelower-left corner, and an (optional) expand icon in the lower-right corner
The expanded view is optional, and:
• Presents even more detailed information about the single data point orinterdependent data set presented in the front and back views; for example, the
Chapter 10Anatomy of an Infolet
10-4
expanded view can display more details about an object or a list of recent itemsthan what's displayed on either the front or back view
• Provides enough information to help you decide if you're ready to take action andmove to a focused context on a work area page
• Transitions smoothly from other views. You see a smooth, seamless expansion,as one infolet pushes others into new positions.
• Must be sized bigger than the front or back views
• Includes an Actions menu icon available only on hover, and a collapse icon in thelower-right corner
Infolet views honor the access permissions assigned to the underlying forms anddimensions. Therefore, the same infolet may display varying views from user to user ifthey have different access permissions.
Infolet Sizes
Infolets can be sized as follows:
Note:
1x1 refers to a box that spans one column and row width (170 pixels).
• 1x1
• 2x1
• 3x1
• 2x2
• 3x2 (expanded view only)
The size of the front and the back views are always the same. Changing the size ofthe front view will automatically reset the size of the back view. Because the size of theexpanded view must always be greater than the size of the front/back views, if the sizeof the front/back view of an infolet is enlarged, the expanded view automatically resetsto a larger size than the front/back view.
Note:
Front and back views cannot use the 3x2 size. This size is applicable for theexpanded view only.
The size and title of a view is set by the designer in the properties box using the infoletmenu. See Using the Infolets Designer.
Navigating Between Infolet Views
An infolet can be created with one of the following view combinations:
1. Front view only
2. Front and back views
Chapter 10Anatomy of an Infolet
10-5
3. Front and expanded views
4. Front, back, and expanded views
Switching from one view to another is controlled by clicking a flip icon, an expand icon,or a collapse icon available in the bottom-right or bottom-left corner of the infolet.Hovering your cursor over the bottom corners reveals a flip, expand, or collapse icon.
Determining Infolet ContentConsider the following general tips when determining infolet content:
• Look to existing dashboards and work area pages.
Dashboards and work area pages are excellent starting points because theydisplay collections of information summaries.
• Apply the 10/90/90 principle.
Seek out the most essential, easily consumable information that addressesfrequently asked questions garnered from the top 10 percent of use cases. Theseuse cases can come from across your enterprise—from business intelligence,social, transactional, external, and so on.
Then focus this information to reveal what 90 percent of your users would benefitfrom viewing 90 percent of the time. You can apply this 10/90/90 percent principleto existing dashboard content, to existing work area page content, or generally, topercolate eligible information for an infolet.
• Restate your top use cases in the form of frequently asked business questions.
Present the corresponding infolet content in such a way as to answer thesebusiness questions; for example, how many orders are in jeopardy, listed bystatus?
• Look for one point or a tightly related, interdependent set of points, instead ofmultiple points of information.
The process of determining content for an infolet is similar to the process that isused to yield dashboard content—but to a deeper level of analysis. Look forinformation within a data point or data set that is suitable to be displayed in nomore than three views of information hierarchy and that answers a criticalbusiness question.
• Start with the single most important point.
An infolet displays aggregated information about a single data aspect or point ofinformation in relation to an event that the user needs to know about or a task thatthe user needs to address.
If a dashboard contains multiple aspects about one or more objects (for example,numeric totals and currency totals), start with the single most important point andadd that as a simple overview (for example, as a total using a stylized numericvalue) to the front view of an infolet. Then determine the content for the back view,if needed. Finally, determine the content for the expanded view, if needed.
An infolet should have no more than three views. If there is only a single data pointor only one tightly related, interdependent data set to display on an infolet, useonly the front view.
Chapter 10Determining Infolet Content
10-6
Related Links
Designing Forms for Infolets
Designing Charts for Infolets
Designing Forms for InfoletsUse only simple forms with small data sets in infolets. Permissions that are set forforms are honored in infolets.
You can create forms that are specifically used in infolets:
• Forms used in infolets should have fewer cells than a traditional data entry form;for example, forms used in infolets should only have up to 12 cells.
• Forms used in infolets should have no more than 12 rows and columns. If a formhas more than 12 rows and columns, the infolet will only display the first 12 rowsand columns.
• Infolets currently don't support Page dimensions or POVs, therefore forms used ininfolets should not contain Page dimensions.
• If a form that is used in infolets contains a grid with members that expand, theinfolet will display all the members in the form, including the expanded members.
Designing Charts for InfoletsUse the title and subtitle in charts to show static context.
There are six types of charts that you can use in infolets:
• Bar—Displays a graphical summary of multiple data values for comparisonpurposes. Bar charts can be plotted vertically or horizontally. Up to eight bars arerecommended for bar chart infolets.
• Column—Displays stacked bars that represent different data sets on top of eachother. The height of the resulting bar shows the combined result of the data sets.
• Pie—A circular graph which is divided into slices to compare data sets to oneanother. Up to six slices are recommended for pie chart infolets.
• Doughnut—A circular graph which is divided into segments to compare data setsto one another. The blank center displays the sum of all data sets. Up to sixsegment values are recommended for doughnut chart infolets.
• Line—Use to visualize a trend in data over intervals of time.
• Tile—Lets you select specific values from a data set to display. No more thanthree values are recommended for tile chart infolets.
Note:
Tile charts can only use the 1x1 size. You cannot resize an infolet usingthe tile chart until the chart type is changed. If you drag and drop a tilechart to an infolet that is greater than 1x1, you will be prompted tochange either the size of the infolet or the chart type.
Chapter 10Determining Infolet Content
10-7
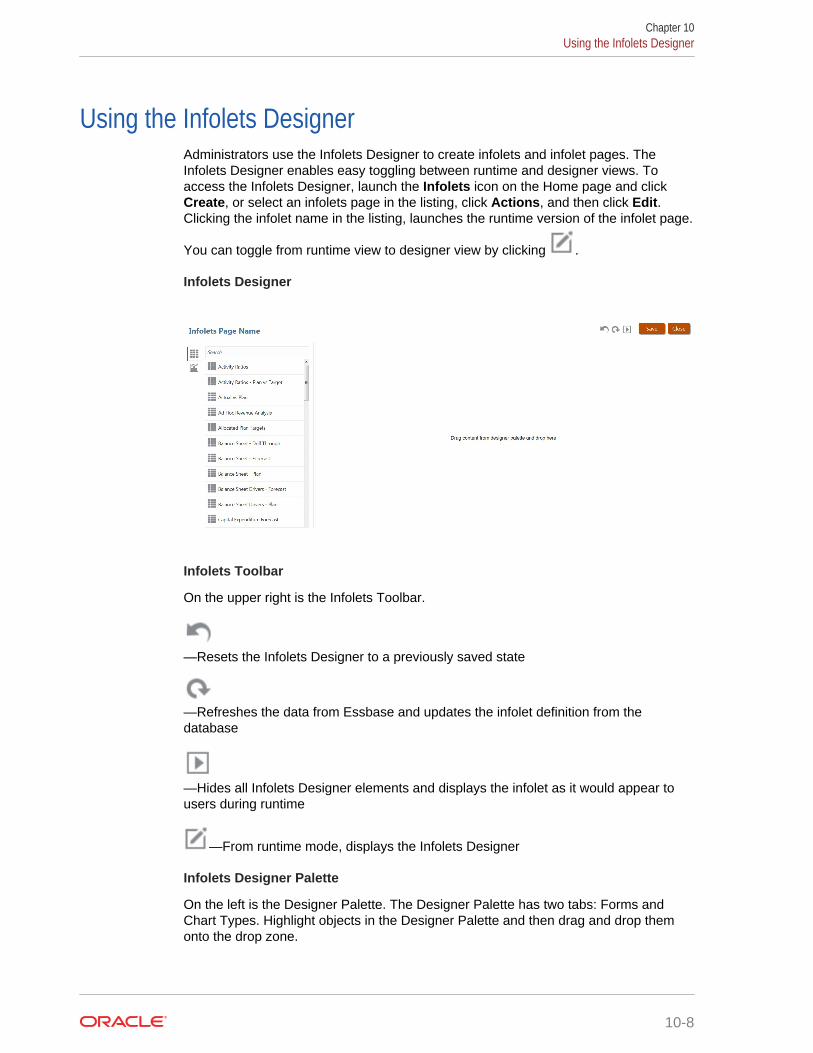
Using the Infolets DesignerAdministrators use the Infolets Designer to create infolets and infolet pages. TheInfolets Designer enables easy toggling between runtime and designer views. Toaccess the Infolets Designer, launch the Infolets icon on the Home page and clickCreate, or select an infolets page in the listing, click Actions, and then click Edit.Clicking the infolet name in the listing, launches the runtime version of the infolet page.
You can toggle from runtime view to designer view by clicking .
Infolets Designer
Infolets Toolbar
On the upper right is the Infolets Toolbar.
—Resets the Infolets Designer to a previously saved state
—Refreshes the data from Essbase and updates the infolet definition from thedatabase
—Hides all Infolets Designer elements and displays the infolet as it would appear tousers during runtime
—From runtime mode, displays the Infolets Designer
Infolets Designer Palette
On the left is the Designer Palette. The Designer Palette has two tabs: Forms andChart Types. Highlight objects in the Designer Palette and then drag and drop themonto the drop zone.
Chapter 10Using the Infolets Designer
10-8
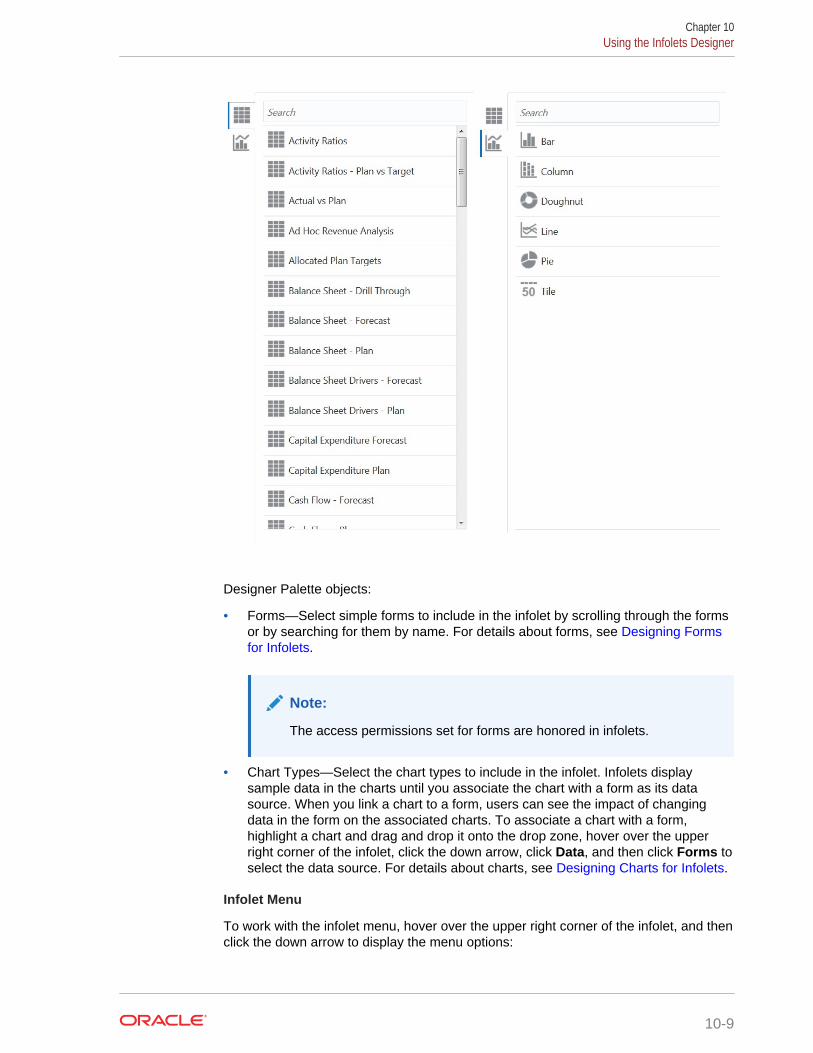
Designer Palette objects:
• Forms—Select simple forms to include in the infolet by scrolling through the formsor by searching for them by name. For details about forms, see Designing Formsfor Infolets.
Note:
The access permissions set for forms are honored in infolets.
• Chart Types—Select the chart types to include in the infolet. Infolets displaysample data in the charts until you associate the chart with a form as its datasource. When you link a chart to a form, users can see the impact of changingdata in the form on the associated charts. To associate a chart with a form,highlight a chart and drag and drop it onto the drop zone, hover over the upperright corner of the infolet, click the down arrow, click Data, and then click Forms toselect the data source. For details about charts, see Designing Charts for Infolets.
Infolet Menu
To work with the infolet menu, hover over the upper right corner of the infolet, and thenclick the down arrow to display the menu options:
Chapter 10Using the Infolets Designer
10-9
• Layout—Enables you to edit the infolet header and subtitle.
Note:
The header you specify is the same for all views of an infolet, but youcan specify a different subtitle for each view; for example, the front, back,and expanded views of an infolet can each have different subtitles, butthey must have the same header.
• Chart Type—Displays the infolet data as the selected chart type
• Size—Displays the infolet in the selected size
• Data—Associates the infolet with a data source
• Delete—Removes the infolet from the page
• Clear—Clears infolet details
Creating InfoletsTo create infolets:
1. From the Home page, click Infolets, and then click Create.
2. Click Infolets Page Name, and enter a title for the new infolets page you arecreating.
3. From the designer palette on the left, choose either the Forms tab or the ChartsType tab, highlight an object, and then drag and drop it onto the infolets dropzone.
4. Customize the infolet using the infolet menu, and then click Save.
You can easily duplicate and modify an infolet using the Copy As action on the Infoletlist page. Select the infolet, click Actions, and then click Copy As.
Working with InfoletsOnce you've created an infolets page, it is displayed in the infolets listing on theInfolets card.
To view and work with infolets:
1. From the Home page, click Infolets.
2. To work with infolets, perform an action:
• To create infolets, click Create. See Creating Infolets.
• To refresh the infolets listing, click Refresh.
• To perform the following actions on infolet pages, click the Actions icon nextto the infolet page, and then select:
– Edit
– Rename
– Copy As
Chapter 10Creating Infolets
10-10
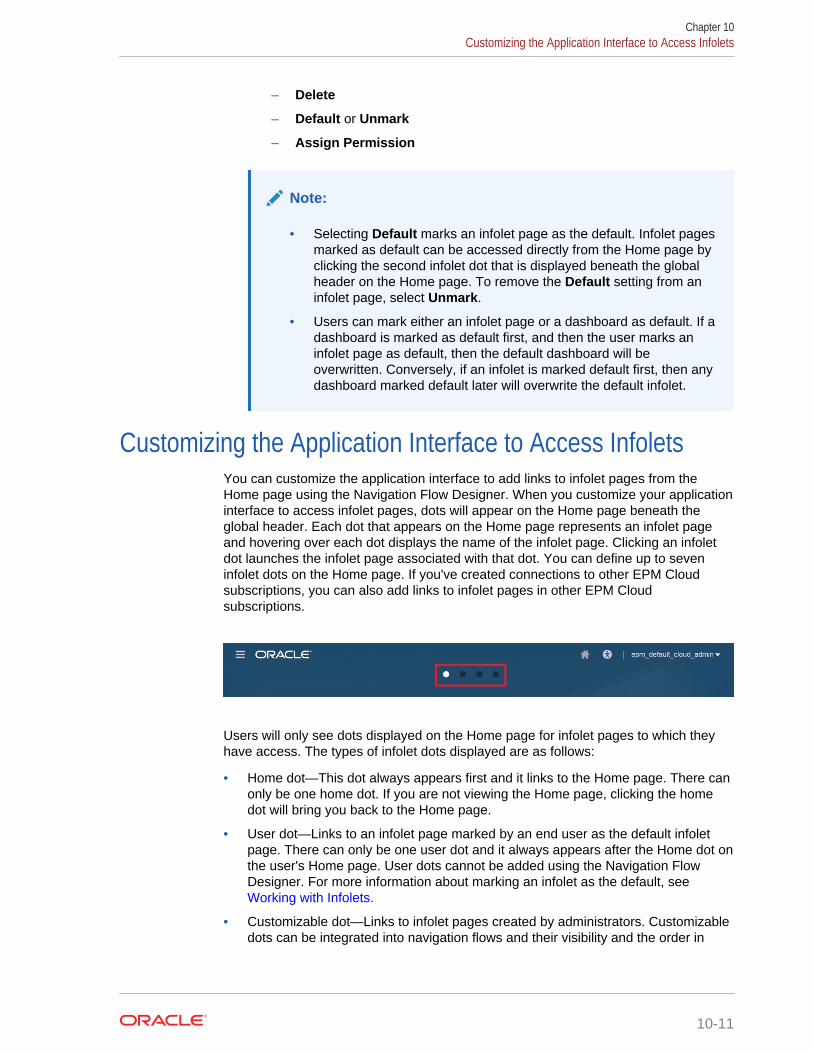
– Delete
– Default or Unmark
– Assign Permission
Note:
• Selecting Default marks an infolet page as the default. Infolet pagesmarked as default can be accessed directly from the Home page byclicking the second infolet dot that is displayed beneath the globalheader on the Home page. To remove the Default setting from aninfolet page, select Unmark.
• Users can mark either an infolet page or a dashboard as default. If adashboard is marked as default first, and then the user marks aninfolet page as default, then the default dashboard will beoverwritten. Conversely, if an infolet is marked default first, then anydashboard marked default later will overwrite the default infolet.
Customizing the Application Interface to Access InfoletsYou can customize the application interface to add links to infolet pages from theHome page using the Navigation Flow Designer. When you customize your applicationinterface to access infolet pages, dots will appear on the Home page beneath theglobal header. Each dot that appears on the Home page represents an infolet pageand hovering over each dot displays the name of the infolet page. Clicking an infoletdot launches the infolet page associated with that dot. You can define up to seveninfolet dots on the Home page. If you've created connections to other EPM Cloudsubscriptions, you can also add links to infolet pages in other EPM Cloudsubscriptions.
Users will only see dots displayed on the Home page for infolet pages to which theyhave access. The types of infolet dots displayed are as follows:
• Home dot—This dot always appears first and it links to the Home page. There canonly be one home dot. If you are not viewing the Home page, clicking the homedot will bring you back to the Home page.
• User dot—Links to an infolet page marked by an end user as the default infoletpage. There can only be one user dot and it always appears after the Home dot onthe user's Home page. User dots cannot be added using the Navigation FlowDesigner. For more information about marking an infolet as the default, see Working with Infolets.
• Customizable dot—Links to infolet pages created by administrators. Customizabledots can be integrated into navigation flows and their visibility and the order in
Chapter 10Customizing the Application Interface to Access Infolets
10-11
which they appear is determined by the navigation flow designer. There can be upto seven customizable dots and they always appear after the home and user dots.
To add infolet dots to your application interface using the Navigation Flow Designer:
1. From the Home page, click Tools, and then click Navigation Flows.
2. Select an inactive navigation flow in the listing, and then click the Infolets tab onthe Navigation Flow Designer.
3. Click .
4. In Manage Infolet, name the infolet dot, set visibility, and then click to selectan infolet in the Artifact Library.
Note:
You can select an infolet from another EPM Cloud subscription if you'vecreated connections to other subscriptions. First select the subscriptionunder My Connections, and then navigate to the infolet in thatsubscription.
5. Click Save and Close.
Note:
Infolets can also be associated with a tab or a card in a navigation flow.While adding or updating a tab or a card, select an infolet in the ArtifactLibrary.
To view design time changes to the navigation flow, activate the navigation flow, andthen from the Home page, click the down arrow next to the user name (upper rightcorner of the screen) and click Reload Navigation Flow.
To learn more about designing navigation flows, see "Designing Custom NavigationFlows" in your Administering guide.
To learn more about connecting EPM Cloud subscriptions, see "ConnectingSubscriptions in EPM Cloud" in your Administering guide.
Chapter 10Customizing the Application Interface to Access Infolets
10-12
11Managing Sandboxes
Enable planners to use sandboxes to keep their work private while experimenting withvarious outcomes as they develop their plans.
Related Topics
• About Sandboxes
• Enabling Sandboxes
• Enabling Version Members
• How Sandboxes Work with HSP_View and Version Members
• What Happens When a Sandbox is Published?
• Managing Sandboxes
• Sandboxes and Other Functionality
About SandboxesSandboxes enable planners to keep their work private (from other non-administrators)as they develop their plans (see "Building a Plan Privately" in the Working withPlanning for Oracle Planning and Budgeting Cloud). Planners may want to privatelyexperiment with various outcomes in a sandbox without having others see theirnumbers until they've completed their analysis. When they're ready to make theirnumbers public (to others having access to them), they publish the data in thesandbox.
Some basics about sandboxes:
• Sandboxes are enabled at the cube level. You can select the Enable Sandboxesoption for block storage cubes that are seeded when you create the application.You can also select the Enable Sandboxes when you create a new block storagecube. You can’t later change the Enable Sandboxes option for existing cubes,including cubes created by default such as Plan1. See Enabling Sandboxes.
• By default, forms and ad hoc grids are in base view. When a planner startsworking in a sandbox, the form switches from base view to sandbox view. Insandbox view, the planner's data is saved independently of the application's data.When planners are done privately modifying and analyzing data in the sandbox,they publish the sandbox. When published, the new and changed data is saved tothe application. The form is then back in base view. See What Happens When aSandbox is Published?.
• To provide access to sandboxes for users with the Planner role, you must enablethe Apply Security option for the Version dimension. See also EnablingSandboxes and Enabling Version Members.
• All access permissions are in effect in sandboxes, including security on approvalunits. For example, if the Version member is part of an approval unit that is in theapprovals process, planners have write access only when they are the currentowner of the approval unit.
11-1
• Planners can have multiple sandboxes and switch among them.
Note:
If a planner switches to a sandbox from a composite form, all the formsthat comprise the composite form also switch to sandbox view.
• Multiple planners can simultaneously work in multiple sandboxes without affectingeach other's work.
• Administrators can see the names of (and data in) all sandboxes, which versionmember they're based on, who created each one, when they were last modified.Administrators can also delete anyone's sandbox. To manage sandboxes, fromthe Home page, click Application, then click Overview, then Actions, and thenManage Sandboxes.
• Because dynamic members are automatically calculated, planners canimmediately see the effect of their changes.
• When a cube is enabled for sandboxes, a dimension called HSP_View is added,with three members: BaseData, SandboxData, and ConsolidatedData. See HowSandboxes Work with HSP_View and Version Members.
• When working in a sandbox, planners can add members, but those membersaren't added to the base version when the sandbox is published.
Enabling SandboxesTo enable sandboxes:
1. When you create an application, a block storage cube is created, which you canenable for sandboxes by selecting Enable for the Sandboxes option. You canalso enable sandboxes when you create custom block storage cubes by selectingEnable Sandboxes.
You can enable sandboxes only in Standard applications and for custom cubescreated in Enterprise applications, not for Reporting applications. After you enablesandboxes for a cube, you can’t later disable that option. If you enable sandboxesfor a cube, Version members have the Enable Sandboxes option.
2. Create and enable Version members for sandboxes, as described in EnablingVersion Members.
3. If needed, modify member formulas so that they calculate correctly in both baseview and sandbox view.
Member formulas may be impacted by the new HSP_View dimension. To ensurethat member formulas use the correct data for all versions, they must reference“ConsolidatedData”/Sandbox.
See:
• The topics in How Sandboxes Work with HSP_View and Version Members
• Working with Member Formulas
Chapter 11Enabling Sandboxes
11-2
Note:
In Data Maps, all data mapping occurs at the HSP_View BaseDataintersection. The base view is selected by default.
4. Design or modify forms that you want to support sandboxes so that either:
• The Version dimension is on the Page axis.
• The Version dimension is a POV that has a user variable.
Note:
– Forms that don't meet one of the above conditions do not displaysandbox options.
– In a sandbox, the HSP_View member is fixed on the POV andcan't be changed.
– The only business rules that planners can run in a sandbox arethe default Calculate Form and Calculate Currencies rules.
– You can't import or export when you're in the sandbox view.
Enabling Version MembersTo make versions available to sandboxes, administrators create Version members andthen select the member property Enable Sandboxes.
When planners switch to sandbox view, they select an enabled Version member, andthen the data in the sandbox is tied to that version. When the planner switches back tobase view, the base version data is displayed. If a planner publishes their sandboxdata, the modified data in the sandbox is saved to the application and displays in thebase view. See How Sandboxes Work with HSP_View and Version Members and What Happens When a Sandbox is Published?.
Tip:
To edit member properties, from the Home page, click Navigator , andthen under Create and Manage, click Dimensions.
Note that the Dimensions link is available only if you're accessing theapplication from the desktop.
Chapter 11Enabling Version Members
11-3
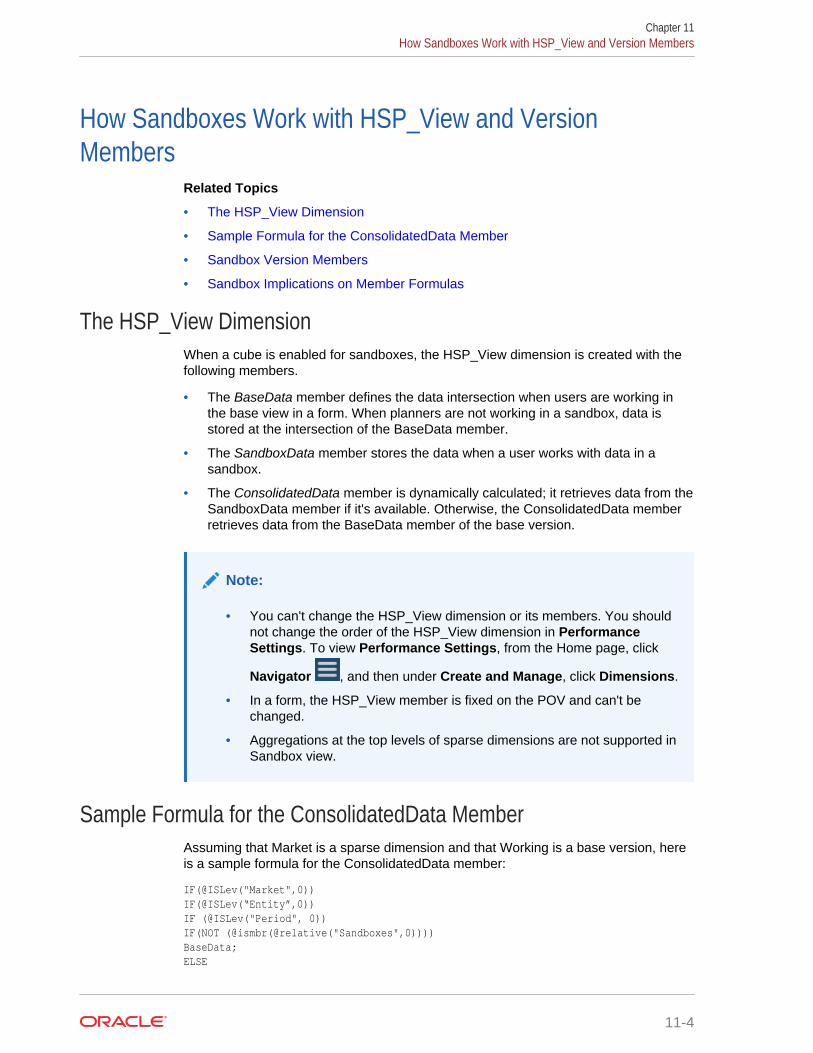
How Sandboxes Work with HSP_View and VersionMembers
Related Topics
• The HSP_View Dimension
• Sample Formula for the ConsolidatedData Member
• Sandbox Version Members
• Sandbox Implications on Member Formulas
The HSP_View DimensionWhen a cube is enabled for sandboxes, the HSP_View dimension is created with thefollowing members.
• The BaseData member defines the data intersection when users are working inthe base view in a form. When planners are not working in a sandbox, data isstored at the intersection of the BaseData member.
• The SandboxData member stores the data when a user works with data in asandbox.
• The ConsolidatedData member is dynamically calculated; it retrieves data from theSandboxData member if it's available. Otherwise, the ConsolidatedData memberretrieves data from the BaseData member of the base version.
Note:
• You can't change the HSP_View dimension or its members. You shouldnot change the order of the HSP_View dimension in PerformanceSettings. To view Performance Settings, from the Home page, click
Navigator , and then under Create and Manage, click Dimensions.
• In a form, the HSP_View member is fixed on the POV and can't bechanged.
• Aggregations at the top levels of sparse dimensions are not supported inSandbox view.
Sample Formula for the ConsolidatedData MemberAssuming that Market is a sparse dimension and that Working is a base version, hereis a sample formula for the ConsolidatedData member:
IF(@ISLev("Market",0))IF(@ISLev(“Entity”,0))IF (@ISLev("Period", 0))IF(NOT (@ismbr(@relative("Sandboxes",0))))BaseData;ELSE
Chapter 11How Sandboxes Work with HSP_View and Version Members
11-4
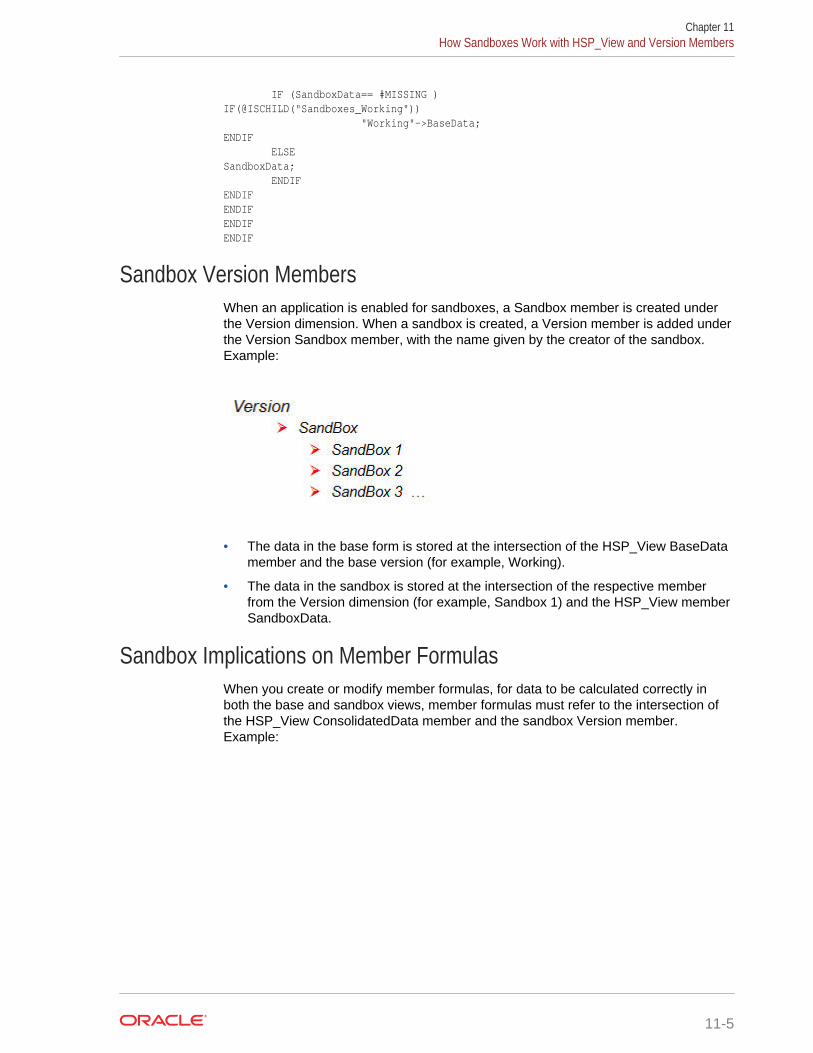
IF (SandboxData== #MISSING ) IF(@ISCHILD("Sandboxes_Working")) "Working"->BaseData;ENDIF ELSESandboxData; ENDIF ENDIFENDIFENDIFENDIF
Sandbox Version MembersWhen an application is enabled for sandboxes, a Sandbox member is created underthe Version dimension. When a sandbox is created, a Version member is added underthe Version Sandbox member, with the name given by the creator of the sandbox.Example:
• The data in the base form is stored at the intersection of the HSP_View BaseDatamember and the base version (for example, Working).
• The data in the sandbox is stored at the intersection of the respective memberfrom the Version dimension (for example, Sandbox 1) and the HSP_View memberSandboxData.
Sandbox Implications on Member FormulasWhen you create or modify member formulas, for data to be calculated correctly inboth the base and sandbox views, member formulas must refer to the intersection ofthe HSP_View ConsolidatedData member and the sandbox Version member.Example:
Chapter 11How Sandboxes Work with HSP_View and Version Members
11-5
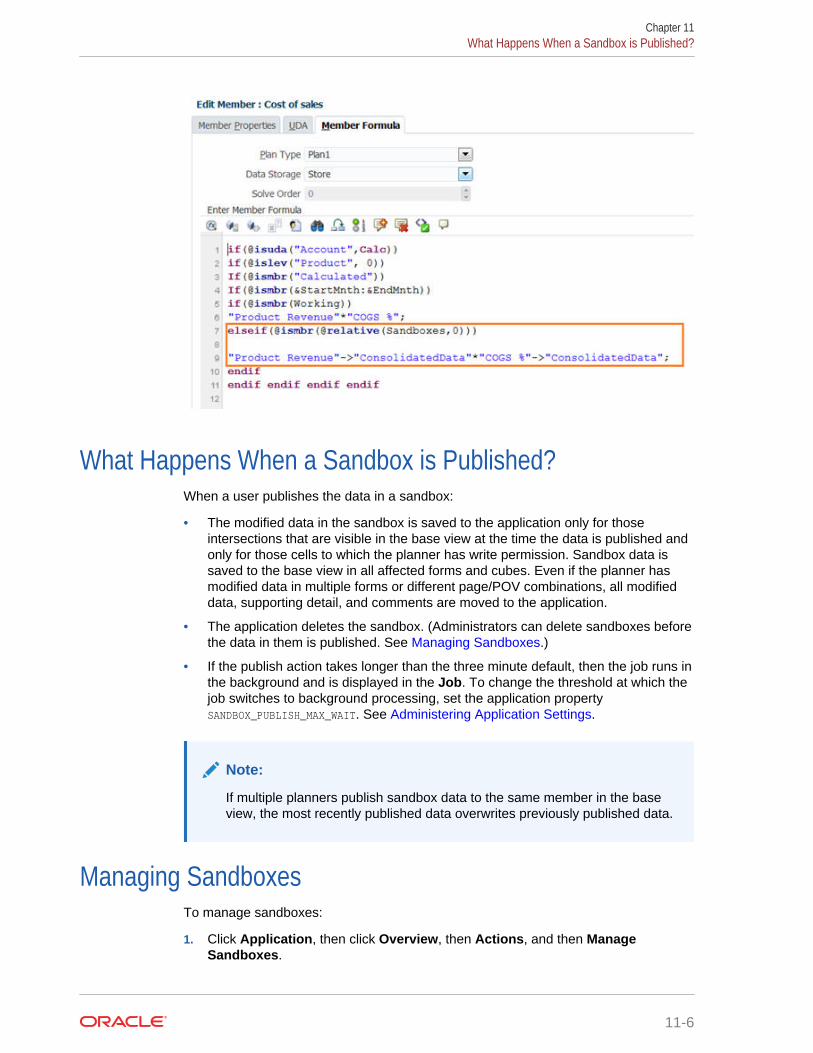
What Happens When a Sandbox is Published?When a user publishes the data in a sandbox:
• The modified data in the sandbox is saved to the application only for thoseintersections that are visible in the base view at the time the data is published andonly for those cells to which the planner has write permission. Sandbox data issaved to the base view in all affected forms and cubes. Even if the planner hasmodified data in multiple forms or different page/POV combinations, all modifieddata, supporting detail, and comments are moved to the application.
• The application deletes the sandbox. (Administrators can delete sandboxes beforethe data in them is published. See Managing Sandboxes.)
• If the publish action takes longer than the three minute default, then the job runs inthe background and is displayed in the Job. To change the threshold at which thejob switches to background processing, set the application propertySANDBOX_PUBLISH_MAX_WAIT. See Administering Application Settings.
Note:
If multiple planners publish sandbox data to the same member in the baseview, the most recently published data overwrites previously published data.
Managing SandboxesTo manage sandboxes:
1. Click Application, then click Overview, then Actions, and then ManageSandboxes.
Chapter 11What Happens When a Sandbox is Published?
11-6
2. To filter the list of sandboxes, click , and then complete any of these fields:
• Sandbox Name
• Base Version
• Created By
3. To delete sandboxes, click their names, and then Delete.
Sandboxes and Other Functionality• Oracle Smart View for Office:
– Sandbox functionality is available in Smart View, though you can't create,delete, or publish data from Smart View.
– In ad hoc analysis, users can see the HSP_View members, which includessandbox and base data.
– Selecting the ConsolidatedData member displays the data entered in both thesandbox and the original base data.
– Sandboxes are supported for Smart Slices, but the HSP_View dimension ishidden.
– In Planning Admin Extensions, the HSP_View dimension is displayed underDimensions, but you can't change member properties. Likewise, you can'tchange the member properties of sandbox Version members.
• Financial Reporting: To report on base view data, select the BaseData member ofthe HSP_View dimension. To report on sandbox data, select theConsolidatedData member for HSP_View.
• Data Management: The HSP_View dimension is visible in the mappings, but youcan map only the BaseData member.
• Migration: If you clone an application using Migration, Oracle recommends thatyou select the Sandbox Changes option. If you're importing sandboxes and data,you must select Sandbox Changes if you want to publish the sandbox data.
• Oracle Hyperion Public Sector Planning and Budgeting: Decision Packages andBudget Requests don't support sandboxes.
Chapter 11Sandboxes and Other Functionality
11-7
12Defining Valid Intersections
Define valid intersection rules which filter certain cell intersections to users when theyenter data or select runtime prompts.
Related Topics
• Understanding Valid Intersections
• Creating Valid Intersections
• Managing Valid Intersections
• Suppressing Invalid Data in Forms
• Clearing Invalid Data
• Working with Valid Intersections
Understanding Valid IntersectionsValid intersections enable you to define rules, called valid intersection rules, whichfilter certain cell intersections to users when they enter data or select runtime prompts.For example, you can specify that certain programs are valid only for some periods ordepartments.
After valid intersections are defined, cells containing invalid data are read-only. Thisrestriction speeds the planning process and optimizes the information available tousers.
To better understand how valid intersections affect behavior in forms and in runtimeprompts, see Working with Valid Intersections.
Watch this tutorial video to learn how manage valid intersections.
Tutorial Video
• Valid Intersection Groups
• Valid Intersection Rules
• Anchor and Nonanchor Dimensions
• Valid Intersection Examples
• Redundancy or Overlap in Valid Intersection Rules
• Shared Members and Valid Intersection Rules
• Substitution Variables and Valid Intersection Rules
• Evaluation Order
12-1
Valid Intersection GroupsValid intersection groups define:
• Dimensions to be included
• One of those dimensions as the anchor dimension
• Whether nonanchor dimensions are required or not
• Whether the anchor dimension members not specified or referenced will be validor invalid
Valid Intersection RulesValid intersection rules:
• Must use the same dimensions that were defined within their valid intersectiongroup
• Define only valid intersections
• Valid intersection rules within the same valid intersection group that produce anapparent conflict or overlap, are marked valid if either valid intersection rulecondition is met
• Valid intersection rules in different valid intersection groups that produce anapparent redundancy or overlap, are marked valid if they satisfy the requirementsof all valid intersection groups
Thus, if any valid intersection group marks an intersection invalid, regardless ofother valid intersection groups making it valid, the system will mark the intersectioninvalid. Invalid groups override valid group results.
Note:
If you want to remove valid intersections regardless of what other validintersection groups allow, then this rule must be in a different validintersection group.
See Valid Intersection Examples.
Anchor and Nonanchor DimensionsAnchor and nonanchor dimensions:
• Anchor dimensions are always required dimensions in the cube that is used in thevalid intersection evaluation.
• Nonanchor dimensions are either required or not:
– If a nonanchor dimension is required, any cube that doesn't use thatdimension will ignore any valid intersection group where that dimension istagged as required as it evaluates the valid intersections.
– If a nonanchor dimension isn't required, any cube that doesn't use thatdimension will still evaluate any valid intersection group that includes that
Chapter 12Understanding Valid Intersections
12-2
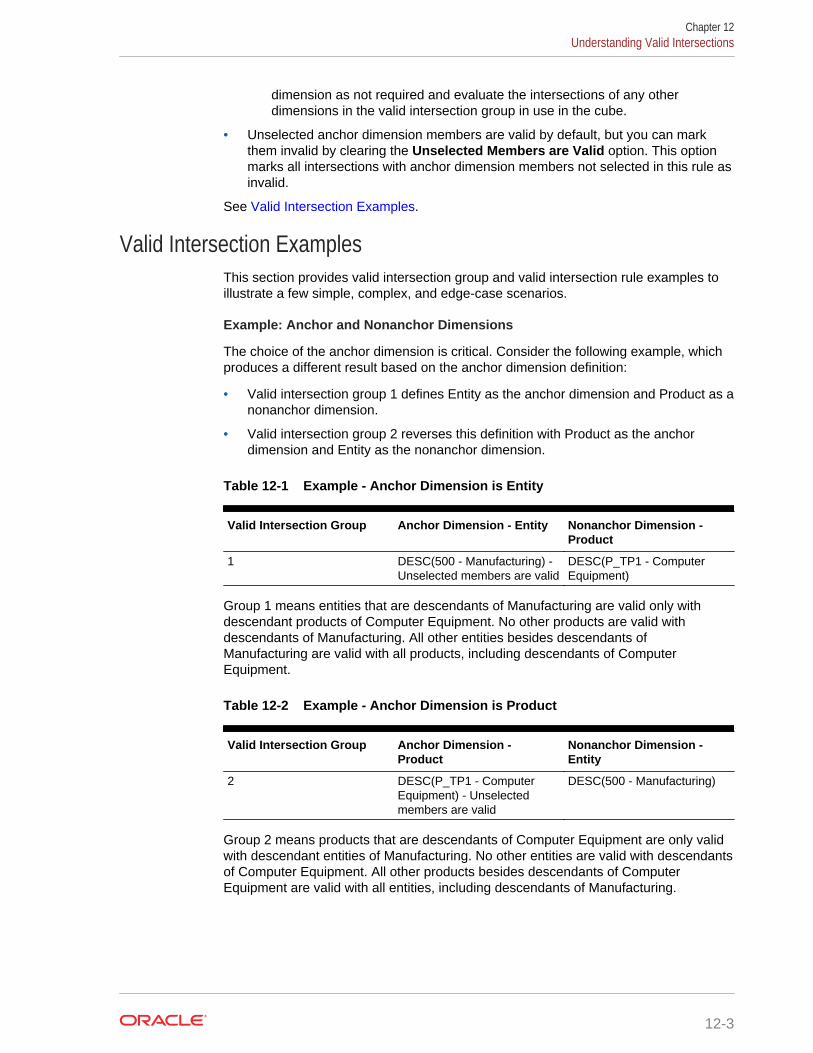
dimension as not required and evaluate the intersections of any otherdimensions in the valid intersection group in use in the cube.
• Unselected anchor dimension members are valid by default, but you can markthem invalid by clearing the Unselected Members are Valid option. This optionmarks all intersections with anchor dimension members not selected in this rule asinvalid.
See Valid Intersection Examples.
Valid Intersection ExamplesThis section provides valid intersection group and valid intersection rule examples toillustrate a few simple, complex, and edge-case scenarios.
Example: Anchor and Nonanchor Dimensions
The choice of the anchor dimension is critical. Consider the following example, whichproduces a different result based on the anchor dimension definition:
• Valid intersection group 1 defines Entity as the anchor dimension and Product as anonanchor dimension.
• Valid intersection group 2 reverses this definition with Product as the anchordimension and Entity as the nonanchor dimension.
Table 12-1 Example - Anchor Dimension is Entity
Valid Intersection Group Anchor Dimension - Entity Nonanchor Dimension -Product
1 DESC(500 - Manufacturing) -Unselected members are valid
DESC(P_TP1 - ComputerEquipment)
Group 1 means entities that are descendants of Manufacturing are valid only withdescendant products of Computer Equipment. No other products are valid withdescendants of Manufacturing. All other entities besides descendants ofManufacturing are valid with all products, including descendants of ComputerEquipment.
Table 12-2 Example - Anchor Dimension is Product
Valid Intersection Group Anchor Dimension -Product
Nonanchor Dimension -Entity
2 DESC(P_TP1 - ComputerEquipment) - Unselectedmembers are valid
DESC(500 - Manufacturing)
Group 2 means products that are descendants of Computer Equipment are only validwith descendant entities of Manufacturing. No other entities are valid with descendantsof Computer Equipment. All other products besides descendants of ComputerEquipment are valid with all entities, including descendants of Manufacturing.
Chapter 12Understanding Valid Intersections
12-3
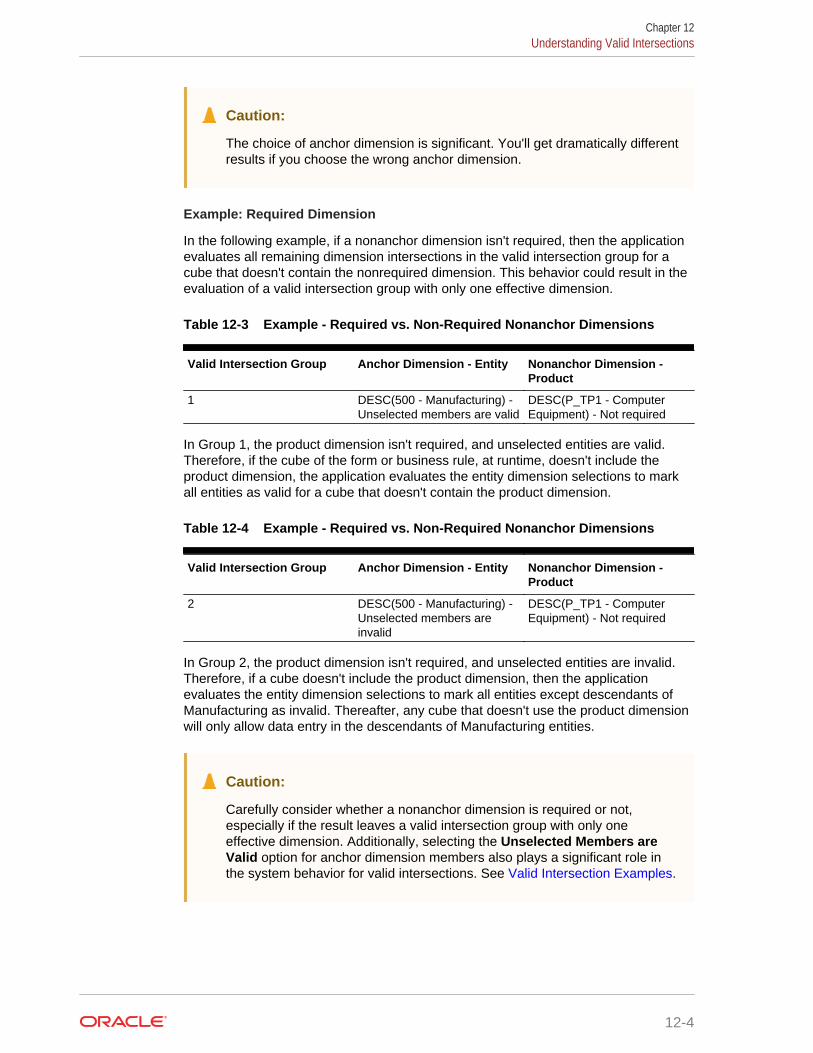
Caution:
The choice of anchor dimension is significant. You'll get dramatically differentresults if you choose the wrong anchor dimension.
Example: Required Dimension
In the following example, if a nonanchor dimension isn't required, then the applicationevaluates all remaining dimension intersections in the valid intersection group for acube that doesn't contain the nonrequired dimension. This behavior could result in theevaluation of a valid intersection group with only one effective dimension.
Table 12-3 Example - Required vs. Non-Required Nonanchor Dimensions
Valid Intersection Group Anchor Dimension - Entity Nonanchor Dimension -Product
1 DESC(500 - Manufacturing) -Unselected members are valid
DESC(P_TP1 - ComputerEquipment) - Not required
In Group 1, the product dimension isn't required, and unselected entities are valid.Therefore, if the cube of the form or business rule, at runtime, doesn't include theproduct dimension, the application evaluates the entity dimension selections to markall entities as valid for a cube that doesn't contain the product dimension.
Table 12-4 Example - Required vs. Non-Required Nonanchor Dimensions
Valid Intersection Group Anchor Dimension - Entity Nonanchor Dimension -Product
2 DESC(500 - Manufacturing) -Unselected members areinvalid
DESC(P_TP1 - ComputerEquipment) - Not required
In Group 2, the product dimension isn't required, and unselected entities are invalid.Therefore, if a cube doesn't include the product dimension, then the applicationevaluates the entity dimension selections to mark all entities except descendants ofManufacturing as invalid. Thereafter, any cube that doesn't use the product dimensionwill only allow data entry in the descendants of Manufacturing entities.
Caution:
Carefully consider whether a nonanchor dimension is required or not,especially if the result leaves a valid intersection group with only oneeffective dimension. Additionally, selecting the Unselected Members areValid option for anchor dimension members also plays a significant role inthe system behavior for valid intersections. See Valid Intersection Examples.
Chapter 12Understanding Valid Intersections
12-4
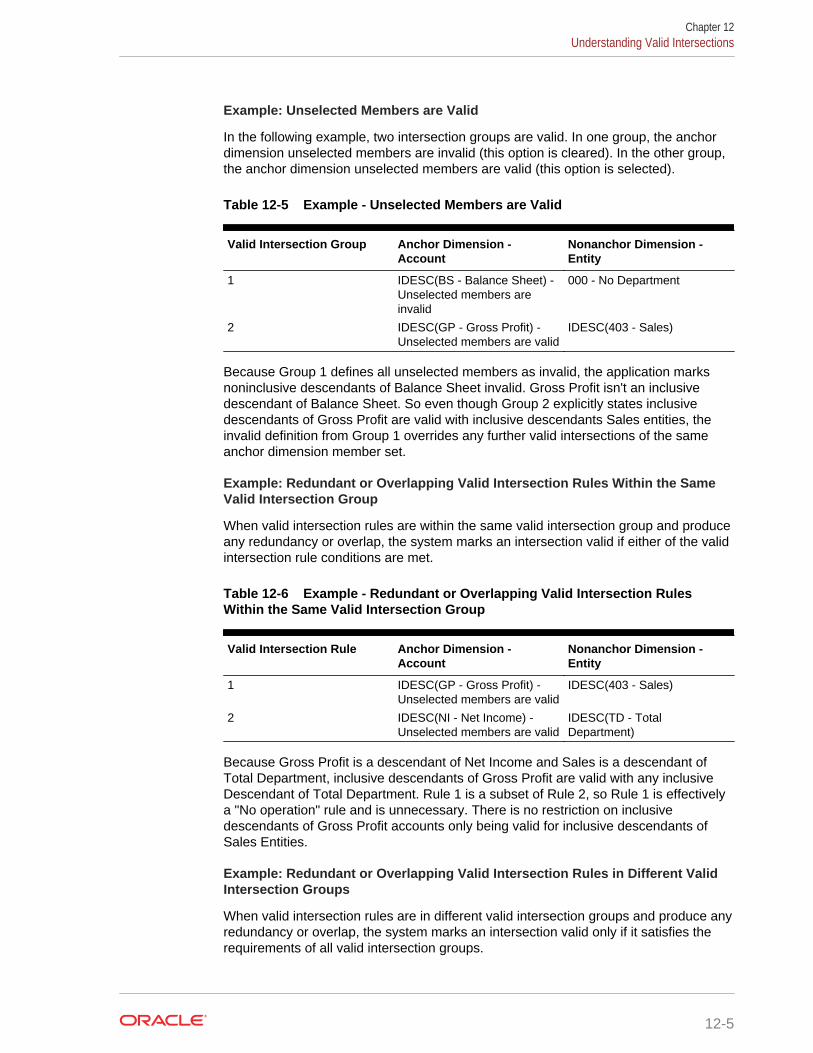
Example: Unselected Members are Valid
In the following example, two intersection groups are valid. In one group, the anchordimension unselected members are invalid (this option is cleared). In the other group,the anchor dimension unselected members are valid (this option is selected).
Table 12-5 Example - Unselected Members are Valid
Valid Intersection Group Anchor Dimension -Account
Nonanchor Dimension -Entity
1 IDESC(BS - Balance Sheet) -Unselected members areinvalid
000 - No Department
2 IDESC(GP - Gross Profit) -Unselected members are valid
IDESC(403 - Sales)
Because Group 1 defines all unselected members as invalid, the application marksnoninclusive descendants of Balance Sheet invalid. Gross Profit isn't an inclusivedescendant of Balance Sheet. So even though Group 2 explicitly states inclusivedescendants of Gross Profit are valid with inclusive descendants Sales entities, theinvalid definition from Group 1 overrides any further valid intersections of the sameanchor dimension member set.
Example: Redundant or Overlapping Valid Intersection Rules Within the SameValid Intersection Group
When valid intersection rules are within the same valid intersection group and produceany redundancy or overlap, the system marks an intersection valid if either of the validintersection rule conditions are met.
Table 12-6 Example - Redundant or Overlapping Valid Intersection RulesWithin the Same Valid Intersection Group
Valid Intersection Rule Anchor Dimension -Account
Nonanchor Dimension -Entity
1 IDESC(GP - Gross Profit) -Unselected members are valid
IDESC(403 - Sales)
2 IDESC(NI - Net Income) -Unselected members are valid
IDESC(TD - TotalDepartment)
Because Gross Profit is a descendant of Net Income and Sales is a descendant ofTotal Department, inclusive descendants of Gross Profit are valid with any inclusiveDescendant of Total Department. Rule 1 is a subset of Rule 2, so Rule 1 is effectivelya "No operation" rule and is unnecessary. There is no restriction on inclusivedescendants of Gross Profit accounts only being valid for inclusive descendants ofSales Entities.
Example: Redundant or Overlapping Valid Intersection Rules in Different ValidIntersection Groups
When valid intersection rules are in different valid intersection groups and produce anyredundancy or overlap, the system marks an intersection valid only if it satisfies therequirements of all valid intersection groups.
Chapter 12Understanding Valid Intersections
12-5
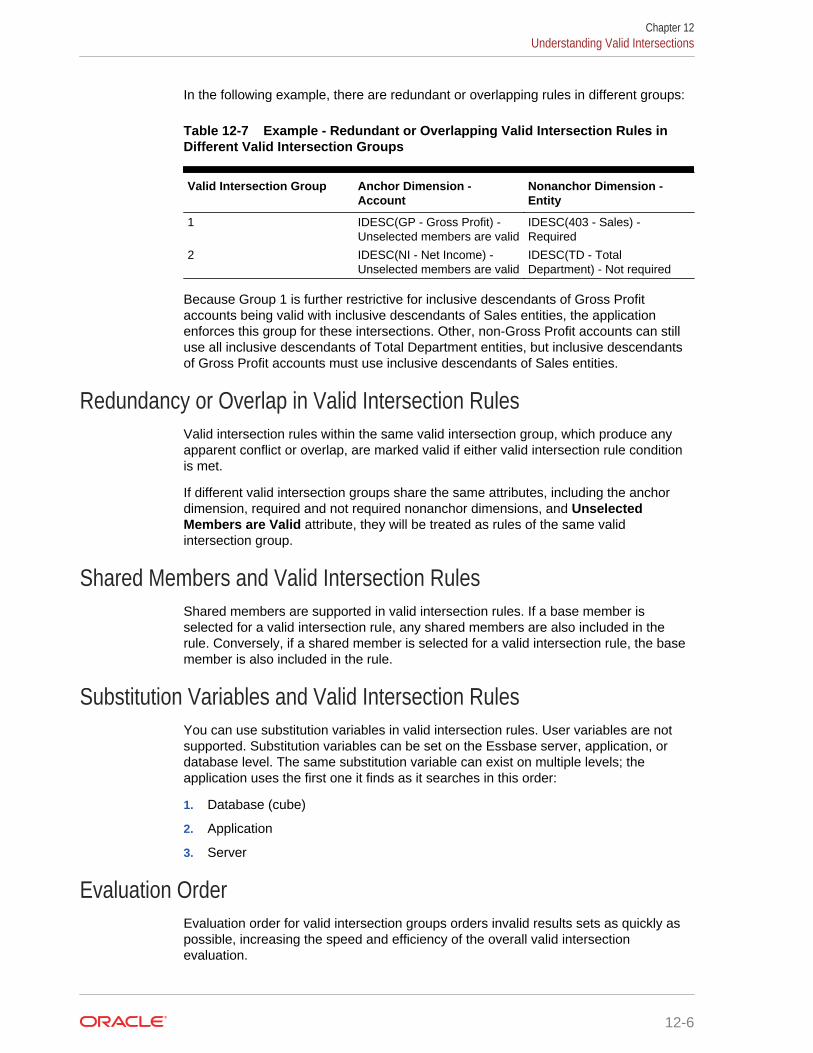
In the following example, there are redundant or overlapping rules in different groups:
Table 12-7 Example - Redundant or Overlapping Valid Intersection Rules inDifferent Valid Intersection Groups
Valid Intersection Group Anchor Dimension -Account
Nonanchor Dimension -Entity
1 IDESC(GP - Gross Profit) -Unselected members are valid
IDESC(403 - Sales) -Required
2 IDESC(NI - Net Income) -Unselected members are valid
IDESC(TD - TotalDepartment) - Not required
Because Group 1 is further restrictive for inclusive descendants of Gross Profitaccounts being valid with inclusive descendants of Sales entities, the applicationenforces this group for these intersections. Other, non-Gross Profit accounts can stilluse all inclusive descendants of Total Department entities, but inclusive descendantsof Gross Profit accounts must use inclusive descendants of Sales entities.
Redundancy or Overlap in Valid Intersection RulesValid intersection rules within the same valid intersection group, which produce anyapparent conflict or overlap, are marked valid if either valid intersection rule conditionis met.
If different valid intersection groups share the same attributes, including the anchordimension, required and not required nonanchor dimensions, and UnselectedMembers are Valid attribute, they will be treated as rules of the same validintersection group.
Shared Members and Valid Intersection RulesShared members are supported in valid intersection rules. If a base member isselected for a valid intersection rule, any shared members are also included in therule. Conversely, if a shared member is selected for a valid intersection rule, the basemember is also included in the rule.
Substitution Variables and Valid Intersection RulesYou can use substitution variables in valid intersection rules. User variables are notsupported. Substitution variables can be set on the Essbase server, application, ordatabase level. The same substitution variable can exist on multiple levels; theapplication uses the first one it finds as it searches in this order:
1. Database (cube)
2. Application
3. Server
Evaluation OrderEvaluation order for valid intersection groups orders invalid results sets as quickly aspossible, increasing the speed and efficiency of the overall valid intersectionevaluation.
Chapter 12Understanding Valid Intersections
12-6
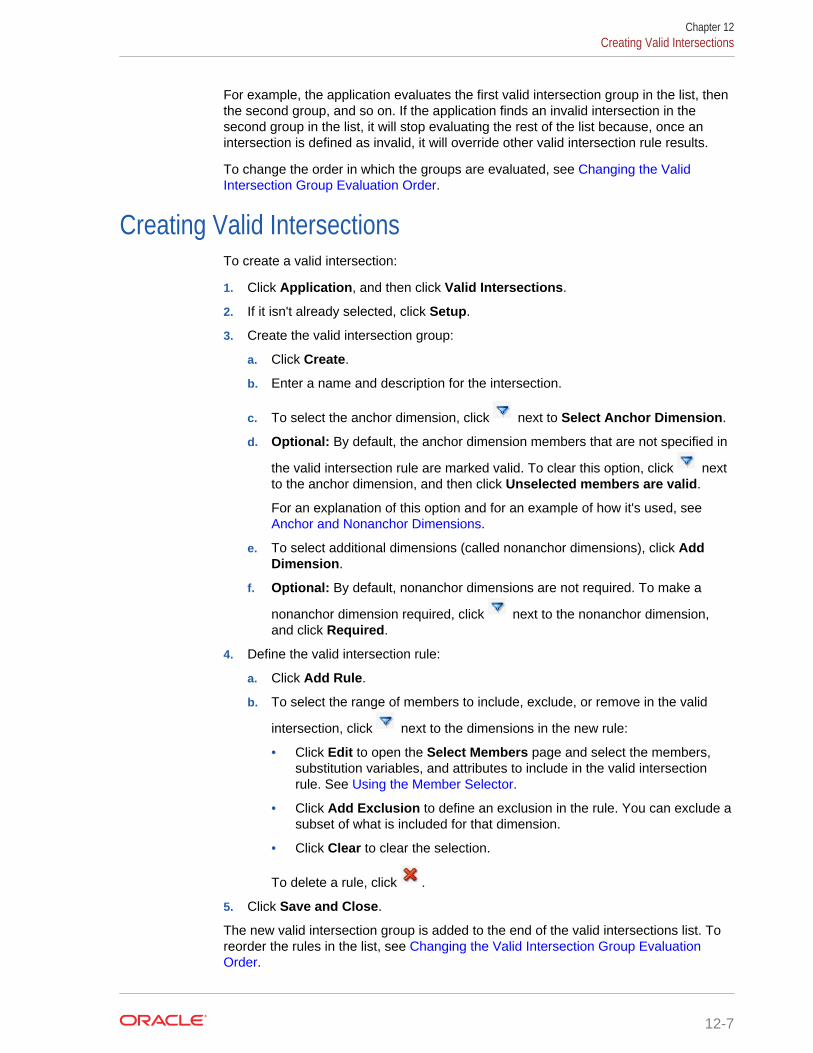
For example, the application evaluates the first valid intersection group in the list, thenthe second group, and so on. If the application finds an invalid intersection in thesecond group in the list, it will stop evaluating the rest of the list because, once anintersection is defined as invalid, it will override other valid intersection rule results.
To change the order in which the groups are evaluated, see Changing the ValidIntersection Group Evaluation Order.
Creating Valid IntersectionsTo create a valid intersection:
1. Click Application, and then click Valid Intersections.
2. If it isn't already selected, click Setup.
3. Create the valid intersection group:
a. Click Create.
b. Enter a name and description for the intersection.
c. To select the anchor dimension, click next to Select Anchor Dimension.
d. Optional: By default, the anchor dimension members that are not specified in
the valid intersection rule are marked valid. To clear this option, click nextto the anchor dimension, and then click Unselected members are valid.
For an explanation of this option and for an example of how it's used, see Anchor and Nonanchor Dimensions.
e. To select additional dimensions (called nonanchor dimensions), click AddDimension.
f. Optional: By default, nonanchor dimensions are not required. To make a
nonanchor dimension required, click next to the nonanchor dimension,and click Required.
4. Define the valid intersection rule:
a. Click Add Rule.
b. To select the range of members to include, exclude, or remove in the valid
intersection, click next to the dimensions in the new rule:
• Click Edit to open the Select Members page and select the members,substitution variables, and attributes to include in the valid intersectionrule. See Using the Member Selector.
• Click Add Exclusion to define an exclusion in the rule. You can exclude asubset of what is included for that dimension.
• Click Clear to clear the selection.
To delete a rule, click .
5. Click Save and Close.
The new valid intersection group is added to the end of the valid intersections list. Toreorder the rules in the list, see Changing the Valid Intersection Group EvaluationOrder.
Chapter 12Creating Valid Intersections
12-7
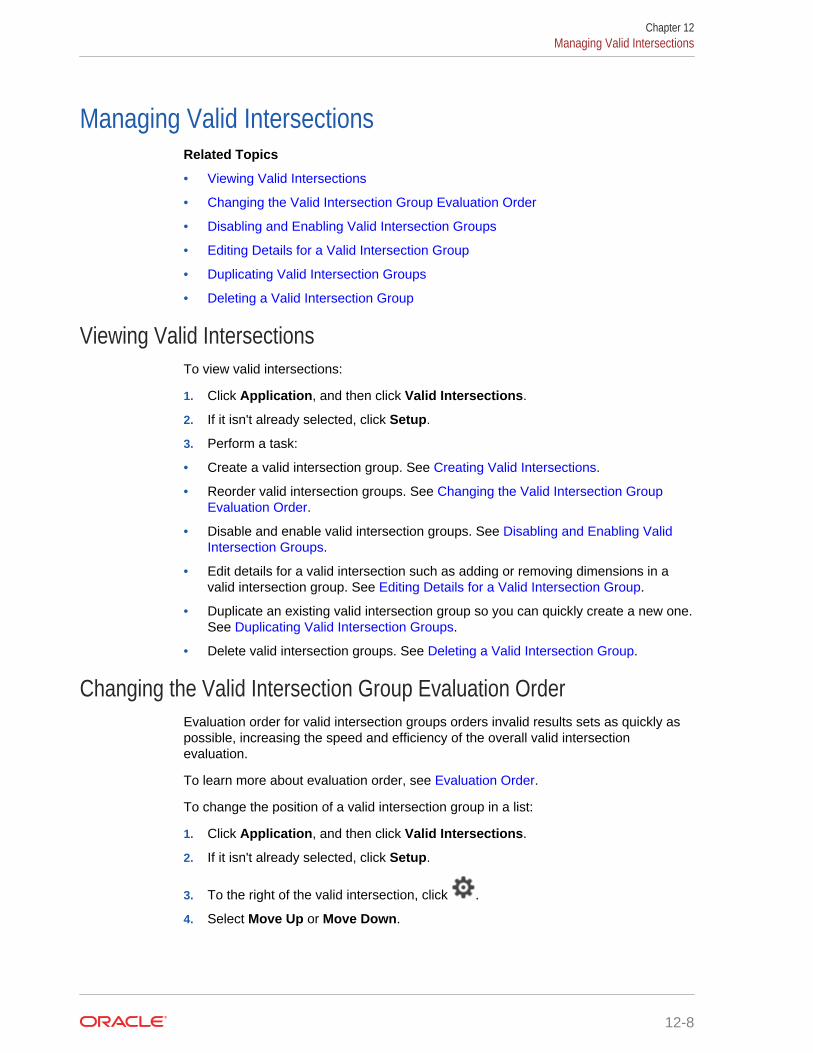
Managing Valid IntersectionsRelated Topics
• Viewing Valid Intersections
• Changing the Valid Intersection Group Evaluation Order
• Disabling and Enabling Valid Intersection Groups
• Editing Details for a Valid Intersection Group
• Duplicating Valid Intersection Groups
• Deleting a Valid Intersection Group
Viewing Valid IntersectionsTo view valid intersections:
1. Click Application, and then click Valid Intersections.
2. If it isn't already selected, click Setup.
3. Perform a task:
• Create a valid intersection group. See Creating Valid Intersections.
• Reorder valid intersection groups. See Changing the Valid Intersection GroupEvaluation Order.
• Disable and enable valid intersection groups. See Disabling and Enabling ValidIntersection Groups.
• Edit details for a valid intersection such as adding or removing dimensions in avalid intersection group. See Editing Details for a Valid Intersection Group.
• Duplicate an existing valid intersection group so you can quickly create a new one.See Duplicating Valid Intersection Groups.
• Delete valid intersection groups. See Deleting a Valid Intersection Group.
Changing the Valid Intersection Group Evaluation OrderEvaluation order for valid intersection groups orders invalid results sets as quickly aspossible, increasing the speed and efficiency of the overall valid intersectionevaluation.
To learn more about evaluation order, see Evaluation Order.
To change the position of a valid intersection group in a list:
1. Click Application, and then click Valid Intersections.
2. If it isn't already selected, click Setup.
3. To the right of the valid intersection, click .
4. Select Move Up or Move Down.
Chapter 12Managing Valid Intersections
12-8
Tip:
You can also drag valid intersection groups to move them up and downin the list.
Disabling and Enabling Valid Intersection GroupsValid intersection groups, by default, are enabled at the time of creation. If you don'twant a valid intersection group to be evaluated or used, you can disable it on the ValidIntersections page. When a valid intersection is disabled, the valid intersection rulefor that group no longer applies when viewing application forms, business rules, orruntime prompts. You can also reenable a disabled valid intersection group.
To disable and enable a valid intersection group:
1. Click Application, and then click Valid Intersections.
2. If it isn't already selected, click Setup.
3. In the Enabled column of the valid intersection list, click the check mark next to thevalid intersection group that you're disabling or enabling.
Note:
The check mark is green if the group is enabled.
4. Ensure that any remaining groups that are enabled are still listed in the correctevaluation order in the valid intersections list. If they are not, then move them up ordown in the order.
See Changing the Valid Intersection Group Evaluation Order.
Editing Details for a Valid Intersection GroupTo edit valid intersection group details, you work with dimension members in themember selector. You can also define exclusions in valid intersection rules.
To edit valid intersection group details:
1. Click Application, and then click Valid Intersections.
2. If it isn't already selected, click Setup.
3. Click the name of the valid intersection group you want to edit.
• To edit dimension details, next to the dimension, click to select themembers to include, exclude, or remove in the valid intersection rule:
– Click Edit to open the Select Members page and select members,substitution variables, and attributes to include in the valid intersectionrule. You can also type in the members or functions. See Using theMember Selector.
Chapter 12Managing Valid Intersections
12-9
– Click Add Exclusion to define an exclusion in the rule. You can selectmembers to exclude; for example, you can select or include all children ofYearTotal except children of Q1 by excluding children of Q1.
– Click Clear to clear the selection.
• To delete a dimension from a valid intersection group, next to the dimension,
click , and then click .
• To remove a rule from a valid intersection group, click .
• To add a dimension or a rule to a valid intersection group, click Add Rule orAdd Dimension.
4. Click Save and Close.
Duplicating Valid Intersection GroupsTo speed valid intersection group creation, you can duplicate an existing validintersection and then edit it.
To duplicate a valid intersection group:
1. Click Application, and then click Valid Intersections.
2. If it isn't already selected, click Setup.
3. Click to the right of a valid intersection group you want to duplicate, and thenselect Duplicate.
The duplicate group is added to the end of the valid intersections list with the word"Copy" appended to the name.
4. Open the valid intersection group and edit it.
5. Reorder the valid intersection groups, if needed. See Changing the ValidIntersection Group Evaluation Order.
Deleting a Valid Intersection GroupAfter a group is deleted, the valid intersection groups are reordered. If there are threevalid intersection groups, and the second one in the order is deleted, the third validintersection group becomes number two.
To delete a valid intersection group:
1. Click Application, and then click Valid Intersections.
2. If it isn't already selected, click Setup.
3. Click to the right of a valid intersection group that you want to remove, andthen select Delete.
4. Reorder the remaining valid intersections, if needed. See Changing the ValidIntersection Group Evaluation Order.
To delete a valid intersection rule from a valid intersection group, see Editing Detailsfor a Valid Intersection Group.
Chapter 12Managing Valid Intersections
12-10
Suppressing Invalid Data in FormsSuppressing invalid data hides rows or columns in application forms that containinvalid data. If this option isn't selected, then the application displays rows or columnsthat contain cells with data that are invalid. Cells with invalid data are read-only.
To suppress invalid data in forms:
1. From the Home page, click Navigator , and then under Create and Manage,click Forms.
2. Select the form, click , and then click Layout.
3. Under Grid Properties, select Suppress invalid data - Rows and/or Suppressinvalid data - Columns.
4. Click Save.
Clearing Invalid DataRelated Topics
• About Invalid Data
• Working With Invalid Intersection Reports
• Clearing Data at Invalid Intersections
About Invalid DataIf data already exists at intersections, then adding or modifying valid intersectionsinvalidates the existing data. Creating a valid intersection rule or modifying an existingvalid intersection rule doesn't clear data in the invalid intersections. You must generatea valid intersection rule report, which will show where data exists at invalidintersections, and then determine whether to clear the data.
Note:
Data may remain at an invalid intersection for historical purposes or for usein forward looking scenarios. Therefore, it's not a requirement to clear data atinvalid intersections.
Working With Invalid Intersection ReportsYou can view reports that show data at invalid intersections on the Reports tab of theValid Intersections page. Invalid Intersection Reports lists existing reports, theirstatus, and the last time they were run.
To work with invalid intersection reports:
1. Click Application, then Valid Intersections, and then click Reports.
Chapter 12Suppressing Invalid Data in Forms
12-11
2. Perform a task:
• To refresh the listing, click Refresh.
• To create a report, click Create, name the report, select the cube, choose thescope of the report, and then select when to run the report. You can run thereport now or run the report later by saving it as a job. To save a report withoutrunning it, click Save and Close. To remove a report after it's run, clickRemove Reports.
Note:
Invalid intersection reports are not supported for aggregate storagecubes. Aggregate storage cubes are not listed in the Cube drop-down list.
• To edit a report, click , and then Edit.
• To copy a report, click , and then Duplicate.
• To run a report, click , and then Run.
• To delete a report, click , and then Delete.
Clearing Data at Invalid IntersectionsUsers with appropriate permissions can clear the invalid data if the data isn't needed.To clear invalid data, run the report, and then click Clear Invalid Intersections.
Working with Valid IntersectionsRelated Topics
• Working with Valid Intersections in Application Forms
• Working with Valid Intersections in Calculation Manager Rule Runtime Prompts
Working with Valid Intersections in Application FormsUsing valid intersections prevents data entry for invalid intersections as defined in theapplicable valid intersection group. The affected cells in the form display as read-onlyfollowing standard, read-only color coding. If you hover the cursor over an invalidintersection, a tool tip displays indicating the cell is read-only because it's defined asan invalid intersection.
The valid intersection group applies first to the form point of view and page axis. If thepoint of view intersections are all invalid, then a warning message is displayed, andthe form doesn't render a data grid until a valid intersection is selected.
If the point of view has valid intersections, then the rows and columns are filtered torestrict data entry at invalid intersections. If the Suppress Invalid Data option for the
Chapter 12Working with Valid Intersections
12-12
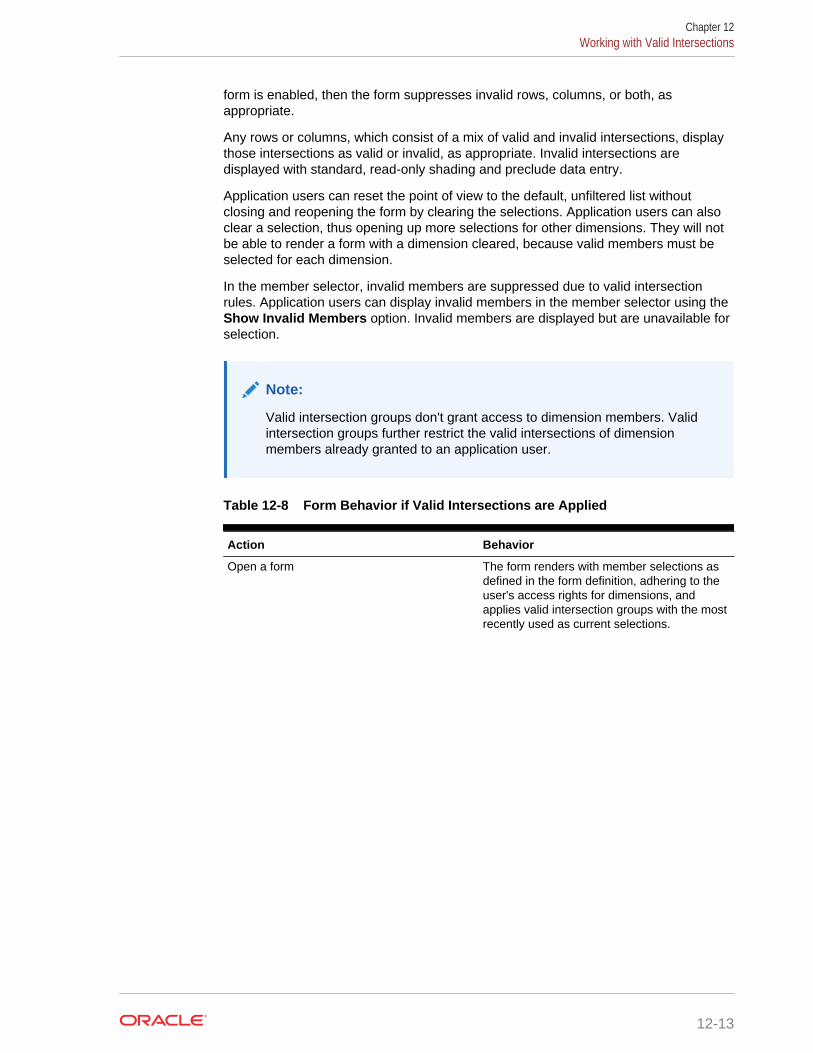
form is enabled, then the form suppresses invalid rows, columns, or both, asappropriate.
Any rows or columns, which consist of a mix of valid and invalid intersections, displaythose intersections as valid or invalid, as appropriate. Invalid intersections aredisplayed with standard, read-only shading and preclude data entry.
Application users can reset the point of view to the default, unfiltered list withoutclosing and reopening the form by clearing the selections. Application users can alsoclear a selection, thus opening up more selections for other dimensions. They will notbe able to render a form with a dimension cleared, because valid members must beselected for each dimension.
In the member selector, invalid members are suppressed due to valid intersectionrules. Application users can display invalid members in the member selector using theShow Invalid Members option. Invalid members are displayed but are unavailable forselection.
Note:
Valid intersection groups don't grant access to dimension members. Validintersection groups further restrict the valid intersections of dimensionmembers already granted to an application user.
Table 12-8 Form Behavior if Valid Intersections are Applied
Action Behavior
Open a form The form renders with member selections asdefined in the form definition, adhering to theuser's access rights for dimensions, andapplies valid intersection groups with the mostrecently used as current selections.
Chapter 12Working with Valid Intersections
12-13
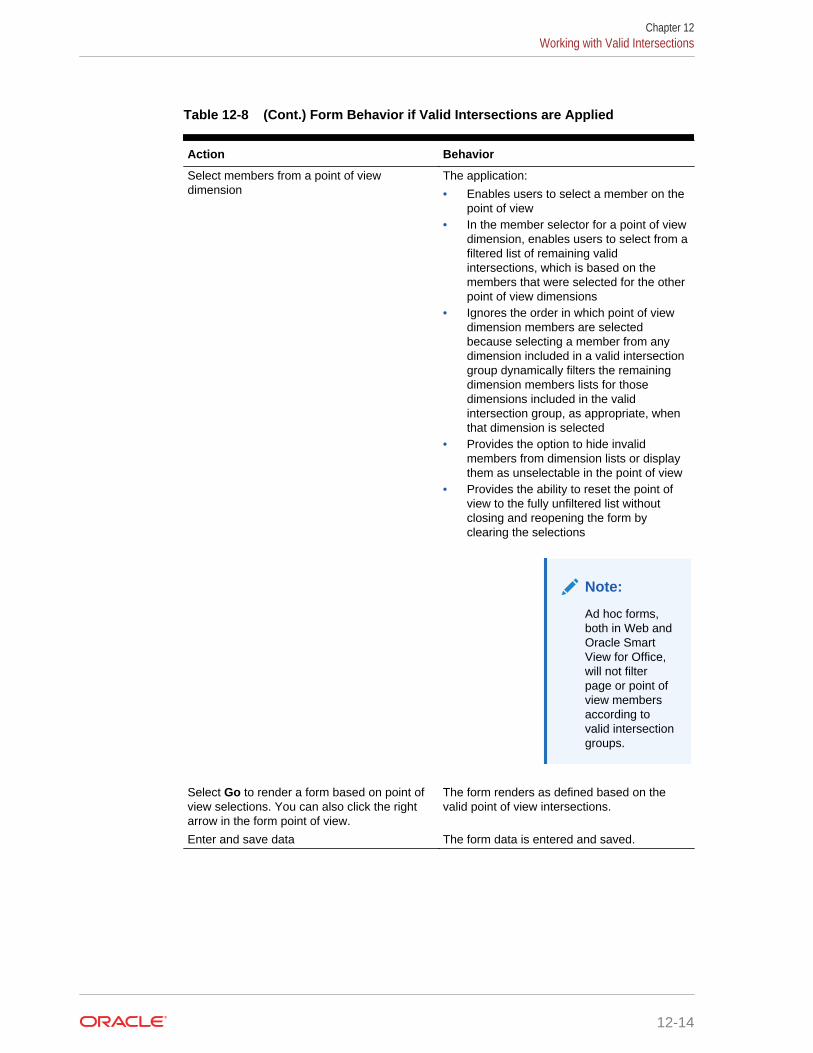
Table 12-8 (Cont.) Form Behavior if Valid Intersections are Applied
Action Behavior
Select members from a point of viewdimension
The application:
• Enables users to select a member on thepoint of view
• In the member selector for a point of viewdimension, enables users to select from afiltered list of remaining validintersections, which is based on themembers that were selected for the otherpoint of view dimensions
• Ignores the order in which point of viewdimension members are selectedbecause selecting a member from anydimension included in a valid intersectiongroup dynamically filters the remainingdimension members lists for thosedimensions included in the validintersection group, as appropriate, whenthat dimension is selected
• Provides the option to hide invalidmembers from dimension lists or displaythem as unselectable in the point of view
• Provides the ability to reset the point ofview to the fully unfiltered list withoutclosing and reopening the form byclearing the selections
Note:
Ad hoc forms,both in Web andOracle SmartView for Office,will not filterpage or point ofview membersaccording tovalid intersectiongroups.
Select Go to render a form based on point ofview selections. You can also click the rightarrow in the form point of view.
The form renders as defined based on thevalid point of view intersections.
Enter and save data The form data is entered and saved.
Chapter 12Working with Valid Intersections
12-14
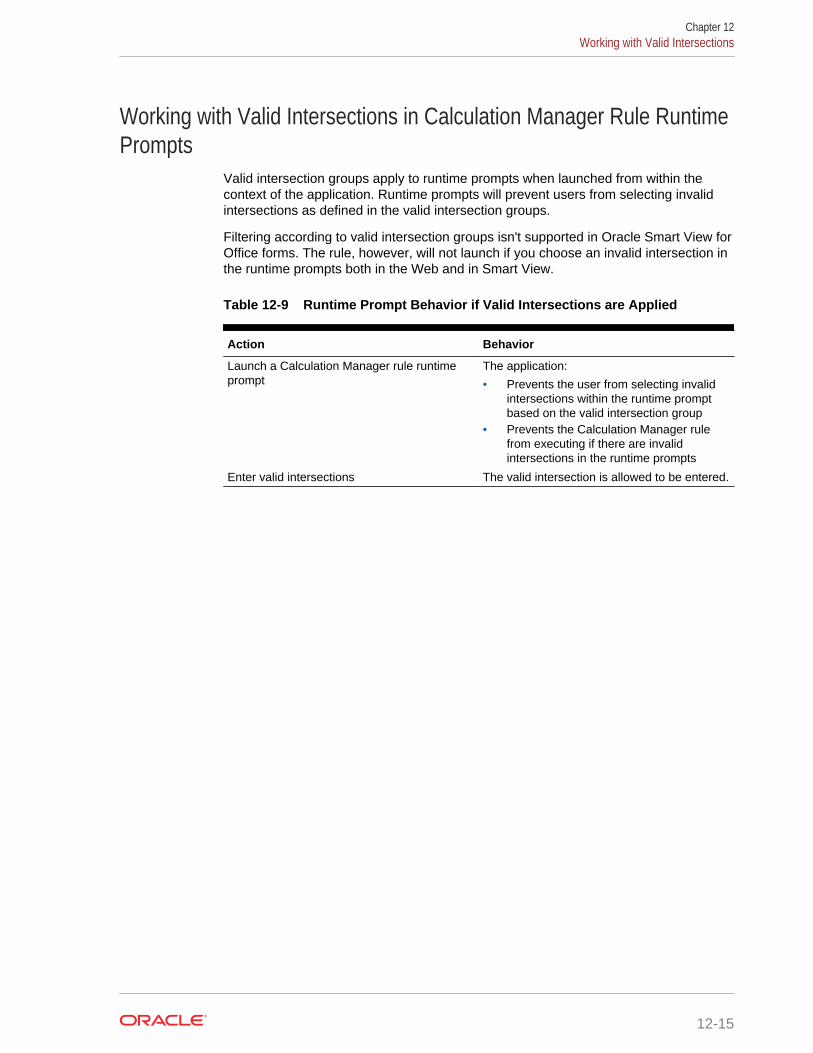
Working with Valid Intersections in Calculation Manager Rule RuntimePrompts
Valid intersection groups apply to runtime prompts when launched from within thecontext of the application. Runtime prompts will prevent users from selecting invalidintersections as defined in the valid intersection groups.
Filtering according to valid intersection groups isn't supported in Oracle Smart View forOffice forms. The rule, however, will not launch if you choose an invalid intersection inthe runtime prompts both in the Web and in Smart View.
Table 12-9 Runtime Prompt Behavior if Valid Intersections are Applied
Action Behavior
Launch a Calculation Manager rule runtimeprompt
The application:
• Prevents the user from selecting invalidintersections within the runtime promptbased on the valid intersection group
• Prevents the Calculation Manager rulefrom executing if there are invalidintersections in the runtime prompts
Enter valid intersections The valid intersection is allowed to be entered.
Chapter 12Working with Valid Intersections
12-15
13Defining Data Maps
Create data mappings between a source application and a target reporting application.
Related Topics
• Understanding Data MapsUse data maps to move data, comments, attachments, and supporting detail fromsource cubes and smart lists to reporting cubes to consolidate data.
• Creating Data Maps
• Refreshing Data Maps
• Managing Data Maps
• Moving Data
Understanding Data MapsUse data maps to move data, comments, attachments, and supporting detail fromsource cubes and smart lists to reporting cubes to consolidate data.
You can map dimensions between a source application database and a reportingdatabase to enable:
• Reporting on source application data in a reporting application
• Aggregating and querying on Smart Lists, which are converted to regulardimensions in the reporting application
• Linking application data to multiple reporting applications for variousconsolidations
Watch this tutorial video to learn how to move data for reporting using data maps.
Tutorial Video
Subtopics:
• About Applications
• About Reporting Cubes
• Unsupported Features with Data Maps
• Data Maps and Substitution Variables
About ApplicationsAn application is a related set of dimensions and dimension members used to meet aset of planning needs. Each application has its own accounts, entities, scenarios, andother data elements.
13-1
For more information about applications see, Managing Applications.
About Reporting CubesA reporting cube is a cube on which you can report on and aggregate Planning data.The primary use cases:
• The reporting cube contains data from any source, such as a data warehouse.You want to move new Planning data to it and report on the data.
• You want to report on Smart Lists in Planning, which you can't do in Planning.
Unsupported Features with Data MapsMapping a Planning application to a reporting application doesn't support:
• Aggregate storage database outlines with the "Duplicate Members Allowed" optionselected
• Attribute dimensions
• Attribute member selections
Data Maps and Substitution VariablesWhen mapping an application that contains substitution variables, note:
• Substitution variables are checked when you move data, not while data maps aredefined.
• The member selector displays the substitution variables that were defined for thePlanning application.
• For dimension-to-dimension mappings:
– For the Planning application, the variable name that is selected or typed ispassed and evaluated when you move data.
– For the reporting application, the variable name is evaluated against thePlanning application, and then the value is used when you choose to cleardata in a Push Data operation.
• For unmapped dimensions, for the reporting application, the member selectordisplays the substitution variables defined only for the reporting application. It'sevaluated against the reporting application, and the evaluated value is validatedagainst the respective reporting dimension for the single member and no memberfunction.
• If metadata in a reporting application has been modified, click Synchronize beforeediting or moving data to synchronize reporting dimensions and members withPlanning. For example, if a dimension or member was added to a reportingapplication, clicking Synchronize makes the member visible in Planning.Synchronizing changes from reporting application metadata may cause mappingsto become invalid.
Creating Data MapsTo create a data map that maps a Planning application to a reporting application:
Chapter 13Creating Data Maps
13-2
1. Create the reporting application.
For information on cubes, see Managing Cubes. For information on addingmembers, see Editing Dimensions in the Simplified Dimension Editor.
2. Click Application, then Data Exchange, and then click Data Maps.
3. Click Create.
4. Enter a name and description for the data map.
5. Under Source, select a cube from the available cubes for the current application.
6. Under Target, select an application and a cube from the available applications andcubes for the target reporting application.
The current mappings for the selected source and target cubes are displayedunder Source and Target, and any unmapped dimensions are displayed underUnmapped Dimensions.
7. Optional. Change the current mappings and map any unmapped dimensions.
To change the current mappings, see Changing Mapping Information.
To map unmapped dimensions, see Mapping Unmapped Dimensions.
8. Define data map options.
See Defining Data Map Options.
9. Click Save and Close.
The new data map is added to the end of the data maps list.
Refreshing Data MapsTo refresh data maps:
1. Click Application, then Data Exchange, and then click Data Maps.
2. Click Refresh.
Managing Data MapsRelated Topics
• Changing Mapping Information
• Mapping Unmapped Dimensions
• Defining Data Map Options
• Editing Details for a Data Map
• Duplicating a Data Map
• Deleting a Data Map
• Synchronizing Smart Lists in Reporting Applications
• Setting Data Options
• Validation Rules for Default Members
Chapter 13Refreshing Data Maps
13-3
Changing Mapping InformationTo change the mapping information for the dimensions in a data map:
1. Click Application, then Data Exchange, and then click Data Maps.
2. Click an existing data map.
3. Select a dimension under Source, and then click to select a new SourceDimension or Smart List to use for the mapping.
If all of the dimensions are mapped, you can only map an existing source
dimension to a Smart List (only "Smart List" is displayed when you click ). Tomap a source dimension to another dimension, you must first unmap a dimension.To unmap a dimension so that it can be remapped to another dimension, select
the dimension under Source, and then click . The dimension is moved toUnmapped Dimensions.
Mapping Unmapped DimensionsTo map unmapped dimensions in a data map:
1. Click Application, then Data Exchange, and then click Data Maps.
2. Do one of the following:
• Click Create to create a new data map.
• Click an existing data map to edit the mapping in an existing data map.
3. For any dimension under Unmapped Dimensions, click next to thedimension.
This moves the dimension out of Unmapped Dimensions and under the Targetdimensions above.
4. Find the dimension that you just moved under Target.
The corresponding dimension under Source will say Select.
5. Click next to Select under Source, and then select the Source Dimension orSmart List that you want to map to the unmapped Target dimension.
6. Click Save and Close.
Defining Data Map OptionsTo define data map options:
1. Click Application, then Data Exchange, and then click Data Maps.
2. Click to the right of the data map for which you want to define data mapoptions, and then select Edit.
3. On the top right of the screen, click Options.
Chapter 13Managing Data Maps
13-4
4. For Select Items to Copy, select the items for which you want to copy thecorresponding relational data. You can copy:
• Comments and Attachments
If you select Collate, then:
– If there is one-to-one mapping between the source cells and the targetcells, then Comments and Attachments are copied from the source cells tothe target cells.
– If there isn’t a one-to-one mapping between the source cells and the targetcells, then the Comments and Attachments from the source cells arecombined and saved in the corresponding target cells.
If you do not select Collate, then:
– If there is one-to-one mapping between the source cells and the targetcells, then Comments and Attachments are copied from the source cells tothe target cells.
– If there isn't a one-to-one mapping between the source cells and the targetcells, then last source cell's Comments and Attachments are copied intothe corresponding target cell. "Last source cell" means the last source cellamong multiple source cells that has non-empty relational data.
• Supporting Detail
– If there is a one-to-one mapping between the source cells and the targetcells, then copy Supporting details are copied from the source cells to thetarget cells.
– If there isn't a one-to-one mapping between the source cells and targetcells, then the Supporting details are not copied to the target cells.
Note:
The relational data (Comments and Attachments and SupportingDetail) selected to be copied in the Data Map Options dialog boxapplies only to moving data from one cube to another cube. It doesn'tapply to moving data to a reporting cube. See Moving Data.
5. Choose a Smart List Dimension.
6. If you don't want to move the dynamically calculated member data during the datamap process, select Exclude Dynamic Calc Members.
7. Allow Smart Push Simultaneously allows data map and Smart Push processesto run at the same time. Click Yes to enable this option.
See Running Data Mapping and Smart Push Processes Simultaneously.
Editing Details for a Data MapWhen you edit data map details, you can change data mappings and map unmappeddimensions.
To edit data map details:
1. Click Application, then Data Exchange, and then click Data Maps.
Chapter 13Managing Data Maps
13-5
2. Do one of the following:
• Click a data map.
• Click to the right of the data map that you want to edit, and then selectEdit:
– To edit the mapping between dimensions, see Changing MappingInformation.
– To map an unmapped dimension, see Mapping Unmapped Dimensions.
– To define data map options, see Defining Data Map Options.
– To delete a data map, to the right of the Source and Target dimension,
click .
3. Click Save and Close.
Duplicating a Data MapTo duplicate a data map:
1. Click Application, then Data Exchange, and then click Data Maps.
2. Click to the right of the data map that you want to duplicate, and then selectDuplicate.
3. In the Save As dialog box, enter a name for the data map, and then click OK.
The duplicate data map is added to the data map list. It has all the details of theoriginal data map, but is saved under the new name.
Deleting a Data MapTo delete a data map:
1. Click Application, then Data Exchange, and then click Data Maps.
2. Click to the right of the data map that you want to remove, and then selectDelete.
Synchronizing Smart Lists in Reporting ApplicationsSynchronizing Smart Lists in reporting applications identifies dimensions in reportingapplications to which Smart Lists are mapped, and adds level 0 members of theselected dimensions as new Smart List entries to the selected Smart Lists. See AboutApplications.
To synchronize Smart Lists in reporting applications:
1. Click Application, then Data Exchange, and then click Data Maps.
2. Click to the right of the data map that contains the Smart List that you want tosynchronize, and then select Synchronize.
Chapter 13Managing Data Maps
13-6
During synchronization, values from reporting applications in all existing mappingsare appended after the last Smart List item in the appropriate Smart list. If a SmartList is mapped to two dimensions, all members from the first mapping are insertedfirst, and then members from the second mapping are inserted. If a memberalready exists in a Smart List, it's not added again. Smart List members in thePlanning Smart Lists are not deleted, even if the corresponding dimensionmembers on the reporting application are deleted.
Note:
If Account is mapped as Smart List to Dimension, all of the level 0members in the Account dimension are brought in as Smart List entrieswhen the Smart List is synchronized. For example, Smart Lists mayinclude entries such as HSP_Average and HSP_Ending. If this occurs,delete the extra entries from the Smart List.
3. Click OK in the dialog box that says "Data map synchronization is complete."
Note:
Smart List names can’t have spaces in them. If you're synchronizing SmartLists in a reporting application, ensure that any new members don't havespaces in the name.
Setting Data OptionsLaunch Options to define how to merge relational data such as comments,attachments, and supporting detail when moving data.
To set data options:
1. Click Application, then Data Exchange, and then click Data Maps.
2. To the right of the data map that you want to edit, click , and then select Edit
3. Click Options, select items to copy, and choose a Smart List dimension.
4. If you don't want to move the dynamically calculated member data during the datamap process, select Exclude Dynamic Calc Members.
Validation Rules for Default MembersDefault members in the reporting cube store the data that is moved from the sourcePlanning application. If any of the following constraints are not met, or if a dimension ineither application isn't mapped and has no valid default member, then a mapping isn'tvalid and an error message is displayed.
Rules:
• If the reporting cube is an aggregate storage database, then the default membersmust be level 0 members.
Chapter 13Managing Data Maps
13-7
• If the reporting cube is a block storage database, then the default members can beany members with the Store Data property.
• If the Planning application has only dimension to dimension mappings, then thedefault members can be any level or data storage type.
• If the Planning application has Smart List to dimension mappings, then defaultmembers must be only level 0. In addition, the source cube must contain a denseAccount dimension with at least one member associated with a Smart List.
• If Descendants (Acct_Default) is selected in a mapping, the Acct_Default membermust exist in the reporting cube.
Note:
Mappings that were once valid can become invalid if dimensions, members,or Smart Lists are renamed, removed, or added. If a target cube has achange in dimensionality, you must select the corresponding application
mapping on the Map Reporting Application screen and click to refreshthe data.
Moving DataRelated Topics
• Moving Data to a Reporting Cube
• Moving Data from One Cube to Another Cube Using Smart Push
• Running Data Mapping and Smart Push Processes Simultaneously
Moving Data to a Reporting CubeAfter setting up data maps, you can move data to a reporting cube. Planning validatesthe selected data maps, and then moves the mapped Planning dimension data to thereporting cube dimensions. You can also check the Job for the job status.
Note:
If you enabled parent members for dynamic children in both a block storageand aggregate storage cube and added a dynamic member, you can usePush Data to successfully move data from the block storage to theaggregate storage cube without refreshing the database. After the databaserefresh, however, the administrator must synchronize the data map. See Synchronizing Smart Lists in Reporting Applications.
To move data to a reporting cube:
1. Create the reporting cube.
2. Create the data map.
Chapter 13Moving Data
13-8
3. Click Application, then Data Exchange, and then click Data Maps.
4. To the right of the data map, click , and then select Push Data.
Confirm whether you want to clear the data before moving it:
• Click No to add the new data to the existing data in the reporting cube. Nodata is cleared from the target cube when you use this option.
If you map Smart Lists to dimensions, Smart List labels must match eithermember names or aliases in the reporting cube. Push Data doesn't work withSmart List entry names.
• Click Yes to clear the data in the target cube before moving data to it.
When the target is an aggregate storage reporting cube, note the followingwhen clearing and moving data:
– Members with nonmatching names in the target reporting cube areignored.
– This option works only with member names, not with member aliases.
– Use caution when using member relationships (such as Children) whenselecting members for the data map, because using this option can causethe calculation script to exceed its length limit.
– If you use member relationships, this option expands the level 0 memberlist in the source Planning cube. If at least one member name in thesource cube matches a member in the reporting cube, this optionproceeds without error. If at least one member doesn't match, the optioncan't proceed.
When the target is a block storage reporting cube, to proceed successfully,clearing and moving data requires these conditions:
– If you use member relationships, all member names in the source cubemust match all member names in the reporting cube.
– If you map Smart Lists to dimensions, all Smart List entries in the sourcecube must match all member names in the reporting cube.
– If you map Smart Lists to dimensions, the Smart List entry label in thesource Planning cube must match the member name in the reportingcube. If a Smart List entry label doesn't match a member name in thereporting cube, then the Smart List entry name must match the reportingcube member name.
If the previous conditions are not met, the clearing and moving data operationcan't proceed.
Moving Data from One Cube to Another Cube Using Smart PushRelated Topics
• About Smart Push
• Considerations When Using Smart Push
• Configuring Smart Push for a Form
• Configuring Merge Options
• Moving Data After Configuring Smart Push
Chapter 13Moving Data
13-9
• Viewing the Smart Push Status
About Smart PushFor more meaningful and complete reporting, planners can instantly move comments,attachments, and supporting detail from source cubes to a reporting cube whileworking in forms. Planners can then do more analysis on the planning data comingfrom the different cubes.
For example, assume that you have expense planning in one cube and revenueplanning in another cube. Assume further that you use a reporting cube to consolidateyour reporting needs. Without Smart Push, the data from your cubes would be movedto the reporting cube through scheduled jobs set up by administrators. Smart Pushallows the data to be moved immediately to the reporting cube by planners.
You can move application data from:
• Block Storage cubes to aggregate storage cubes
• Block Storage cubes to block storage cubes
Considerations When Using Smart PushWhen using Smart Push, keep in mind the following considerations:
• Smart Push honors metadata and approvals security.
• Smart Push isn't supported for forms from source aggregate storage cubes.
• Smart Push requires that at least one of the dense dimensions, account or period,is set as a dimension-to-dimension mapping in the data map definition.
• Numeric data across all members selected for dimensions listed in the unmappedsection of the source cube in the data map isn't listed in the Smart Push definition.
• Whenever a target cube has a change in dimensionality, you must select thecorresponding data map on the Data Maps page, and then click Actions and thenSynchronize to refresh the data.
Configuring Smart Push for a Form• Configuring Smart Push for a Simple Form
• Configuring Smart Push for a Composite Form
Configuring Smart Push for a Simple FormTo configure Smart Push for a simple form:
1. From the Home page, click Navigator , and then under Create and Manage,click Forms.
2. Expand Forms, and then select a simple form.
3. With the simple form selected, select .
4. Click Smart Push.
Chapter 13Moving Data
13-10
The defined mappings for the form are displayed. Click to add new mappings ifdesired.
5. Expand each mapping.
6. For each dimension shown under a mapping, specify the Smart Push region forthe dimension:
• Select Use Form Context to move data for all the members selected for thedimension on Layout.
• Clear Use Form Context, and then click next to Overwrite Selection toselect a member or members in the Member Selection dialog box.
Note:
You can override a mapping definition on source cube dimensionsonly. You can override dimension members if you take the contextfrom a form by selecting Use Form Context. You can also overridedimension members if you specify members in the MemberSelection dialog box, or if you leave Overwrite Selection blank.
Tip:
Smart Push makes incremental updates to the reporting cube. Toachieve this, you can select the Use Form Context or OverwriteSelection options to limit the amount of data being moved to thecurrent context or to limit the data movement to the section that youare updating or calculating.
If the Smart Push region isn't specified using one of the above options, thenmember selection is taken from the data map.
7. For each mapping, define whether Smart Push will be automatic or manual:
• Select Run After Save to automatically move the data when the simple formis saved.
• Leave Run After Save cleared to manually move the data.
For information on how to manually move the data, see Moving Data AfterConfiguring Smart Push.
8. Click Save to save the Smart Push configuration for the form.
Configuring Smart Push for a Composite FormTo configure Smart Push for a composite form:
1. From the Home page, click Navigator , and then under Create and Manage,click Forms.
2. Expand Forms, and then select a composite form.
Chapter 13Moving Data
13-11
3. With the composite form selected, click .
4. Click Smart Push.
All the simple forms for which Smart Push details are provided are displayed.
5. Select a simple form in order to use its Smart Push details in the composite form.
6. For each simple form selected, define whether Smart Push will be automatic ormanual.
• Select Run After Save to automatically move the data when the compositeform is saved.
• Leave Run After Save cleared to manually move the data.
If you select Run After Save to move the Smart Push details for a simple formwhen the composite form is saved, then regardless of whether you selected RunAfter Save for each mapping in the simple form, all of the mappings selected forSmart Push in the simple form are executed.
Similarly, if Smart Push is configured to be manual, all of the simple form’smappings are executed regardless of whether Run After Save is selected for amapping in a simple form.
7. Click Save to save the Smart Push configuration for the form.
Configuring Merge OptionsMerge options for comments, attachments, and supporting detail are configured on theData Options tab available when mapping a cube for reporting. See Defining DataMap Options.
Note:
When using Smart Push, relational data such as Supporting Details, Date,Smart List, and Text can't be merged. Smart List, Date, and Text are movedonly in cases of a one-to one-mapping between source cells and target cells.Empty cells are not considered for a relational data move.
Moving Data After Configuring Smart PushSee Moving Data for information on how to move data.
How the data is moved depends on whether you selected Run After Save when youconfigured Smart Push for a form.
• If you selected Run After Save when you configured Smart Push for a form, thedata is moved when you save the form.
• If you left Run After Save unchecked:
1. Click Data.
2. Click a form to open it.
3. With the form open, select Actions, and then click Smart Push Details.
4. Click the link in the Smart Push dialog box to move the data.
Chapter 13Moving Data
13-12
Note:
• Smart Push always clears data in the target region before moving newdata.
• If planners observe errors in Smart Push execution, the administratormust verify and fix how Smart Push is set up by using the errors listed inthe details of the Smart Push job. See Viewing the Smart Push Status.
Viewing the Smart Push StatusTo view the status of the data move:
1. Click Application.
2. Click Jobs.
The Smart Push job will be displayed. If an error occurs, click the error link totroubleshoot the problem. If the data was moved successfully, the Run Status isdisplayed as "Complete."
Running Data Mapping and Smart Push Processes SimultaneouslyWhile moving data to a reporting cube, you can minimize the time the system isunavailable to planners. This can be achieved by moving only the required data to thereporting cube using runtime prompts in a Groovy rules-based Data Map push. For aData Map push through EPM Automate, you can use substitution variables and set upsubstitution variable values before moving data using Data Maps. See these topics formore information:
• To find documentation and examples for Groovy business rules, see FrequentlyAsked Questions.
• For information about EPM Automate, see Working with EPM Automate for OracleEnterprise Performance Management Cloud.
You can also further minimize downtime by allowing planners to run the Smart Pushand Data Map processes simultaneously by enabling the Allow Smart PushSimultaneously option in Data Map Options.
Consider the following when running simultaneous Data Map and Smart Pushexecutions:
• Smart Push will wait for data to clear in the reporting cube before pushing data.
• There are limits on the amount of data that can be processed simultaneously.Check the job output and design accordingly.
For information about data map options, see Defining Data Map Options.
Chapter 13Moving Data
13-13
14Managing Jobs
Schedule jobs to perform common administrative tasks and lighten your workload. Youcan start jobs right away or schedule jobs to run later at intervals.
Related Topics
• How Jobs Save You Time
• Viewing Pending Jobs and Recent Activity
• Scheduling Jobs
• Editing and Canceling Jobs
• Canceling Rules Jobs and Ruleset Jobs
• Downloading Export Files From Your Outbox
How Jobs Save You TimeJobs are actions such as exporting data or refreshing the database, which you canstart right away or schedule to run later at intervals. To lighten your workload, definejobs to perform common administrative tasks such as:
• Import and export data
• Import and export metadata
• Refresh the database
• Map cubes
Viewing Pending Jobs and Recent ActivityTo view the job listings in the Jobs console:
1. Click Application, and then click Jobs.
2. Perform any task:
• To filter jobs and activity by criteria such as date or job type, click
• To search for job by name, enter text in the Search, and then click .
• To view a job's details, click the job.
14-1
Note:
The application is automatically refreshed during an application upgrade. Ifany refresh errors occur during an application upgrade, you can view theerrors on the Jobs page. These errors are captured in the job called ContentUpgrade.
Scheduling JobsTo schedule jobs:
1. Click Application, then Jobs, and then click Schedule Jobs.
2. Specify the following:
• The type of job you're creating. For example:
– Rules—Runs a rule that you select
– Import Data—Performs a data import that was saved as a job
– Cube Map—Performs a mapping operation
– Invalid Intersection Reports—Runs a report that shows where dataexists at invalid intersections
– Clear Cube—Performs a cube clearing operation
• When to run the job. If scheduling the job:
– In Schedule starting from, select the starting date and time, including thetime zone.
– In Name, specify a name for the job. The name you specify is displayedwith a system-generated name; such as MyWeeklyCubeRefresh :Refresh Database.
– In Recurrence Pattern, specify the frequency with which to run the job:
* Hourly—The job will start running in one hour and continue to runeach hour until the ending date and time; for example, if the currenttime is 3:11, the job will run at 4:11, 5:11, and so on.
* By Minute—Set the Frequency for 15 or 30 minutes. The job willstart running in 15 or 30 minutes and continue to run at the selectedfrequency until the ending date and time; for example, if you set thejob to run every 15 minutes and the current time is 3:15, the job willstart to run at 3:30, then 3:45, and so on. Jobs cannot be scheduled torun in increments smaller than 15 minutes.
* Run Once—The job will run once at the starting date and time.
* Yearly—The job will run at the starting date and time and continue torun each year thereafter until the end date.
* Monthly—The job will run at the starting date and time and continueto run each month thereafter until the end date.
* Weekly—The job will run at the starting date and time and continue torun each week until the end date.
Chapter 14Scheduling Jobs
14-2
* Daily—The job will run at the starting date and time and continue torun each day until the end date.
– If the job is recurring, select an ending date and time in End Date.
3. Click Next.
4. Select a job from the job list:
• For details about the clear cube job options, see Creating Clear Cube Jobs.
• For details about the following job types, see Improving Cube Performance:
– Restructure Cube
– Compact Outline
– Merge Data Slices
– Optimize Aggregation
• For rules jobs, note the following:
– You can filter the rules list by cube and by rule type.
– You must click the check mark next to the rule you want to run before youcan proceed.
– For rules jobs with runtime prompts, clicking the check mark next to a rulewill display the runtime prompt parameters. Set the runtime prompt valueswith which to run the rule in the job scheduler, and then click OK.
Note:
Hidden runtime prompts will pick up the default values that wereset at design time in Calculation Manager.
5. Click Next.
6. Review your choices. If satisfactory, click Finish.
To edit or cancel a job after scheduling it, see Editing and Canceling Jobs.
Editing and Canceling JobsYou can edit the schedule for pending jobs, and delete pending and complete jobs.You can't modify or delete jobs that are processing.
To edit or delete jobs:
1. Click Application, and then click Jobs.
2. To change when a job runs, click , then Edit and modify the schedule.
Chapter 14Editing and Canceling Jobs
14-3
Note:
When changing the frequency of a job, the job will not run at the newfrequency until the next time it runs at the previous frequency; forexample, if the job is set up to recur daily and you change the frequencyto hourly, the job won't start running at the new hourly frequency untilafter the scheduled daily job runs the next day. If you want the job tobegin running at the new frequency sooner, Oracle recommends thatyou delete the scheduled job and create a new one.
3. To delete jobs, select them, click , and then Delete.
Canceling Rules Jobs and Ruleset JobsYou can cancel ruleset or rule jobs that are processing and display in Recent Activity.To cancel these jobs, click Application, then click Jobs.
To cancel a rules job, click beside the job, then , and then Cancel.
To cancel a ruleset, click , then on Job Details, and then Cancel.
Downloading Export Files From Your OutboxAfter running a metadata or data export job, you can download the export file from theOutbox.
To download files:
1. Click Application, and then click Jobs.
2. Under Recent Activity, click the job.
3. At the top of Job Details, click the export file option to select a download location.
Chapter 14Canceling Rules Jobs and Ruleset Jobs
14-4
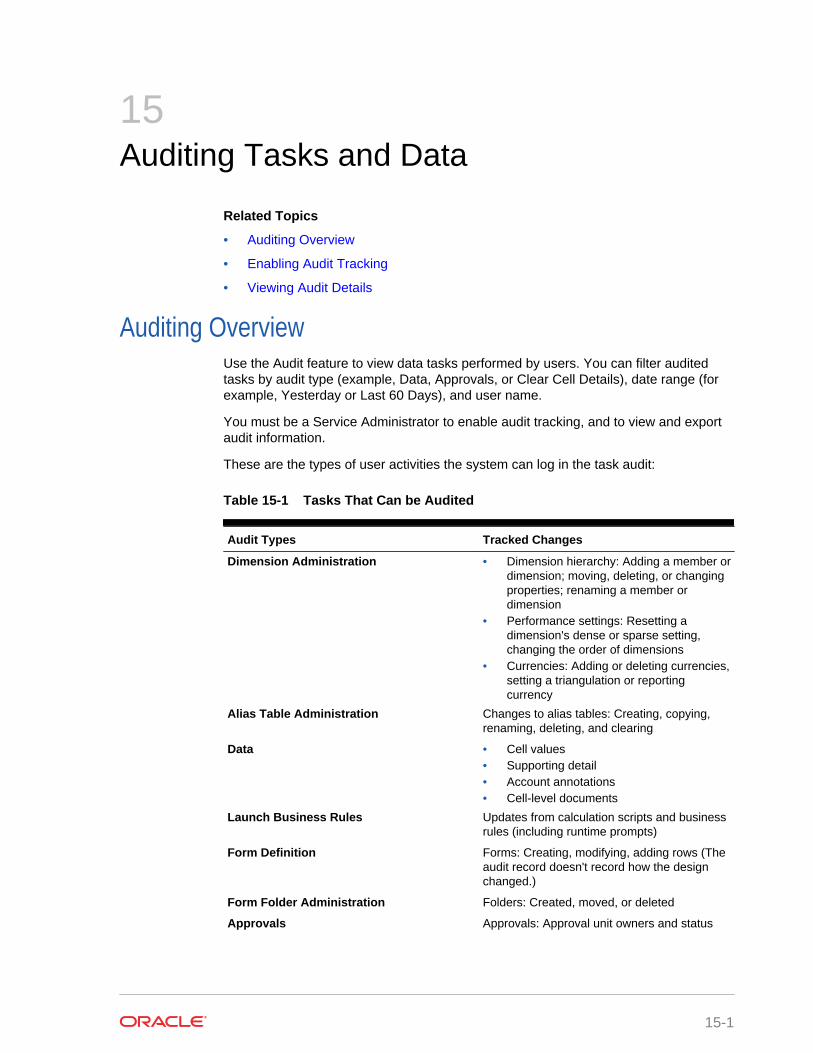
15Auditing Tasks and Data
Related Topics
• Auditing Overview
• Enabling Audit Tracking
• Viewing Audit Details
Auditing OverviewUse the Audit feature to view data tasks performed by users. You can filter auditedtasks by audit type (example, Data, Approvals, or Clear Cell Details), date range (forexample, Yesterday or Last 60 Days), and user name.
You must be a Service Administrator to enable audit tracking, and to view and exportaudit information.
These are the types of user activities the system can log in the task audit:
Table 15-1 Tasks That Can be Audited
Audit Types Tracked Changes
Dimension Administration • Dimension hierarchy: Adding a member ordimension; moving, deleting, or changingproperties; renaming a member ordimension
• Performance settings: Resetting adimension's dense or sparse setting,changing the order of dimensions
• Currencies: Adding or deleting currencies,setting a triangulation or reportingcurrency
Alias Table Administration Changes to alias tables: Creating, copying,renaming, deleting, and clearing
Data • Cell values• Supporting detail• Account annotations• Cell-level documents
Launch Business Rules Updates from calculation scripts and businessrules (including runtime prompts)
Form Definition Forms: Creating, modifying, adding rows (Theaudit record doesn't record how the designchanged.)
Form Folder Administration Folders: Created, moved, or deleted
Approvals Approvals: Approval unit owners and status
15-1
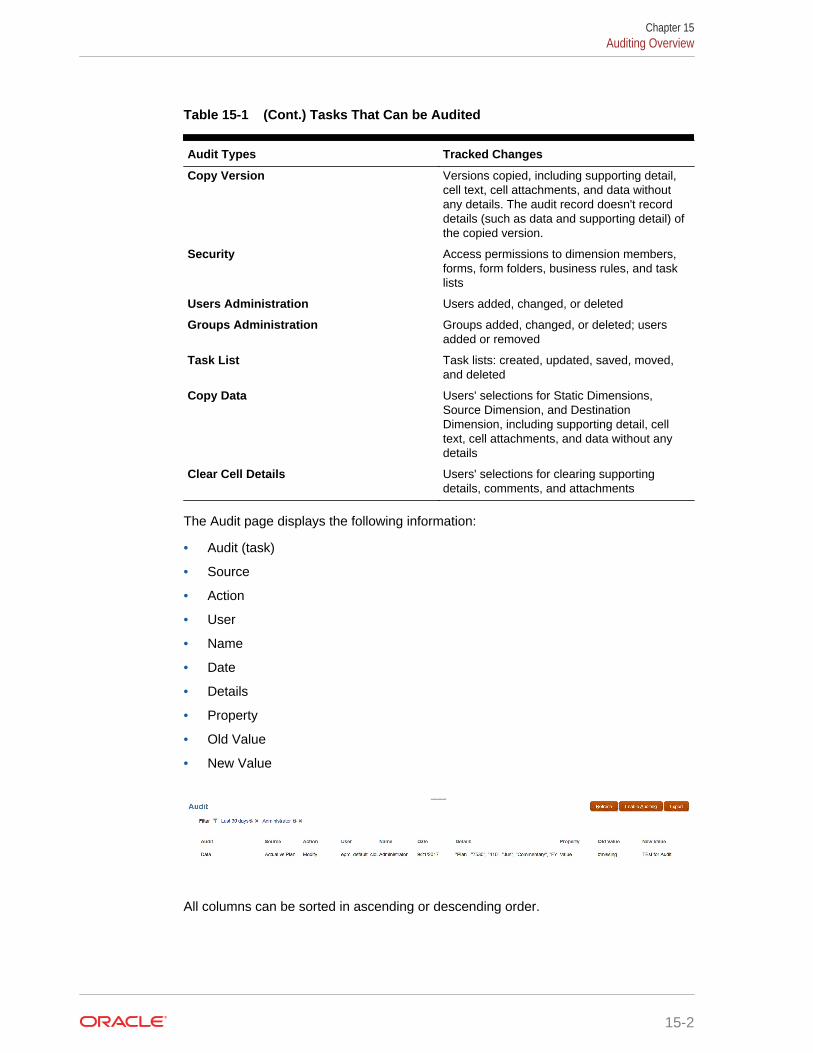
Table 15-1 (Cont.) Tasks That Can be Audited
Audit Types Tracked Changes
Copy Version Versions copied, including supporting detail,cell text, cell attachments, and data withoutany details. The audit record doesn't recorddetails (such as data and supporting detail) ofthe copied version.
Security Access permissions to dimension members,forms, form folders, business rules, and tasklists
Users Administration Users added, changed, or deleted
Groups Administration Groups added, changed, or deleted; usersadded or removed
Task List Task lists: created, updated, saved, moved,and deleted
Copy Data Users' selections for Static Dimensions,Source Dimension, and DestinationDimension, including supporting detail, celltext, cell attachments, and data without anydetails
Clear Cell Details Users' selections for clearing supportingdetails, comments, and attachments
The Audit page displays the following information:
• Audit (task)
• Source
• Action
• User
• Name
• Date
• Details
• Property
• Old Value
• New Value
All columns can be sorted in ascending or descending order.
Chapter 15Auditing Overview
15-2
Enabling Audit TrackingAudit tracking isn't enabled by default. Service Administrators must enable auditing sodata changes can be tracked.
To enable auditing:
1. On the Home page, click Tools, and then click Audit.
2. From the Audit page, click Enable Auditing.
3. From the Enable Auditing page, select an audit tasks or tasks, and then clickSave and Close.
Viewing Audit DetailsTo view audit details:
1. On the Home page, click Tools, and then click Audit.
If auditing is enabled, by default the Audit page displays the audit records for Datatasks for the Last 7 Days. To enable auditing, see Enabling Audit Tracking.
2. To filter, click , and select filter criteria:
• Audit Types—Select one or more, or All. For a list of audit types anddescriptions, see Auditing Overview.
• Date Range—Select Today, Yesterday, Last 7 Days, Last 30 Days, Last 60Days, or Last 180 Days.
Note:
You can't select a date range prior to 180 days from today. The daterange you select must occur between today and 180 days prior totoday (including today).
• User Name—Enter a user name or click to search for the user.
3. When you're done selecting filter criteria, click Apply.
The grid displays the first 200 records from the audit table that match the filtercriteria. You can view a legend at the bottom of the table if the filter criteria hasmore than 200 records in it.
4. To export the audit information to a Microsoft Excel spreadsheet, click Export, andfollow the download instructions.
When you select the Export option, the system exports all of the records matchingthe filter criteria to an xlsx file (format for Microsoft Excel versions 2007 and later).
Chapter 15Enabling Audit Tracking
15-3
Note:
• Audit information is maintained for 6 months. If you want to access auditinformation beyond 6 months, download it and maintain a copy of theaudit records.
• If data auditing is enabled, users can see what data has changed byselecting Actions, and then Change History.
Chapter 15Viewing Audit Details
15-4
16Managing Data Validation
Related Topics
• Creating and Updating Data Validation Rules
• Formatting Cells and Setting the Promotional Path
• Viewing Data Validation Rules
• Order of Evaluation and Execution for Data Validation Rules
• Conditions Supported by the Rule Builder
• Data Validation Conditional Operators
• Data Validation Rule Scenarios
Creating and Updating Data Validation RulesTo implement business policies and practices, you can build data validation rules thatare checked when conditions are met in forms. Validation messages can be generatedif entered data violates validation rules. You can also build limits on submittedapproval unit data using validation rules, and designate a reviewer, owner, or notifierto review data that meets some condition.
For example, data validation can ensure that a department’s capital expenses adhereto company policies by preventing planners from submitting budgets that containcapital expenditures that fall outside the company’s guidelines. Sample scenarios thatcan be addressed using data validation rules are described in Data Validation RuleScenarios.
Defining data validation rules involves these main tasks:
• Identifying the data cells or location that you want to display with validationmessages or in different colors when conditions are met.
• Identifying the cells that need to participate during rule evaluation, and defining therule accordingly.
• Creating the data validation rule at the location identified, as described in thistopic.
To create and update validation rules:
1. On the Home page, click Navigator , and then under Create and Manage,click Forms.
2. Create or edit a form, and then on the Form and Ad Hoc Grid Managementpage, click Layout.
3. In Layout, right-click the grid, row heading, column heading, or cell for which youwant to add or update the validation rule.
16-1
Note:
When you hover the cursor over cells in Layout, a context menudisplays whether the cell contains a validation rule. To view thevalidation message, select Show Data Validation Messages. Thecontext menu also displays when a single cell is selected.
4. Select Add/Edit Validation Rules to create or update rules.
5. To add a rule, click and enter a name and description for the rule.
If necessary, move the rule by selecting an option from Location. To create a rule
similar to an existing rule, click and then update the rule. To view rules, clickView Rule. See Viewing Data Validation Rules.
6. Update the rule.
a. For Condition, select an option to begin the condition statement: If, Else If,Else, Then, Check Range, or Range.
The first part of a rule must include an If condition. Rules must also containsome form of Then condition. See Conditions Supported by the Rule Builder.
b. For Source Type, select an option for evaluation by the rule.
The Source Type list displays the appropriate options for the Condition. Forexample, If conditions can include Current Cell Value, Cell Value, ColumnValue, Row Value, Member Name, Member, Cross-Dim Member, AccountType, Version Type, Var Reporting Type, UDA, or Attribute. For detailedinformation about each type of condition, see Conditions Supported by theRule Builder.
c. If applicable for the selected Source Type, enter a value in Source Value byselecting an option or entering a free form value.
d. Select an operator for the evaluation: =, !=, <, <=, >, >=, Equals, Not Equals,Contains, Starts With, or Ends With, In, or Not In.
For examples, see Data Validation Conditional Operators.
e. Select an option for the appropriate Target Type for the rule.
f. Update conditions by clicking an icon in the Actions column to the right of thecondition builder:
• —Add a condition next to the current row.
• —Delete a condition at the current row.
g. Select conditions or condition blocks to update.
To update condition blocks, click an icon in the Condition area, at the top ofthe condition builder:
• —Add a condition block within the validation rule starting with If. Youcan expand or collapse the condition. See Conditions Supported by theRule Builder.
• —Delete the selected condition block.
Chapter 16Creating and Updating Data Validation Rules
16-2
• —Delete selected conditions, and copy them to paste in a newlocation.
• —Copy selected conditions.
• —Paste selected conditions to a new location.
• —Group the selection within a condition, and add a groupingparenthesis. In addition to groupings that you set, the If statement in thegrouping block is grouped when a condition is grouped, and the CustomGrouping option is enabled.
• —Ungroup the selected conditions. The grouping parentheses areremoved from the selected condition. One grouping is removed from thecondition each time Ungroup is selected.
You can also set your own grouping for conditions by selecting CustomGrouping, then setting up the grouping in the rule definition area.
Selected conditions are displayed as shaded. To clear selectedconditions, click once more to the left of the Condition column.
7. Click in the rightmost column to add processing instructions.
Note:
If the icon isn't displayed, ensure that the rule is valid and that it permitscell processing instructions. For example, cell processing instructions areincluded for Else, Range, and Then conditions. The icon isn't displayeduntil all required columns are selected for a rule.
See Formatting Cells and Setting the Promotional Path.
8. When you're ready to enable the rule to make it available in the form, selectEnable Validation Rule.
Tip:
While you're building a rule, you can save the rule without enabling it.After any errors are resolved and the rule is ready to be validated andused, you can enable and save the rule to make it available in the form.You can temporarily disable a rule by clearing Enable Validation Rule.
9. When you finish updating the rule, validate the rule:
a. Click Validate.
The validation status displays at the top of the dialog box. You must correcterrors before you save changes. If you close the dialog box without validatingrules and fixing errors noted during validation, updates are not saved.
Chapter 16Creating and Updating Data Validation Rules
16-3
b. After fixing any errors noted during validation, ensure that Enable ValidationRule is selected above the rule definition area to enable the rule for theapplication.
c. After the rule is validated, click OK.
10. Optional: In the Form and Ad Hoc Grid Management page, view and updaterules:
• In the Validation Rules pane on the right side of the Form and Ad Hoc Grid
Management page, add, edit, or delete rules by clicking , , or .
• To view rules at the current level or higher, click in the Manage Form page,and then select an option from the Validation Rules drop-down list.
• If multiple rules are defined at the same location, you can change the order inwhich rules are processed when rules have the same precedence. To move arule up, down, or to the top or bottom of the list, select the rule and click thearrows. See Order of Evaluation and Execution for Data Validation Rules.
• To prevent validations associated with the form from executing whenvalidating the approval unit if the currently logged in user doesn't have accessto the form, select Validate only for users with access to this form.
11. In the Form and Ad Hoc Grid Management page, preview and validate the form,resolve any validation errors, and then save changes.
For forms that have data validation rules enabled, rules are validated when theform is loaded or saved. Data validation rules are saved when the form is saved.See Creating Simple Forms.
When users open the form, they can view and resolve validation messages usingthe Data Validation Messages pane. See Working with Planning for OraclePlanning and Budgeting Cloud.
Formatting Cells and Setting the Promotional PathAfter a rule is set up, use the Process Cell dialog box to set how cells display in forms,and update the promotional path based on data validations.
To format cells and set the promotional path:
1. In the Data Validation Rule Builder dialog box, click in the right-most column.
Note:
If the icon isn't displayed, ensure that the rule is valid and that it permitscell processing instructions. For example, cell processing instructions areincluded for Else, Range, and Then conditions. The icon isn't displayeduntil all required columns are selected for a rule. See Creating andUpdating Data Validation Rules.
2. In the Process Cell dialog box, set how the cell should appear in forms if theconditions defined by this rule are fulfilled.
Chapter 16Formatting Cells and Setting the Promotional Path
16-4
When the rule is enabled, it doesn't validate unless you specify at least one ofthese options: a cell background color, a validation message, or a promotionalpath option.
• To add or update the cell background color, click . To remove the cell
background color, click .
• To display a validation message for the cell, enter the message in theValidation Message field. Users see this text when they select Show DataValidation Messages in the context menu that appears when you hover overthe cell in the form. It also appears as a link in the Data Validation Messagespane if data cells are flagged by the validation rules and the Display messagein the Data Validation Messages pane check box is selected. Forinformation on viewing and resolving data validation errors, see Working withPlanning for Oracle Planning and Budgeting Cloud.
• To update the approval unit promotional path based on the data validation rulespecified for the cell, select an Approvals option.
You can leave the option as None to specify no changes to the promotionalpath, if the data cell is in a technically valid state and you're only updating thecell background color or specifying a validation message. You can also selectUpdate Promotional Path or Do Not Promote (to prevent the approval unitfrom being promoted if the condition is fulfilled). See Modifying the ApprovalUnit Promotional Path.
3. Click OK.
Updates for the rule are displayed in the Process column for the rule. If youspecified a cell color, that color is displayed. You can preview a validationmessage by hovering the cursor over the Process column.
Viewing Data Validation RulesAfter data validation rules are set up with processing instructions, you can use theView Rule dialog box to view all rules that apply to the selected grid, row, column, orcell.
To view data validation rules:
1. In the Data Validation Rule Builder dialog box, click View Rule to view all therules at this level (grid, row, column, cell) for this location in the form.
2. Select the rule name, and then double-click the rule or click OK to view details.
Order of Evaluation and Execution for Data Validation RulesFor data validation rules in forms, the precedence for rule evaluation depends oncondition priority, location of the rule, and position of the rule in the rule list (if multiplerules exist in the same location). First, cell-level rules are processed. Next, rules at thecolumn level are processed, and then row-level rules are processed. Finally, rules atthe grid level are processed. The rules are evaluated based on their position in the rulelist within each level.
Location and position determine the order in which the rule will be processed.However, the priority of the processing instructions determines which rule is applied tothe data cell. So, if a cell-level rule contains processing instructions with priority 4 and
Chapter 16Viewing Data Validation Rules
16-5
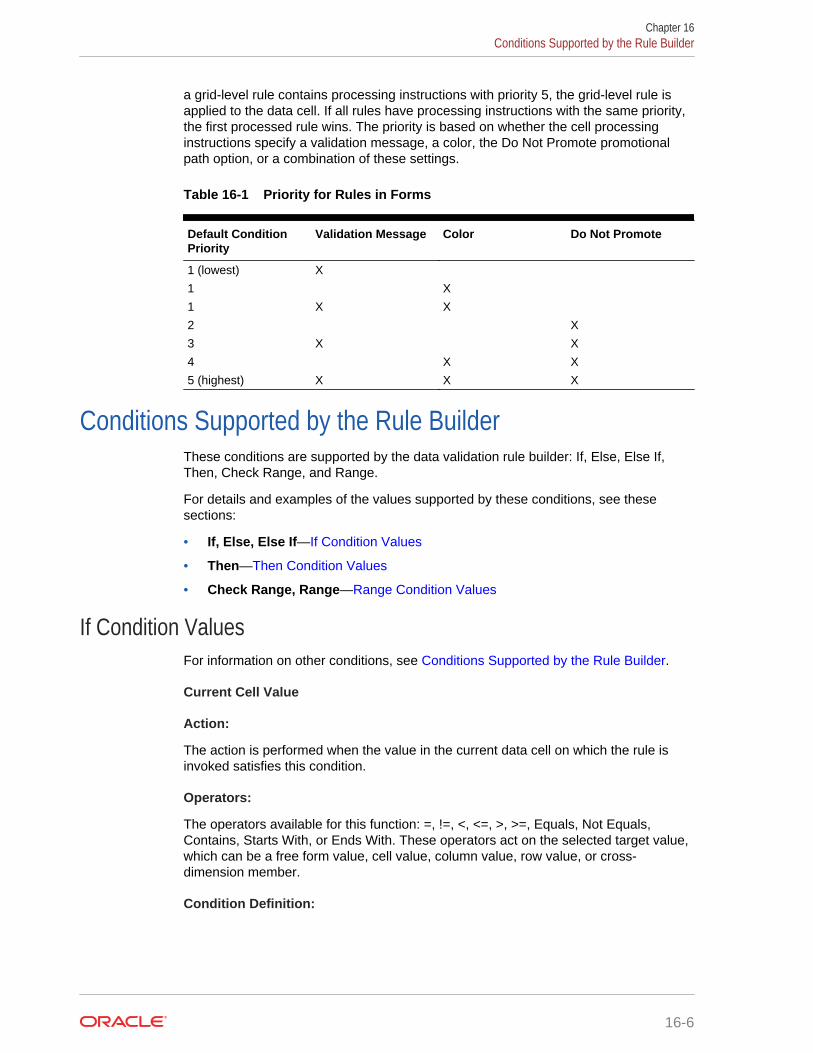
a grid-level rule contains processing instructions with priority 5, the grid-level rule isapplied to the data cell. If all rules have processing instructions with the same priority,the first processed rule wins. The priority is based on whether the cell processinginstructions specify a validation message, a color, the Do Not Promote promotionalpath option, or a combination of these settings.
Table 16-1 Priority for Rules in Forms
Default ConditionPriority
Validation Message Color Do Not Promote
1 (lowest) X
1 X
1 X X
2 X
3 X X
4 X X
5 (highest) X X X
Conditions Supported by the Rule BuilderThese conditions are supported by the data validation rule builder: If, Else, Else If,Then, Check Range, and Range.
For details and examples of the values supported by these conditions, see thesesections:
• If, Else, Else If—If Condition Values
• Then—Then Condition Values
• Check Range, Range—Range Condition Values
If Condition ValuesFor information on other conditions, see Conditions Supported by the Rule Builder.
Current Cell Value
Action:
The action is performed when the value in the current data cell on which the rule isinvoked satisfies this condition.
Operators:
The operators available for this function: =, !=, <, <=, >, >=, Equals, Not Equals,Contains, Starts With, or Ends With. These operators act on the selected target value,which can be a free form value, cell value, column value, row value, or cross-dimension member.
Condition Definition:
Chapter 16Conditions Supported by the Rule Builder
16-6
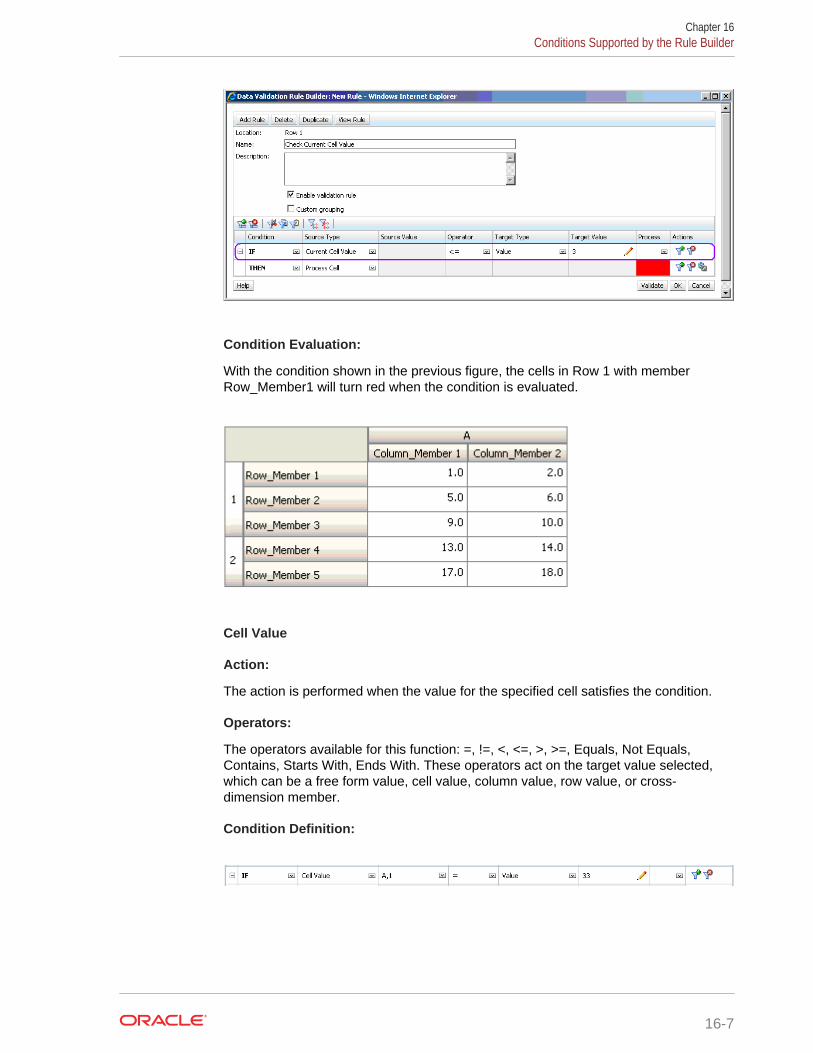
Condition Evaluation:
With the condition shown in the previous figure, the cells in Row 1 with memberRow_Member1 will turn red when the condition is evaluated.
Cell Value
Action:
The action is performed when the value for the specified cell satisfies the condition.
Operators:
The operators available for this function: =, !=, <, <=, >, >=, Equals, Not Equals,Contains, Starts With, Ends With. These operators act on the target value selected,which can be a free form value, cell value, column value, row value, or cross-dimension member.
Condition Definition:
Chapter 16Conditions Supported by the Rule Builder
16-7
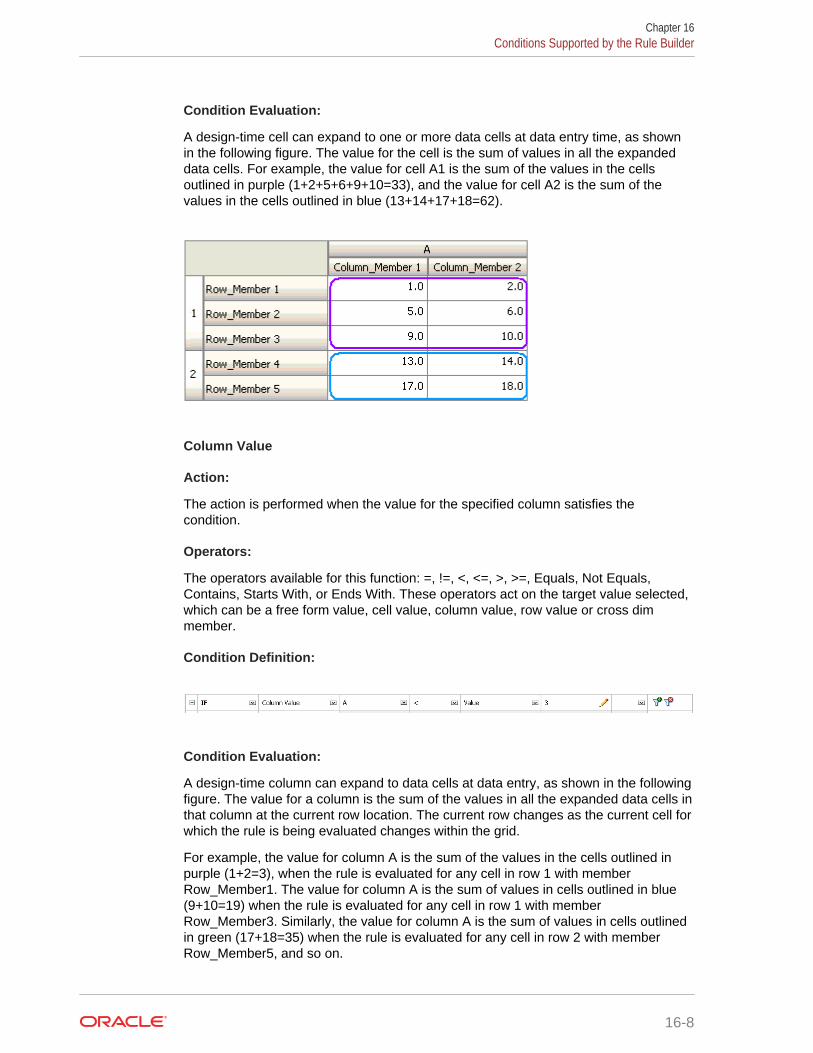
Condition Evaluation:
A design-time cell can expand to one or more data cells at data entry time, as shownin the following figure. The value for the cell is the sum of values in all the expandeddata cells. For example, the value for cell A1 is the sum of the values in the cellsoutlined in purple (1+2+5+6+9+10=33), and the value for cell A2 is the sum of thevalues in the cells outlined in blue (13+14+17+18=62).
Column Value
Action:
The action is performed when the value for the specified column satisfies thecondition.
Operators:
The operators available for this function: =, !=, <, <=, >, >=, Equals, Not Equals,Contains, Starts With, or Ends With. These operators act on the target value selected,which can be a free form value, cell value, column value, row value or cross dimmember.
Condition Definition:
Condition Evaluation:
A design-time column can expand to data cells at data entry, as shown in the followingfigure. The value for a column is the sum of the values in all the expanded data cells inthat column at the current row location. The current row changes as the current cell forwhich the rule is being evaluated changes within the grid.
For example, the value for column A is the sum of the values in the cells outlined inpurple (1+2=3), when the rule is evaluated for any cell in row 1 with memberRow_Member1. The value for column A is the sum of values in cells outlined in blue(9+10=19) when the rule is evaluated for any cell in row 1 with memberRow_Member3. Similarly, the value for column A is the sum of values in cells outlinedin green (17+18=35) when the rule is evaluated for any cell in row 2 with memberRow_Member5, and so on.
Chapter 16Conditions Supported by the Rule Builder
16-8
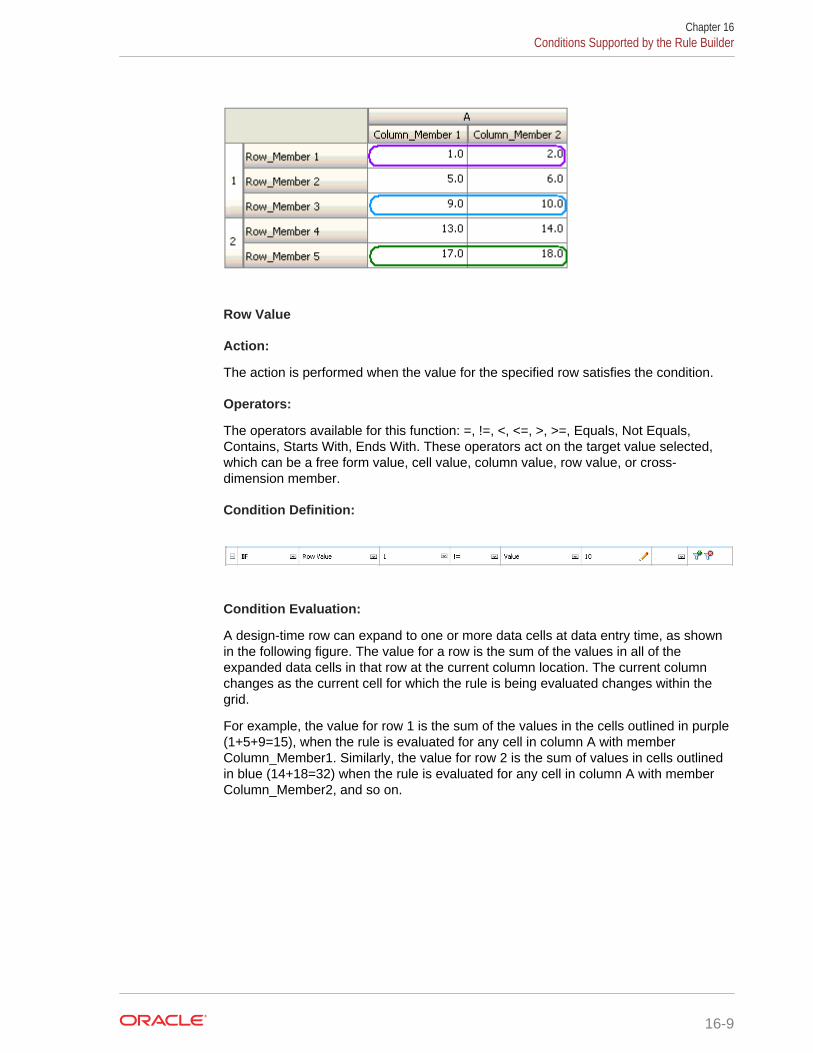
Row Value
Action:
The action is performed when the value for the specified row satisfies the condition.
Operators:
The operators available for this function: =, !=, <, <=, >, >=, Equals, Not Equals,Contains, Starts With, Ends With. These operators act on the target value selected,which can be a free form value, cell value, column value, row value, or cross-dimension member.
Condition Definition:
Condition Evaluation:
A design-time row can expand to one or more data cells at data entry time, as shownin the following figure. The value for a row is the sum of the values in all of theexpanded data cells in that row at the current column location. The current columnchanges as the current cell for which the rule is being evaluated changes within thegrid.
For example, the value for row 1 is the sum of the values in the cells outlined in purple(1+5+9=15), when the rule is evaluated for any cell in column A with memberColumn_Member1. Similarly, the value for row 2 is the sum of values in cells outlinedin blue (14+18=32) when the rule is evaluated for any cell in column A with memberColumn_Member2, and so on.
Chapter 16Conditions Supported by the Rule Builder
16-9
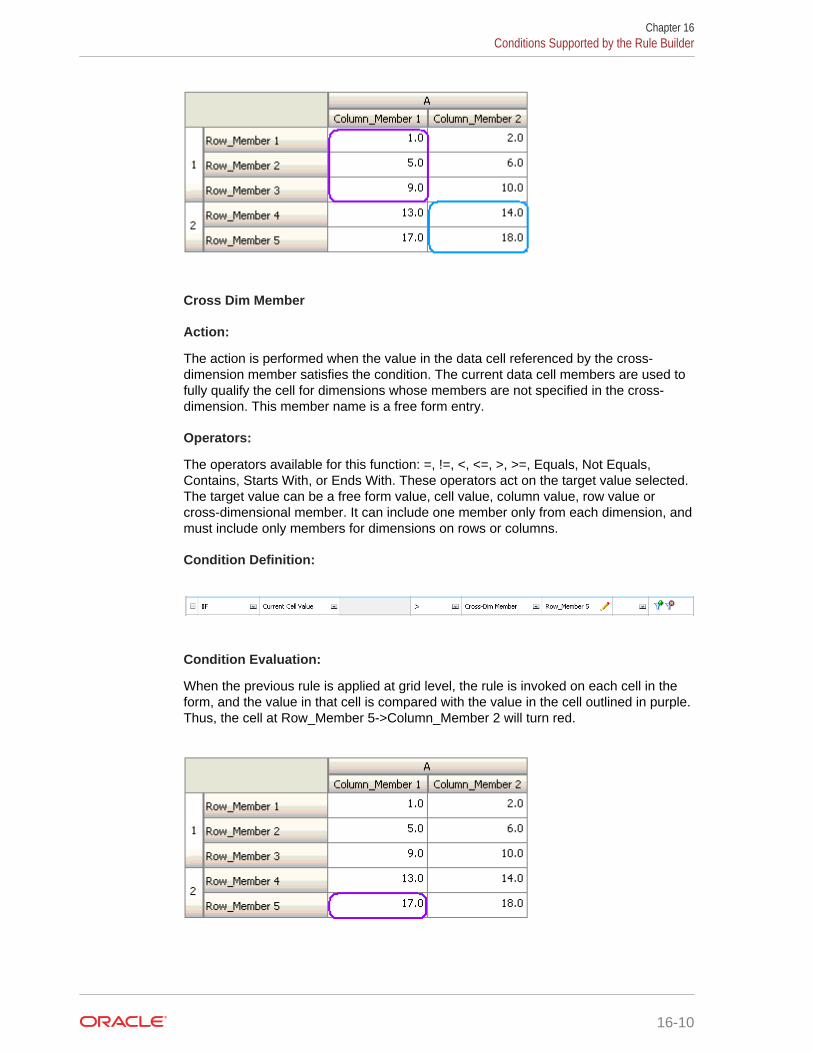
Cross Dim Member
Action:
The action is performed when the value in the data cell referenced by the cross-dimension member satisfies the condition. The current data cell members are used tofully qualify the cell for dimensions whose members are not specified in the cross-dimension. This member name is a free form entry.
Operators:
The operators available for this function: =, !=, <, <=, >, >=, Equals, Not Equals,Contains, Starts With, or Ends With. These operators act on the target value selected.The target value can be a free form value, cell value, column value, row value orcross-dimensional member. It can include one member only from each dimension, andmust include only members for dimensions on rows or columns.
Condition Definition:
Condition Evaluation:
When the previous rule is applied at grid level, the rule is invoked on each cell in theform, and the value in that cell is compared with the value in the cell outlined in purple.Thus, the cell at Row_Member 5->Column_Member 2 will turn red.
Chapter 16Conditions Supported by the Rule Builder
16-10
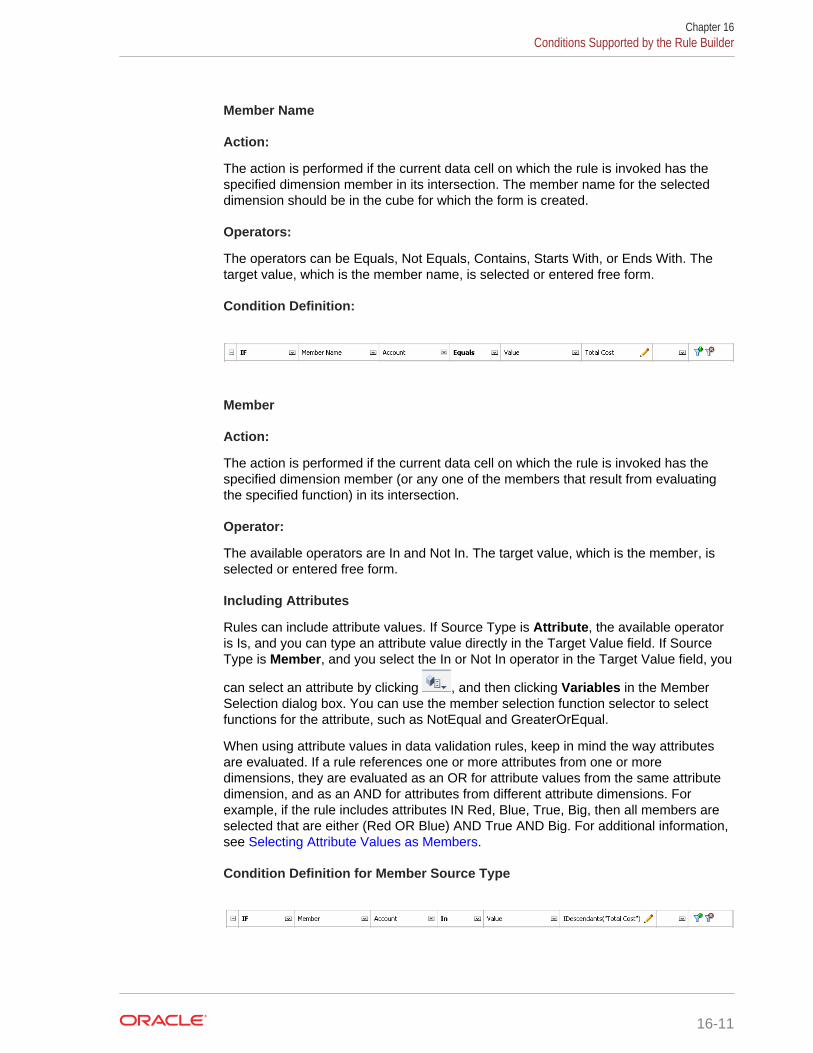
Member Name
Action:
The action is performed if the current data cell on which the rule is invoked has thespecified dimension member in its intersection. The member name for the selecteddimension should be in the cube for which the form is created.
Operators:
The operators can be Equals, Not Equals, Contains, Starts With, or Ends With. Thetarget value, which is the member name, is selected or entered free form.
Condition Definition:
Member
Action:
The action is performed if the current data cell on which the rule is invoked has thespecified dimension member (or any one of the members that result from evaluatingthe specified function) in its intersection.
Operator:
The available operators are In and Not In. The target value, which is the member, isselected or entered free form.
Including Attributes
Rules can include attribute values. If Source Type is Attribute, the available operatoris Is, and you can type an attribute value directly in the Target Value field. If SourceType is Member, and you select the In or Not In operator in the Target Value field, you
can select an attribute by clicking , and then clicking Variables in the MemberSelection dialog box. You can use the member selection function selector to selectfunctions for the attribute, such as NotEqual and GreaterOrEqual.
When using attribute values in data validation rules, keep in mind the way attributesare evaluated. If a rule references one or more attributes from one or moredimensions, they are evaluated as an OR for attribute values from the same attributedimension, and as an AND for attributes from different attribute dimensions. Forexample, if the rule includes attributes IN Red, Blue, True, Big, then all members areselected that are either (Red OR Blue) AND True AND Big. For additional information,see Selecting Attribute Values as Members.
Condition Definition for Member Source Type
Chapter 16Conditions Supported by the Rule Builder
16-11
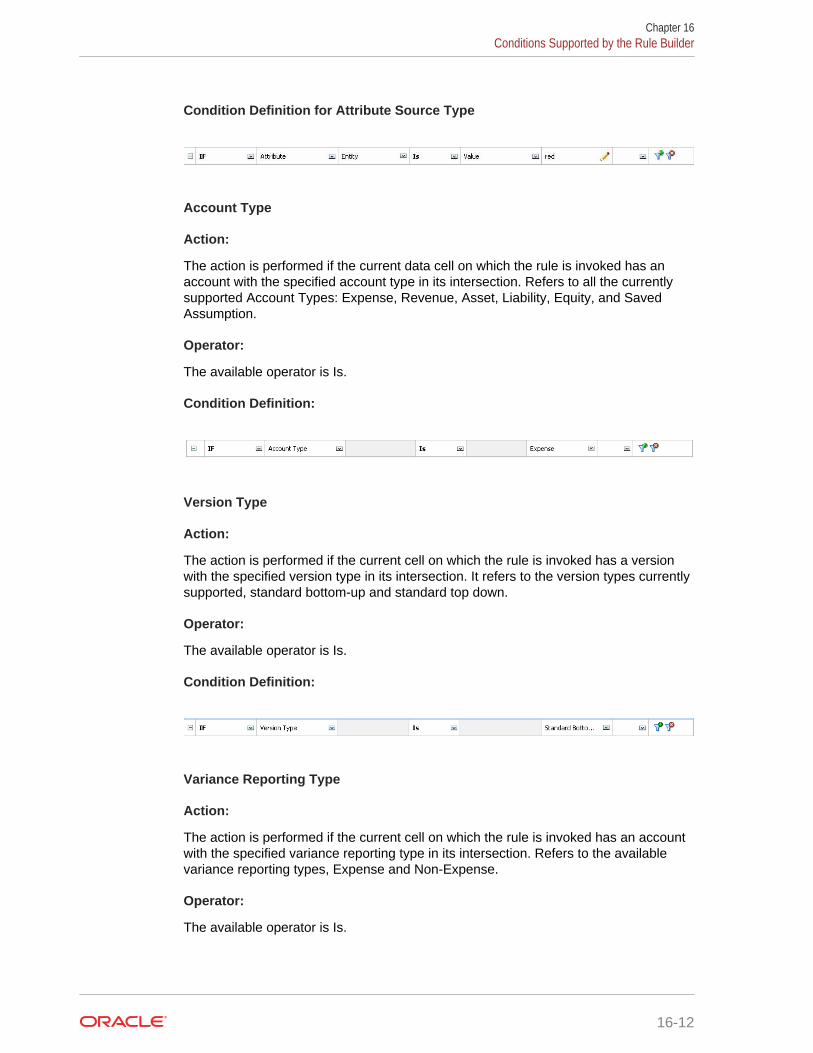
Condition Definition for Attribute Source Type
Account Type
Action:
The action is performed if the current data cell on which the rule is invoked has anaccount with the specified account type in its intersection. Refers to all the currentlysupported Account Types: Expense, Revenue, Asset, Liability, Equity, and SavedAssumption.
Operator:
The available operator is Is.
Condition Definition:
Version Type
Action:
The action is performed if the current cell on which the rule is invoked has a versionwith the specified version type in its intersection. It refers to the version types currentlysupported, standard bottom-up and standard top down.
Operator:
The available operator is Is.
Condition Definition:
Variance Reporting Type
Action:
The action is performed if the current cell on which the rule is invoked has an accountwith the specified variance reporting type in its intersection. Refers to the availablevariance reporting types, Expense and Non-Expense.
Operator:
The available operator is Is.
Chapter 16Conditions Supported by the Rule Builder
16-12
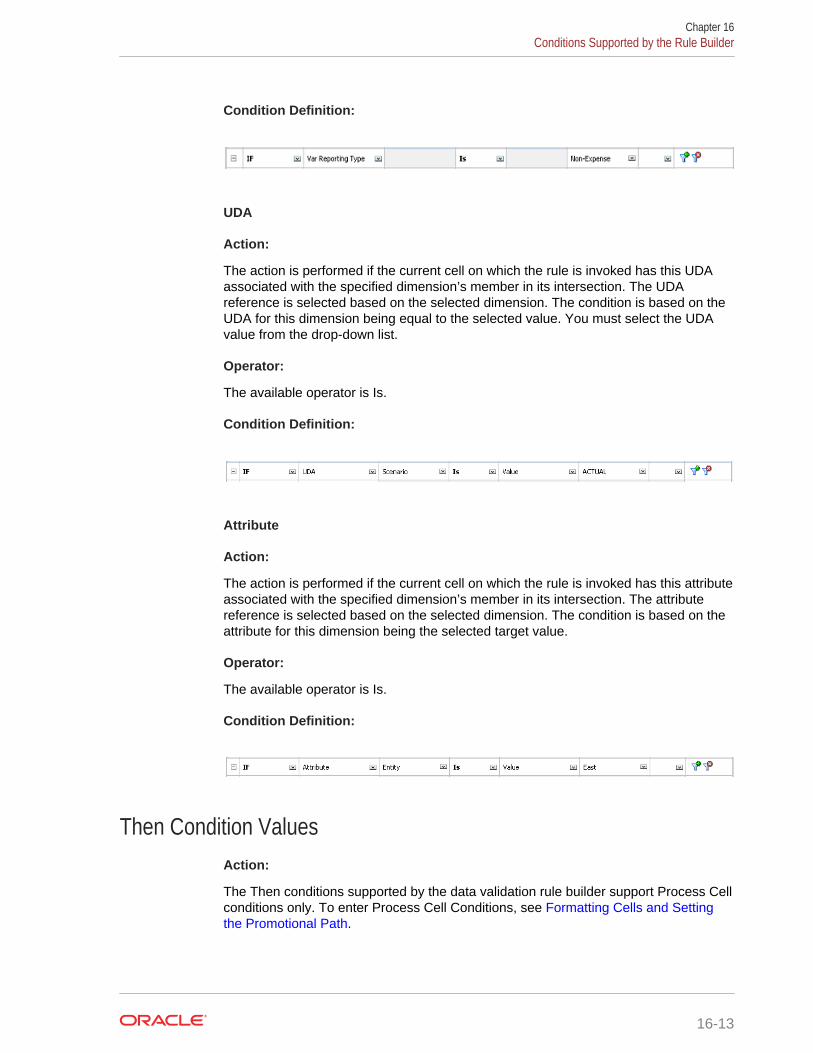
Condition Definition:
UDA
Action:
The action is performed if the current cell on which the rule is invoked has this UDAassociated with the specified dimension’s member in its intersection. The UDAreference is selected based on the selected dimension. The condition is based on theUDA for this dimension being equal to the selected value. You must select the UDAvalue from the drop-down list.
Operator:
The available operator is Is.
Condition Definition:
Attribute
Action:
The action is performed if the current cell on which the rule is invoked has this attributeassociated with the specified dimension’s member in its intersection. The attributereference is selected based on the selected dimension. The condition is based on theattribute for this dimension being the selected target value.
Operator:
The available operator is Is.
Condition Definition:
Then Condition ValuesAction:
The Then conditions supported by the data validation rule builder support Process Cellconditions only. To enter Process Cell Conditions, see Formatting Cells and Settingthe Promotional Path.
Chapter 16Conditions Supported by the Rule Builder
16-13
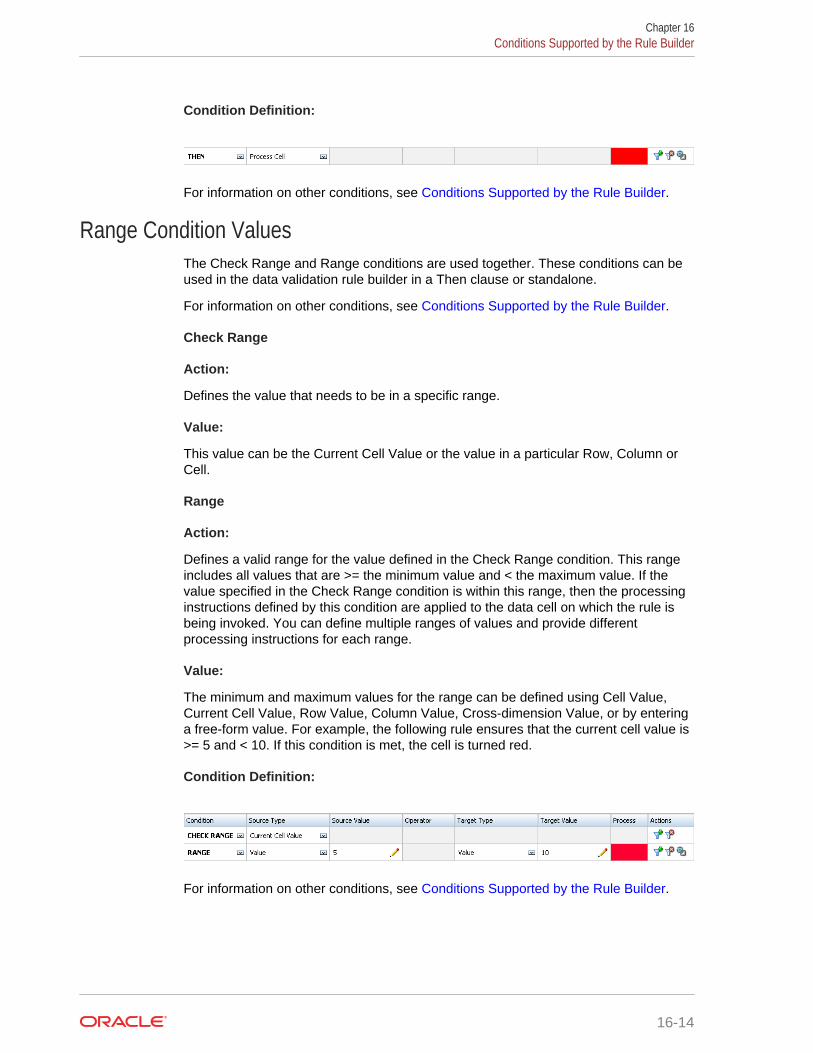
Condition Definition:
For information on other conditions, see Conditions Supported by the Rule Builder.
Range Condition ValuesThe Check Range and Range conditions are used together. These conditions can beused in the data validation rule builder in a Then clause or standalone.
For information on other conditions, see Conditions Supported by the Rule Builder.
Check Range
Action:
Defines the value that needs to be in a specific range.
Value:
This value can be the Current Cell Value or the value in a particular Row, Column orCell.
Range
Action:
Defines a valid range for the value defined in the Check Range condition. This rangeincludes all values that are >= the minimum value and < the maximum value. If thevalue specified in the Check Range condition is within this range, then the processinginstructions defined by this condition are applied to the data cell on which the rule isbeing invoked. You can define multiple ranges of values and provide differentprocessing instructions for each range.
Value:
The minimum and maximum values for the range can be defined using Cell Value,Current Cell Value, Row Value, Column Value, Cross-dimension Value, or by enteringa free-form value. For example, the following rule ensures that the current cell value is>= 5 and < 10. If this condition is met, the cell is turned red.
Condition Definition:
For information on other conditions, see Conditions Supported by the Rule Builder.
Chapter 16Conditions Supported by the Rule Builder
16-14
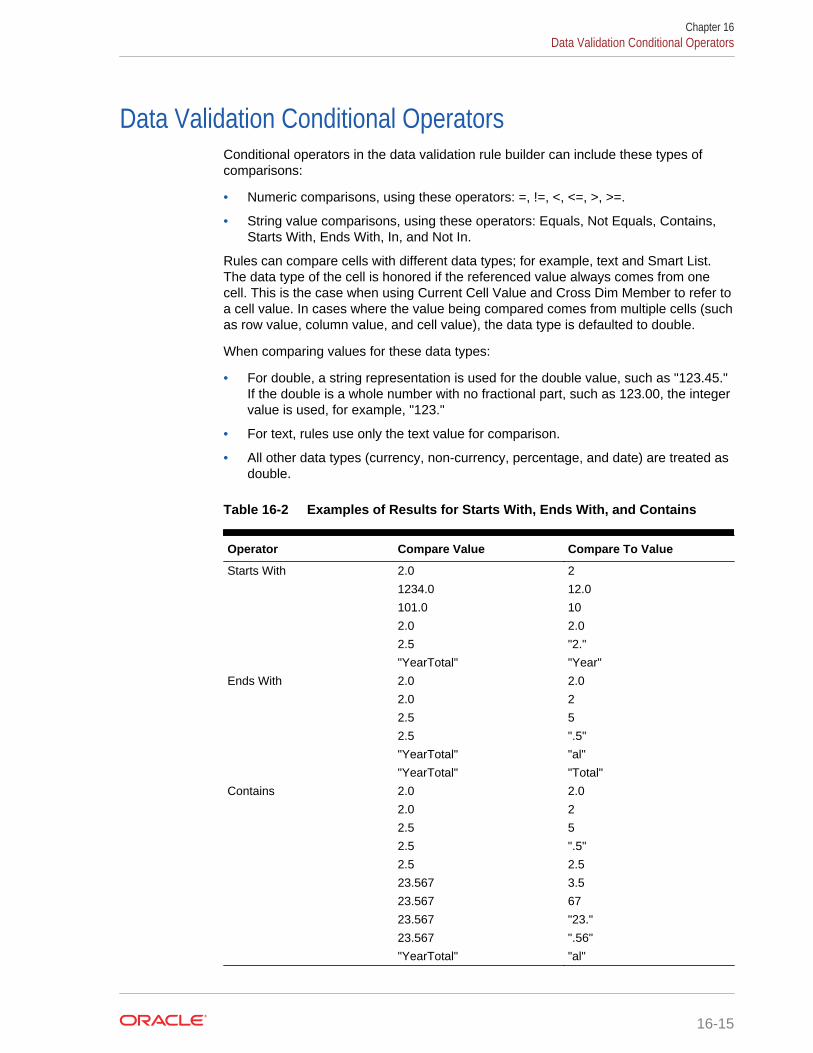
Data Validation Conditional OperatorsConditional operators in the data validation rule builder can include these types ofcomparisons:
• Numeric comparisons, using these operators: =, !=, <, <=, >, >=.
• String value comparisons, using these operators: Equals, Not Equals, Contains,Starts With, Ends With, In, and Not In.
Rules can compare cells with different data types; for example, text and Smart List.The data type of the cell is honored if the referenced value always comes from onecell. This is the case when using Current Cell Value and Cross Dim Member to refer toa cell value. In cases where the value being compared comes from multiple cells (suchas row value, column value, and cell value), the data type is defaulted to double.
When comparing values for these data types:
• For double, a string representation is used for the double value, such as "123.45."If the double is a whole number with no fractional part, such as 123.00, the integervalue is used, for example, "123."
• For text, rules use only the text value for comparison.
• All other data types (currency, non-currency, percentage, and date) are treated asdouble.
Table 16-2 Examples of Results for Starts With, Ends With, and Contains
Operator Compare Value Compare To Value
Starts With 2.0 2
1234.0 12.0
101.0 10
2.0 2.0
2.5 "2."
"YearTotal" "Year"
Ends With 2.0 2.0
2.0 2
2.5 5
2.5 ".5"
"YearTotal" "al"
"YearTotal" "Total"
Contains 2.0 2.0
2.0 2
2.5 5
2.5 ".5"
2.5 2.5
23.567 3.5
23.567 67
23.567 "23."
23.567 ".56"
"YearTotal" "al"
Chapter 16Data Validation Conditional Operators
16-15
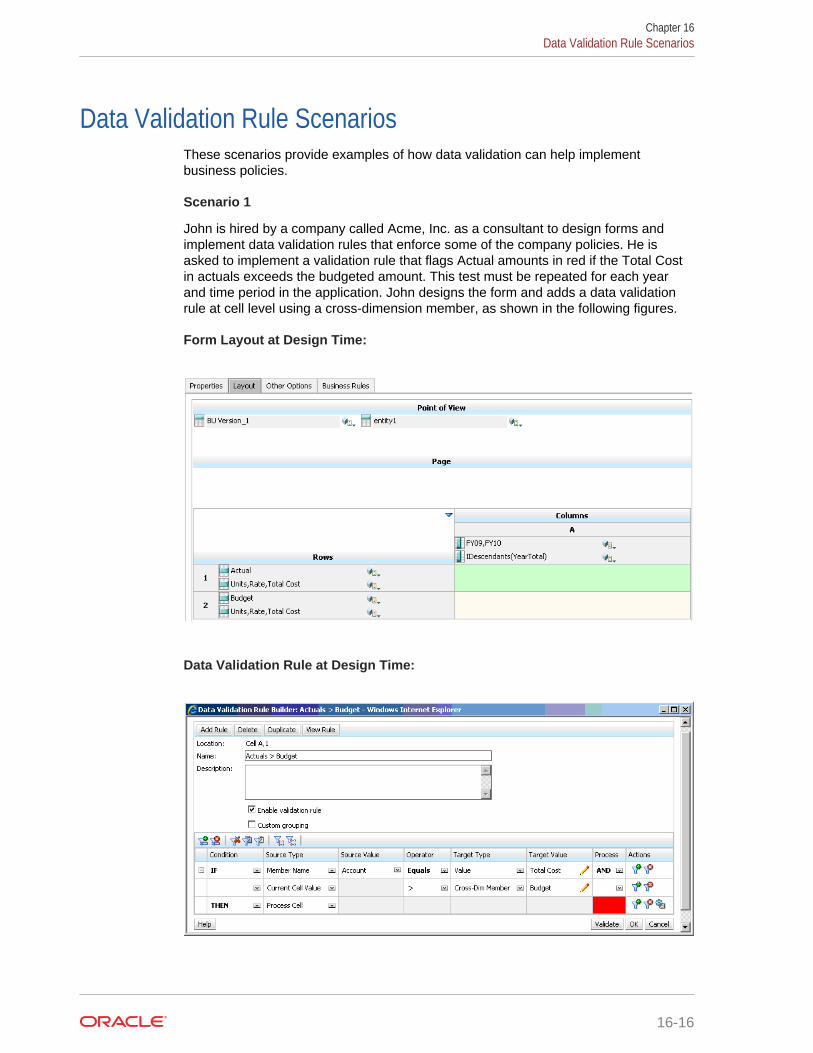
Data Validation Rule ScenariosThese scenarios provide examples of how data validation can help implementbusiness policies.
Scenario 1
John is hired by a company called Acme, Inc. as a consultant to design forms andimplement data validation rules that enforce some of the company policies. He isasked to implement a validation rule that flags Actual amounts in red if the Total Costin actuals exceeds the budgeted amount. This test must be repeated for each yearand time period in the application. John designs the form and adds a data validationrule at cell level using a cross-dimension member, as shown in the following figures.
Form Layout at Design Time:
Data Validation Rule at Design Time:
Chapter 16Data Validation Rule Scenarios
16-16
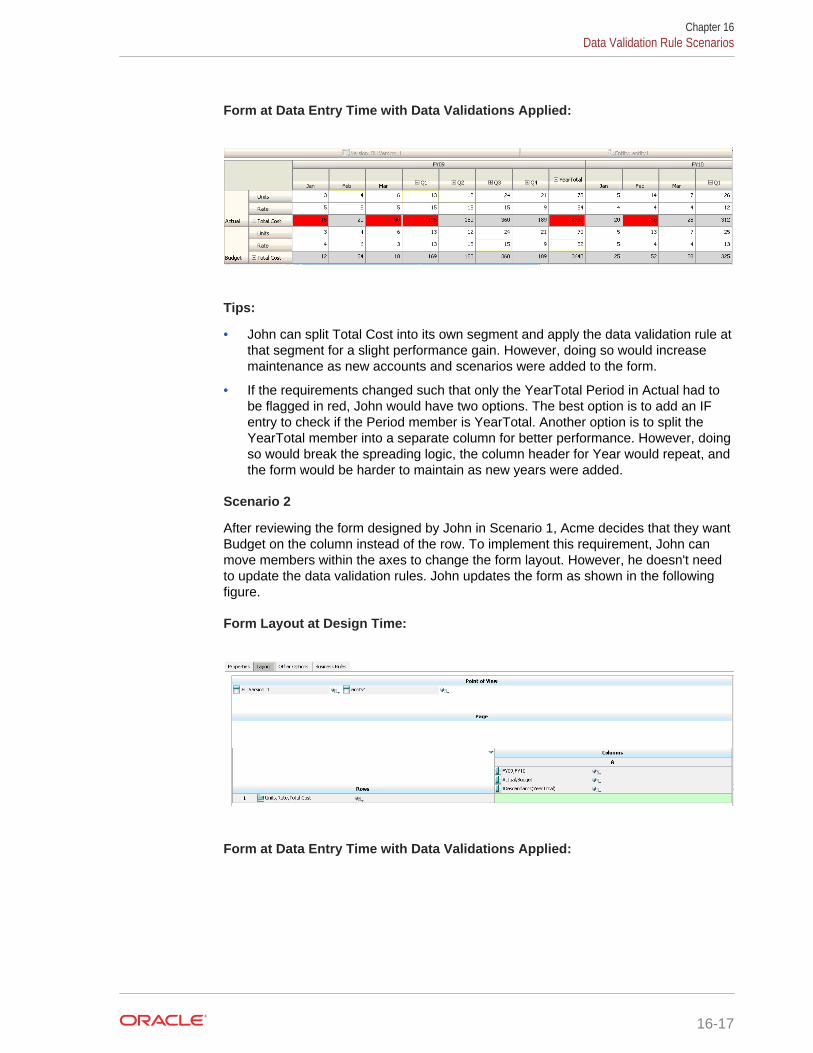
Form at Data Entry Time with Data Validations Applied:
Tips:
• John can split Total Cost into its own segment and apply the data validation rule atthat segment for a slight performance gain. However, doing so would increasemaintenance as new accounts and scenarios were added to the form.
• If the requirements changed such that only the YearTotal Period in Actual had tobe flagged in red, John would have two options. The best option is to add an IFentry to check if the Period member is YearTotal. Another option is to split theYearTotal member into a separate column for better performance. However, doingso would break the spreading logic, the column header for Year would repeat, andthe form would be harder to maintain as new years were added.
Scenario 2
After reviewing the form designed by John in Scenario 1, Acme decides that they wantBudget on the column instead of the row. To implement this requirement, John canmove members within the axes to change the form layout. However, he doesn't needto update the data validation rules. John updates the form as shown in the followingfigure.
Form Layout at Design Time:
Form at Data Entry Time with Data Validations Applied:
Chapter 16Data Validation Rule Scenarios
16-17
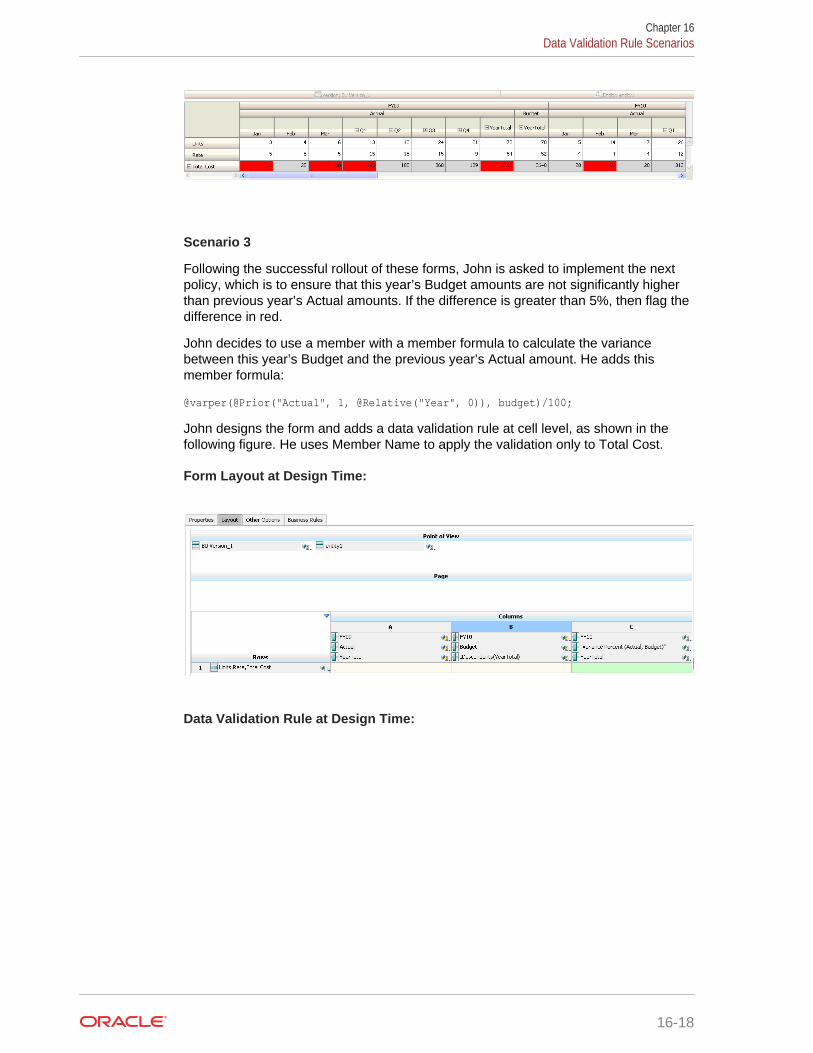
Scenario 3
Following the successful rollout of these forms, John is asked to implement the nextpolicy, which is to ensure that this year’s Budget amounts are not significantly higherthan previous year’s Actual amounts. If the difference is greater than 5%, then flag thedifference in red.
John decides to use a member with a member formula to calculate the variancebetween this year’s Budget and the previous year’s Actual amount. He adds thismember formula:
@varper(@Prior("Actual", 1, @Relative("Year", 0)), budget)/100;
John designs the form and adds a data validation rule at cell level, as shown in thefollowing figure. He uses Member Name to apply the validation only to Total Cost.
Form Layout at Design Time:
Data Validation Rule at Design Time:
Chapter 16Data Validation Rule Scenarios
16-18
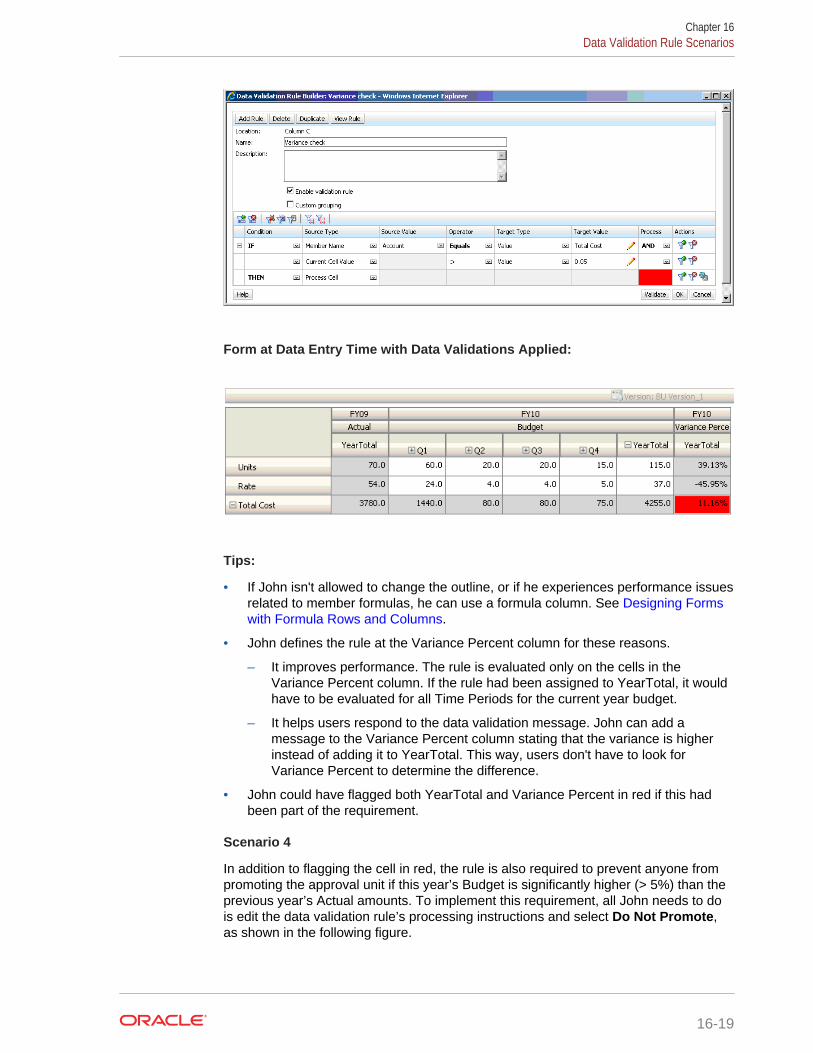
Form at Data Entry Time with Data Validations Applied:
Tips:
• If John isn't allowed to change the outline, or if he experiences performance issuesrelated to member formulas, he can use a formula column. See Designing Formswith Formula Rows and Columns.
• John defines the rule at the Variance Percent column for these reasons.
– It improves performance. The rule is evaluated only on the cells in theVariance Percent column. If the rule had been assigned to YearTotal, it wouldhave to be evaluated for all Time Periods for the current year budget.
– It helps users respond to the data validation message. John can add amessage to the Variance Percent column stating that the variance is higherinstead of adding it to YearTotal. This way, users don't have to look forVariance Percent to determine the difference.
• John could have flagged both YearTotal and Variance Percent in red if this hadbeen part of the requirement.
Scenario 4
In addition to flagging the cell in red, the rule is also required to prevent anyone frompromoting the approval unit if this year’s Budget is significantly higher (> 5%) than theprevious year’s Actual amounts. To implement this requirement, all John needs to dois edit the data validation rule’s processing instructions and select Do Not Promote,as shown in the following figure.
Chapter 16Data Validation Rule Scenarios
16-19
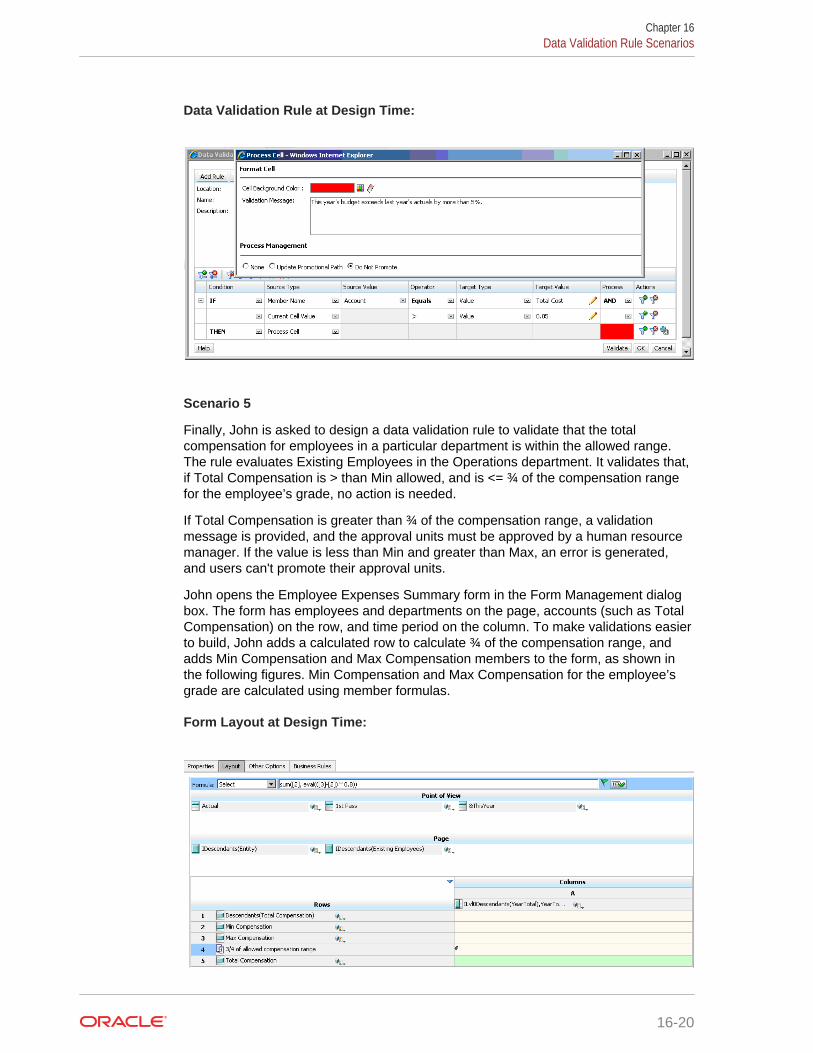
Data Validation Rule at Design Time:
Scenario 5
Finally, John is asked to design a data validation rule to validate that the totalcompensation for employees in a particular department is within the allowed range.The rule evaluates Existing Employees in the Operations department. It validates that,if Total Compensation is > than Min allowed, and is <= ¾ of the compensation rangefor the employee’s grade, no action is needed.
If Total Compensation is greater than ¾ of the compensation range, a validationmessage is provided, and the approval units must be approved by a human resourcemanager. If the value is less than Min and greater than Max, an error is generated,and users can't promote their approval units.
John opens the Employee Expenses Summary form in the Form Management dialogbox. The form has employees and departments on the page, accounts (such as TotalCompensation) on the row, and time period on the column. To make validations easierto build, John adds a calculated row to calculate ¾ of the compensation range, andadds Min Compensation and Max Compensation members to the form, as shown inthe following figures. Min Compensation and Max Compensation for the employee’sgrade are calculated using member formulas.
Form Layout at Design Time:
Chapter 16Data Validation Rule Scenarios
16-20
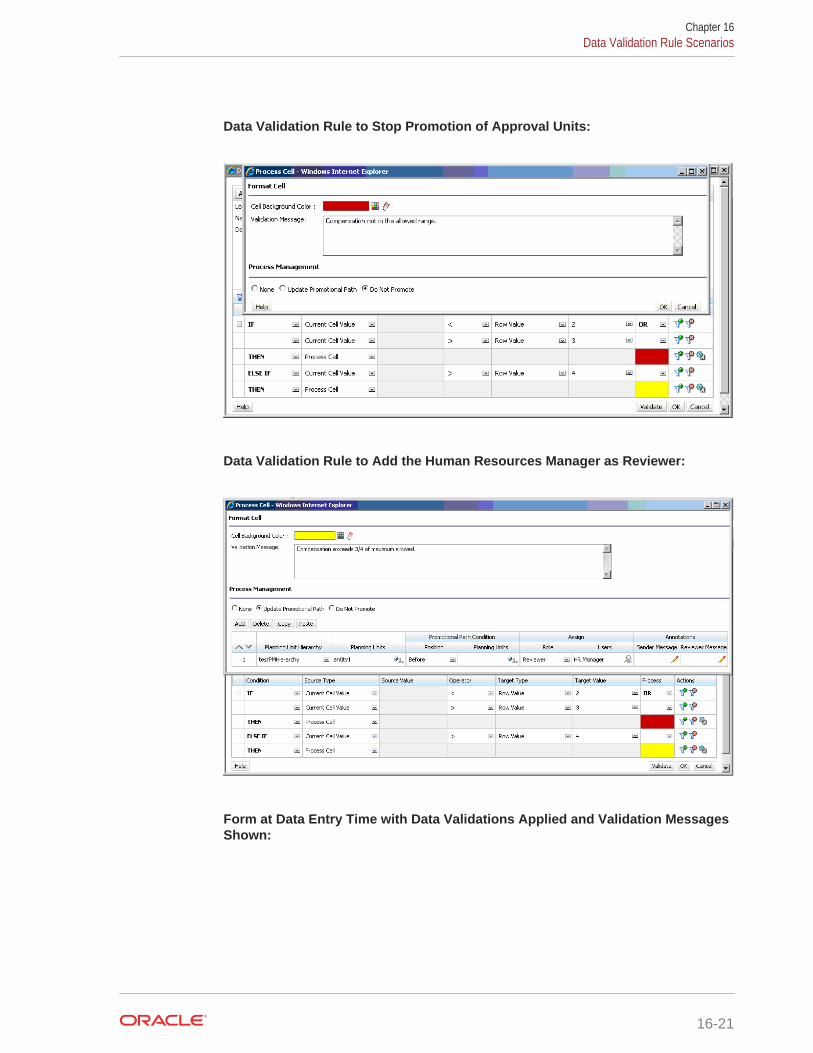
Data Validation Rule to Stop Promotion of Approval Units:
Data Validation Rule to Add the Human Resources Manager as Reviewer:
Form at Data Entry Time with Data Validations Applied and Validation MessagesShown:
Chapter 16Data Validation Rule Scenarios
16-21
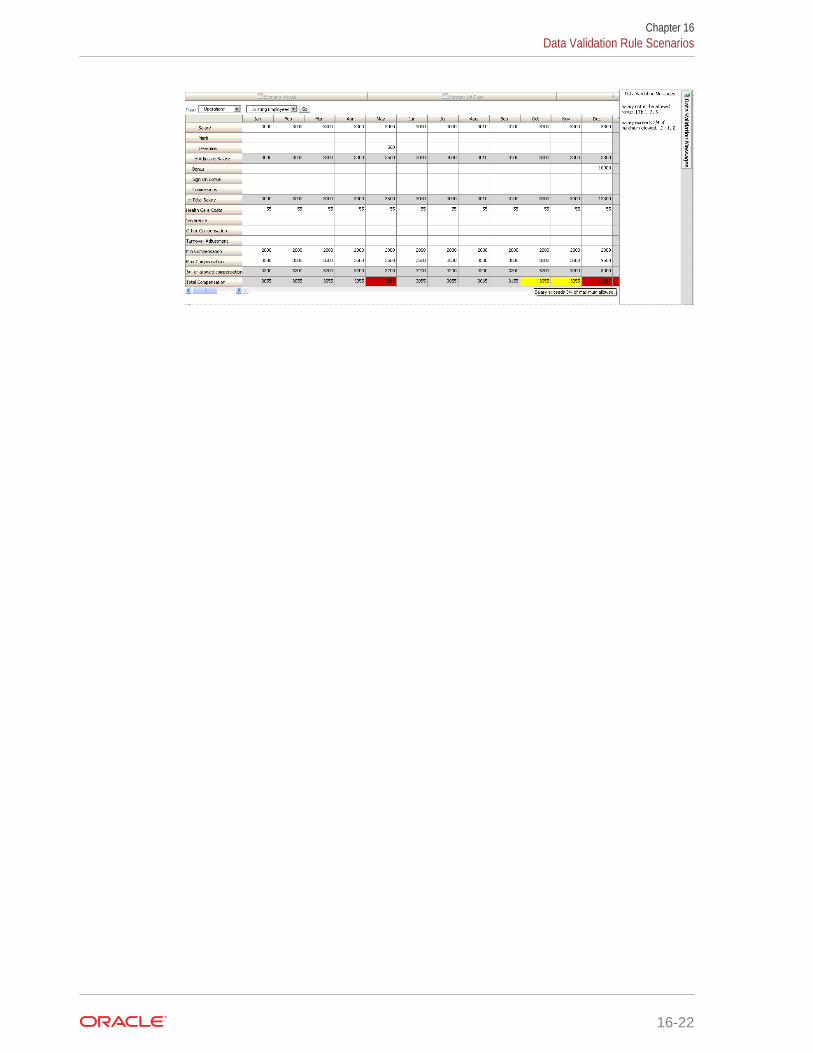
Chapter 16Data Validation Rule Scenarios
16-22
17Managing Application Settings
Related Topics
• What Application Settings Can I Specify?
• Defining User Variables
• Customizing Your Display
• Announcing Upcoming Events
• Specifying Artifact Labels
What Application Settings Can I Specify?You can control many aspects of the application, such as:
• How to display thousands, decimals, and negative numbers in forms
• Approvals actions to be taken when you're out of the office
• Actions about which you want to be notified
To change application settings:
1. Click Application, and then click Settings.
2. Specify options for the following settings:
• Number Formatting
• Notifications
• Approvals
• Date Time Display
• Alias Setting
• Refresh Database Options
To restore defaults, click Use Application Defaults. To use custom settings, click UseCustom Values.
Defining User VariablesYou can define user variables to help planners focus on particular members, such astheir department's expenses. For example, you can create a form with entities on therows, and a user variable called Department. You can limit the number of rowsdisplayed on the form by selecting a member for the Department user variable, suchas Sales. Later, you can select another value for Department, such as Marketing.
To update user variables:
1. Click Tools, and then click User Variables.
17-1
2. Click next to the variable to change.
3. On Member Selection, select members.
Customizing Your DisplayWant to change the theme of your display or add your company logo to the Homepage? Use Appearance to customize the appearance of the application display.
To customize your display:
1. Click Tools, and then click Appearance.
2. Specify a logo or background image or select another theme.
Note the following:
• Both the logo and background image can be customized. Any logo imagesmaller than 125px wide and 25px high can fit without scaling. For large imagelogos, Oracle recommends you maintain a 5:1 ratio so the image is scaledwithout distortion.
The default size for the background image is 1024x768. You can use a largerbackground image, however the image is scaled to fit the resolution setting ofyour display and the image is centered horizontally. If you want yourbackground image to fit both a browser and a mobile device, Oraclerecommends that you size the image so that it fits your biggest screen (orhighest resolution device).
• The logo and background image files must be accessible by URL. Importingimage files isn't supported.
Announcing Upcoming EventsCreate and send announcements to alert users about upcoming events, such assystem maintenance or the running of jobs. Announcements are displayed in theAnnouncements area on the application's Home page.
For more information about the Announcements area, see About the Home Page
To create an announcement:
1. Click Tools, and then click Announcement.
2. Click Create, and enter information such as:
• A subject that summarizes the purpose of the announcement
• The start date; when to send the announcement. The end date is optional.
• The content. You may need to select an editing mode (rich text or sourcecode) first.
Specifying Artifact LabelsThe Artifact Labels page on the Tools cluster enables administrators to customizeartifact labels (artifact names, descriptions, and so on) based on the user's browserlocale.
Chapter 17Customizing Your Display
17-2
A few examples:
• If you create a form with a cryptic name that you don't want displayed to the user,you can define a meaningful name for the form that is displayed in the language ofthe user.
• If you want to create a useful instruction for an artifact that only displays in thelanguage of the user, for example:
"This formula calculates the number of regular employees away on a Leave ofAbsence."
Related Links
• Which Artifact Labels Can be Localized?
• Working With the Artifact Labels Grid
• Adding Languages and Defining Localized Artifact Labels
• Exporting and Importing Artifact Labels for Editing
Which Artifact Labels Can be Localized?The application supports changing the language for the following artifacts:
• Card
• Cluster
• Dashboard
• Data Map
• Data Validation Rule
• Dimension
• Folder
• Form
• Member
• Menu
• Menu Item
• Navigation Flow
• Cube
• Approval Unit Hierarchy
• Report
• Rule
• Ruleset
• Smart List
• Smart List Entry
• Tab
• Task
• Task List
Chapter 17Specifying Artifact Labels
17-3
• Template
• User Variable
• Valid Intersection
Working With the Artifact Labels GridThe Artifact Labels page displays an Excel-style spreadsheet grid that is filtered byartifact and property type.
The row axis of the grid displays the artifacts and their properties.
The column axis of the grid displays the following columns:
• Artifact—The type of artifact (for example, Task List or Rule)
• Property—The artifact's property type (for example, Name, Description, and soon)
• Default—Displays the artifact labels that were defined when the artifact wascreated.
When a language is added, a new column displays to the right of the Default column.
To view and filter the Artifact Labels grid:
1. Click Tools, and then click Artifact Labels.
2. To filter:
a. Click , and then select the artifacts you want to work with. For someartifacts, you can further filter by property type.
b. Click Apply to close the Filter window and display the artifact grid filtered byartifact type and property type.
Adding Languages and Defining Localized Artifact LabelsAdministrators can add a language for a given artifact to the Artifact Labels grid froma list of supported languages. You can select only one language at a time. When youadd a language, a new column for that language is added to the grid to the right of theDefault column. The cells in the language-specific column are editable.
Tip:
Use this method to add labels directly in the artifact labels grid. This methodis ideal if you only need to add or update a few labels at a time. For bulkchanges or edits on artifact labels; for example, terminology changes thataffect multiple labels, use the export feature to edit in Excel, then import. See Exporting and Importing Artifact Labels for Editing.
To add a language:
1. Click Tools, and then click Artifact Labels.
Chapter 17Specifying Artifact Labels
17-4
2. Click , and then select the artifacts you want to work with. For some artifacts,you can further filter by property type.
3. Click Apply.
4. Click Add Language.
5. Select from the list of supported languages.
6. In the language-specific column, enter artifact labels into the editable cells for eachartifact property (Name, Description, and so on).
7. Click Save.
Note:
When you define a localized artifact label for the Default navigation flow (forexample, editing the name of an icon on the Home page), your update willautomatically propagate to all navigation flows. However, if you define alocalized artifact label for another navigation flow that isn't the Default flow,then that update will override the label coming from the Default flow.
Exporting and Importing Artifact Labels for EditingYou can export all the artifact labels in a given language to edit them. The labels areexported in an Excel file format (XLSX). After you edit the labels, you can import themback into the application.
Tip:
Use this method for bulk changes or edits on artifact labels by language; forexample, terminology changes that affect multiple labels. For updates toindividual artifact labels, you can edit them directly in the artifact grid. See Adding Languages and Defining Localized Artifact Labels.
To export and import artifact labels for editing:
1. Click Tools, and then click Artifact Labels.
2. Click , and then select the artifacts you want to work with. For some artifacts,you can further filter by property type.
3. Click Apply.
4. Click Actions.
• To export artifact labels:
a. Click Export.
b. Select the target environment of the export file:
– Local—Saves the export file to a location on your local computer.
Chapter 17Specifying Artifact Labels
17-5
– Outbox—Saves the export file to the server. See Uploading andDownloading Files Using the Application Inbox and Outbox.
c. Choose a language.
d. Click Export.
• To import artifact labels:
a. Click Import.
b. Select the location of the import file:
– Local—Loads the import file from a location on your computer. ForSource File, click Browseto select the import file on your computerfor the artifact you're importing.
– Inbox—Loads the import file from the server. Enter the name of thefile in Source File. See Uploading and Downloading Files Using theApplication Inbox and Outbox.
c. Click Import.
Chapter 17Specifying Artifact Labels
17-6
18Accessing More Administrative Tasks
Related Links
About the Navigator Menu
Administering Application Settings
Administering Data Load Settings
Importing Using Data Management
Administering Action Menus
Administering Alias Tables
Administering Dimensions
Administering Forms
Administering Rules
Administering Rules Security
Administering Smart Lists
Administering Task Lists
Setting User Preferences
Administering Variables
Clearing Cell Details
Copying Data
Administering the Application Monitor
Managing Approvals
Managing Approval Unit Hierarchies
Assigning Approval Unit Hierarchy Scenario and Version Combinations
About the Navigator Menu
Clicking Navigator on the Home page displays a list of links that connect you tomore application functionality.
18-1
Note:
Some of the links are available only if you're accessing the application fromthe desktop.
Administering Application SettingsIf you need to set application defaults, change system settings, or withdraw usersaccess to an application, you can do this from the System Settings and Defaultspage.
Subtopics:
• Setting Application Defaults
• Specifying System Settings
• Limiting Use of an Application
Setting Application DefaultsThere are two types of defaults you can set: Application Settings and DisplayOptions.
Application Settings lets you specify defaults for the following:
• Email notifications for task lists, approvals, and job console
• The alias table used
• The kind of member and alias data to display, such as both name and alias, whenselecting members
• Show approval units as aliases
• Show approval units that are not started
• Show approval units as aliases in approvals notification
• The attribute dimension date format
• Predictive Planning options for specifying the scenario/version to use for historicaldata values, and the prediction interval to use to use for worst case and best casevalues. Note that if no version member is specified for historical data, PredictivePlanning uses Actual ([current]) as the basis for historical data, which results inusing the first version on the form for the historical data.
• Choose a suppression behavior in Oracle Smart View for Office for cases whererows and columns contain missing data or zeroes. Selecting Legacy suppressesrows, or columns, or both that contain No Data/Missing or Zero, but not both.Selecting Standard suppresses rows, or columns, or both that contain both NoData/Missing and Zero.
Display Options lets you specify defaults for the following:
• Number formatting
• Remembering selected page members
Chapter 18Administering Application Settings
18-2
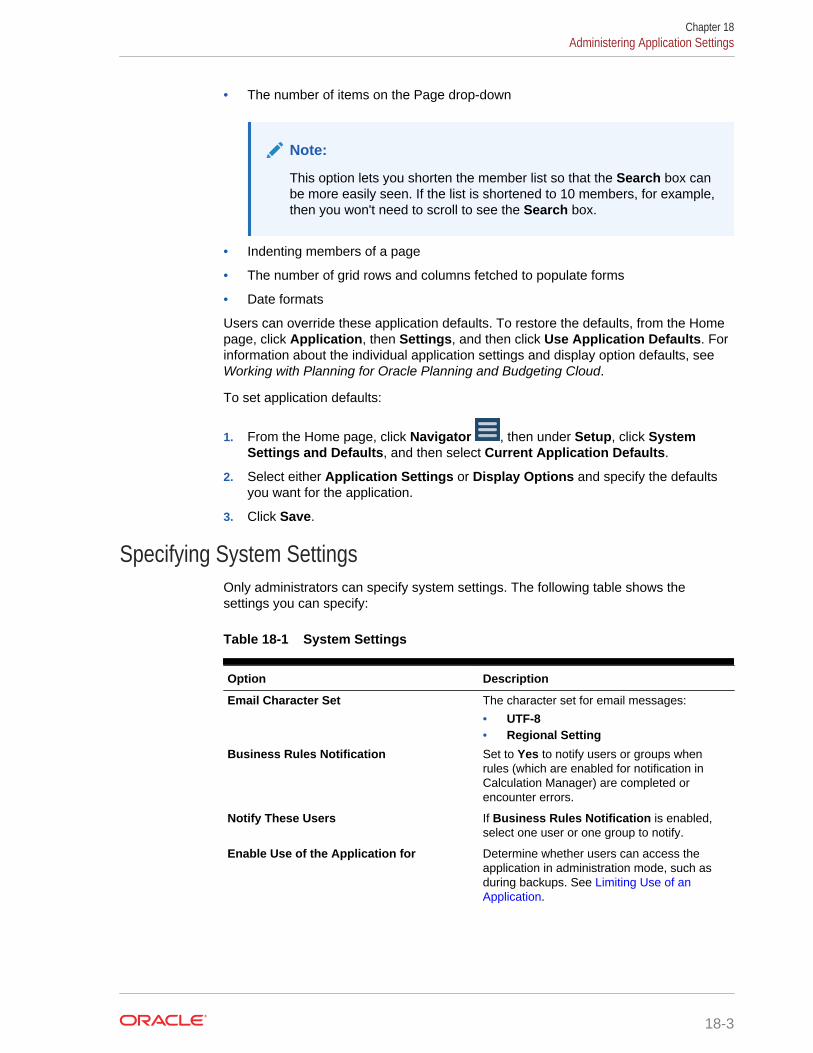
• The number of items on the Page drop-down
Note:
This option lets you shorten the member list so that the Search box canbe more easily seen. If the list is shortened to 10 members, for example,then you won't need to scroll to see the Search box.
• Indenting members of a page
• The number of grid rows and columns fetched to populate forms
• Date formats
Users can override these application defaults. To restore the defaults, from the Homepage, click Application, then Settings, and then click Use Application Defaults. Forinformation about the individual application settings and display option defaults, seeWorking with Planning for Oracle Planning and Budgeting Cloud.
To set application defaults:
1. From the Home page, click Navigator , then under Setup, click SystemSettings and Defaults, and then select Current Application Defaults.
2. Select either Application Settings or Display Options and specify the defaultsyou want for the application.
3. Click Save.
Specifying System SettingsOnly administrators can specify system settings. The following table shows thesettings you can specify:
Table 18-1 System Settings
Option Description
Email Character Set The character set for email messages:
• UTF-8• Regional Setting
Business Rules Notification Set to Yes to notify users or groups whenrules (which are enabled for notification inCalculation Manager) are completed orencounter errors.
Notify These Users If Business Rules Notification is enabled,select one user or one group to notify.
Enable Use of the Application for Determine whether users can access theapplication in administration mode, such asduring backups. See Limiting Use of anApplication.
Chapter 18Administering Application Settings
18-3
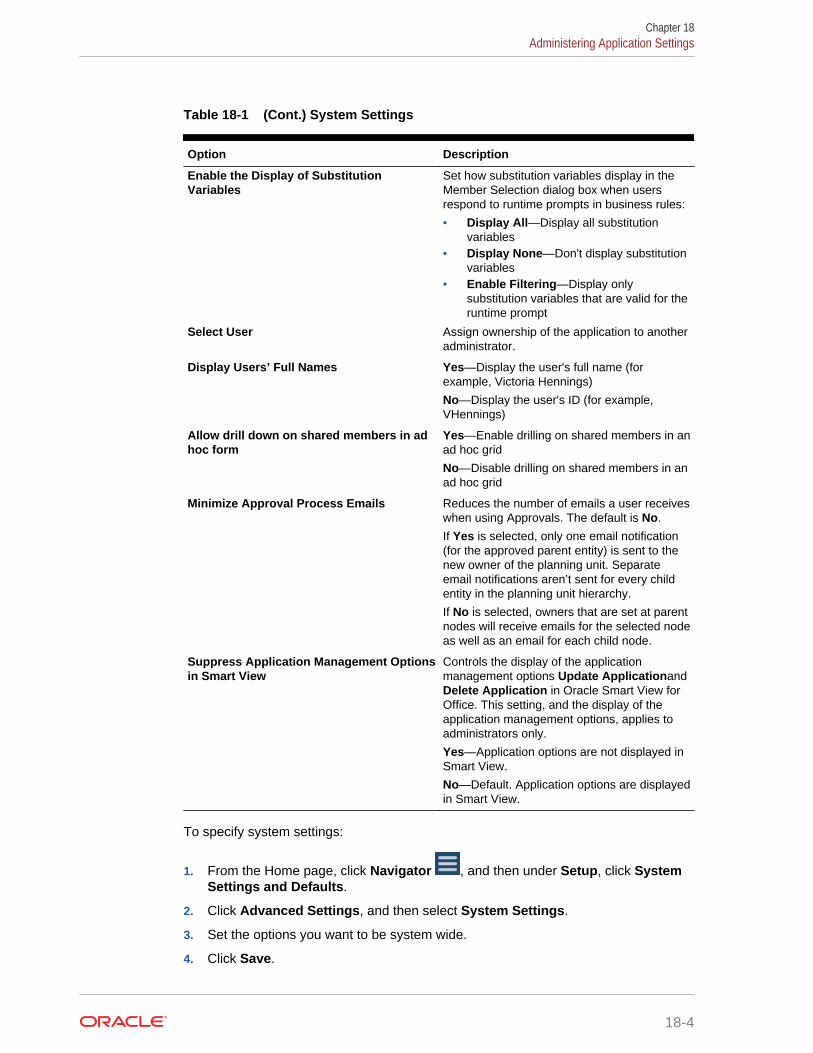
Table 18-1 (Cont.) System Settings
Option Description
Enable the Display of SubstitutionVariables
Set how substitution variables display in theMember Selection dialog box when usersrespond to runtime prompts in business rules:
• Display All—Display all substitutionvariables
• Display None—Don't display substitutionvariables
• Enable Filtering—Display onlysubstitution variables that are valid for theruntime prompt
Select User Assign ownership of the application to anotheradministrator.
Display Users’ Full Names Yes—Display the user's full name (forexample, Victoria Hennings)
No—Display the user's ID (for example,VHennings)
Allow drill down on shared members in adhoc form
Yes—Enable drilling on shared members in anad hoc grid
No—Disable drilling on shared members in anad hoc grid
Minimize Approval Process Emails Reduces the number of emails a user receiveswhen using Approvals. The default is No.
If Yes is selected, only one email notification(for the approved parent entity) is sent to thenew owner of the planning unit. Separateemail notifications aren’t sent for every childentity in the planning unit hierarchy.
If No is selected, owners that are set at parentnodes will receive emails for the selected nodeas well as an email for each child node.
Suppress Application Management Optionsin Smart View
Controls the display of the applicationmanagement options Update ApplicationandDelete Application in Oracle Smart View forOffice. This setting, and the display of theapplication management options, applies toadministrators only.
Yes—Application options are not displayed inSmart View.
No—Default. Application options are displayedin Smart View.
To specify system settings:
1. From the Home page, click Navigator , and then under Setup, click SystemSettings and Defaults.
2. Click Advanced Settings, and then select System Settings.
3. Set the options you want to be system wide.
4. Click Save.
Chapter 18Administering Application Settings
18-4
Limiting Use of an ApplicationIf you need to limit the use of an application, such as for maintenance, you can limitthe use of the application to administrators in the System Settings. When you selectAdministrators, if any non-administrative users are logged on to the application, theyare forced off the system and will not be able to log on. Use this same procedure torestore users access to an application by selecting All users.
To limit or restore use of an application:
1. From the Home page, click Navigator , and then under Setup, click SystemSettings and Defaults.
2. Click Advanced Settings, and then select System Settings.
3. Select an option for Enable Use of the Application for: All users orAdministrators.
4. Click Save.
You can schedule an Administration Mode job to run later or at intervals. To schedulean Administration Mode job, go to the Jobs page. See Scheduling Jobs.
Specifying Custom ToolsAdministrators can specify custom tools, or links, for users on the Custom Tools tab.
To specify custom tools:
1. On the Home page, click Navigator , and then under Setup, click SystemSettings and Defaults.
2. Click Advanced Settings, and then click Custom Tools.
3. Perform a task:
• To create a URL link, click .
For each link:
– For Name, enter the displayed link name.
– For URL, enter a fully qualified URL, including the http:// prefix
– For User Type, select which users can access the link.
• To delete a URL link, highlight the link, and then click .
4. Click Save.
Administering Data Load SettingsSpecify parameters to enable data to be loaded directly into an application database.Optionally, you can use advanced settings if you want to load details to child membersof parent dimension members based on unique identifiers for the driver dimension.
For example, a company might load the Employee dimension member with accountdata for Start Date, Position, Salary Basis, and Pay Type. Because the human
Chapter 18Administering Data Load Settings
18-5
resource data includes placeholders for new and existing employees, the companycould set up the following advanced settings:
• Data load dimension parents: New Employees, Existing Employees
• New Employees unique identifiers: Start Date, Position
• Existing Employees unique identifiers: Salary Basis, Pay Type
During data load, child members of New Employees and Existing Employees areevaluated for data updates. The unique identifiers Start Date, Position, Salary Basis,and Pay Type determine if existing data load dimension values are updated, or if newvalues are added: If the unique identifier's data values are the same, data is updated.If the data value is different, the next available child member is used.
To specify parameters for loading data:
1. From the Home page, click Navigator , and then under Integration, clickData Load Settings.
2. For Data Load Dimension, select the dimension (such as Employee) for whichdata is loaded for the application.
3. For Driver Dimension, click to select the dimension into which data isloaded.
For example, if you're loading data to Employee, the driver dimension might beAccount.
4. Select the members of the driver dimension.
For example, if the driver dimension is Account, driver dimension members mightinclude Start Date, Grade, Position, Salary Basis, and Pay Type.
5. Optional: To use advanced settings, complete these steps.
a. Add a row by clicking .
b. To the right of the new field, click and select a parent member.
For information about selecting members, see Using the Member Selector.
c. To the right of the parent member, under Driver Dimension UniqueIdentifiers, select members as unique identifiers. (Members selected for thisfield must be included in the list of selected Driver Dimension members at thetop of the page.)
Each parent member must include at least one unique identifier member.These members determine if existing data load dimension values are updated,or if new values are added.
d. If necessary, continue adding rows by repeating the previous steps.
e. To duplicate or delete a row, click within a row, and click or .
Importing Using Data ManagementThe basic process for importing data includes:
1. Exporting data from the source system to a CSV file
Chapter 18Importing Using Data Management
18-6
2. Defining the relationship between the source system data to members using dataload mappings
3. Defining data load rules for the Location; you can create multiple data load rulesfor the application so that you can import data from multiple sources into a targetapplication
4. Importing the data into the application by executing the data load rules
Importing Data Using Data ManagementTo import data using Data Management:
1. From the Home page, click Navigator , and then under Integration, clickData Management.
2. Import data into the application, using the information in the following sections andthe Administering Data Management for Oracle Enterprise PerformanceManagement Cloud.
See these examples:
• Import Scenario Case 1: Importing Data when Member Names Match
• Import Scenario Case 2: Importing Data when Member Names Do Not Match
Import Scenario Case 1: Importing Data when Member Names MatchThis example walks you through the steps to importing data into an application whenthe member names in the source system match the member names in the application.
See Review the Import Format.
Import Scenario Case 2: Importing Data when Member Names Do Not MatchWhen there are differences between the source dimensions and the targetdimensions, use the mapping feature to relate the dimensions. Examples wheresource data and target data are in different formats:
• The source Chart of Account structure consists of Company, Account, SubAccount, Department, and Product whereas the target application uses onlyDepartment, Account, and Product.
• The source Chart of Accounts has multiple levels in a Division, whereas the targetapplication uses only the Division level.
• The source account numbers use eight characters, whereas the target applicationuses only the first six characters of the account.
This section gives an example of how to import data into a target application when themember names in the source system don't match the member names in the target.
Refer to these steps and then perform the following procedure:
• Review the Import Format
• Review the Default Location
Chapter 18Importing Using Data Management
18-7

Note:
The following example assumes the source system has multiple products inthe Electronics product line (for example, Televisions, Smart Phones,Computers), whereas the target application stores data only at theaggregated Electronics level. You want to import data from all Electronicsproducts in the source system, but aggregate them in the target into theElectronics level in the Product dimension.
Table 18-2 Electronics and Appliances Hierarchies
In Source System In Target Application
Electronics 110 - TVs Electronics (includes all TVs, Phones, and Computers)
120 - Phones
130 -Computers
Appliances 210 -Dishwashers
Appliances (includes all Dishwashers and Ovens)
220 - Ovens
To set up the data load mapping for this example:
1. On the Home page, click Navigator , and then under Integration, click DataManagement.
2. Click Workflow, and then click Data Load Mapping.
3. From Dimensions, select Product.
4. Click Like, enter "1*" in the Source Value field to import data for all Electronics(product codes that begin with "1").
5. In the Target Value field, enter "Electronics".
You can create multiple mappings to import and aggregate other product lines. Forexample, you could create another mapping and enter "2*" in the Source Valuefield to import all Appliances (product codes that begin with "2"), and enter"Appliances" in the Target Value field.
6. Click Save.
When the data load rule is executed (see Create and Execute the Data LoadRule), data for all electronic products that begin with the code "1" are imported andaggregated at the Electronics level in the target application.
Review the Import FormatWhen you create an application, a default import format is automatically created withthe name appname_1. You use this import format to map a source data file to theapplication. This import format assumes that the order of dimensions in the CSV fileare: Account, Entity, Amount, and then any custom dimensions in alphabetical order. Ifyou want to use a different file format, adjust the format.
To review the default import format:
Chapter 18Importing Using Data Management
18-8
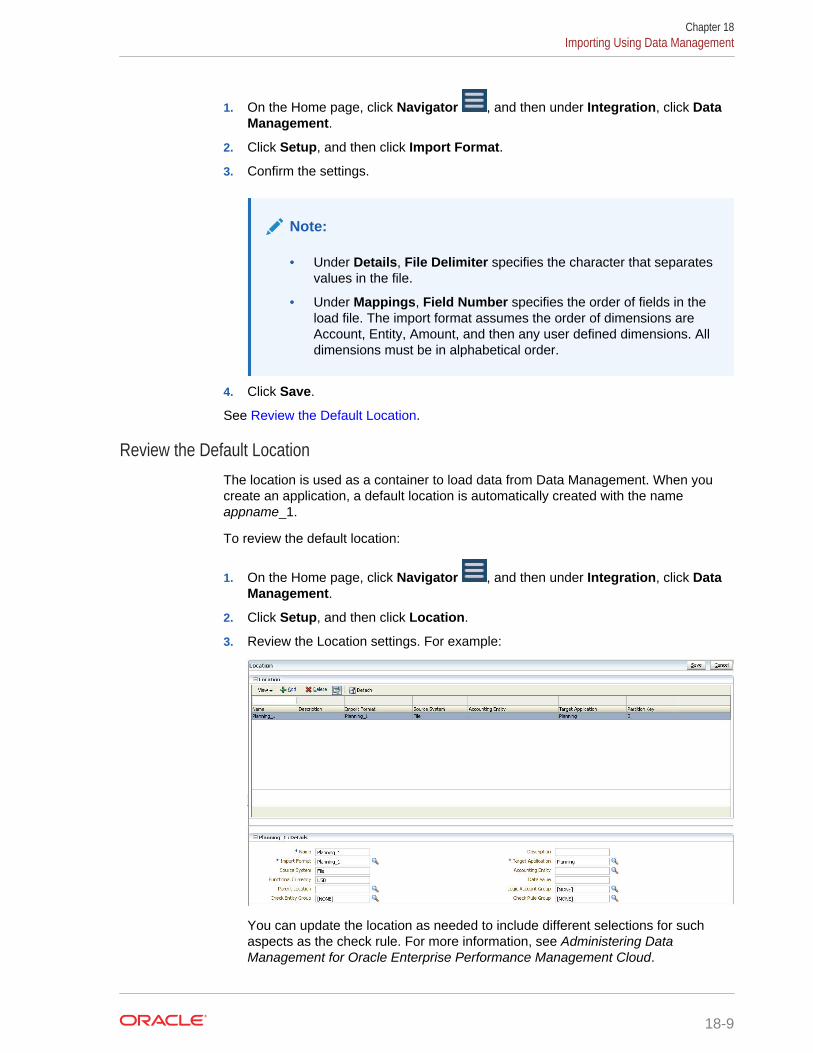
1. On the Home page, click Navigator , and then under Integration, click DataManagement.
2. Click Setup, and then click Import Format.
3. Confirm the settings.
Note:
• Under Details, File Delimiter specifies the character that separatesvalues in the file.
• Under Mappings, Field Number specifies the order of fields in theload file. The import format assumes the order of dimensions areAccount, Entity, Amount, and then any user defined dimensions. Alldimensions must be in alphabetical order.
4. Click Save.
See Review the Default Location.
Review the Default LocationThe location is used as a container to load data from Data Management. When youcreate an application, a default location is automatically created with the nameappname_1.
To review the default location:
1. On the Home page, click Navigator , and then under Integration, click DataManagement.
2. Click Setup, and then click Location.
3. Review the Location settings. For example:
You can update the location as needed to include different selections for suchaspects as the check rule. For more information, see Administering DataManagement for Oracle Enterprise Performance Management Cloud.
Chapter 18Importing Using Data Management
18-9
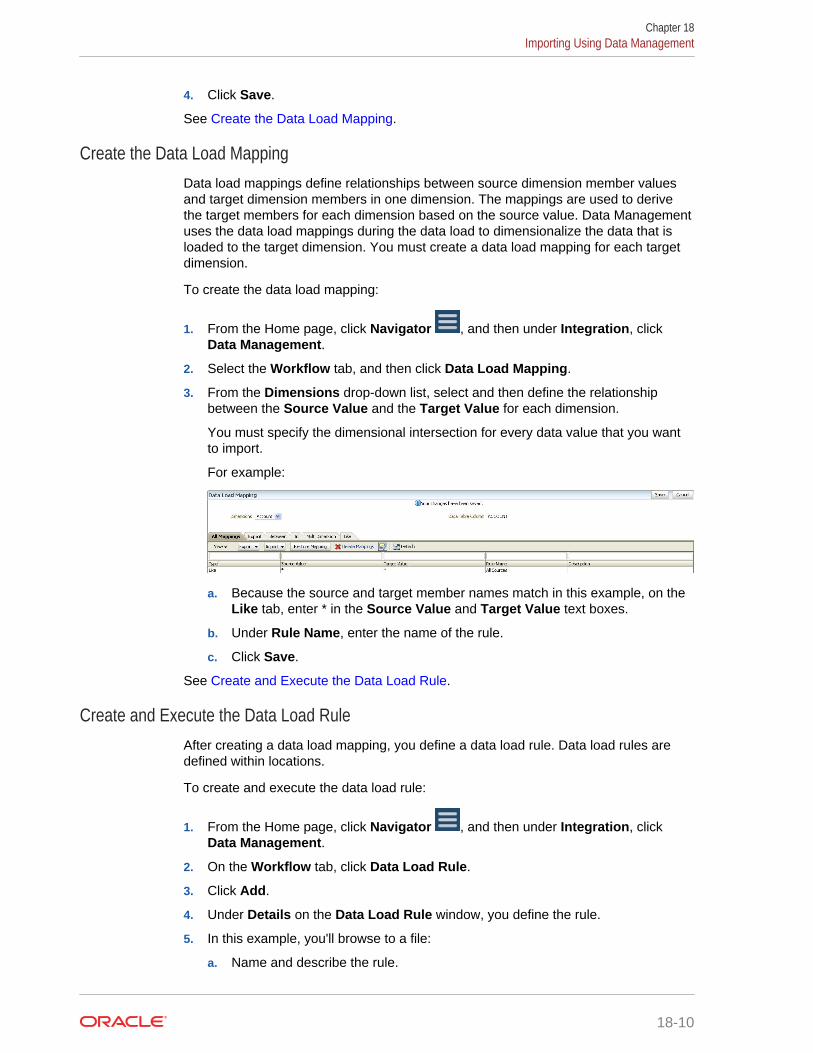
4. Click Save.
See Create the Data Load Mapping.
Create the Data Load MappingData load mappings define relationships between source dimension member valuesand target dimension members in one dimension. The mappings are used to derivethe target members for each dimension based on the source value. Data Managementuses the data load mappings during the data load to dimensionalize the data that isloaded to the target dimension. You must create a data load mapping for each targetdimension.
To create the data load mapping:
1. From the Home page, click Navigator , and then under Integration, clickData Management.
2. Select the Workflow tab, and then click Data Load Mapping.
3. From the Dimensions drop-down list, select and then define the relationshipbetween the Source Value and the Target Value for each dimension.
You must specify the dimensional intersection for every data value that you wantto import.
For example:
a. Because the source and target member names match in this example, on theLike tab, enter * in the Source Value and Target Value text boxes.
b. Under Rule Name, enter the name of the rule.
c. Click Save.
See Create and Execute the Data Load Rule.
Create and Execute the Data Load RuleAfter creating a data load mapping, you define a data load rule. Data load rules aredefined within locations.
To create and execute the data load rule:
1. From the Home page, click Navigator , and then under Integration, clickData Management.
2. On the Workflow tab, click Data Load Rule.
3. Click Add.
4. Under Details on the Data Load Rule window, you define the rule.
5. In this example, you'll browse to a file:
a. Name and describe the rule.
Chapter 18Importing Using Data Management
18-10
b. For Category, select the application scenario.
Note:
When you create an application, a default Category mapping iscreated to map to the Scenario dimension and a default Periodmapping is created based on the Period dimension.
c. Select the Cube for which you want to load data.
d. Click Select to browse to the data load file.
e. Click Save.
6. To run the data load rule, using the mapping that you created, click Execute.
Scheduling Jobs in Data ManagementYou can set execution times for data load rules by scheduling them. For example, youmay want actual revenue data to be imported into the application on Friday of eachweek.
To schedule a job:
1. From the Home page, click Navigator , and then under Integration, clickData Management.
2. Select Workflow and click Data Load Rule.
3. Complete the load rule information.
4. Click Schedule.
5. Specify the type of scheduling and select the associated date and timeparameters.
Table 18-3 Schedule Details and Parameters
Schedule Details Data and Time Parameters
Simple Date
Hours
Minutes
Seconds
Select (AM/PM)
Hourly Minutes
Seconds
Daily Hours
Minutes
Seconds
Select (AM/PM)
Chapter 18Importing Using Data Management
18-11
Table 18-3 (Cont.) Schedule Details and Parameters
Schedule Details Data and Time Parameters
Weekly Monday-Sunday
Hours
Minutes
Seconds
Select (AM/PM)
Monthly (day of month) Monthly Date
Hours
Minutes
Seconds
Select (AM/PM)
Monthly (week day) Day of Month
Day
Hours
Minutes
Seconds
Select (AM/PM)
6. Click OK.
Drilling Through to Source DataYou can drill through on values from the application to the Data Management landingpage. This landing page displays General Ledger accounts and the hyperlinkedbalances that were used to populate the cells in the application. If a URL has beenspecified in the Import Format option for the application, data is displayed in thegranularity with which it was loaded in your browser. Drill through based on a URLrequires that users be connected to the server on which the data resides.
For More InformationFor more information, see the following sections in Administering Data Managementfor Oracle Enterprise Performance Management Cloud.
Defining Category Mappings
When you create the application, a default Category mapping is created to map theScenario dimension to a Data Management category. To update the default mapping,see Administering Data Management for Oracle Enterprise Performance ManagementCloud.
Defining Periods
When you create the application, a default Period mapping is created based on thePeriod for the application. To update the default mapping, see Administering DataManagement for Oracle Enterprise Performance Management Cloud.
Chapter 18Importing Using Data Management
18-12
Creating Data Load Mappings
See Administering Data Management for Oracle Enterprise Performance ManagementCloud for information on the following topics:
• Creating Mappings Using the Explicit Method
• Creating Mappings Using the Between Method
• Using Special Characters in the Source Value Expression for Like Mappings
• Using Special Characters in the Target Value Expression
• Ignoring Member Mappings
• Importing Member Mappings
• Exporting Member Mappings
Defining Data Load Rules
After you define data load mappings, you define data load rules for the application.Data load rules are defined for locations.
See Administering Data Management for Oracle Enterprise Performance ManagementCloud for information on the following topics:
• Creating the Data Load Rule
• Defining the Data Load Rule Details
• Defining Data Load Rule Details for a File-Based Source System
Managing Data Load Rules
After data load rules are created, you can edit, run, or delete them.
See Administering Data Management for Oracle Enterprise Performance ManagementCloud for information on the following topics:
• Editing Data Load Rules
• Running Data Load Rules
• Checking the Data Load Rules
• Deleting Data Load Rules
Using the Data Load Workbench
Data Load Workbench enables you to perform the data load processes interactivelyfrom sources in Data Management. In addition, users can view and review the dataimported from the source system.
Key features include:
• Interactive Load Process with options for import and export (a 4-step wizard thatperforms import, validate, export, and check)
• Provision to view Source (All)/Source (Mapped)/Target/Source and Target values
• PTD YTD Value display for ready reference
• Display options for Valid, Invalid, Ignored, and All Data
Chapter 18Importing Using Data Management
18-13
• Online and Offline Load process
• Export to Excel
• Drill through to source from the Data Load Workbench
For more information, see Administering Data Management for Oracle EnterprisePerformance Management Cloud.
Integrating Oracle Financials Cloud Data in Planning
Data Management facilitates data loading and write-back between a Oracle FinancialsCloud application and a Planning application. Oracle Financials Cloud users whospecialize in general ledger and commitment control operations can use Planning as afinancial planning application. Users can generate a trial balance in the Oracle GeneralLedger application, and then pick that file up and load it to Planning using a few simpleconstructs in Data Management. In addition, data from Planning can be written back tothe Oracle Financials Cloud. Both processes are supported using the WebCenterContent Management for the Cloud service with data provided by both Oracle GeneralLedger and Planning.
For more information, see Administering Data Management for Oracle EnterprisePerformance Management Cloud.
Process Description
At a high level, the steps for integrating data in Planning:
1. Create an application that includes the dimensions to which to map GeneralLedger balances. See Creating an Application.
2. Extract the General Ledger file from Oracle Financials Cloud and move it to theapplication. See "Extracting the General Ledger File" in Administering DataManagement for Oracle Enterprise Performance Management Cloud.
3. Register and configure a source connection for the General Ledger file. See"Configuring a Source Connection in Data Management" in Administering DataManagement for Oracle Enterprise Performance Management Cloud.
4. Load data from the General Ledger file to the application. Then after mapping datato the application dimensions, write back the data to Oracle Financials Cloud. See"Writing Back to the General Ledger" in Administering Data Management forOracle Enterprise Performance Management Cloud.
5. Optionally, you can extract the data from the integrated application to create acustom target application. See "Extracting the Integrated EPM Cloud and OracleGeneral Ledger Data to a Flat File" in Administering Data Management for OracleEnterprise Performance Management Cloud.
Administering Action MenusRelated Topics
• Creating and Updating Action Menus
• Working with Action Menu Items
• Defining Action Menu Items
Chapter 18Administering Action Menus
18-14
Creating and Updating Action MenusAdministrators can create right-click (or action) menus and associate them with forms,enabling users to click rows or columns in forms and select menu items to:
• Launch another application, URL, or business rule, with or without runtimeprompts
• Move to another form
• Move to Manage Approvals with a predefined scenario and version
• Open Job or Copy Version
The context of the right-click is relayed to the next action: the POV and the Page, themember the user clicked on, the members to the left (for rows), or above (forcolumns).
When designing forms, use Other Options to select menus available for Form menuitem types. As you update an application, update the appropriate menus. For example,if you delete a business rule referenced by a menu, remove it from the menu.
To create, edit, or delete action menus:
1. From the Home page, click Navigator , and then under Create and Manage,click Action Menus.
2. Perform an action:
• To create an action menu, click , enter the menu's name, and then click OK.
• To edit details of an action menu, select it, and then click . See Workingwith Action Menu Items.
• To delete action menus, select them, click , and then click OK.
Working with Action Menu ItemsThe Edit Menu page displays menu items on the current action menu, includingnames, labels, required dimensions, icon, and type, such as URL, Form, BusinessRule, Manage Approvals, Menu Header, Form, Job , and Copy Version.
To work with action menu items:
1. From the Home page, click Navigator , and then under Create and Manage,click Action Menus.
2. Select a menu, and then click .
3. First time only: To add the first item to the menu, click Add Child and Save.
4. Select a menu item and:
• To add menu items below the selected item, click Add Child (available forMenu Header menu types).
• To add menu items at the same level as the selected item, click Add Sibling.
Chapter 18Administering Action Menus
18-15
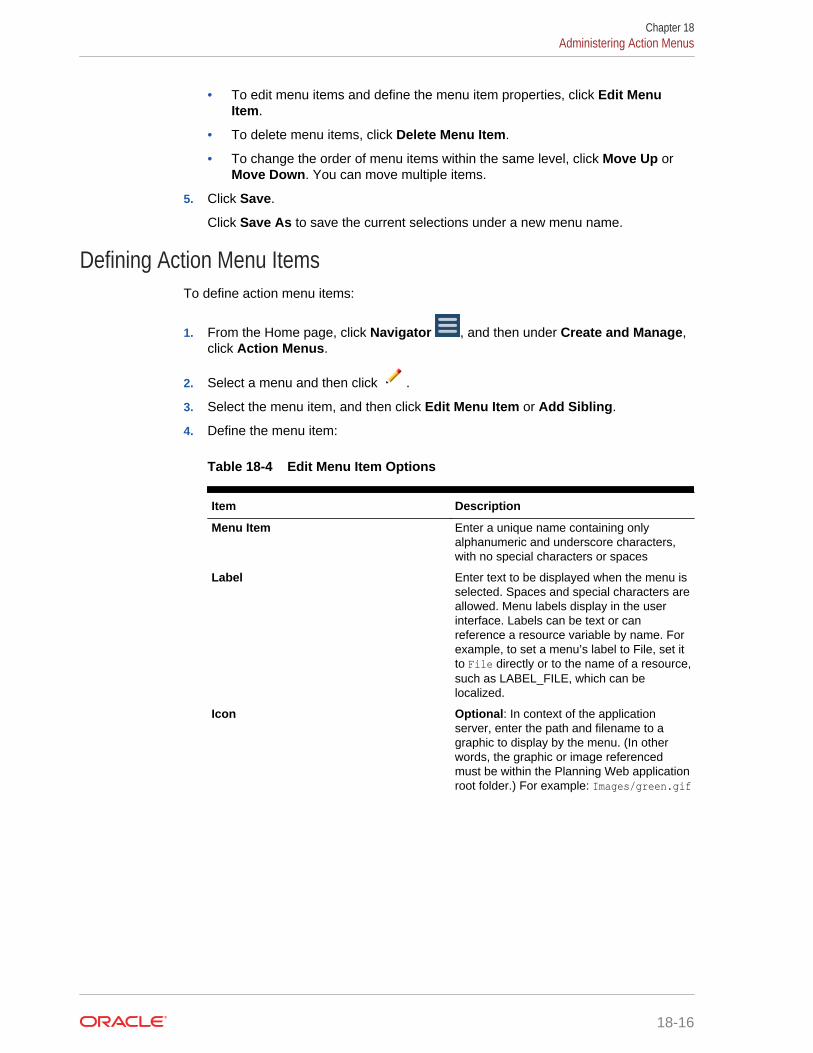
• To edit menu items and define the menu item properties, click Edit MenuItem.
• To delete menu items, click Delete Menu Item.
• To change the order of menu items within the same level, click Move Up orMove Down. You can move multiple items.
5. Click Save.
Click Save As to save the current selections under a new menu name.
Defining Action Menu ItemsTo define action menu items:
1. From the Home page, click Navigator , and then under Create and Manage,click Action Menus.
2. Select a menu and then click .
3. Select the menu item, and then click Edit Menu Item or Add Sibling.
4. Define the menu item:
Table 18-4 Edit Menu Item Options
Item Description
Menu Item Enter a unique name containing onlyalphanumeric and underscore characters,with no special characters or spaces
Label Enter text to be displayed when the menu isselected. Spaces and special characters areallowed. Menu labels display in the userinterface. Labels can be text or canreference a resource variable by name. Forexample, to set a menu’s label to File, set itto File directly or to the name of a resource,such as LABEL_FILE, which can belocalized.
Icon Optional: In context of the applicationserver, enter the path and filename to agraphic to display by the menu. (In otherwords, the graphic or image referencedmust be within the Planning Web applicationroot folder.) For example: Images/green.gif
Chapter 18Administering Action Menus
18-16
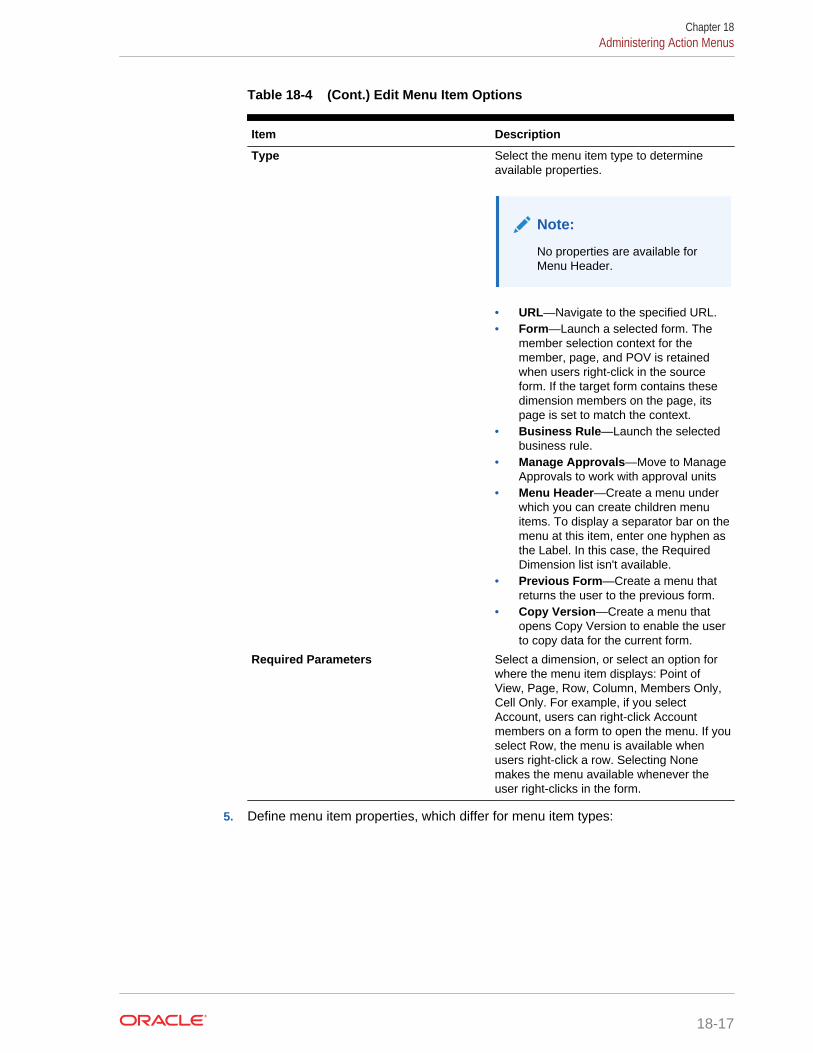
Table 18-4 (Cont.) Edit Menu Item Options
Item Description
Type Select the menu item type to determineavailable properties.
Note:
No properties are available forMenu Header.
• URL—Navigate to the specified URL.• Form—Launch a selected form. The
member selection context for themember, page, and POV is retainedwhen users right-click in the sourceform. If the target form contains thesedimension members on the page, itspage is set to match the context.
• Business Rule—Launch the selectedbusiness rule.
• Manage Approvals—Move to ManageApprovals to work with approval units
• Menu Header—Create a menu underwhich you can create children menuitems. To display a separator bar on themenu at this item, enter one hyphen asthe Label. In this case, the RequiredDimension list isn't available.
• Previous Form—Create a menu thatreturns the user to the previous form.
• Copy Version—Create a menu thatopens Copy Version to enable the userto copy data for the current form.
Required Parameters Select a dimension, or select an option forwhere the menu item displays: Point ofView, Page, Row, Column, Members Only,Cell Only. For example, if you selectAccount, users can right-click Accountmembers on a form to open the menu. If youselect Row, the menu is available whenusers right-click a row. Selecting Nonemakes the menu available whenever theuser right-clicks in the form.
5. Define menu item properties, which differ for menu item types:
Chapter 18Administering Action Menus
18-17
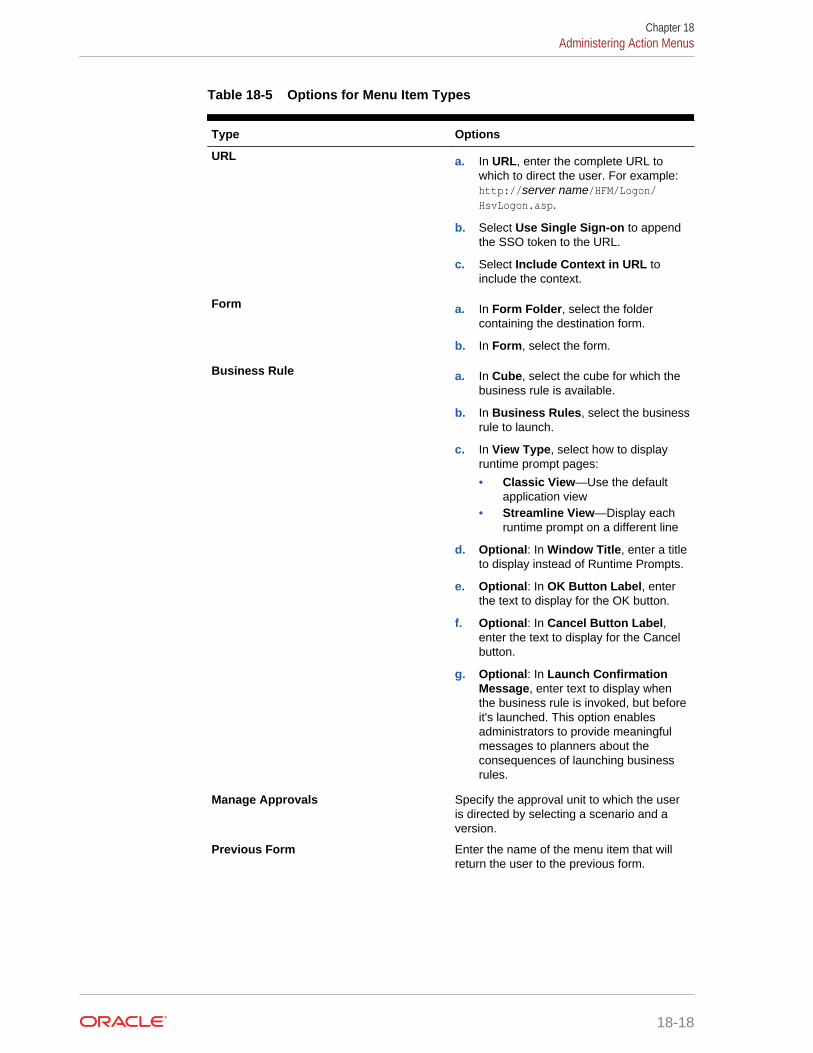
Table 18-5 Options for Menu Item Types
Type Options
URL a. In URL, enter the complete URL towhich to direct the user. For example:http://server name/HFM/Logon/HsvLogon.asp.
b. Select Use Single Sign-on to appendthe SSO token to the URL.
c. Select Include Context in URL toinclude the context.
Form a. In Form Folder, select the foldercontaining the destination form.
b. In Form, select the form.
Business Rule a. In Cube, select the cube for which thebusiness rule is available.
b. In Business Rules, select the businessrule to launch.
c. In View Type, select how to displayruntime prompt pages:
• Classic View—Use the defaultapplication view
• Streamline View—Display eachruntime prompt on a different line
d. Optional: In Window Title, enter a titleto display instead of Runtime Prompts.
e. Optional: In OK Button Label, enterthe text to display for the OK button.
f. Optional: In Cancel Button Label,enter the text to display for the Cancelbutton.
g. Optional: In Launch ConfirmationMessage, enter text to display whenthe business rule is invoked, but beforeit's launched. This option enablesadministrators to provide meaningfulmessages to planners about theconsequences of launching businessrules.
Manage Approvals Specify the approval unit to which the useris directed by selecting a scenario and aversion.
Previous Form Enter the name of the menu item that willreturn the user to the previous form.
Chapter 18Administering Action Menus
18-18
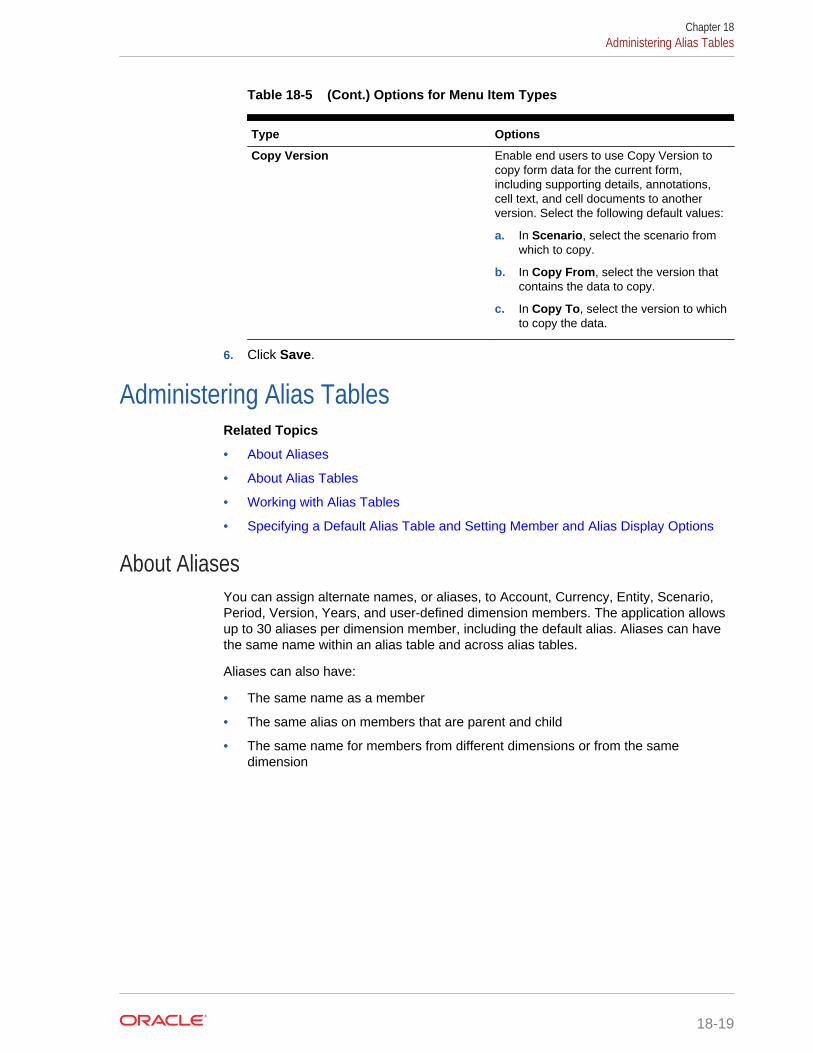
Table 18-5 (Cont.) Options for Menu Item Types
Type Options
Copy Version Enable end users to use Copy Version tocopy form data for the current form,including supporting details, annotations,cell text, and cell documents to anotherversion. Select the following default values:
a. In Scenario, select the scenario fromwhich to copy.
b. In Copy From, select the version thatcontains the data to copy.
c. In Copy To, select the version to whichto copy the data.
6. Click Save.
Administering Alias TablesRelated Topics
• About Aliases
• About Alias Tables
• Working with Alias Tables
• Specifying a Default Alias Table and Setting Member and Alias Display Options
About AliasesYou can assign alternate names, or aliases, to Account, Currency, Entity, Scenario,Period, Version, Years, and user-defined dimension members. The application allowsup to 30 aliases per dimension member, including the default alias. Aliases can havethe same name within an alias table and across alias tables.
Aliases can also have:
• The same name as a member
• The same alias on members that are parent and child
• The same name for members from different dimensions or from the samedimension
Chapter 18Administering Alias Tables
18-19
Note:
• You can't have the same alias for two members that are siblingsbecause there would be no way to uniquely identify the member. Thisrule is enforced by the application for base members, but not for sharedmembers.
This rule isn't enforced for shared members because you can't directlyset aliases for shared members; shared member aliases are inheritedfrom the alias of their base member. It's possible to create an alternativehierarchy where you can have two shared members that have the samealias and are siblings. However, this situation is discouraged if you wantto reference these members by their aliases from an adhoc gridbecause, when you type the alias into the grid and submit it to theapplication, the application can't uniquely resolve this member and it willreturn an error. If you're using the alias for display purposes only thenthere will be no issue, but this design is discouraged because, visually,there is no way to differentiate between these two members.
• Although aliases can have the same name as a member, be careful notto set the alias of member1 to be the same name as member2. This canlead to unintended results and will cause confusion on the form grids.
• Member names must be unique so that they can be used in rules andform designs.
About Alias TablesYou can create and update alias tables, and set a default alias table for theapplication. Follow naming conventions in Naming Restrictions.
Multiple alias tables support, for example, these language combinations:
• English, French, German, Spanish, and Italian
• Japanese and English
• Korean and English
• Turkish and English
Note:
Alias table support isn't restricted to these language combinations.
You can set alias tables to display members in an application. Planners can set aliastables in preferences.
Working with Alias TablesYou can add, edit, rename, and delete alias tables or clear alias table values. You canalso copy alias table content from one table to another.
Chapter 18Administering Alias Tables
18-20
To work with alias tables:
1. From the Home page, click Navigator , and then under Create and Manage,click Alias Tables.
2. Choose a task:
• If adding an alias table, click , and then in Add - Alias Table, enter a name.
• If editing or renaming alias tables, select the alias table, then click , andthen for Edit - Alias Table, enter a name.
• If deleting alias tables, select the alias table, and then click Delete.
Note:
You can't delete the Default alias table.
• If clearing the values in an alias table, select the alias table to clear, then clickClear Values.
Note:
Clearing the alias table removes the content of the table, but doesn'tremove the table.
• If copying alias table content, select the alias table, click Copy, then select thedestination alias table, and then click Copy.
Note:
The destination alias table must exist. Copying doesn't create tables.
3. Click OK.
Specifying a Default Alias Table and Setting Member and AliasDisplay Options
If you create alias tables with aliases for Account, Currency, Entity, Scenario, Period,Version, Years, and user-defined dimensions and members, you can select a Defaultalias table for the application. Users can set preferences for which set of aliases(stored in an alias table) to use for displaying member and dimension names.
To select the application’s Default alias table:
1. From the Home page, click Navigator , and then under Setup, click SystemSettings and Defaults.
2. Select Current Application Defaults, and then select Application Settings.
Chapter 18Administering Alias Tables
18-21
3. For Alias Table, select a Default alias table.
4. For Member Name\Alias Display, select the option that enables the kind ofmember data to be displayed on the Member Selector throughout your application:
• Default—The data determined by the form, grid, or dimension settings
• Member name —Just member names
• Alias—Just member aliases, if defined
• Member name:Alias—Names followed by aliases, if defined
• Alias:Member name—Alias, if defined, followed by the names
5. Click Save or Reset.
Administering DimensionsThis section documents how to edit dimensions using the Classic Dimension Editorwhich is accessed by using the Dimensions link in the Navigator menu. In the 17.05(May 2017) update, we released the Simplified Dimension Editor.
For detailed information about using the Simplified Dimension Editor, see EditingDimensions in the Simplified Dimension Editor.
Related Links
About Dimensions
Working with Dimension Hierarchies
About Custom Dimensions, Entities, Accounts, Periods, and Cubes
Adding or Editing User-Defined Custom Dimensions
Working with Members
Working with Attributes
Working with Attribute Values
Customizing Calendars
Setting Up Currencies
Setting up Dynamic Time Series Members
Working with UDAs
Working with Member Formulas
About DimensionsDimensions categorize data values. Seven dimensions are included with theapplication: Account, Entity, Scenario, Version, Period, Years, and Currency. You cancreate up to 13 user-defined custom dimensions.
Members are components of dimensions.
For complete information about dimensions, see Dimension Overview.
Chapter 18Administering Dimensions
18-22
Working with Dimension HierarchiesRelated Topics
• Filtering the Dimension View by Cube
• Finding Dimensions or Members
• Sorting Members
• About Assigning Access to Members
• Viewing a Member’s Ancestors
• Determining Where Members Are Used in an Application
Filtering the Dimension View by CubeYou can filter the dimension view by cube. When you select a cube, only dimensionsused in that cube are displayed on the Dimensions page.
To filter the dimension view by cube:
1. From the Home page, click Navigator , and then under Create and Manage,click Dimensions.
2. For Cube, select the cube.
The application displays only the dimensions used in the selected cube.
Finding Dimensions or MembersTo find dimension members in dimension hierarchies:
1. From the Home page, click Navigator , and then under Create and Manage,click Dimensions.
2. For Dimension, select the dimension for the member.
3. For Search, select Name, Alias, or Both.
4. Enter the search text (member name, alias, or partial string) for which to search.
5. Click or .
Sorting MembersYou can sort members in ascending or descending order, by children or descendants.Sorting members affects the outline.
To sort members:
1. From the Home page, click Navigator , and then under Create and Manage,click Dimensions.
2. For Dimension, select the dimension for the members.
3. On Dimensions, select the members whose children or descendants you want tosort.
Chapter 18Administering Dimensions
18-23
4. For Sort, select children or descendants.
Sorting by children affects only members in the level immediately below theselected member. Sorting by descendants affects all descendants of the selectedmember.
5. Click to sort by ascending order or to sort by descending order.
6. Click OK.
The next time you create or refresh the database, the outline is generated withmembers in the order that is displayed.
About Assigning Access to MembersAdministrators can assign permissions to members.
You can assign permissions to members by selecting the dimension property ApplySecurity. If you omit or clear the Apply Security setting, all users can access thedimension's members. By default, the Account, Entity, Scenario, and Versiondimensions are enabled for access permissions. Optionally, you can enable this optionfor Period, Years, and Custom dimensions.
For complete information, see Assigning Access to Members. To enable access tomembers, see Editing Dimension Properties in the Simplified Dimension Editor.
Viewing a Member’s AncestorsTo view a member’s ancestors:
1. From the Home page, click Navigator , and then under Create and Manage,click Dimensions.
2. For Dimension, select a dimension.
3. Select the member in the dimension hierarchy.
4. Click .
5. Click OK.
Determining Where Members Are Used in an ApplicationTo view where members are used in an application:
1. From the Home page, click Navigator , and then under Create and Manage,click Dimensions.
2. Select the dimension whose member’s usage you want to view.
3. Click .
About Custom Dimensions, Entities, Accounts, Periods, and CubesSee the following topics for more information:
• About Custom Dimensions
Chapter 18Administering Dimensions
18-24
• About Entities
• About Accounts
• Accounts, Entities, Periods, and Cubes
Adding or Editing User-Defined Custom DimensionsUser-defined custom dimensions must conform to guidelines listed in NamingRestrictions.
Table 18-6 Properties for User-Defined Custom Dimensions
Property Value
Dimension Enter a name that is unique across alldimensions.
Alias Optional: Select an alias table. Enter analternate name for the dimension. See AboutAliases.
Description Optional: Enter a description.
Valid for Cubes Select cubes for which the dimension is valid.Clearing this option makes all members of thedimension invalid for the deselected cube.
Apply Security Allow security to be set on the dimensionmembers; must be selected before assigningaccess rights to dimension members.Otherwise, dimensions have no security andusers can access members without restriction.
Data Storage Select a data storage option. The default isNever Share.
To add or change user-defined dimensions:
1. From the Home page, click Navigator , and then under Create and Manage,click Dimensions.
2. Click or select an existing dimension and click .
3. Specify any of the properties listed above.
4. Click Save.
5. Click OK.
Click Refresh to revert to the previous values and keep the page open.
• Setting Dimension Properties
• Setting Dimension Density and Order
• Setting the Evaluation Order
Setting Dimension PropertiesDimension properties must conform to guidelines listed in Naming Restrictions.
Chapter 18Administering Dimensions
18-25
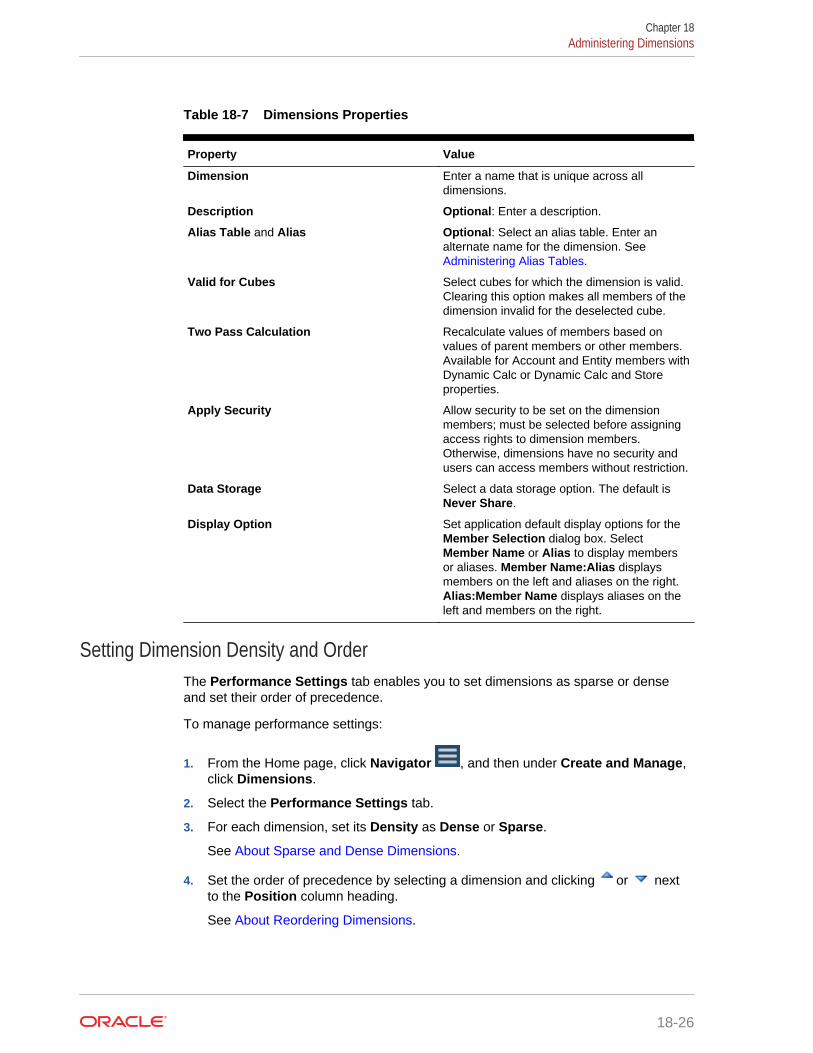
Table 18-7 Dimensions Properties
Property Value
Dimension Enter a name that is unique across alldimensions.
Description Optional: Enter a description.
Alias Table and Alias Optional: Select an alias table. Enter analternate name for the dimension. See Administering Alias Tables.
Valid for Cubes Select cubes for which the dimension is valid.Clearing this option makes all members of thedimension invalid for the deselected cube.
Two Pass Calculation Recalculate values of members based onvalues of parent members or other members.Available for Account and Entity members withDynamic Calc or Dynamic Calc and Storeproperties.
Apply Security Allow security to be set on the dimensionmembers; must be selected before assigningaccess rights to dimension members.Otherwise, dimensions have no security andusers can access members without restriction.
Data Storage Select a data storage option. The default isNever Share.
Display Option Set application default display options for theMember Selection dialog box. SelectMember Name or Alias to display membersor aliases. Member Name:Alias displaysmembers on the left and aliases on the right.Alias:Member Name displays aliases on theleft and members on the right.
Setting Dimension Density and OrderThe Performance Settings tab enables you to set dimensions as sparse or denseand set their order of precedence.
To manage performance settings:
1. From the Home page, click Navigator , and then under Create and Manage,click Dimensions.
2. Select the Performance Settings tab.
3. For each dimension, set its Density as Dense or Sparse.
See About Sparse and Dense Dimensions.
4. Set the order of precedence by selecting a dimension and clicking or nextto the Position column heading.
See About Reordering Dimensions.
Chapter 18Administering Dimensions
18-26
Setting the Evaluation OrderThe Evaluation Order tab enables you to specify which data type prevails when adata intersection has conflicting data types. For example, if Account members are setto the Currency data type, and Product members are set to the Smart List data type,you can set whether the Currency or Smart List data type prevails at an intersection.
To set evaluation order:
1. From the Home page, click Navigator , and then under Create and Manage,click Dimensions.
2. Select Evaluation Order, and then select the cube.
3. From Available Dimensions, select dimensions and move them to SelectedDimensions:
• moves selected dimensions
• moves all dimensions
• removes selected dimensions
• removes all dimensions
You need select only dimensions whose members have specific data types (thatis, their data type isn't "Unspecified"). The data type "Unspecified" doesn't conflictwith another data type.
4. If you select multiple dimensions, set the order of precedence by clicking or .
5. Click Save.
Working with MembersYou can assign access rights to members, rearrange the dimension memberhierarchy, and share members of the Entity, Account, and user-defined customdimensions.
• About Dynamic Members
• Adding or Editing Members
• Deleting Members
• Deleting Parent Members
• Viewing Member Properties from Forms
• Working with Shared Members
• Creating Shared Members
About Dynamic MembersDynamic members are members that users can create when working with businessrules. They're sometimes referred to as "on the fly members". An administratorenables end users to create dynamic members under a parent member and mustrefresh the database to create the required placeholders in Essbase. In business rules
Chapter 18Administering Dimensions
18-27
with runtime prompts, users can then create members by entering desired membernames in the runtime prompts. Subsequent database refreshes will rename useddynamic children to the names specified by the end users and recreate the requiredplaceholders in Essbase. For information about working with business rules anddynamic members, see Designing with Calculation Manager for Oracle EnterprisePerformance Management Cloud.
If a parent member is enabled for adding dynamic children (as described in thissection), users can create new members by entering their name in the runtime prompt.
To enable a parent member for adding dynamic children:
1. From the Home page, click Navigator , and then under Create and Manage,click Dimensions.
2. Edit the parent member and select the option Enable for Dynamic Children (see Adding or Editing Members).
• Optional: Set the member property Number of Possible Dynamic Children(the default is 10). This setting determines the number of placeholders that arecreated for dynamically adding or loading members under the parent. If allplaceholders are used, subsequently added children are added as normalmembers and can't be used until the database is refreshed.
• Optional: Set the member property Access Granted to Member Creator (thedefault is Inherit).
3. Refresh the database to create the placeholders for dynamic members in thedatabases for the cubes in which the members are used.
4. In Calculation Manager:
a. Create a business rule with a runtime prompt (of the Variable type Member).Under the Dynamic Member Parent column, use the Member Selector toselect the parent member that you enabled for dynamic children in theapplication.
b. Select the option Create dynamic members.
c. Deploy the business rule.
For information about working with business rules, see the Designing withCalculation Manager for Oracle Enterprise Performance Management Cloud.
Chapter 18Administering Dimensions
18-28
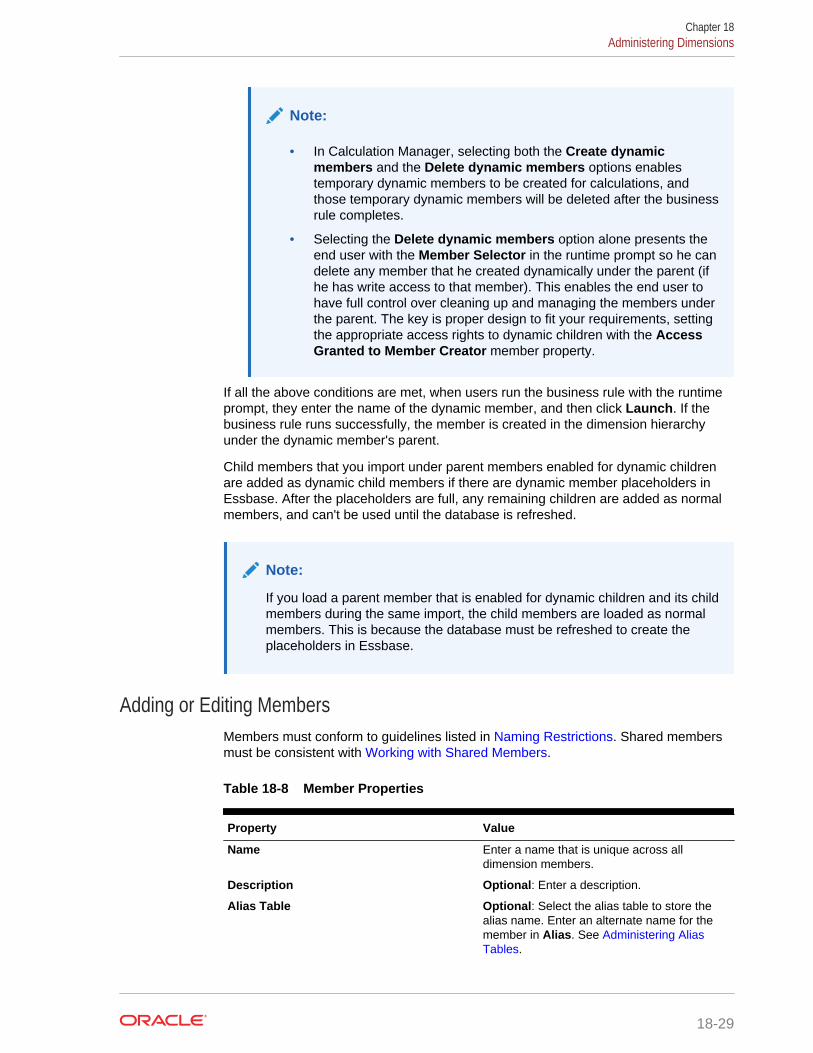
Note:
• In Calculation Manager, selecting both the Create dynamicmembers and the Delete dynamic members options enablestemporary dynamic members to be created for calculations, andthose temporary dynamic members will be deleted after the businessrule completes.
• Selecting the Delete dynamic members option alone presents theend user with the Member Selector in the runtime prompt so he candelete any member that he created dynamically under the parent (ifhe has write access to that member). This enables the end user tohave full control over cleaning up and managing the members underthe parent. The key is proper design to fit your requirements, settingthe appropriate access rights to dynamic children with the AccessGranted to Member Creator member property.
If all the above conditions are met, when users run the business rule with the runtimeprompt, they enter the name of the dynamic member, and then click Launch. If thebusiness rule runs successfully, the member is created in the dimension hierarchyunder the dynamic member's parent.
Child members that you import under parent members enabled for dynamic childrenare added as dynamic child members if there are dynamic member placeholders inEssbase. After the placeholders are full, any remaining children are added as normalmembers, and can't be used until the database is refreshed.
Note:
If you load a parent member that is enabled for dynamic children and its childmembers during the same import, the child members are loaded as normalmembers. This is because the database must be refreshed to create theplaceholders in Essbase.
Adding or Editing MembersMembers must conform to guidelines listed in Naming Restrictions. Shared membersmust be consistent with Working with Shared Members.
Table 18-8 Member Properties
Property Value
Name Enter a name that is unique across alldimension members.
Description Optional: Enter a description.
Alias Table Optional: Select the alias table to store thealias name. Enter an alternate name for themember in Alias. See Administering AliasTables.
Chapter 18Administering Dimensions
18-29
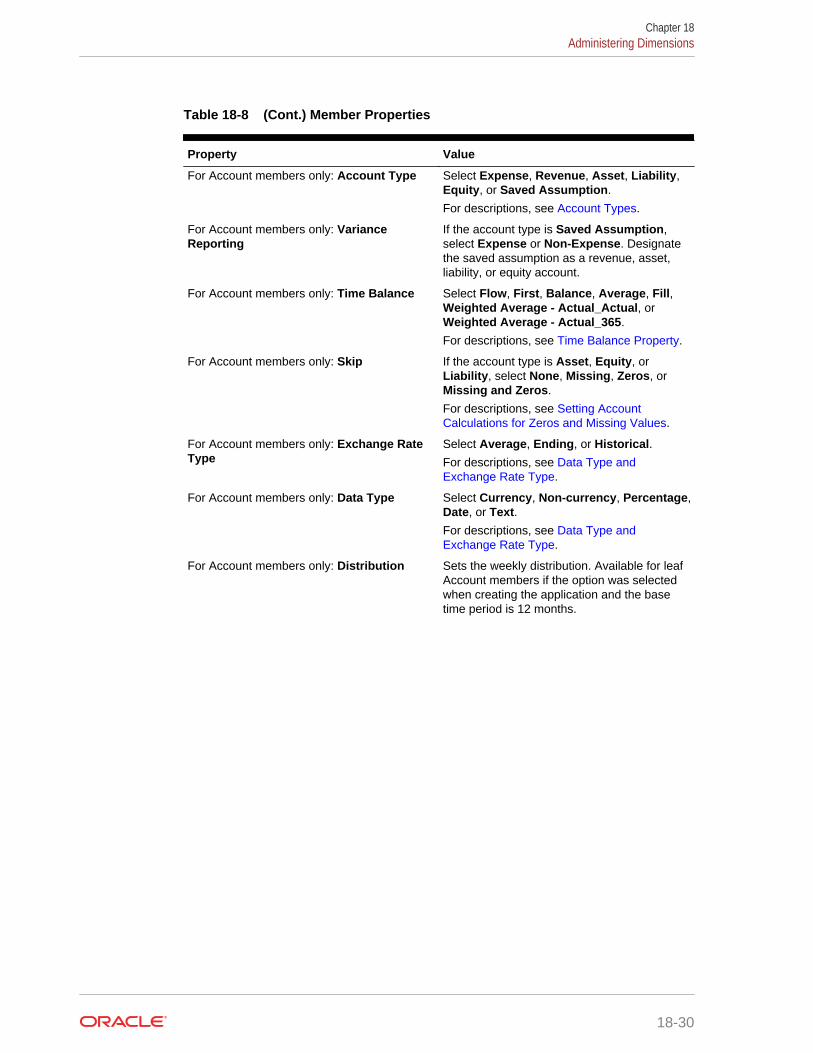
Table 18-8 (Cont.) Member Properties
Property Value
For Account members only: Account Type Select Expense, Revenue, Asset, Liability,Equity, or Saved Assumption.
For descriptions, see Account Types.
For Account members only: VarianceReporting
If the account type is Saved Assumption,select Expense or Non-Expense. Designatethe saved assumption as a revenue, asset,liability, or equity account.
For Account members only: Time Balance Select Flow, First, Balance, Average, Fill,Weighted Average - Actual_Actual, orWeighted Average - Actual_365.
For descriptions, see Time Balance Property.
For Account members only: Skip If the account type is Asset, Equity, orLiability, select None, Missing, Zeros, orMissing and Zeros.
For descriptions, see Setting AccountCalculations for Zeros and Missing Values.
For Account members only: Exchange RateType
Select Average, Ending, or Historical.For descriptions, see Data Type andExchange Rate Type.
For Account members only: Data Type Select Currency, Non-currency, Percentage,Date, or Text.For descriptions, see Data Type andExchange Rate Type.
For Account members only: Distribution Sets the weekly distribution. Available for leafAccount members if the option was selectedwhen creating the application and the basetime period is 12 months.
Chapter 18Administering Dimensions
18-30
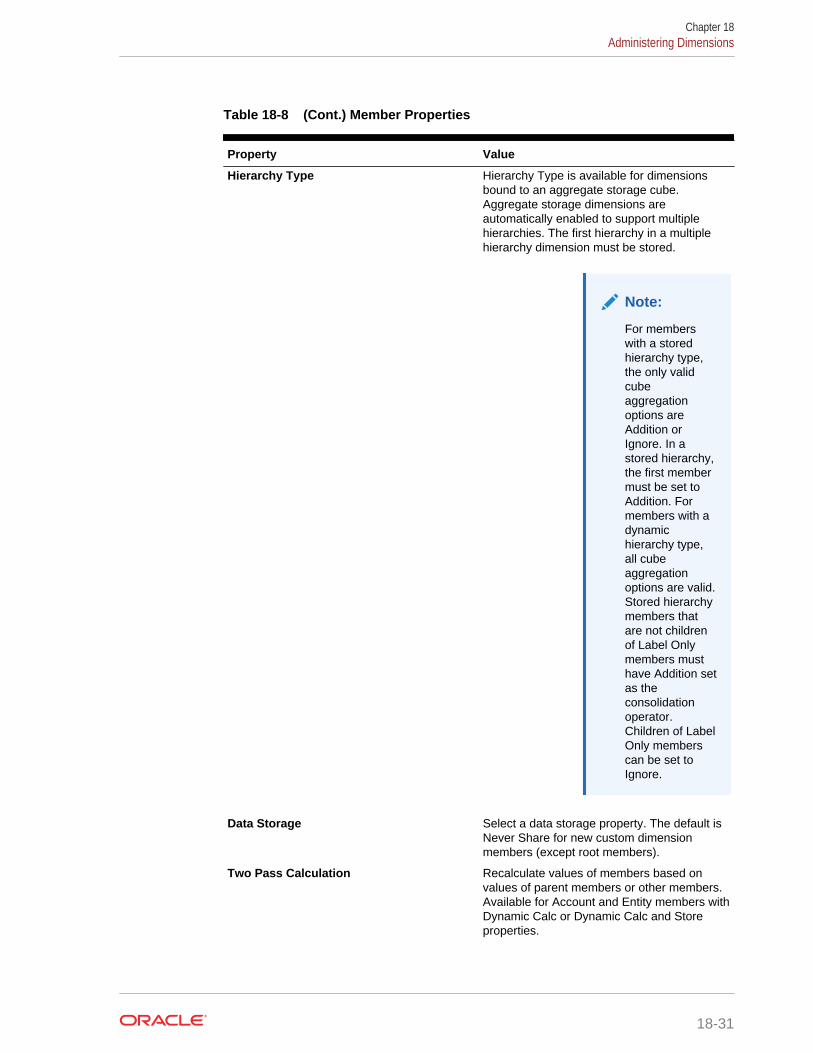
Table 18-8 (Cont.) Member Properties
Property Value
Hierarchy Type Hierarchy Type is available for dimensionsbound to an aggregate storage cube.Aggregate storage dimensions areautomatically enabled to support multiplehierarchies. The first hierarchy in a multiplehierarchy dimension must be stored.
Note:
For memberswith a storedhierarchy type,the only validcubeaggregationoptions areAddition orIgnore. In astored hierarchy,the first membermust be set toAddition. Formembers with adynamichierarchy type,all cubeaggregationoptions are valid.Stored hierarchymembers thatare not childrenof Label Onlymembers musthave Addition setas theconsolidationoperator.Children of LabelOnly memberscan be set toIgnore.
Data Storage Select a data storage property. The default isNever Share for new custom dimensionmembers (except root members).
Two Pass Calculation Recalculate values of members based onvalues of parent members or other members.Available for Account and Entity members withDynamic Calc or Dynamic Calc and Storeproperties.
Chapter 18Administering Dimensions
18-31
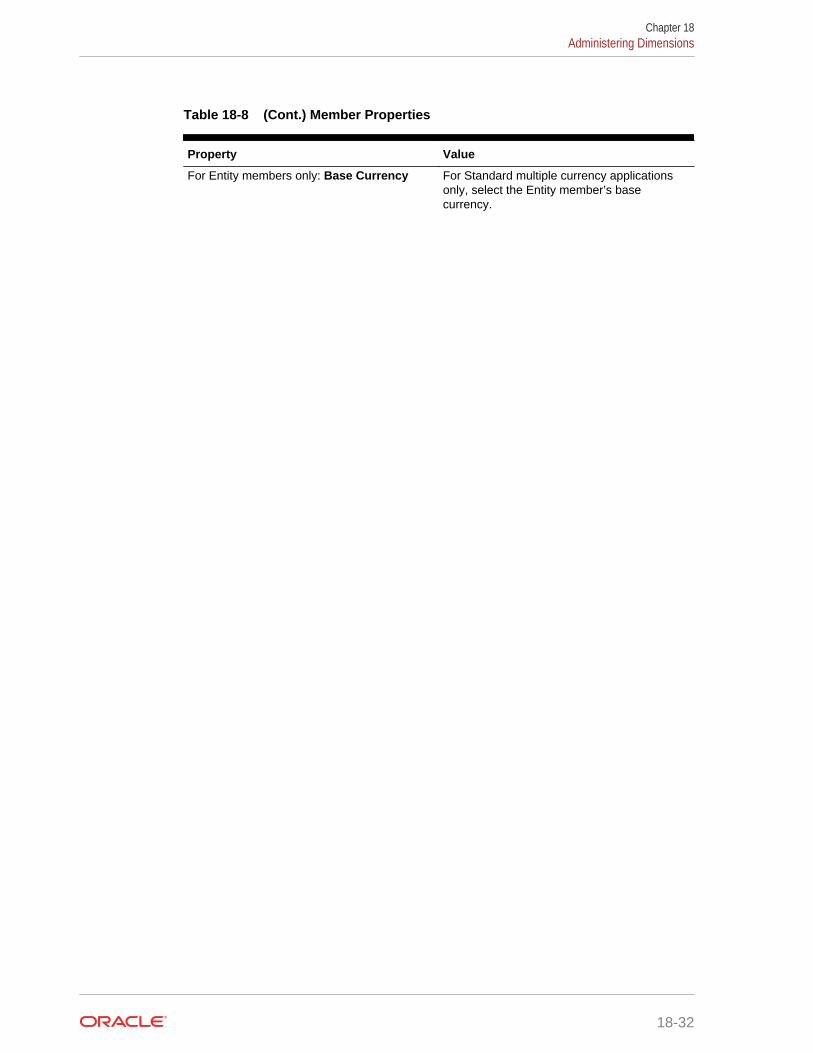
Table 18-8 (Cont.) Member Properties
Property Value
For Entity members only: Base Currency For Standard multiple currency applicationsonly, select the Entity member’s basecurrency.
Chapter 18Administering Dimensions
18-32
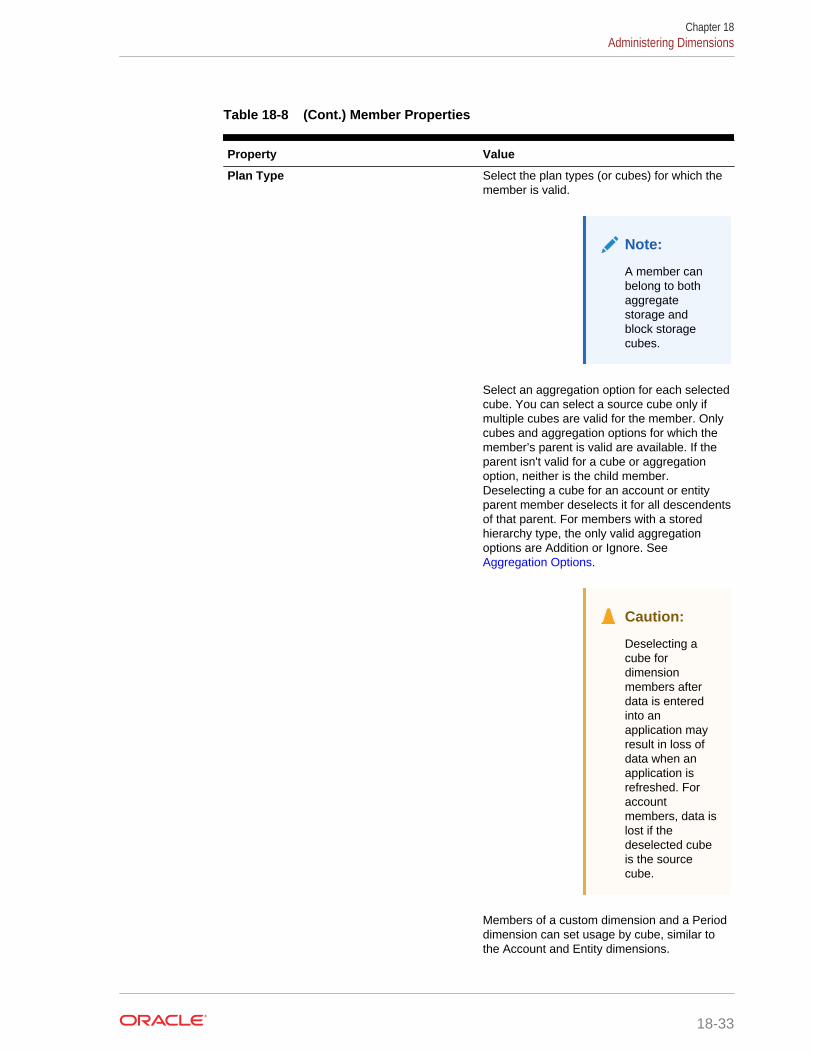
Table 18-8 (Cont.) Member Properties
Property Value
Plan Type Select the plan types (or cubes) for which themember is valid.
Note:
A member canbelong to bothaggregatestorage andblock storagecubes.
Select an aggregation option for each selectedcube. You can select a source cube only ifmultiple cubes are valid for the member. Onlycubes and aggregation options for which themember’s parent is valid are available. If theparent isn't valid for a cube or aggregationoption, neither is the child member.Deselecting a cube for an account or entityparent member deselects it for all descendentsof that parent. For members with a storedhierarchy type, the only valid aggregationoptions are Addition or Ignore. See Aggregation Options.
Caution:
Deselecting acube fordimensionmembers afterdata is enteredinto anapplication mayresult in loss ofdata when anapplication isrefreshed. Foraccountmembers, data islost if thedeselected cubeis the sourcecube.
Members of a custom dimension and a Perioddimension can set usage by cube, similar tothe Account and Entity dimensions.
Chapter 18Administering Dimensions
18-33
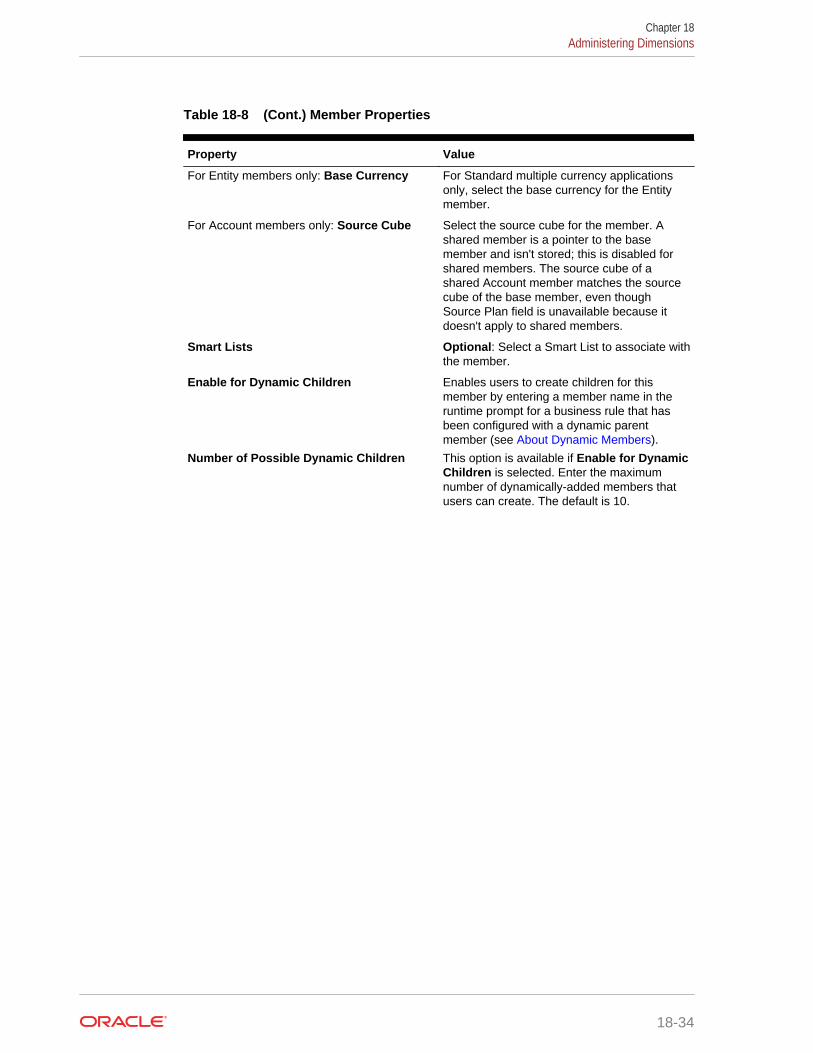
Table 18-8 (Cont.) Member Properties
Property Value
For Entity members only: Base Currency For Standard multiple currency applicationsonly, select the base currency for the Entitymember.
For Account members only: Source Cube Select the source cube for the member. Ashared member is a pointer to the basemember and isn't stored; this is disabled forshared members. The source cube of ashared Account member matches the sourcecube of the base member, even thoughSource Plan field is unavailable because itdoesn't apply to shared members.
Smart Lists Optional: Select a Smart List to associate withthe member.
Enable for Dynamic Children Enables users to create children for thismember by entering a member name in theruntime prompt for a business rule that hasbeen configured with a dynamic parentmember (see About Dynamic Members).
Number of Possible Dynamic Children This option is available if Enable for DynamicChildren is selected. Enter the maximumnumber of dynamically-added members thatusers can create. The default is 10.
Chapter 18Administering Dimensions
18-34
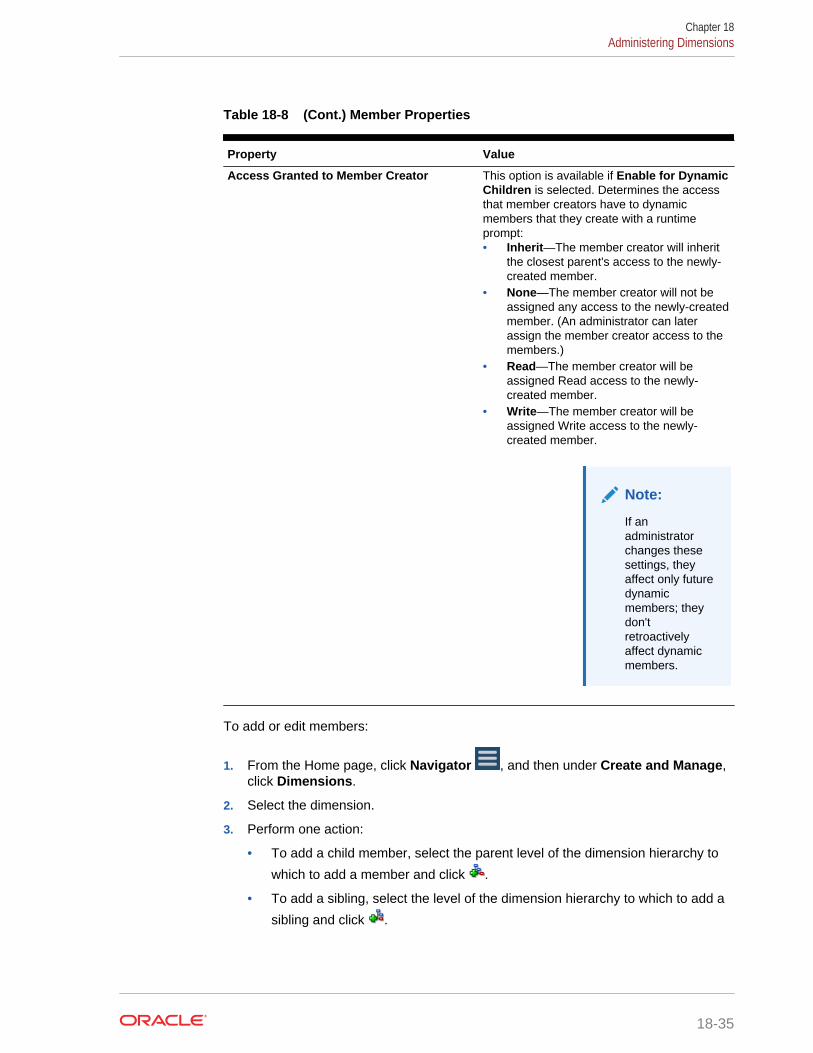
Table 18-8 (Cont.) Member Properties
Property Value
Access Granted to Member Creator This option is available if Enable for DynamicChildren is selected. Determines the accessthat member creators have to dynamicmembers that they create with a runtimeprompt:• Inherit—The member creator will inherit
the closest parent's access to the newly-created member.
• None—The member creator will not beassigned any access to the newly-createdmember. (An administrator can laterassign the member creator access to themembers.)
• Read—The member creator will beassigned Read access to the newly-created member.
• Write—The member creator will beassigned Write access to the newly-created member.
Note:
If anadministratorchanges thesesettings, theyaffect only futuredynamicmembers; theydon'tretroactivelyaffect dynamicmembers.
To add or edit members:
1. From the Home page, click Navigator , and then under Create and Manage,click Dimensions.
2. Select the dimension.
3. Perform one action:
• To add a child member, select the parent level of the dimension hierarchy to
which to add a member and click .
• To add a sibling, select the level of the dimension hierarchy to which to add a
sibling and click .
Chapter 18Administering Dimensions
18-35
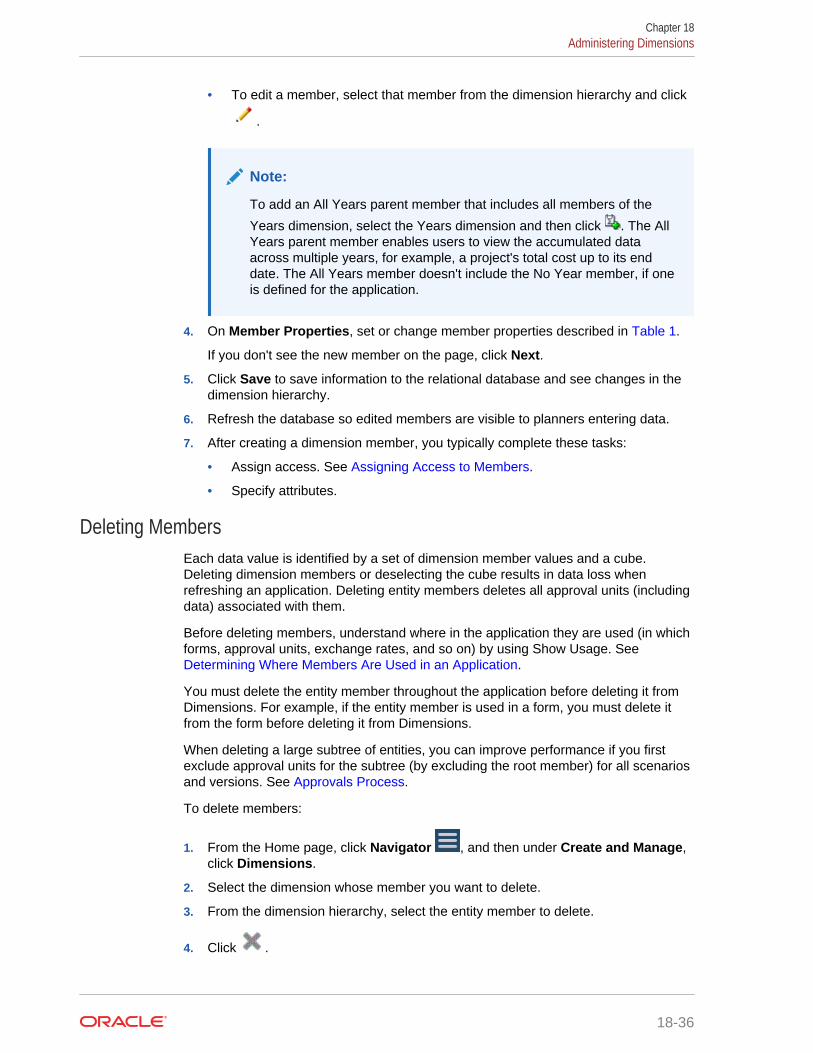
• To edit a member, select that member from the dimension hierarchy and click
.
Note:
To add an All Years parent member that includes all members of the
Years dimension, select the Years dimension and then click . The AllYears parent member enables users to view the accumulated dataacross multiple years, for example, a project's total cost up to its enddate. The All Years member doesn't include the No Year member, if oneis defined for the application.
4. On Member Properties, set or change member properties described in Table 1.
If you don't see the new member on the page, click Next.
5. Click Save to save information to the relational database and see changes in thedimension hierarchy.
6. Refresh the database so edited members are visible to planners entering data.
7. After creating a dimension member, you typically complete these tasks:
• Assign access. See Assigning Access to Members.
• Specify attributes.
Deleting MembersEach data value is identified by a set of dimension member values and a cube.Deleting dimension members or deselecting the cube results in data loss whenrefreshing an application. Deleting entity members deletes all approval units (includingdata) associated with them.
Before deleting members, understand where in the application they are used (in whichforms, approval units, exchange rates, and so on) by using Show Usage. See Determining Where Members Are Used in an Application.
You must delete the entity member throughout the application before deleting it fromDimensions. For example, if the entity member is used in a form, you must delete itfrom the form before deleting it from Dimensions.
When deleting a large subtree of entities, you can improve performance if you firstexclude approval units for the subtree (by excluding the root member) for all scenariosand versions. See Approvals Process.
To delete members:
1. From the Home page, click Navigator , and then under Create and Manage,click Dimensions.
2. Select the dimension whose member you want to delete.
3. From the dimension hierarchy, select the entity member to delete.
4. Click .
Chapter 18Administering Dimensions
18-36
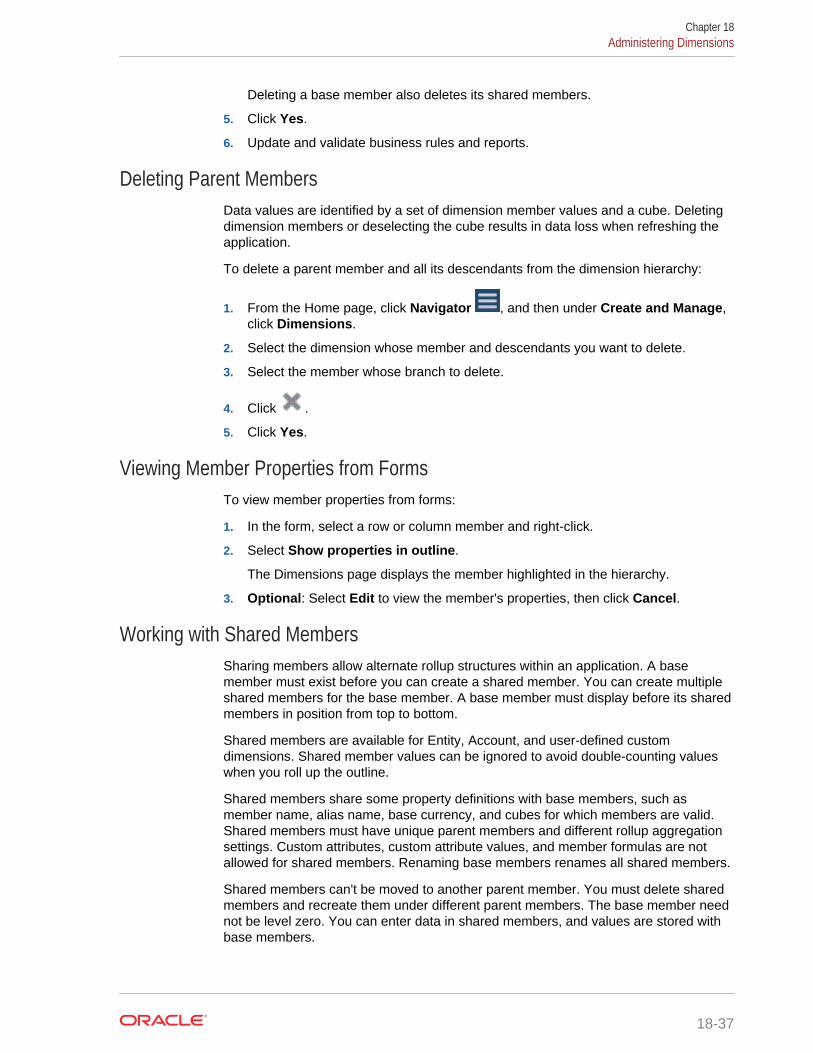
Deleting a base member also deletes its shared members.
5. Click Yes.
6. Update and validate business rules and reports.
Deleting Parent MembersData values are identified by a set of dimension member values and a cube. Deletingdimension members or deselecting the cube results in data loss when refreshing theapplication.
To delete a parent member and all its descendants from the dimension hierarchy:
1. From the Home page, click Navigator , and then under Create and Manage,click Dimensions.
2. Select the dimension whose member and descendants you want to delete.
3. Select the member whose branch to delete.
4. Click .
5. Click Yes.
Viewing Member Properties from FormsTo view member properties from forms:
1. In the form, select a row or column member and right-click.
2. Select Show properties in outline.
The Dimensions page displays the member highlighted in the hierarchy.
3. Optional: Select Edit to view the member's properties, then click Cancel.
Working with Shared MembersSharing members allow alternate rollup structures within an application. A basemember must exist before you can create a shared member. You can create multipleshared members for the base member. A base member must display before its sharedmembers in position from top to bottom.
Shared members are available for Entity, Account, and user-defined customdimensions. Shared member values can be ignored to avoid double-counting valueswhen you roll up the outline.
Shared members share some property definitions with base members, such asmember name, alias name, base currency, and cubes for which members are valid.Shared members must have unique parent members and different rollup aggregationsettings. Custom attributes, custom attribute values, and member formulas are notallowed for shared members. Renaming base members renames all shared members.
Shared members can't be moved to another parent member. You must delete sharedmembers and recreate them under different parent members. The base member neednot be level zero. You can enter data in shared members, and values are stored withbase members.
Chapter 18Administering Dimensions
18-37
Shared members are displayed similarly to base members in the dimension hierarchyfor member selection in Oracle Smart View for Office.
Creating Shared MembersYou create shared members the same way as other members, with these differences:
• The base member can't be the parent of the shared member.
• You can't add a shared member as a sibling to the base member.
• You must give the shared member the same name as its base member. It canhave a different description.
• You must select Shared as the Data Storage for the shared member.
Working with AttributesUse attributes to group members using the same criterion. You can assign attributes tosparse dimensions only. You can't assign attributes to label-only members. Attributedimensions don't have aggregation properties because parents are dynamicallycalculated.
The Account dimension is usually defined as dense, so you can't assign attributes to itunless it's changed to sparse for all cubes. If you change a dimension from sparse todense, all attributes and attribute values for that dimension are automatically deleted.
Attributes can have data types of text, date, Boolean, and numeric, as described in Understanding Attribute Data Types. Attribute names must conform to guidelines listedin Naming Restrictions. When attributes are defined, you can use the MemberSelection dialog box to select attribute functions, such as Equal andGreaterOrEqual.
To create and change attributes, attribute values, and aliases:
1. From the Home page, click Navigator , and then under Create and Manage,click Dimensions.
2. Select a sparse dimension for which to define an attribute, attribute value, or alias.
Note:
Only sparse dimensions can contain attributes.
3. Click .
Note:
If the dimension isn't sparse, Custom Attributes isn't available.
4. Select options.
Chapter 18Administering Dimensions
18-38
• To create attributes, click . Type an attribute name, and select a data type:Text, Date, Boolean, or Numeric. See Understanding Attribute Data Types.You can't modify the data type after the attribute is created.
Cube options are available for Entity dimension attributes only. You can'tchange this setting after the attribute is created.
• To modify attributes, click , and update the attribute name.
• To set aliases for attributes, select an attribute and an attribute value, click .Select an alias table, type an alias name, and click Save.
5. Click Close.
When you click Close, the hierarchy is validated and an error displays if issues aredetected. For example, date attribute values must be entered in the correct format,and numeric and date attribute dimensions must have at least one attribute valuedefined.
6. Update and validate business rules and reports.
• Understanding Attribute Data Types
• Deleting Attributes
Note:
Instead of explicitly filtering by an attribute (like Red, for instance), you cancreate a user variable for the attribute dimension, and then use the uservariable as the filter. Then you can enable the user variable as a dynamicuser variable which would allow users to change the value of the filter atruntime. This is a useful technique that allows for dynamic filtering. See Managing User Variables.
Understanding Attribute Data TypesAttribute dimensions can have a data type of text, numeric, Boolean, or date thatenables different functions for grouping, selecting, or calculating data. The attributetype applies only to level 0 members of the attribute dimension.
• Text attributes enable basic attribute member selection and attribute comparisonsin calculations. When you perform such comparisons, characters are compared.For example, a package type Bottle is less than a package type Can because Bprecedes C in the alphabet.
• Numeric attribute dimensions use numeric values for the names of level 0members. You can include the names (values) of numeric attribute dimensionmembers in calculations. For example, you can use the number of ouncesspecified in an Ounces attribute to calculate profit per ounce for each product. Youcan also associate numeric attributes with ranges of base dimension values, forexample, to analyze product sales by market population groupings.
• Boolean attribute dimensions in a database contain only two members. When aBoolean attribute dimension is added in Planning, two attribute values, True andFalse, are created for this attribute dimension by default. A base dimension, such
Chapter 18Administering Dimensions
18-39
as Account or Entity, can be associated with only one attribute dimension that hasthe Boolean data type.
• Date attributes can specify the date format as month-day-year or day-month-year,and sequence information accordingly. You can use date attributes in calculations,for example, comparing dates in a calculation that selects product sales since12-22-1998. Users can set the date format by selecting an option in AttributeDimension Date Format in Application Settings.
Deleting AttributesWhen you delete an attribute, all attribute values associated with the attribute are alsodeleted. Attribute values are removed from members to which they had beenassigned, and the attribute is removed from dimensions to which it was assigned.
To delete attributes:
1. From the Home page, click Navigator , and then under Create and Manage,click Dimensions.
2. Select the sparse dimension for which to delete an attribute, and click .
3. Select the attribute to delete.
4. Above the Attributes column, click .
5. Click OK.
6. Update and validate business rules and reports.
Working with Attribute ValuesAttribute values provide users with another way of selecting dimensions memberswhen using forms. Data values for attribute values are dynamically calculated but notstored.
• Creating Attribute Values
• Assigning Attribute Values to Members
• Editing and Deleting Attribute Values
Creating Attribute ValuesYou can define attribute values for sparse dimensions, which are typically the Entityand user-defined custom dimensions. After you define an attribute value for adimension, you can assign it to members of that dimension.
To create attribute values:
1. From the Home page, click Navigator , and then under Create and Manage,click Dimensions.
2. Select the sparse dimension for which to create an attribute value.
3. Select the top level in the dimension hierarchy.
4. Click .
Chapter 18Administering Dimensions
18-40
5. On the Manage Attributes and Values page, select the attribute for which tospecify a value.
6. Above the Attribute Values column, click . If the options are available, you can
click or .
7. Enter a name and choose a data type.
8. Click Save.
Assigning Attribute Values to MembersYou can assign attribute values members of a dimension that are defined as sparsefor all cubes. Attribute values must be assigned to the same-level sparse dimensionmembers. Otherwise, errors display during refresh.
To assign attribute values to members:
1. From the Home page, click Navigator , and then under Create and Manage,click Dimensions.
2. Select the sparse dimension for whose member you want to assign an attributevalue.
3. In the Dimension hierarchy, select a member to which to assign an attributevalue.
4. Click .
5. For members assigned attribute values, click to change a member’s attributevalue.
6. Select attribute values to assign to the member.
7. Perform an action:
• To assign the value to the selected member, click .
• To remove a value from the selected member, select the value to remove and
click .
• To remove all values from the selected member, click .
8. Click Save.
Editing and Deleting Attribute Values
Note:
When you delete an attribute value, it's removed from custom dimensionmembers to which it's assigned.
To edit or delete attribute values:
Chapter 18Administering Dimensions
18-41
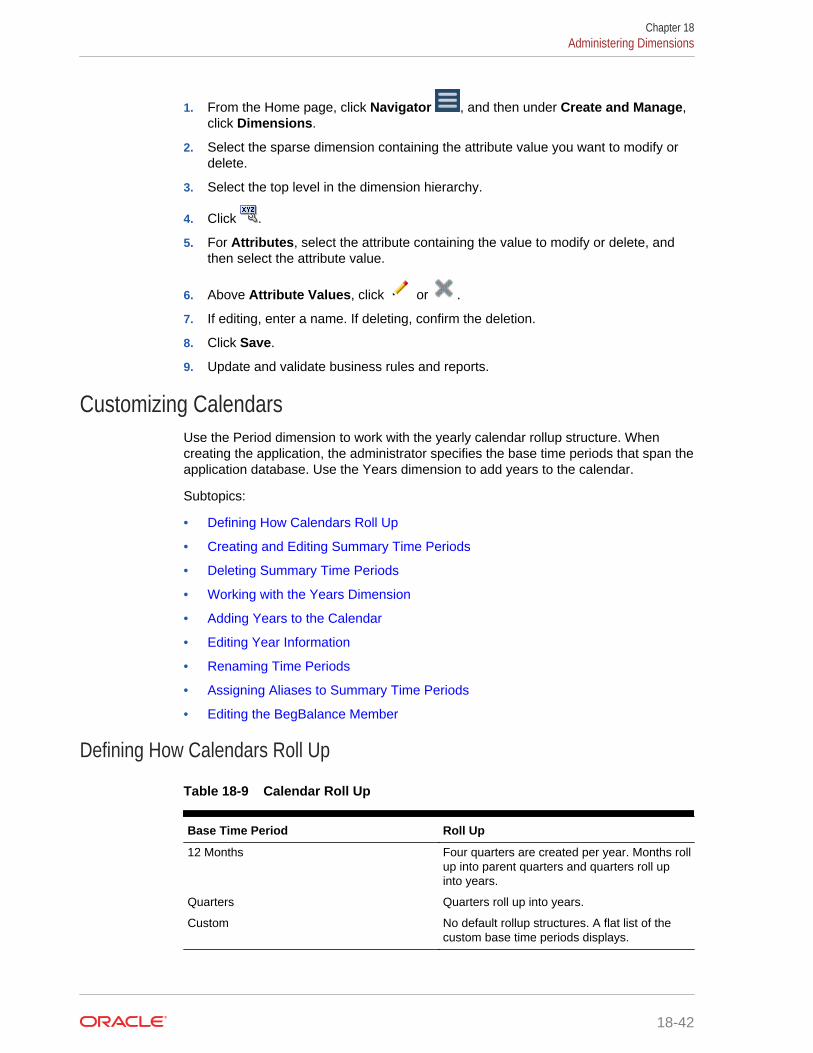
1. From the Home page, click Navigator , and then under Create and Manage,click Dimensions.
2. Select the sparse dimension containing the attribute value you want to modify ordelete.
3. Select the top level in the dimension hierarchy.
4. Click .
5. For Attributes, select the attribute containing the value to modify or delete, andthen select the attribute value.
6. Above Attribute Values, click or .
7. If editing, enter a name. If deleting, confirm the deletion.
8. Click Save.
9. Update and validate business rules and reports.
Customizing CalendarsUse the Period dimension to work with the yearly calendar rollup structure. Whencreating the application, the administrator specifies the base time periods that span theapplication database. Use the Years dimension to add years to the calendar.
Subtopics:
• Defining How Calendars Roll Up
• Creating and Editing Summary Time Periods
• Deleting Summary Time Periods
• Working with the Years Dimension
• Adding Years to the Calendar
• Editing Year Information
• Renaming Time Periods
• Assigning Aliases to Summary Time Periods
• Editing the BegBalance Member
Defining How Calendars Roll Up
Table 18-9 Calendar Roll Up
Base Time Period Roll Up
12 Months Four quarters are created per year. Months rollup into parent quarters and quarters roll upinto years.
Quarters Quarters roll up into years.
Custom No default rollup structures. A flat list of thecustom base time periods displays.
Chapter 18Administering Dimensions
18-42
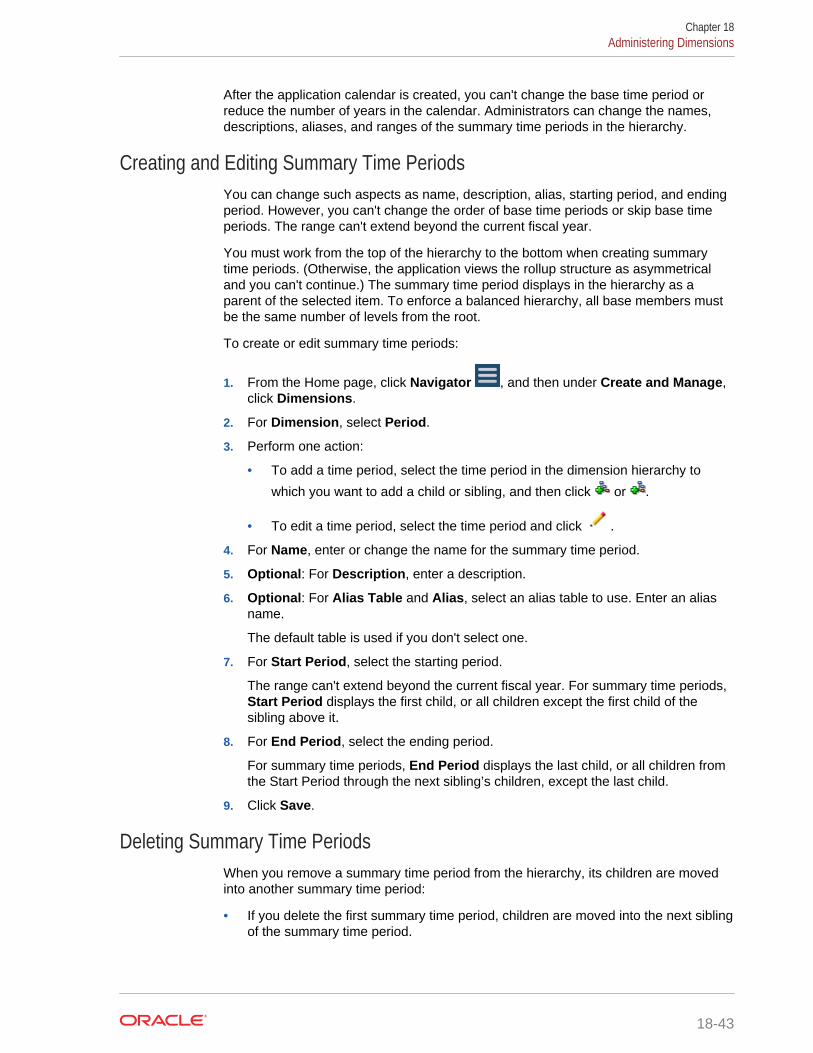
After the application calendar is created, you can't change the base time period orreduce the number of years in the calendar. Administrators can change the names,descriptions, aliases, and ranges of the summary time periods in the hierarchy.
Creating and Editing Summary Time PeriodsYou can change such aspects as name, description, alias, starting period, and endingperiod. However, you can't change the order of base time periods or skip base timeperiods. The range can't extend beyond the current fiscal year.
You must work from the top of the hierarchy to the bottom when creating summarytime periods. (Otherwise, the application views the rollup structure as asymmetricaland you can't continue.) The summary time period displays in the hierarchy as aparent of the selected item. To enforce a balanced hierarchy, all base members mustbe the same number of levels from the root.
To create or edit summary time periods:
1. From the Home page, click Navigator , and then under Create and Manage,click Dimensions.
2. For Dimension, select Period.
3. Perform one action:
• To add a time period, select the time period in the dimension hierarchy to
which you want to add a child or sibling, and then click or .
• To edit a time period, select the time period and click .
4. For Name, enter or change the name for the summary time period.
5. Optional: For Description, enter a description.
6. Optional: For Alias Table and Alias, select an alias table to use. Enter an aliasname.
The default table is used if you don't select one.
7. For Start Period, select the starting period.
The range can't extend beyond the current fiscal year. For summary time periods,Start Period displays the first child, or all children except the first child of thesibling above it.
8. For End Period, select the ending period.
For summary time periods, End Period displays the last child, or all children fromthe Start Period through the next sibling’s children, except the last child.
9. Click Save.
Deleting Summary Time PeriodsWhen you remove a summary time period from the hierarchy, its children are movedinto another summary time period:
• If you delete the first summary time period, children are moved into the next siblingof the summary time period.
Chapter 18Administering Dimensions
18-43
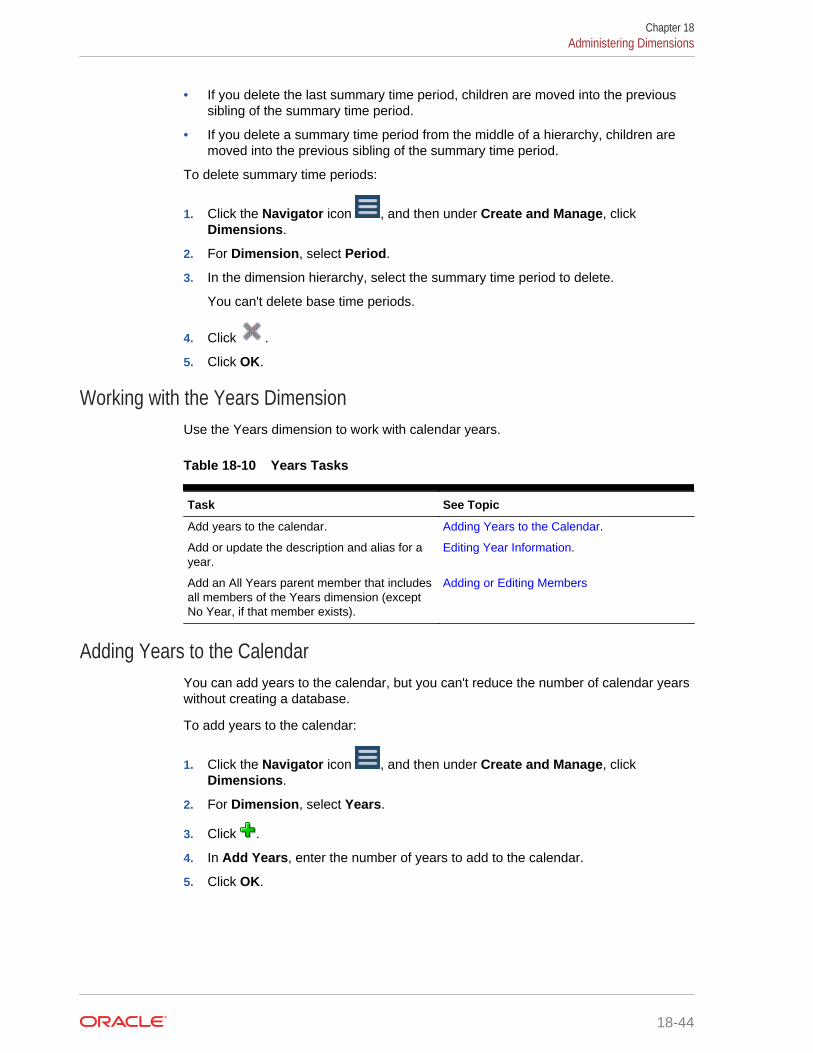
• If you delete the last summary time period, children are moved into the previoussibling of the summary time period.
• If you delete a summary time period from the middle of a hierarchy, children aremoved into the previous sibling of the summary time period.
To delete summary time periods:
1. Click the Navigator icon , and then under Create and Manage, clickDimensions.
2. For Dimension, select Period.
3. In the dimension hierarchy, select the summary time period to delete.
You can't delete base time periods.
4. Click .
5. Click OK.
Working with the Years DimensionUse the Years dimension to work with calendar years.
Table 18-10 Years Tasks
Task See Topic
Add years to the calendar. Adding Years to the Calendar.
Add or update the description and alias for ayear.
Editing Year Information.
Add an All Years parent member that includesall members of the Years dimension (exceptNo Year, if that member exists).
Adding or Editing Members
Adding Years to the CalendarYou can add years to the calendar, but you can't reduce the number of calendar yearswithout creating a database.
To add years to the calendar:
1. Click the Navigator icon , and then under Create and Manage, clickDimensions.
2. For Dimension, select Years.
3. Click .
4. In Add Years, enter the number of years to add to the calendar.
5. Click OK.
Chapter 18Administering Dimensions
18-44
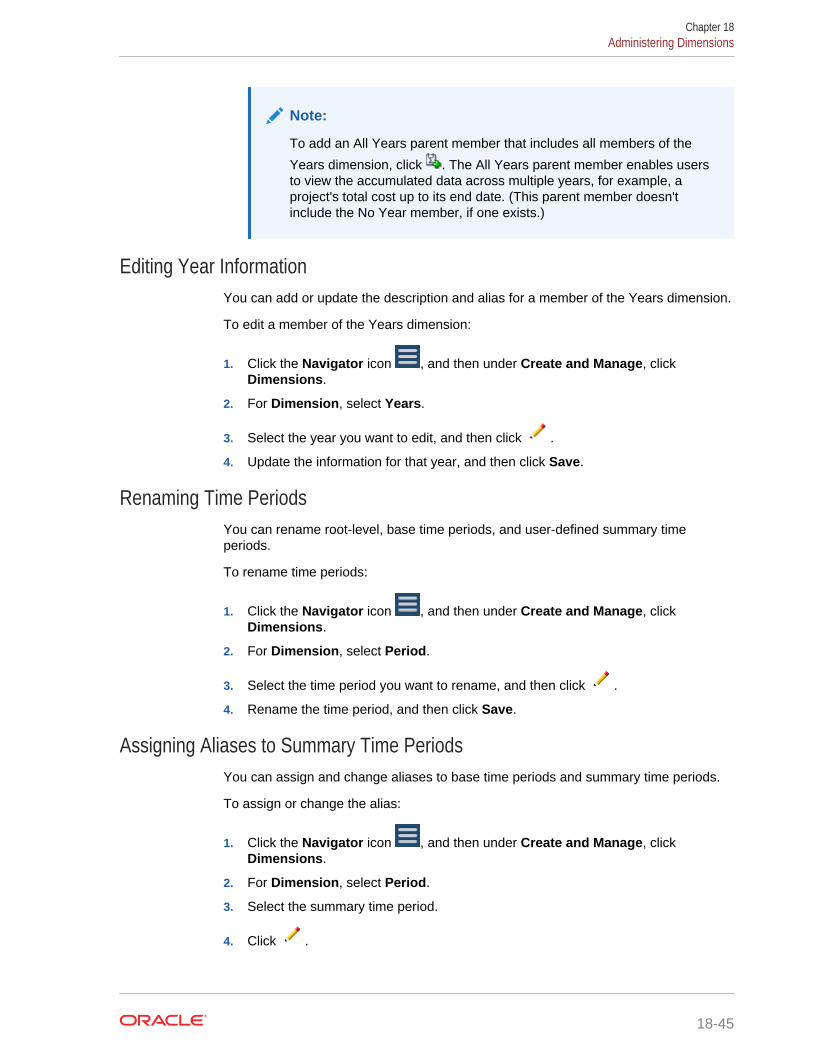
Note:
To add an All Years parent member that includes all members of the
Years dimension, click . The All Years parent member enables usersto view the accumulated data across multiple years, for example, aproject's total cost up to its end date. (This parent member doesn'tinclude the No Year member, if one exists.)
Editing Year InformationYou can add or update the description and alias for a member of the Years dimension.
To edit a member of the Years dimension:
1. Click the Navigator icon , and then under Create and Manage, clickDimensions.
2. For Dimension, select Years.
3. Select the year you want to edit, and then click .
4. Update the information for that year, and then click Save.
Renaming Time PeriodsYou can rename root-level, base time periods, and user-defined summary timeperiods.
To rename time periods:
1. Click the Navigator icon , and then under Create and Manage, clickDimensions.
2. For Dimension, select Period.
3. Select the time period you want to rename, and then click .
4. Rename the time period, and then click Save.
Assigning Aliases to Summary Time PeriodsYou can assign and change aliases to base time periods and summary time periods.
To assign or change the alias:
1. Click the Navigator icon , and then under Create and Manage, clickDimensions.
2. For Dimension, select Period.
3. Select the summary time period.
4. Click .
Chapter 18Administering Dimensions
18-45
5. For Alias Table, select the alias table to use.
6. For Alias, enter an alias name.
7. Click Save.
Editing the BegBalance MemberYou can edit the BegBalance member of the Period dimension. As the first time periodin the application, the BegBalance member is useful for entering beginning data whenyou start a new application, fiscal year, or calendar year. You can rename anddescribe BegBalance and give it an alias.
To edit the BegBalance member:
1. Click the Navigator icon , and then under Create and Manage, clickDimensions.
2. For Dimension, select Period.
3. Select the first member, BegBalance.
4. Click .
5. For Edit Period:
• Enter a name.
• Enter a description.
• Select an alias table to use for the BegBalance member, and enter an alias.
6. Click Save.
Setting Up CurrenciesYou can plan, forecast, and analyze financial information in one or more currencies.You can create, edit, and delete currencies. Administrators control:
• Which currencies an application uses, including for reporting
• How currencies display in reports and forms
• How currencies convert to other currencies
• For Standard multiple currency applications, whether a triangulation currencyconverts currencies
• When currency conversions occur
Enabling Multiple CurrenciesIn a Standard multiple currency application only, you can enable multiple currenciesper entity on forms. See Defining the Layout.
When selecting business rules for forms, you can select the Calculate Currenciesbusiness rule to convert values among the available currencies. See SelectingBusiness Rules.
• Working with Currencies in a Standard Multicurrency Application
• About the Calculate Currencies Business Rule
Chapter 18Administering Dimensions
18-46
• Exchange Rate Types
• Scaling
• Number Formatting
• Reporting Currencies for Standard Multicurrency Applications
• Checking How Currencies are Used
• Creating Currencies
• Editing Currencies
• Deleting Currencies
Base CurrencyFor a Standard multiple currency application, specify each entity member’s basecurrency. The default base currency for entity members is the currency specified whencreating the application. For example, if U.S. Dollars is the default currency, you mayspecify Yen as the base currency for the Japan entity and U.S. Dollars for the UnitedStates entity. When using forms having values for the Japan entity, if the displaycurrency is set to U.S. Dollars, values are converted to U.S. Dollars using the rates inthe exchange rate table (assuming Yen is the local currency and U.S. Dollars is thereporting currency).
Note:
If the Simplified multiple currency option was selected during applicationcreation, you don't need to specify a base currency for entity members. See About Simplified Multicurrency.
Working with Currencies in a Standard Multicurrency Application
Note:
This topic assumes the Standard multiple currency option was selectedduring application creation. If the Simplified multiple currency option wasselected, see About Simplified Multicurrency.
If multiple currencies are enabled, users can see values converted from the localcurrency to a reporting currency and can override a cell’s base currency.
Chapter 18Administering Dimensions
18-47
Note:
• When the local currency is selected on forms, the default stored anddisplayed currency for cells is the entity’s base currency (which youspecify). Users can enter data values only into local currency members.If the local currency member is selected, all currencies specified for theapplication are available as input types.
• You can set dimension properties for each currency in the EditCurrency dialog box. In preferences, users can select different displayoptions, and can select Currency Setting to apply the properties set bythe administrator.
• Currencies can be converted only to reporting currencies. Users can'tenter data into cells displayed in reporting currencies. The application’smain currency is by default a reporting currency. You can change whichcurrencies are reporting currencies.
• Currencies defined for the application are valid currencies for data entry.Valid currencies for data entry are displayed in a list that users access byclicking the Currency link during data entry.
• To get meaningful results, roll up values in one common reportingcurrency. If members of a subtotal have mixed currencies, the currencytype is blank and the currency symbol doesn't display. For example,adding 10 US dollars and 10 Japanese yen to a value of 20 makes nosense.
• An application with 500 time periods can successfully run currencyconversion calculation scripts only if the time periods have defaultnames, TP 1 through 500. Otherwise, the conversion calculation scriptyou try to create exceeds the 64K limit.
• User-defined currency conversion calculation scripts created when adatabase is created or refreshed may be available in Oracle Smart Viewfor Office, depending on user access. When using user-defined currencyconversion calculation scripts, Oracle recommends changing the orderso the currency conversion calculation script is first, before CalculateForm.
• Currency codes associated with input values are stored as numericvalues. These codes are calculated in dimension formulas, calculationscripts, and business rules. The calculated values of these currencycodes may translate to currency codes that are incorrect or invalid.Where there are children with mixed currencies, review calculatedresults on the upper levels.
• If a parent has multiple children, of whom only one child has anoverridden currency, the parent inherits the overridden currency code(which isn't displayed on forms).
• In certain cases, parent entities display #MISSING when trying toconvert to a selected currency. Ensure that a currency rate is entered foreach combination of local currencies and selected currencies on formsor reports. Currency combinations must exist for all mixed-currencychildren entities and parent members.
Chapter 18Administering Dimensions
18-48
• Input of multiple currencies to one entity isn't supported in Smart View. Ifworksheets include mixed currency types, users could inadvertentlyenter values in the wrong currency.
About the Calculate Currencies Business Rule
Note:
This topic assumes the Standard multiple currency option was selectedduring application creation. If the Simplified multiple currency option wasselected, see About Simplified Multicurrency.
The Calculate Currencies business rule is based on the dimensions and members onthe form. It converts data from the local currency to the reporting currency specified onthe form, applying the exchange rate conversions. It:
• Doesn't calculate subtotals. To subtotal values, run the Calculate Form businessrule (or a customized business rule that includes aggregation) after convertingcurrencies.
• Ignores #MISSING values.
• Can be turned on or off by associating or disassociating it with forms during formdesign.
• Is set by default to not run when saving data.
Exchange Rate Types
Exchange Rate Types for Standard Multicurrency Applications
For Standard multiple currency applications, these are the exchange rate types thatare associated with currencies: Historical, Average, and Ending.
The exchange rate type for each account is specified in the Member Property dialogbox. For average and ending rate types, enter values for all time periods. For historicalrate types, enter one rate value that is used for all time periods, including theBeginning Balance period. For the Beginning Balance period, enter one rate valueused for that time period for average and ending rate types.
A Standard multiple currency application supports currency conversion by triangulationthrough a triangulation currency.
Exchange Rate Types for Simplified Multicurrency Applications
For Simplified multiple currency applications, these are the exchange rate types thatare associated with currencies: FX Rates-Average and FX Rates-Ending. See AboutSimplified Multicurrency.
ScalingYou can specify scaling data values when displayed in certain currencies. Forexample, you can set the scaling for Yen to Thousands, then enter 10,000 as a value
Chapter 18Administering Dimensions
18-49
for the Japan entity on a form with the Local member selected for the Currencydimension. When you select Yen as the currency member for the form, the scaling isapplied and 10 displays as the value for Japan.
Number FormattingYou can determine the initial display of numerical values for non-currency andcurrency data types in forms:
• Thousands separator:
– None—1000
– Comma—1,000
– Dot—1.000
– Space—1 000
• Decimal separator:
– Dot—1000.00
– Comma—1000,00
• Negative number sign:
– Prefixed minus— -1000
– Suffixed minus—1000-
– Parentheses—(1000)
• Negative number color:
– Black
– Red
Reporting Currencies for Standard Multicurrency Applications
Note:
This topic assumes the Standard multiple currency option was selectedduring application creation. If the Simplified multiple currency option wasselected, see About Simplified Multicurrency.
A reporting currency is the currency in which your company prepares financialstatements. The application supports currency conversion from local currencies to oneor more reporting currencies. Converted reporting currency values are stored andread-only for all users. An application’s default currency is the default reportingcurrency. You can disable a currency as a reporting currency.
Checking How Currencies are UsedYou can view how an application uses currency: whether a currency is the default, isused for triangulation currency or by an entity (for Standard multicurrencyapplications), or has a conversion or exchange relationship with other currencies.
To see how currencies are used:
Chapter 18Administering Dimensions
18-50
1. Click the Navigator icon , and then under Create and Manage, clickDimensions.
2. From Dimension, select Currency.
3. Select the currency for which you want information.
4. Click .
Creating CurrenciesSelect from a predefined list or create your own. You can specify:
• The three-letter code
• The symbol
• A description of up to 256 characters
• The scaling factor to use when values are displayed
• For Standard multicurrency applications, the triangulation currency to use forcurrency conversion
• The alias table to use to display aliases
• Number formatting, including thousands separator, decimal separator, negativesign, and color
• Whether it's a reporting currency
To create currencies:
1. Click the Navigator icon , and then under Create and Manage, clickDimensions.
2. From Dimension, select Currency.
3. Click .
4. From Create Currency:
• To add a predefined currency, select Select standard Currencies, and thenselect from a list standard currencies.
• To create a currency, select Create new currency and specify properties:
– For Code, enter an abbreviation or identifier of up to three characters.
– Optional: For Description, enter a name, such as Japanese yen.
– For Symbol, enter a symbol or select a symbol from the list.
– Optional: For Scale, select how to enter and display the currency. Forexample, 3 yen represents 3000 yen if scaling is set to thousands.
– Optional: For Triangulation Currency (for Standard multicurrencyapplications), select the currency to use as the common third currency forconversion.
– Optional: For Alias Table, select the alias table to use.
– Optional: For Alias, enter a name for the currency alias.
Chapter 18Administering Dimensions
18-51
5. Optional: Select Reporting Currency (see Working with Currencies in aStandard Multicurrency Application).
6. Optional: For Thousands Separator, select how to display the thousandsseparator (it must differ from the decimal separator).
7. Optional: For Decimal Separator, select how to display numbers with decimalvalues (it must differ from the thousands separator).
8. Optional: For Negative Sign, select how to display negative numbers:
• Prefixed minus— -1000
• Suffixed minus—1000-
• Parentheses—(1000)
9. Optional: For Negative Color, select the display color.
10. Optional: Select the type of Data Storage.
11. Optional: Select Two Pass Calculation.
12. Optional: Select the Data Type.
13. Optional: Select a Smart List.
14. Click Save.
Editing CurrenciesTo edit currencies:
1. Click the Navigator icon , and then under Create and Manage, clickDimensions.
2. From Dimension, select Currency.
3. Select the currency to edit.
4. Click .
5. Click the Currency tab.
6. Modify properties:
• To select from the predefined symbols, select one from the Select fromPredefined Symbols drop-down list.
• To change the currency’s symbol, for Symbol, enter or select the symbol.
• For Scale, set how to enter and display the currency.
• For set currency precision (the number of digits to the right of the decimalplace), select a number from 1 to 10 from the Precision drop-down list.
None is the default.
Note:
Administrators can override this setting for forms. See Setting FormPrecision and Other Options.
Chapter 18Administering Dimensions
18-52
• To specify the currency as a reporting currency, select Reporting Currency.
See Working with Currencies in a Standard Multicurrency Application.
• For Thousands Separator, select how to display the thousands separator (itmust differ from the decimal separator).
• For Decimal Separator, select how to display numbers with decimal values (itmust differ from the thousands separator).
• For Negative Sign, select how to display negative numbers:
– Prefixed Minus— -1000
– Suffixed Minus—1000-
– Parentheses—(1000)
– Use Default Setting—Apply the display setting for the currency (see Creating Currencies).
• For Negative Color, select the display color.
7. Click Save.
Deleting CurrenciesYou can't delete the default currency.
To delete currencies:
1. Click the Navigator icon , and then under Create and Manage, clickDimensions.
2. From Dimension, select Currency.
3. Select the currency to delete.
4. For multiple currency applications, click to determine if the currency is thedefault currency. If a Standard multicurrency application is used, determine if thecurrency is a triangulation currency, or if the currency is associated with an entity.You can't delete a currency that meets these criteria.
Note:
For Standard multiple currency applications, if you delete a currencydefined in the exchange rate table, it's deleted from the table.
5. Click Close.
6. Click , and then click OK.
7. Update and validate business rules and reports.
Chapter 18Administering Dimensions
18-53
Specifying Exchange Rates
Note:
This topic assumes the multiple currency option was selected duringapplication creation. If the Simplified multiple currency option was selected,see About Simplified Multicurrency.
Use exchange rates to convert values from one currency to another. You can:
• Enable budget preparers in various countries to create plans in other currencies
• Show summary report data in a currency
• Summarize values from multiple currencies into one currency
For example, you might specify yen as the base currency for the Japan entity and USdollars for the United States entity. When you display a form having values for theJapan entity and the form’s display currency is set to US dollars, the exchange ratesfor the yen is used to convert the values for Japan to US dollars. If the displaycurrency is set to yen, the exchange rates for US dollars converts values for the UnitedStates entity to yen.
To specify exchange rates, you must set up multiple currencies when creating anapplication.
• About Exchange Rate Tables for Standard Multicurrency Applications
• Hsp_Rates Dimension for Standard Multicurrency Applications
• Triangulation
• Calculation Method
About Exchange Rate Tables for Standard Multicurrency Applications
Note:
This topic assumes the Standard multiple currency option was selectedduring application creation. If the Simplified multiple currency option wasselected, see About Simplified Multicurrency.
Each application has a default currency specified when the application is created.When you specify exchange rate tables, only the default currency and triangulationcurrencies are available as destination currencies. You can enter exchange rates fromsource currencies to default or triangulation currencies.
You can create multiple exchange rate tables. Each table is typically associated withmultiple scenarios, but each scenario can be associated with only one exchange ratetable. When creating scenarios, select the exchange rate table for convertingcurrencies.
Chapter 18Administering Dimensions
18-54
Enter conversion values between the default currency and currencies defined in theExchange Rates page. Exchange rate tables span all application time periods, so youcan apply exchange rates to all scenarios. When creating or modifying exchange ratetables, you must refresh the application to store them in the cubes. See RefreshingApplication Databases.
Hsp_Rates Dimension for Standard Multicurrency Applications
Note:
This topic assumes the Standard multiple currency option was selectedduring application creation. If the Simplified multiple currency option wasselected, see About Simplified Multicurrency.
A Standard multiple currency application includes the Hsp_Rates dimension for storingexchange rates. It includes these members and others that store currency rates:
• Hsp_InputValue—Stores data values
• Hsp_InputCurrency—Stores currency types for data values
When generating reports or loading data, refer to the Hsp_InputValue member. Whenloading data, you must load data against the local currency. You need not refer to theHsp_InputCurrency member.
By default, the Hsp_Rates dimension is set to Sparse. You can change this (see Setting Dimension Density and Order).
Triangulation
Note:
This topic assumes the multiple currency option was selected duringapplication creation. If the Simplified multiple currency option was selected,see About Simplified Multicurrency.
A multiple currency application supports currency conversion by triangulation throughan interim currency called the triangulation currency. If you modify a currency’striangulation currency, you must re-enter exchange rates for the triangulation currencyproperty and refresh the application to transfer and store the exchange rates. Youcan't select the application’s default currency as a triangulation currency.
Calculation MethodWhen you input exchange rates for converting between currencies, you can selectMultiply or Divide as the calculation method. For example, if you select 1.5 as the ratefor converting British Pounds to US dollars, and select multiply as the calculationmethod, 1 British Pound is converted to 1.5 US dollars.
Chapter 18Administering Dimensions
18-55
Setting up Dynamic Time Series MembersYou can use Dynamic Time Series members to create reports that show period-to-date data, such as quarter-to-date expenses. Dynamic Time Series members arecreated automatically during application creation, and can be used with members ofthe Period dimension. To set up Dynamic Time Series, you enable a predefinedDynamic Time Series member and associate it with a generation number (and,optionally, an alias table and alias name). For example, to calculate quarter-to-datevalues, you can enable the Q-T-D (quarter-to-date) member and associate it withgeneration number 2. You can then use the Q-T-D Dynamic Time Series member tocalculate monthly values up to the current month in the quarter.
Note:
Dynamic Time Series isn't supported for the Period dimension in anaggregate storage application.
The Dynamic Time Series members provide up to eight levels of period-to-datereporting. Your data and database outline determine which members you can use. Forexample, if the database contains hourly, daily, weekly, monthly, quarterly, and yearlydata, you can report D-T-D (day-to date), W-T-D (week-to-date), M-T-D (month-to-date), Q-T-D, and Y-T-D information. If the database contains monthly data for thepast 5 years, you can report Y-T-D and H-T-D (history-to-date) information, up to aspecific year. If the database tracks data for seasonal time periods, you can report P-T-D or S-T-D (season-to-date) information.
Oracle recommends that you avoid assigning time balance properties (such as Firstand Average) to members set for dynamic calculations if you plan to use the membersin Dynamic Time Series calculations. Doing so may retrieve incorrect values for parentmembers in your accounts dimension.
To set up Dynamic Time Series members:
1. Click the Navigator icon , and then under Create and Manage, clickDimensions.
2. Select the Period dimension, and then click .
3. Select Enabled for the DTS series to use:
• Y-T-D: Year-to-date
• H-T-D: History-to-date
• S-T-D: Season-to-date
• Q-T-D: Quarter-to-date
• P-T-D: Period-to-date
• M-T-D: Month-to-date
• W-T-D: Week-to-date
• D-T-D: Day-to-date
Chapter 18Administering Dimensions
18-56
4. Select a generation.
The number of generations displayed depends on the number of generations inthe time dimension. You can't associate Dynamic Time Series members with thehighest generation (the dimension root).
5. Optional: Add an alias name. In the Edit Alias Name column, click , enter analias name, and then click OK.
6. Click Save.
Additional Supported Application FeaturesAdditional features are supported for application dimensions. You can add childrenand siblings to Scenario, Version, and Period dimensions, and you can use the cut,paste, expand, and collapse features to work with their dimension hierarchies (see Working with Dimension Hierarchies). You can also use shared members for thesedimensions, and can set two pass calculations at the root level for all dimensions. Forexample, you can:
Table 18-11 Features
Feature More Information
In Scenario and Version dimensions, createhierarchies and use shared members. If youassign children to bottom-up versions, theseversions display as read-only parents onforms.
See Setting Up Scenarios and SpecifyingVersions.
In the Period dimension, create alternatehierarchies and use shared descendants. DataStorage for all time periods can be set to anyvalid Data Storage value. The Consolidationoperator for all time periods, includingBegBalance, can be set to any validconsolidation operator. For example, it can beset to + instead of ~ (ignore).
See Working with the Years Dimension and Editing the BegBalance Member.
Turn on two pass calculation at the root level,for example, for Account.
Caution:
Two passcalculation isignored on anynon-Accountmember not setto Dynamic Calc.When using thissetting, considerthe impact oncurrencyconversionscripts.
See Adding or Editing Members.
Chapter 18Administering Dimensions
18-57
Table 18-11 (Cont.) Features
Feature More Information
For attributes, create hierarchies and assignaliases.
See Working with Attributes.
Note:
For multicurrency applications, the pre-built currency conversion calculationscript doesn't function properly if you change data storage to dynamic for anyScenario, Version, Period, or Years member, or for certain dimension roots(such as Entity, Version, Currency, and custom dimensions). When changingdata storage, consider the impact on currency conversion scripts.
Considerations for Alternate Hierarchies in Period DimensionsIf you create an alternate hierarchy in the Period dimension, the alternate hierarchymust follow the YearTotal member in the outline.
Working with UDAsYou can use user-defined attributes (UDAs), descriptive words or phrases, within calcscripts, member formulas, and reports. UDAs return lists of members associated withthe UDA. For example:
• You can use the HSP_UDF UDA to prevent a formula from being overwritten whenthe application is refreshed. You must log on to each database associated with thePlanning application and create the member formula with a UDA. The syntax forthis UDA is: (UDAs: HSP_UDF).
• If you use the @XREF function to look up a data value in another database tocalculate a value from the current database, you can add the HSP_NOLINK UDA tomembers to prevent the @XREF function from being created on all cubes that are notthe source cube selected for that member.
• For a Product dimension with several product members, you can create a UDAcalled New Products and assign this UDA to the new products in the Productdimension hierarchy. Then you can base certain calculations on the designationNew Products.
• For the budget review process, rather than creating a data validation rule for eachowner in a product line (some product lines can have hundreds of owners), youcan create a UDA containing the user names that apply to members using theapproval unit hierarchy. Then in the data validation rule, you can enter a lookupfunction which will return the user names stored in the UDA for the currentmember. For example, create a UDA for each user in the promotional path andassign a prefix to the UDA name (for example, ProdMgr:Kim).
UDAs are specific to dimensions. For example, creating a UDA for an Accountmember makes it available for non-shared Account members. Deleting it removes it forall Account members. To make UDAs available for multiple dimensions, create thesame UDA for multiple dimensions. For example, create a UDA named New for
Chapter 18Administering Dimensions
18-58
Account and Entity dimensions to make the UDA named New available for Accountand Entity members.
To work with UDAs:
1. Click the Navigator icon , and then under Create and Manage, clickDimensions.
2. Select the dimension for whose members to associate the UDA.
3. From the dimension hierarchy, select a member and click .
4. Select UDA.
5. Select a task:
• To create a UDA, click , enter a name, and then click Save.
Note:
If creating a UDA for approvals, assign a prefix to the beginning ofthe name (for example, ProdMgr:Name). A prefix indicates that theUDA contains a user name and enables the data validation rule tolook up the user. Use the same prefix for all approvals UDAs.
• To modify a UDA, click , change the name, and then click Save.
• To delete a UDA, select the UDA, click , and then confirm deletion.
Note:
Deleting the UDA removes it for the whole dimension. If you deleteUDAs, you must update all member formulas, calc scripts, andreports that reference them.
• To clear UDA selections, click .
6. To add or remove UDAs for the member, use the arrows to move UDAs to andfrom the Selected UDA panel.
7. Click Save.
Working with Member FormulasYou can define member formulas to combine operators, calculation functions,dimension and member names, and numeric constants to perform calculations onmembers. Member formulas can also include:
• Operator type, function, value, member name, UDA, and so on allowed informulas.
• Predefined formula expressions, including Smart List values, that expand into aformula or value upon database refresh.
Chapter 18Administering Dimensions
18-59
To define member formulas:
1. Click the Navigator icon , and then under Create and Manage, clickDimensions.
2. Select the dimension for whose member to add or change a formula.
3. Select the member and click Edit.
4. Select the Member Formula tab.
5. Select options for the following fields:
• Cube
Note:
A formula entered for the default cube will be applied to all cubesunless it's overridden by a different formula entered for a specificcube.
• Data Storage—Select a data storage option. The default is Store.
Note:
The cube specific data storage field will not display the Shared orLabel Only options. This is because a member can't be set toShared or Label Only in one cube and not another.
• Solve Order—For aggregate storage cubes only, solve order specifies theorder in which formulas are evaluated. Enter a whole number between 0 and100000 (or use arrows to increase or decrease the number). The formulas formembers that have a specified solve order are calculated in order from thelowest solve order to the highest. The default is 0.
6. In the text box, define formulas for the member.
7. Optional: To check the validity of the member formula, click Validate.
8. Click Save.
Before you click Save, clicking Reset restores the previous member formulainformation.
Viewing Details of Formula ValidationTo view details of the member formula validation:
1. On Member Formula, click Validate.
2. Click Save.
Chapter 18Administering Dimensions
18-60
Working with Formula ExpressionsIn the text box on the Member Formula tab, you can include predefined formulaexpressions in member formulas, and test them with the Validate button. You can alsoload them.
You can update the dimension outline without updating the business rules and calcscripts that depend on the outline. Calculations become more independent of specificsin the outline. You can use Smart Lists as objects in calculations. Performance isn'tdecreased when you use formula expressions because they are run only when yourefresh the database.
To use a formula expression in a member formula:
1. Click the Navigator icon , and then under Create and Manage, clickDimensions.
2. Select the dimension with which you want to work.
3. Select the member and click Edit.
4. Select Member Formula.
5. Select options for the following fields:
• Cube
Note:
A formula entered for the default cube will be applied to all cubesunless it's overridden by a different formula entered for a specificcube.
• Data Storage—Select a data storage option. The default is Store.
Note:
The cube specific data storage field will not display the Shared orLabel Only options. This is because a member can't be set toShared or Label Only in one cube and not another.
• Solve Order—For aggregate storage cubes only, solve order specifies theorder in which formulas are evaluated. Enter a whole number between 0 and100000 (or use arrows to increase or decrease the number). The formulas formembers that have a specified solve order are calculated in order from thelowest solve order to the highest. The default is 0.
6. In the text box, define formulas for the member.
You can include Planning formula expressions and Essbase native formulas in themember formula.
The application provides predefined formula expressions that you can use inmember formulas. You can't edit or create your own formula expressions.
Chapter 18Administering Dimensions
18-61
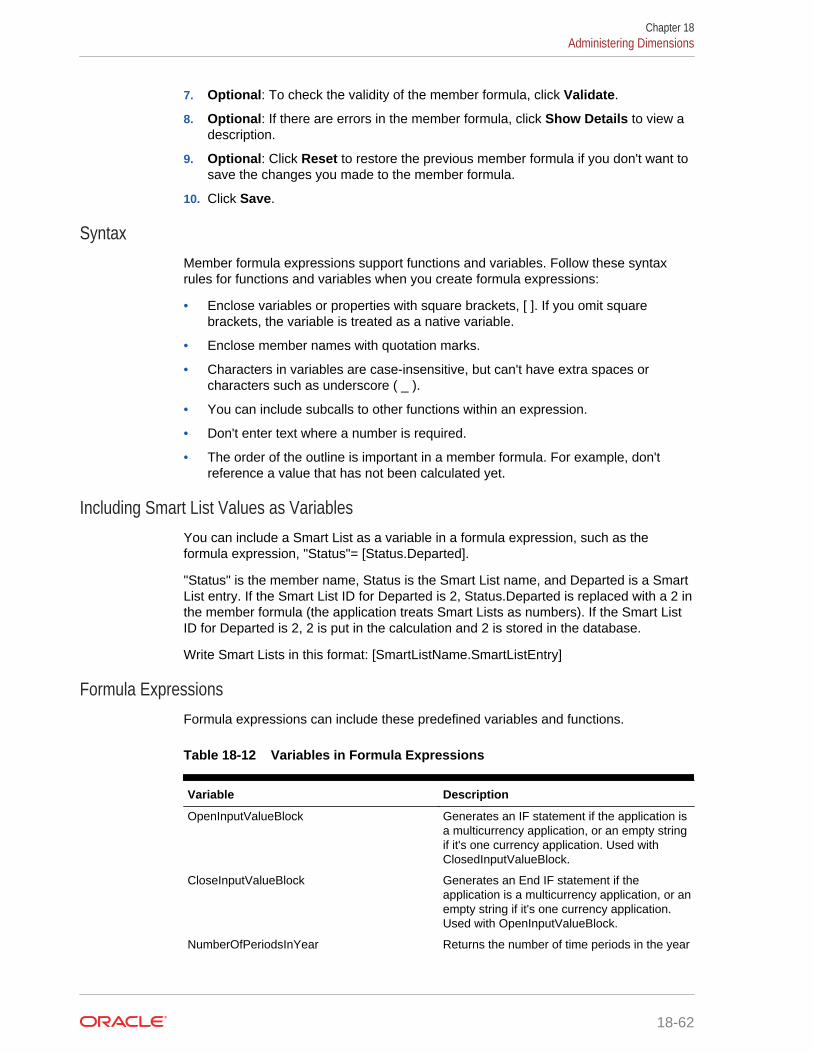
7. Optional: To check the validity of the member formula, click Validate.
8. Optional: If there are errors in the member formula, click Show Details to view adescription.
9. Optional: Click Reset to restore the previous member formula if you don't want tosave the changes you made to the member formula.
10. Click Save.
SyntaxMember formula expressions support functions and variables. Follow these syntaxrules for functions and variables when you create formula expressions:
• Enclose variables or properties with square brackets, [ ]. If you omit squarebrackets, the variable is treated as a native variable.
• Enclose member names with quotation marks.
• Characters in variables are case-insensitive, but can't have extra spaces orcharacters such as underscore ( _ ).
• You can include subcalls to other functions within an expression.
• Don't enter text where a number is required.
• The order of the outline is important in a member formula. For example, don'treference a value that has not been calculated yet.
Including Smart List Values as VariablesYou can include a Smart List as a variable in a formula expression, such as theformula expression, "Status"= [Status.Departed].
"Status" is the member name, Status is the Smart List name, and Departed is a SmartList entry. If the Smart List ID for Departed is 2, Status.Departed is replaced with a 2 inthe member formula (the application treats Smart Lists as numbers). If the Smart ListID for Departed is 2, 2 is put in the calculation and 2 is stored in the database.
Write Smart Lists in this format: [SmartListName.SmartListEntry]
Formula ExpressionsFormula expressions can include these predefined variables and functions.
Table 18-12 Variables in Formula Expressions
Variable Description
OpenInputValueBlock Generates an IF statement if the application isa multicurrency application, or an empty stringif it's one currency application. Used withClosedInputValueBlock.
CloseInputValueBlock Generates an End IF statement if theapplication is a multicurrency application, or anempty string if it's one currency application.Used with OpenInputValueBlock.
NumberOfPeriodsInYear Returns the number of time periods in the year
Chapter 18Administering Dimensions
18-62
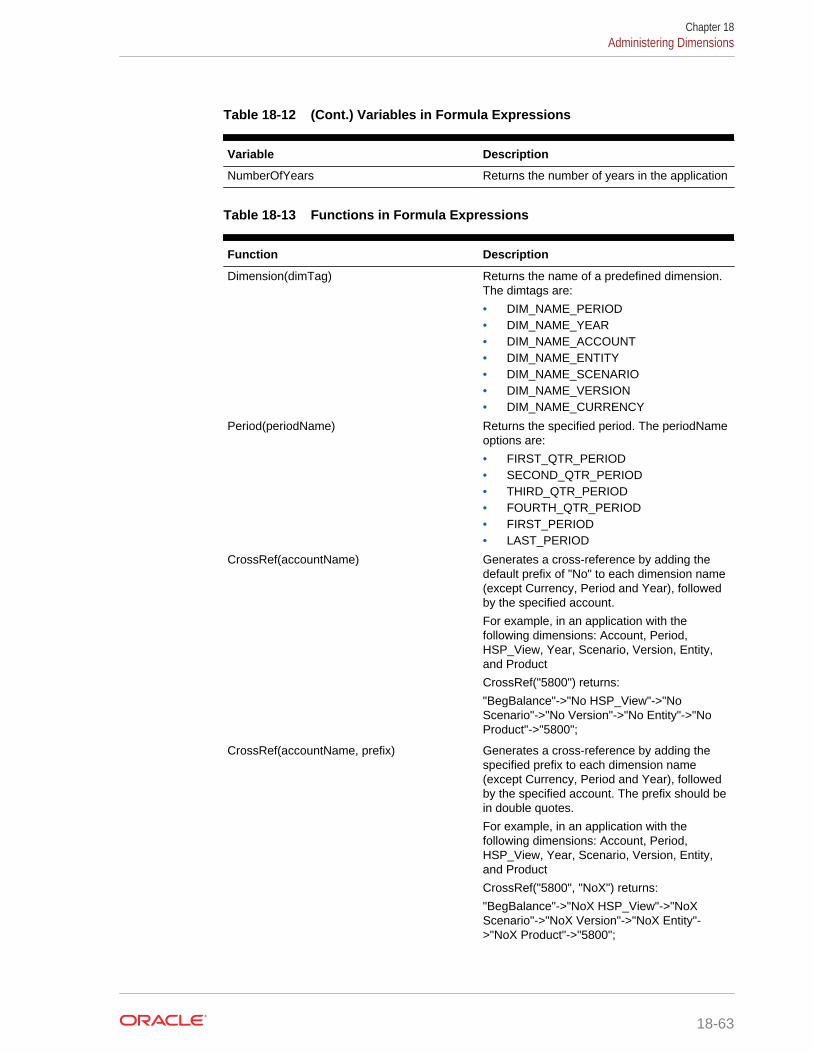
Table 18-12 (Cont.) Variables in Formula Expressions
Variable Description
NumberOfYears Returns the number of years in the application
Table 18-13 Functions in Formula Expressions
Function Description
Dimension(dimTag) Returns the name of a predefined dimension.The dimtags are:
• DIM_NAME_PERIOD• DIM_NAME_YEAR• DIM_NAME_ACCOUNT• DIM_NAME_ENTITY• DIM_NAME_SCENARIO• DIM_NAME_VERSION• DIM_NAME_CURRENCY
Period(periodName) Returns the specified period. The periodNameoptions are:
• FIRST_QTR_PERIOD• SECOND_QTR_PERIOD• THIRD_QTR_PERIOD• FOURTH_QTR_PERIOD• FIRST_PERIOD• LAST_PERIOD
CrossRef(accountName) Generates a cross-reference by adding thedefault prefix of "No" to each dimension name(except Currency, Period and Year), followedby the specified account.
For example, in an application with thefollowing dimensions: Account, Period,HSP_View, Year, Scenario, Version, Entity,and Product
CrossRef("5800") returns:
"BegBalance"->"No HSP_View"->"NoScenario"->"No Version"->"No Entity"->"NoProduct"->"5800";
CrossRef(accountName, prefix) Generates a cross-reference by adding thespecified prefix to each dimension name(except Currency, Period and Year), followedby the specified account. The prefix should bein double quotes.
For example, in an application with thefollowing dimensions: Account, Period,HSP_View, Year, Scenario, Version, Entity,and Product
CrossRef("5800", "NoX") returns:
"BegBalance"->"NoX HSP_View"->"NoXScenario"->"NoX Version"->"NoX Entity"->"NoX Product"->"5800";
Chapter 18Administering Dimensions
18-63
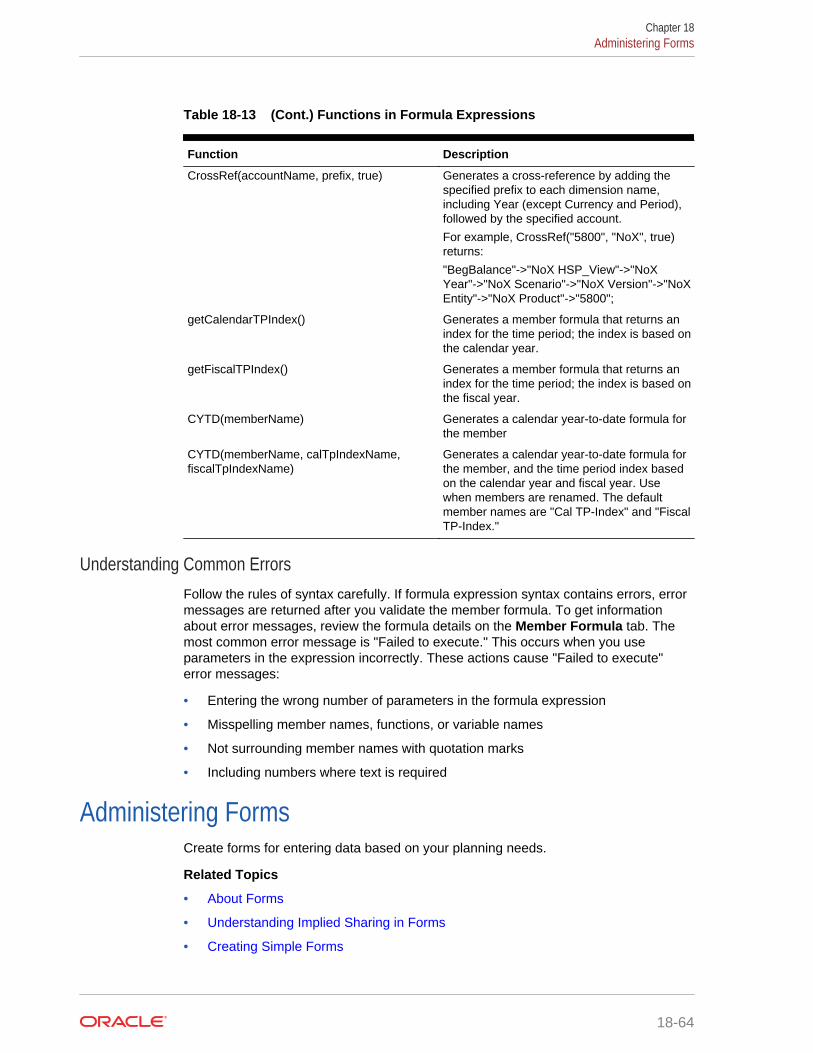
Table 18-13 (Cont.) Functions in Formula Expressions
Function Description
CrossRef(accountName, prefix, true) Generates a cross-reference by adding thespecified prefix to each dimension name,including Year (except Currency and Period),followed by the specified account.
For example, CrossRef("5800", "NoX", true)returns:
"BegBalance"->"NoX HSP_View"->"NoXYear"->"NoX Scenario"->"NoX Version"->"NoXEntity"->"NoX Product"->"5800";
getCalendarTPIndex() Generates a member formula that returns anindex for the time period; the index is based onthe calendar year.
getFiscalTPIndex() Generates a member formula that returns anindex for the time period; the index is based onthe fiscal year.
CYTD(memberName) Generates a calendar year-to-date formula forthe member
CYTD(memberName, calTpIndexName,fiscalTpIndexName)
Generates a calendar year-to-date formula forthe member, and the time period index basedon the calendar year and fiscal year. Usewhen members are renamed. The defaultmember names are "Cal TP-Index" and "FiscalTP-Index."
Understanding Common ErrorsFollow the rules of syntax carefully. If formula expression syntax contains errors, errormessages are returned after you validate the member formula. To get informationabout error messages, review the formula details on the Member Formula tab. Themost common error message is "Failed to execute." This occurs when you useparameters in the expression incorrectly. These actions cause "Failed to execute"error messages:
• Entering the wrong number of parameters in the formula expression
• Misspelling member names, functions, or variable names
• Not surrounding member names with quotation marks
• Including numbers where text is required
Administering FormsCreate forms for entering data based on your planning needs.
Related Topics
• About Forms
• Understanding Implied Sharing in Forms
• Creating Simple Forms
Chapter 18Administering Forms
18-64
• Creating Composite Forms
• Designing Specific Types of Forms
• Working with Forms and Form Components
• Managing Forms and Folders
About FormsForms are grids for entering data. You can create simple forms or composite forms tomeet your needs. Because composite forms consist of simple forms, you must createsimple forms before creating composite forms.
Form Components
Point of View
Select point of view (POV) dimensions such as year, scenario, and version to definethe context for pages, rows, and columns. For example, if Scenario is Budget, all datadisplayed and entered in pages, rows, and columns is written to the Budget scenariodimension member. Each POV dimension is set to one member, which planners can'tchange.
To simplify a form’s POV, or better tailor it to the needs and roles of planners, youspecify only relevant members or define user variables. See Defining Simple FormPage and Point of View and Managing User Variables.
Page Axis
Use the page axis to specify member combinations that may span dimensions so thatusers can work with data in smaller, logical views. Each page axis item can havemembers selected from different dimensions. Users see only members they canaccess.
You can specify multiple page drop-down lists, and select members using relationshipfunctions or attributes. Switch between member sets by selecting them from the pageaxis.
You display member names or aliases on the page axis. You can specify the numberof members in a page dimension that enables a search drop-down list on the dataentry page, useful if dimensions contain many members. See Defining Simple FormPage and Point of View.
Rows and Columns
Rows and columns define the grid into which planners enter data. For example, youcan assign Unit Sales to the row axis and January to the column axis. When plannersaccess forms, they can enter data into the cell where the Unit Sales row intersects withthe January column.
By default, forms have one set of rows and columns. You can add rows and columnsto create asymmetrical combinations of members. See Creating Asymmetric Rowsand Columns.
Chapter 18Administering Forms
18-65
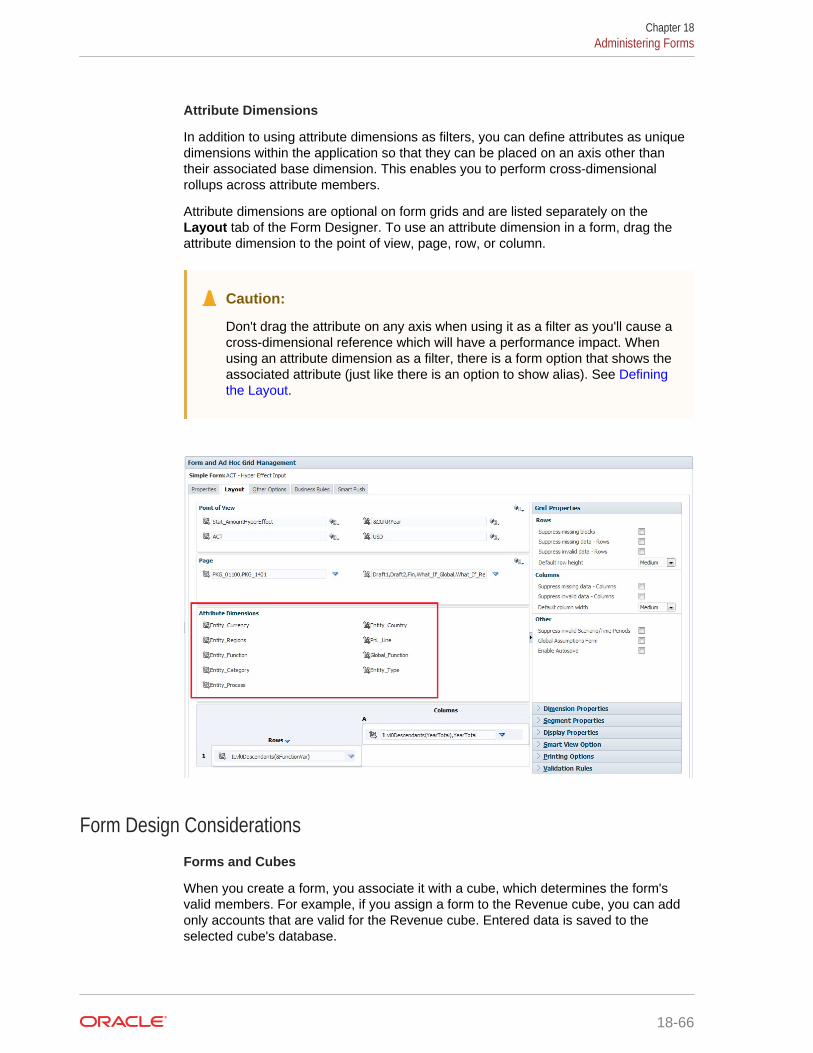
Attribute Dimensions
In addition to using attribute dimensions as filters, you can define attributes as uniquedimensions within the application so that they can be placed on an axis other thantheir associated base dimension. This enables you to perform cross-dimensionalrollups across attribute members.
Attribute dimensions are optional on form grids and are listed separately on theLayout tab of the Form Designer. To use an attribute dimension in a form, drag theattribute dimension to the point of view, page, row, or column.
Caution:
Don't drag the attribute on any axis when using it as a filter as you'll cause across-dimensional reference which will have a performance impact. Whenusing an attribute dimension as a filter, there is a form option that shows theassociated attribute (just like there is an option to show alias). See Definingthe Layout.
Form Design Considerations
Forms and Cubes
When you create a form, you associate it with a cube, which determines the form'svalid members. For example, if you assign a form to the Revenue cube, you can addonly accounts that are valid for the Revenue cube. Entered data is saved to theselected cube's database.
Chapter 18Administering Forms
18-66
Note:
• You can't change a form’s cube after assigning it.
• You can edit form accounts only if their source cube matches the form'scube.
• If you add an account to a form associated with a cube other than theaccount’s source cube, the account is read-only on that form.
Forms and Permissions
Assign permissions to a form to determine which planners can modify its design (forexample, layout and instructions) and input data. Users can edit forms only if theyhave permission to one secured dimension’s member. For example, if planners haveread-only permission to the Europe entity, the rows and columns that include theEurope entity are read-only. Planners can change data only for members to which theyhave write permission.
Forms and Currencies
For a single-currency application, all entities use the currency selected when theapplication was created. For a Standard multicurrency application, the selectedCurrency member on forms determines the currency in which values display. If theCurrency member is Local, no currency conversion occurs, and planners can enterdata in their native currency. If a currency member other than Local is selected, valuesare converted to the currency selected for that row or column, and the form is read-only. You can enter data in rows or columns that have Currency or Local as theselected member. See Designing Forms for Multiple Currencies.
Forms and Versions
For bottom-up versions, rows and columns with level 0 members allow data entry.Rows or columns set to a parent member are read-only. The point of view must alsobe set to the level 0 member to allow data entry on a bottom-up version. Targetversions allow data entry in parent and children members.
Filtering Form Members by Attributes
You can select members by using attributes. For example, on the Entity dimension youcan select members by a specific Region such as South. The resulting grid will onlycontain members that have the South attribute (for example, TX, NM, and so on).Values can be entered and saved into rows and columns filtered by attributes.
Forms and Shared Members
Because you can't select shared members individually, select them using arelationship function. For example, select an alternate functional rollup to include allmembers under that rollup. Planners can enter values in rows or columns that displayshared members, and data is saved to the base members in the database.
Forms and Calculations
To optimize calculations, select row members using relationships (such asDescendants or Children) instead of selecting individual children. For example,
Chapter 18Administering Forms
18-67
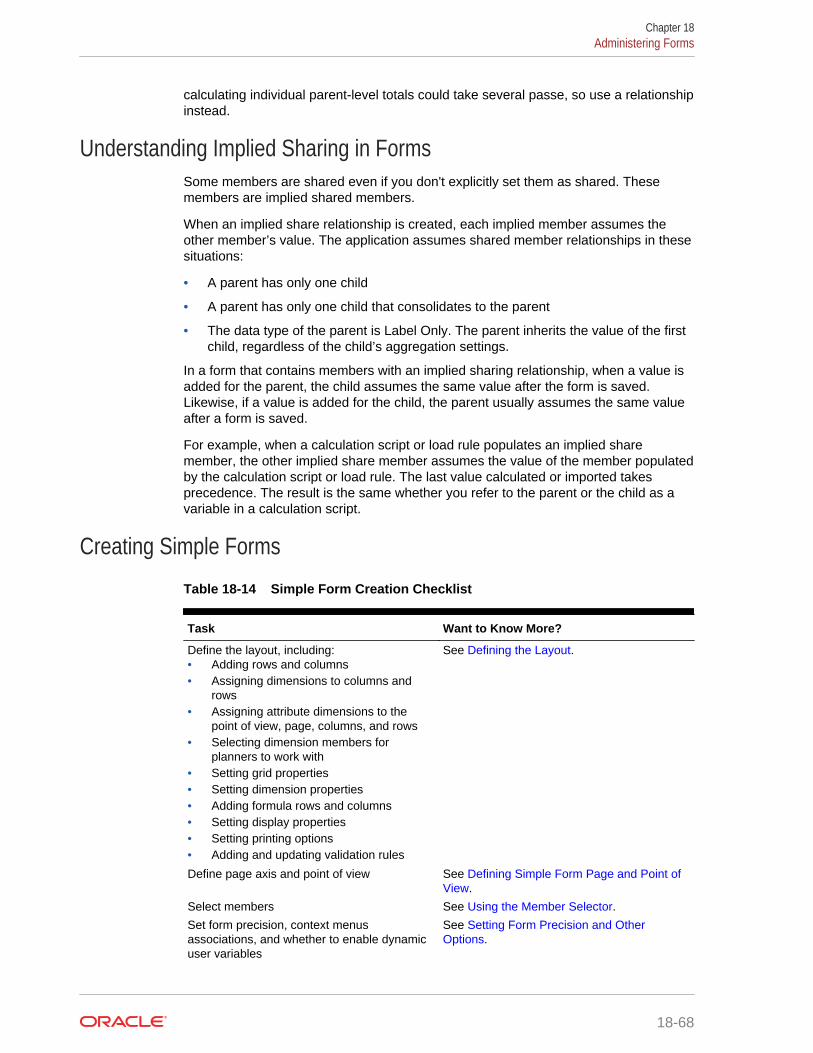
calculating individual parent-level totals could take several passe, so use a relationshipinstead.
Understanding Implied Sharing in FormsSome members are shared even if you don't explicitly set them as shared. Thesemembers are implied shared members.
When an implied share relationship is created, each implied member assumes theother member’s value. The application assumes shared member relationships in thesesituations:
• A parent has only one child
• A parent has only one child that consolidates to the parent
• The data type of the parent is Label Only. The parent inherits the value of the firstchild, regardless of the child’s aggregation settings.
In a form that contains members with an implied sharing relationship, when a value isadded for the parent, the child assumes the same value after the form is saved.Likewise, if a value is added for the child, the parent usually assumes the same valueafter a form is saved.
For example, when a calculation script or load rule populates an implied sharemember, the other implied share member assumes the value of the member populatedby the calculation script or load rule. The last value calculated or imported takesprecedence. The result is the same whether you refer to the parent or the child as avariable in a calculation script.
Creating Simple Forms
Table 18-14 Simple Form Creation Checklist
Task Want to Know More?
Define the layout, including:• Adding rows and columns• Assigning dimensions to columns and
rows• Assigning attribute dimensions to the
point of view, page, columns, and rows• Selecting dimension members for
planners to work with• Setting grid properties• Setting dimension properties• Adding formula rows and columns• Setting display properties• Setting printing options• Adding and updating validation rules
See Defining the Layout.
Define page axis and point of view See Defining Simple Form Page and Point ofView.
Select members See Using the Member Selector.
Set form precision, context menusassociations, and whether to enable dynamicuser variables
See Setting Form Precision and OtherOptions.
Chapter 18Administering Forms
18-68
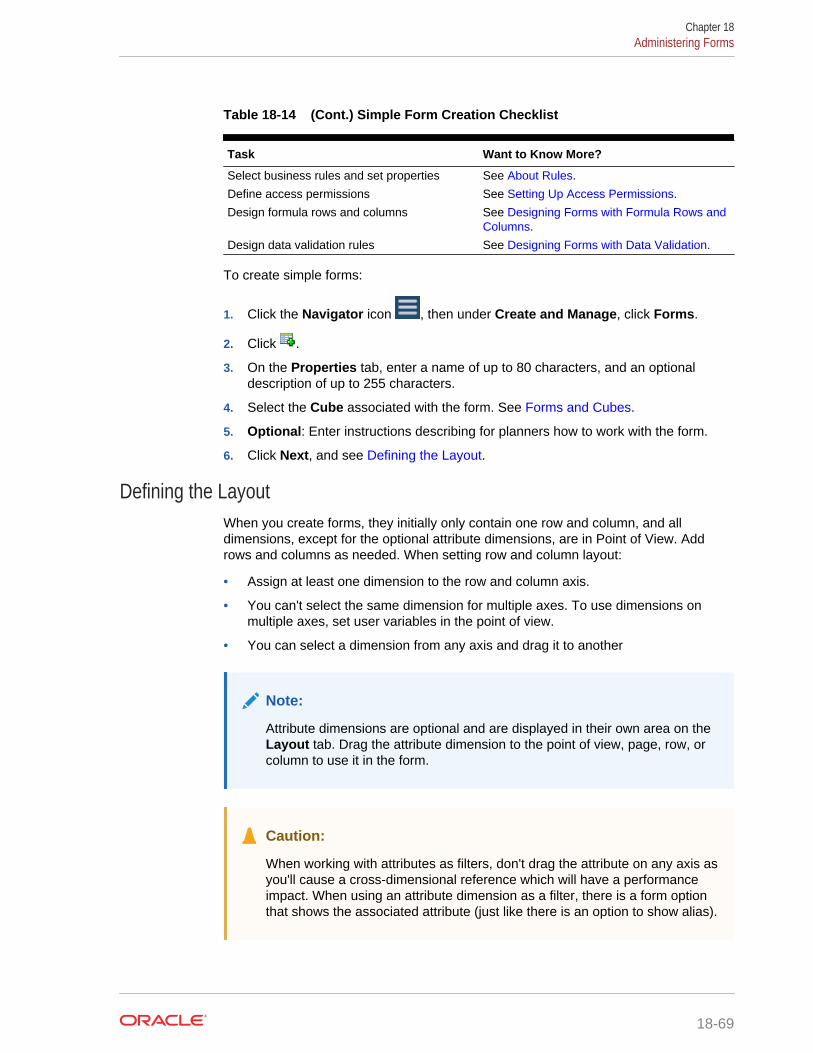
Table 18-14 (Cont.) Simple Form Creation Checklist
Task Want to Know More?
Select business rules and set properties See About Rules.
Define access permissions See Setting Up Access Permissions.
Design formula rows and columns See Designing Forms with Formula Rows andColumns.
Design data validation rules See Designing Forms with Data Validation.
To create simple forms:
1. Click the Navigator icon , then under Create and Manage, click Forms.
2. Click .
3. On the Properties tab, enter a name of up to 80 characters, and an optionaldescription of up to 255 characters.
4. Select the Cube associated with the form. See Forms and Cubes.
5. Optional: Enter instructions describing for planners how to work with the form.
6. Click Next, and see Defining the Layout.
Defining the LayoutWhen you create forms, they initially only contain one row and column, and alldimensions, except for the optional attribute dimensions, are in Point of View. Addrows and columns as needed. When setting row and column layout:
• Assign at least one dimension to the row and column axis.
• You can't select the same dimension for multiple axes. To use dimensions onmultiple axes, set user variables in the point of view.
• You can select a dimension from any axis and drag it to another
Note:
Attribute dimensions are optional and are displayed in their own area on theLayout tab. Drag the attribute dimension to the point of view, page, row, orcolumn to use it in the form.
Caution:
When working with attributes as filters, don't drag the attribute on any axis asyou'll cause a cross-dimensional reference which will have a performanceimpact. When using an attribute dimension as a filter, there is a form optionthat shows the associated attribute (just like there is an option to show alias).
Chapter 18Administering Forms
18-69
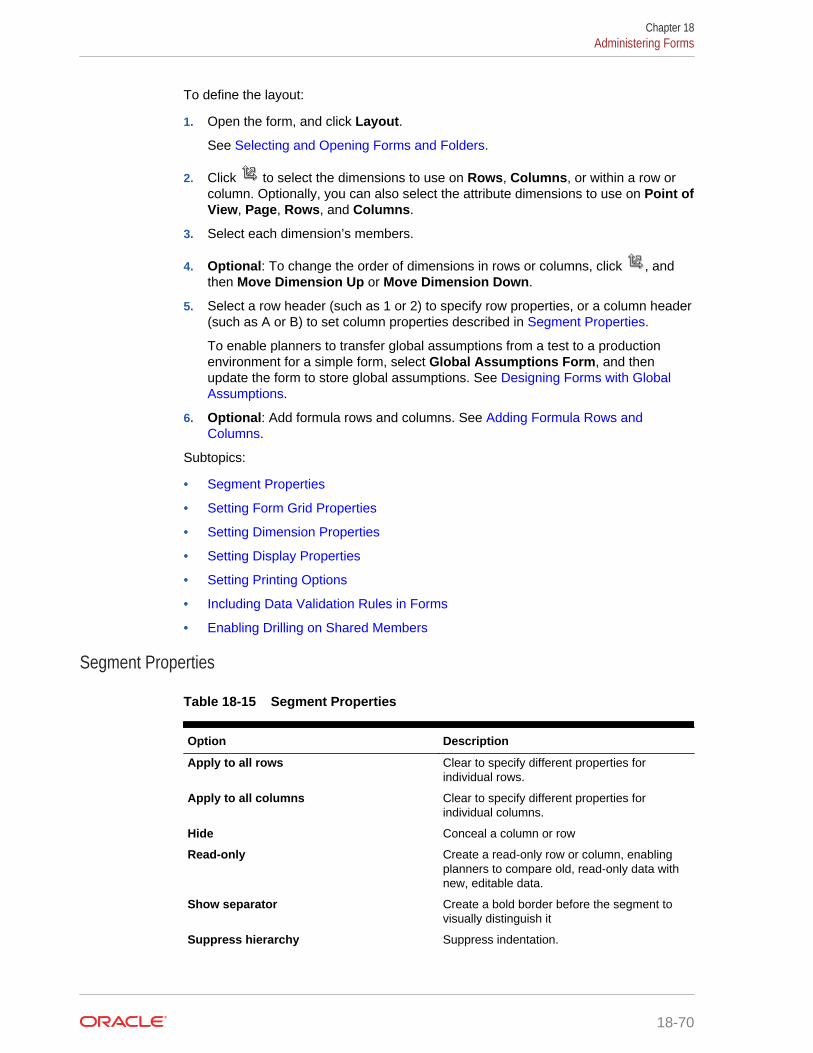
To define the layout:
1. Open the form, and click Layout.
See Selecting and Opening Forms and Folders.
2. Click to select the dimensions to use on Rows, Columns, or within a row orcolumn. Optionally, you can also select the attribute dimensions to use on Point ofView, Page, Rows, and Columns.
3. Select each dimension’s members.
4. Optional: To change the order of dimensions in rows or columns, click , andthen Move Dimension Up or Move Dimension Down.
5. Select a row header (such as 1 or 2) to specify row properties, or a column header(such as A or B) to set column properties described in Segment Properties.
To enable planners to transfer global assumptions from a test to a productionenvironment for a simple form, select Global Assumptions Form, and thenupdate the form to store global assumptions. See Designing Forms with GlobalAssumptions.
6. Optional: Add formula rows and columns. See Adding Formula Rows andColumns.
Subtopics:
• Segment Properties
• Setting Form Grid Properties
• Setting Dimension Properties
• Setting Display Properties
• Setting Printing Options
• Including Data Validation Rules in Forms
• Enabling Drilling on Shared Members
Segment Properties
Table 18-15 Segment Properties
Option Description
Apply to all rows Clear to specify different properties forindividual rows.
Apply to all columns Clear to specify different properties forindividual columns.
Hide Conceal a column or row
Read-only Create a read-only row or column, enablingplanners to compare old, read-only data withnew, editable data.
Show separator Create a bold border before the segment tovisually distinguish it
Suppress hierarchy Suppress indentation.
Chapter 18Administering Forms
18-70
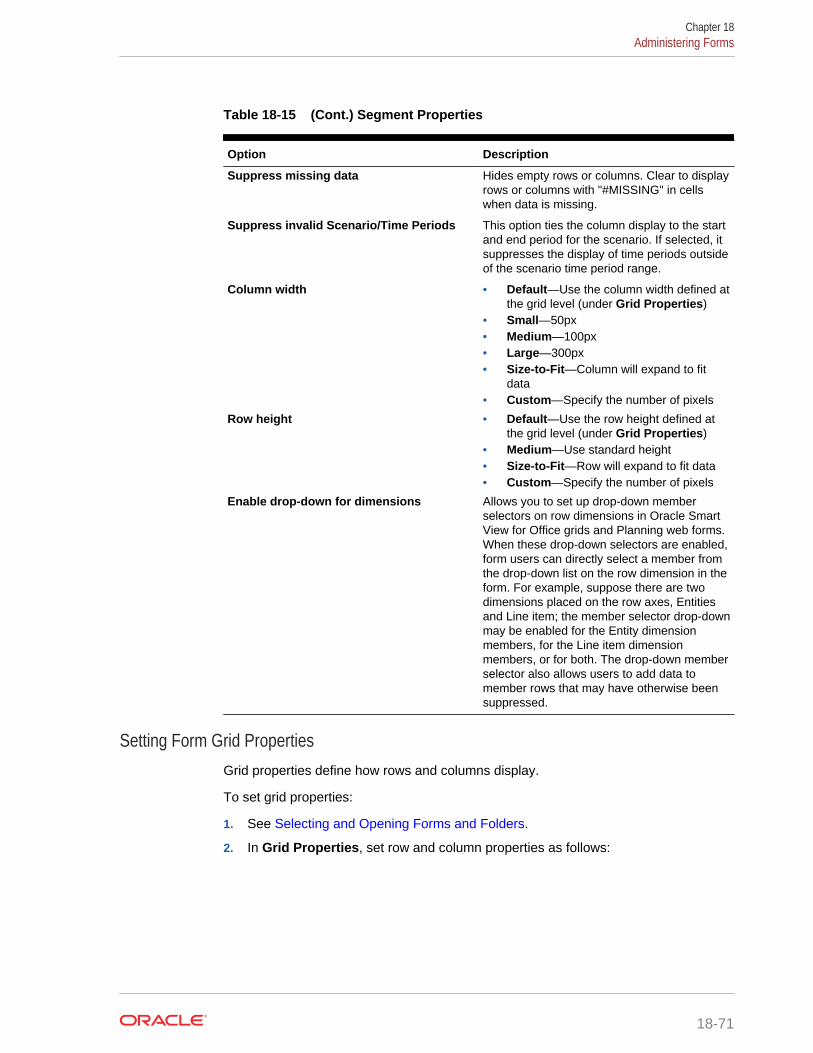
Table 18-15 (Cont.) Segment Properties
Option Description
Suppress missing data Hides empty rows or columns. Clear to displayrows or columns with "#MISSING" in cellswhen data is missing.
Suppress invalid Scenario/Time Periods This option ties the column display to the startand end period for the scenario. If selected, itsuppresses the display of time periods outsideof the scenario time period range.
Column width • Default—Use the column width defined atthe grid level (under Grid Properties)
• Small—50px• Medium—100px• Large—300px• Size-to-Fit—Column will expand to fit
data• Custom—Specify the number of pixels
Row height • Default—Use the row height defined atthe grid level (under Grid Properties)
• Medium—Use standard height• Size-to-Fit—Row will expand to fit data• Custom—Specify the number of pixels
Enable drop-down for dimensions Allows you to set up drop-down memberselectors on row dimensions in Oracle SmartView for Office grids and Planning web forms.When these drop-down selectors are enabled,form users can directly select a member fromthe drop-down list on the row dimension in theform. For example, suppose there are twodimensions placed on the row axes, Entitiesand Line item; the member selector drop-downmay be enabled for the Entity dimensionmembers, for the Line item dimensionmembers, or for both. The drop-down memberselector also allows users to add data tomember rows that may have otherwise beensuppressed.
Setting Form Grid PropertiesGrid properties define how rows and columns display.
To set grid properties:
1. See Selecting and Opening Forms and Folders.
2. In Grid Properties, set row and column properties as follows:
Chapter 18Administering Forms
18-71
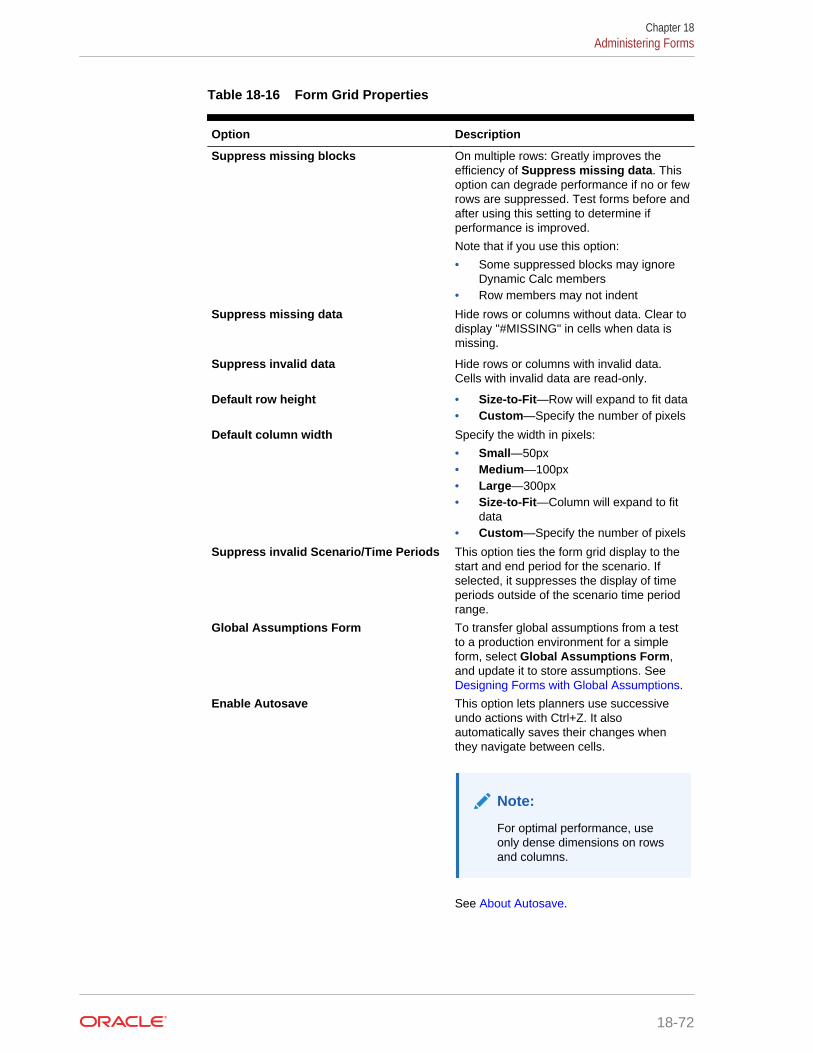
Table 18-16 Form Grid Properties
Option Description
Suppress missing blocks On multiple rows: Greatly improves theefficiency of Suppress missing data. Thisoption can degrade performance if no or fewrows are suppressed. Test forms before andafter using this setting to determine ifperformance is improved.
Note that if you use this option:
• Some suppressed blocks may ignoreDynamic Calc members
• Row members may not indent
Suppress missing data Hide rows or columns without data. Clear todisplay "#MISSING" in cells when data ismissing.
Suppress invalid data Hide rows or columns with invalid data.Cells with invalid data are read-only.
Default row height • Size-to-Fit—Row will expand to fit data• Custom—Specify the number of pixels
Default column width Specify the width in pixels:
• Small—50px• Medium—100px• Large—300px• Size-to-Fit—Column will expand to fit
data• Custom—Specify the number of pixels
Suppress invalid Scenario/Time Periods This option ties the form grid display to thestart and end period for the scenario. Ifselected, it suppresses the display of timeperiods outside of the scenario time periodrange.
Global Assumptions Form To transfer global assumptions from a testto a production environment for a simpleform, select Global Assumptions Form,and update it to store assumptions. See Designing Forms with Global Assumptions.
Enable Autosave This option lets planners use successiveundo actions with Ctrl+Z. It alsoautomatically saves their changes whenthey navigate between cells.
Note:
For optimal performance, useonly dense dimensions on rowsand columns.
See About Autosave.
Chapter 18Administering Forms
18-72
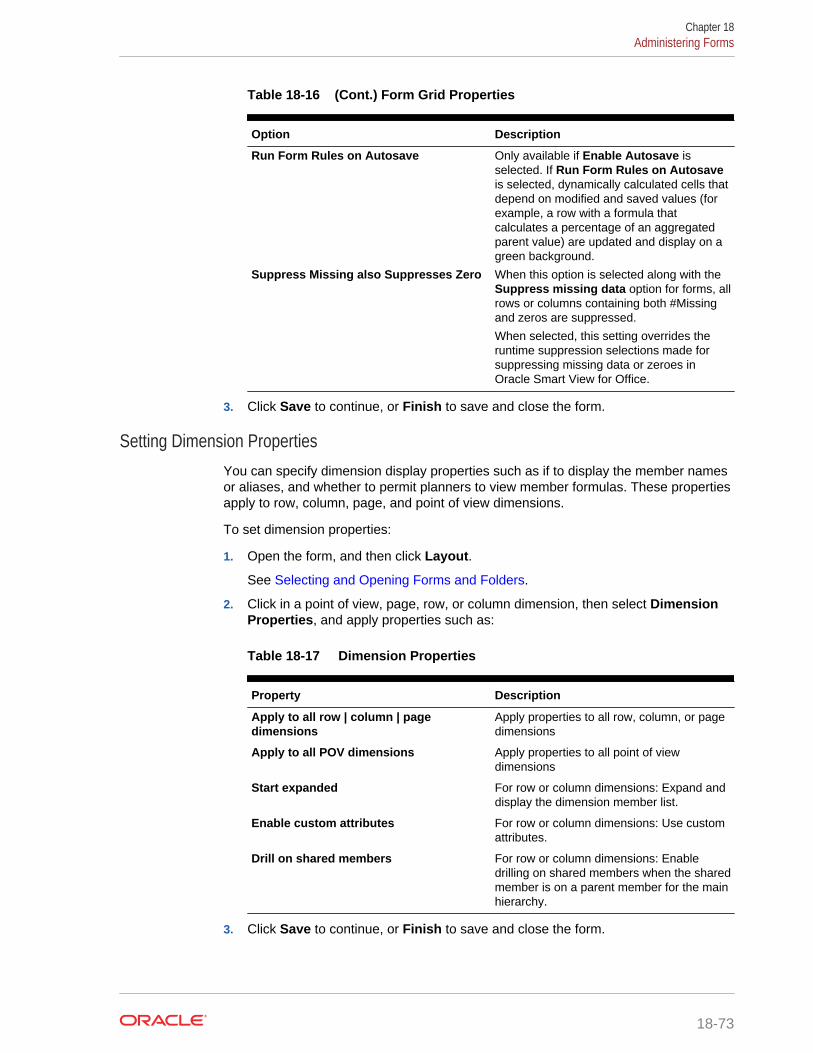
Table 18-16 (Cont.) Form Grid Properties
Option Description
Run Form Rules on Autosave Only available if Enable Autosave isselected. If Run Form Rules on Autosaveis selected, dynamically calculated cells thatdepend on modified and saved values (forexample, a row with a formula thatcalculates a percentage of an aggregatedparent value) are updated and display on agreen background.
Suppress Missing also Suppresses Zero When this option is selected along with theSuppress missing data option for forms, allrows or columns containing both #Missingand zeros are suppressed.
When selected, this setting overrides theruntime suppression selections made forsuppressing missing data or zeroes inOracle Smart View for Office.
3. Click Save to continue, or Finish to save and close the form.
Setting Dimension PropertiesYou can specify dimension display properties such as if to display the member namesor aliases, and whether to permit planners to view member formulas. These propertiesapply to row, column, page, and point of view dimensions.
To set dimension properties:
1. Open the form, and then click Layout.
See Selecting and Opening Forms and Folders.
2. Click in a point of view, page, row, or column dimension, then select DimensionProperties, and apply properties such as:
Table 18-17 Dimension Properties
Property Description
Apply to all row | column | pagedimensions
Apply properties to all row, column, or pagedimensions
Apply to all POV dimensions Apply properties to all point of viewdimensions
Start expanded For row or column dimensions: Expand anddisplay the dimension member list.
Enable custom attributes For row or column dimensions: Use customattributes.
Drill on shared members For row or column dimensions: Enabledrilling on shared members when the sharedmember is on a parent member for the mainhierarchy.
3. Click Save to continue, or Finish to save and close the form.
Chapter 18Administering Forms
18-73
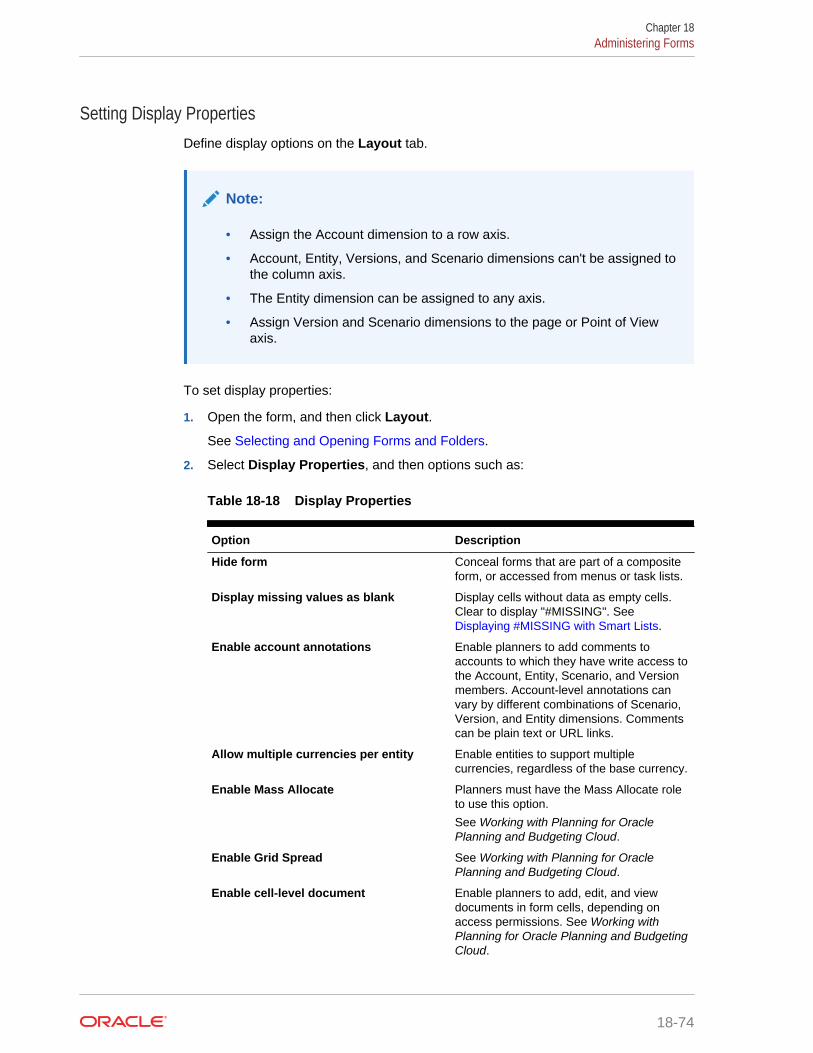
Setting Display PropertiesDefine display options on the Layout tab.
Note:
• Assign the Account dimension to a row axis.
• Account, Entity, Versions, and Scenario dimensions can't be assigned tothe column axis.
• The Entity dimension can be assigned to any axis.
• Assign Version and Scenario dimensions to the page or Point of Viewaxis.
To set display properties:
1. Open the form, and then click Layout.
See Selecting and Opening Forms and Folders.
2. Select Display Properties, and then options such as:
Table 18-18 Display Properties
Option Description
Hide form Conceal forms that are part of a compositeform, or accessed from menus or task lists.
Display missing values as blank Display cells without data as empty cells.Clear to display "#MISSING". See Displaying #MISSING with Smart Lists.
Enable account annotations Enable planners to add comments toaccounts to which they have write access tothe Account, Entity, Scenario, and Versionmembers. Account-level annotations canvary by different combinations of Scenario,Version, and Entity dimensions. Commentscan be plain text or URL links.
Allow multiple currencies per entity Enable entities to support multiplecurrencies, regardless of the base currency.
Enable Mass Allocate Planners must have the Mass Allocate roleto use this option.
See Working with Planning for OraclePlanning and Budgeting Cloud.
Enable Grid Spread See Working with Planning for OraclePlanning and Budgeting Cloud.
Enable cell-level document Enable planners to add, edit, and viewdocuments in form cells, depending onaccess permissions. See Working withPlanning for Oracle Planning and BudgetingCloud.
Chapter 18Administering Forms
18-74
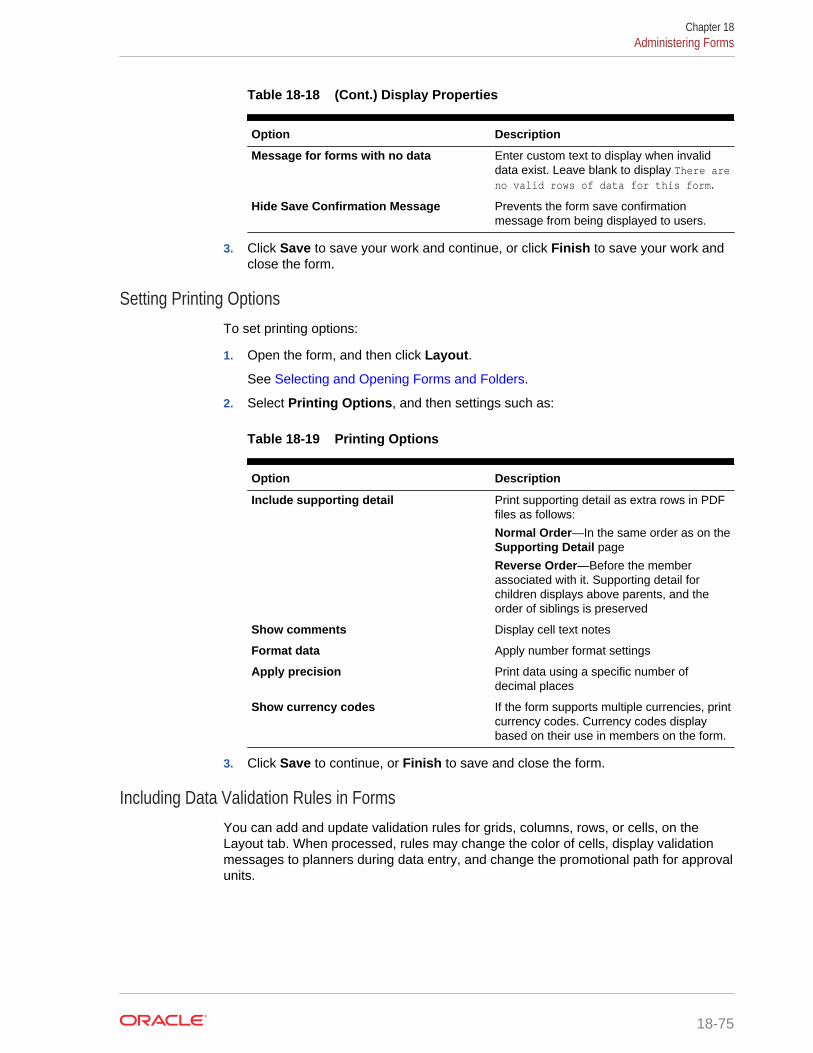
Table 18-18 (Cont.) Display Properties
Option Description
Message for forms with no data Enter custom text to display when invaliddata exist. Leave blank to display There areno valid rows of data for this form.
Hide Save Confirmation Message Prevents the form save confirmationmessage from being displayed to users.
3. Click Save to save your work and continue, or click Finish to save your work andclose the form.
Setting Printing OptionsTo set printing options:
1. Open the form, and then click Layout.
See Selecting and Opening Forms and Folders.
2. Select Printing Options, and then settings such as:
Table 18-19 Printing Options
Option Description
Include supporting detail Print supporting detail as extra rows in PDFfiles as follows:
Normal Order—In the same order as on theSupporting Detail page
Reverse Order—Before the memberassociated with it. Supporting detail forchildren displays above parents, and theorder of siblings is preserved
Show comments Display cell text notes
Format data Apply number format settings
Apply precision Print data using a specific number ofdecimal places
Show currency codes If the form supports multiple currencies, printcurrency codes. Currency codes displaybased on their use in members on the form.
3. Click Save to continue, or Finish to save and close the form.
Including Data Validation Rules in FormsYou can add and update validation rules for grids, columns, rows, or cells, on theLayout tab. When processed, rules may change the color of cells, display validationmessages to planners during data entry, and change the promotional path for approvalunits.
Chapter 18Administering Forms
18-75
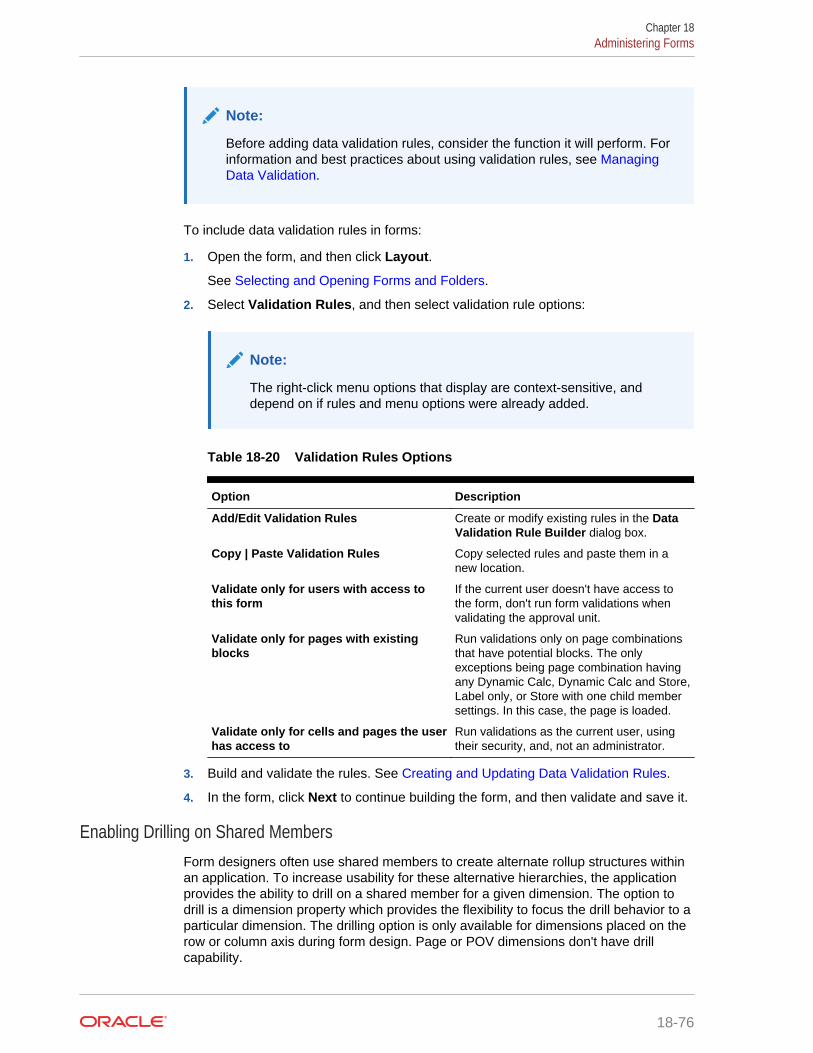
Note:
Before adding data validation rules, consider the function it will perform. Forinformation and best practices about using validation rules, see ManagingData Validation.
To include data validation rules in forms:
1. Open the form, and then click Layout.
See Selecting and Opening Forms and Folders.
2. Select Validation Rules, and then select validation rule options:
Note:
The right-click menu options that display are context-sensitive, anddepend on if rules and menu options were already added.
Table 18-20 Validation Rules Options
Option Description
Add/Edit Validation Rules Create or modify existing rules in the DataValidation Rule Builder dialog box.
Copy | Paste Validation Rules Copy selected rules and paste them in anew location.
Validate only for users with access tothis form
If the current user doesn't have access tothe form, don't run form validations whenvalidating the approval unit.
Validate only for pages with existingblocks
Run validations only on page combinationsthat have potential blocks. The onlyexceptions being page combination havingany Dynamic Calc, Dynamic Calc and Store,Label only, or Store with one child membersettings. In this case, the page is loaded.
Validate only for cells and pages the userhas access to
Run validations as the current user, usingtheir security, and, not an administrator.
3. Build and validate the rules. See Creating and Updating Data Validation Rules.
4. In the form, click Next to continue building the form, and then validate and save it.
Enabling Drilling on Shared MembersForm designers often use shared members to create alternate rollup structures withinan application. To increase usability for these alternative hierarchies, the applicationprovides the ability to drill on a shared member for a given dimension. The option todrill is a dimension property which provides the flexibility to focus the drill behavior to aparticular dimension. The drilling option is only available for dimensions placed on therow or column axis during form design. Page or POV dimensions don't have drillcapability.
Chapter 18Administering Forms
18-76
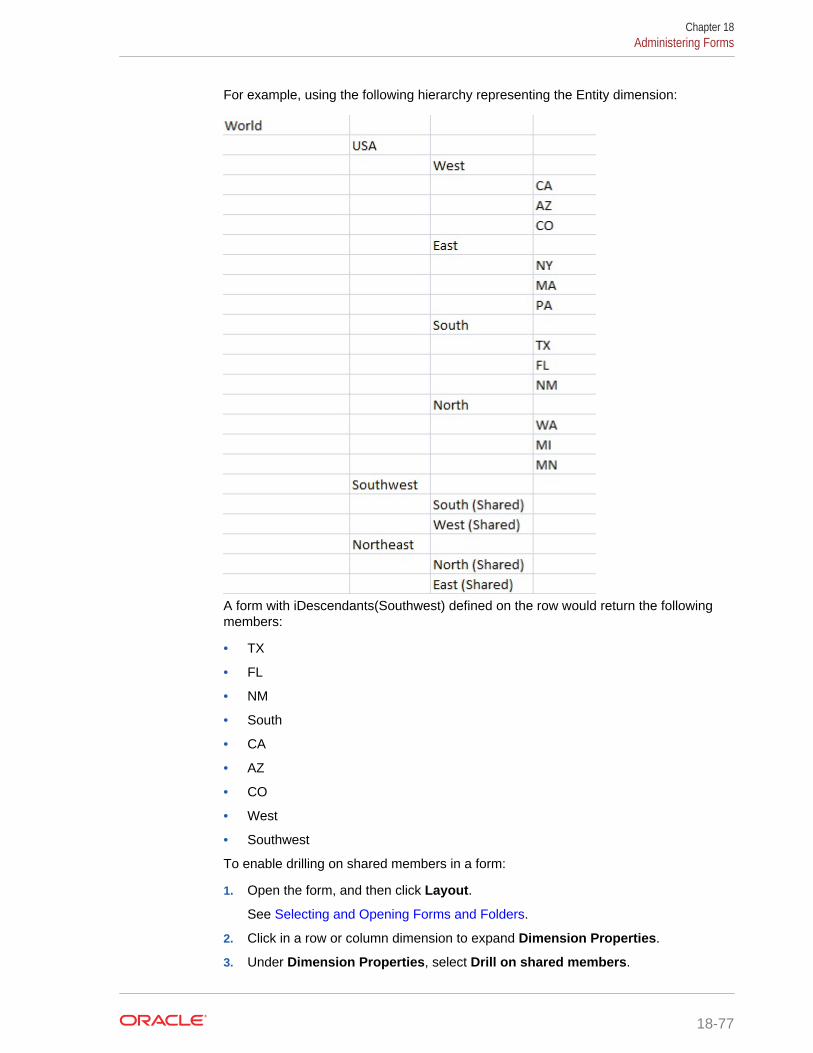
For example, using the following hierarchy representing the Entity dimension:
A form with iDescendants(Southwest) defined on the row would return the followingmembers:
• TX
• FL
• NM
• South
• CA
• AZ
• CO
• West
• Southwest
To enable drilling on shared members in a form:
1. Open the form, and then click Layout.
See Selecting and Opening Forms and Folders.
2. Click in a row or column dimension to expand Dimension Properties.
3. Under Dimension Properties, select Drill on shared members.
Chapter 18Administering Forms
18-77
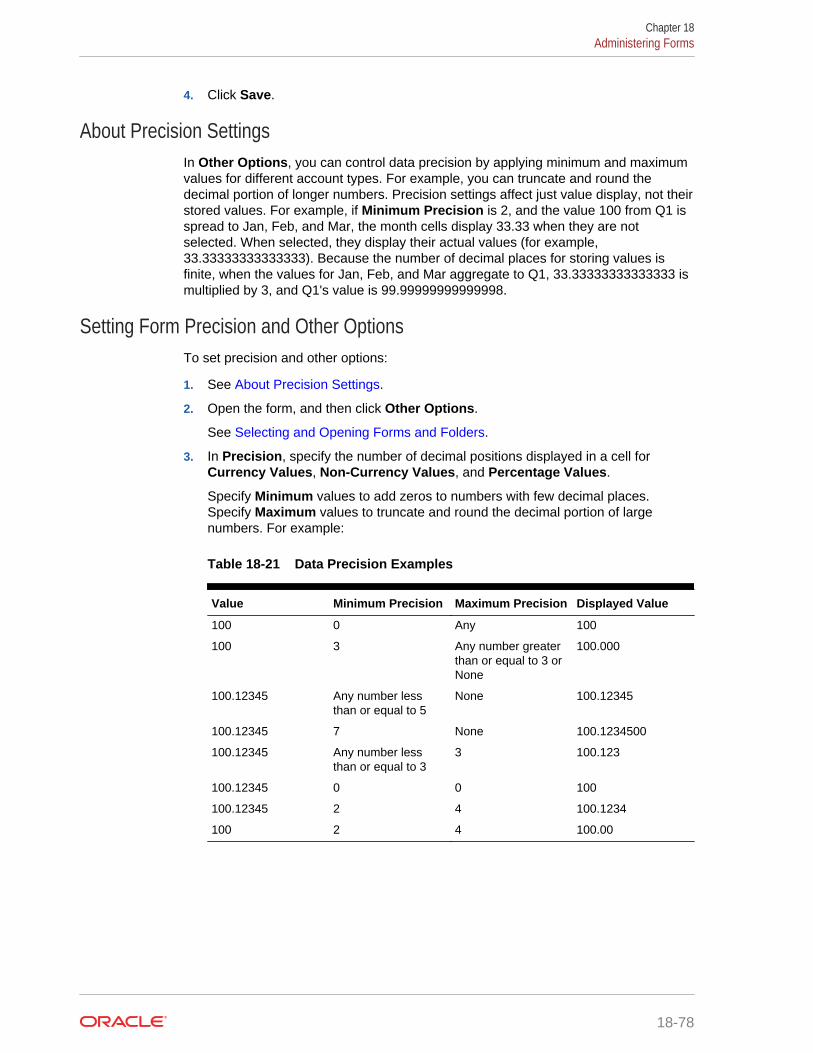
4. Click Save.
About Precision SettingsIn Other Options, you can control data precision by applying minimum and maximumvalues for different account types. For example, you can truncate and round thedecimal portion of longer numbers. Precision settings affect just value display, not theirstored values. For example, if Minimum Precision is 2, and the value 100 from Q1 isspread to Jan, Feb, and Mar, the month cells display 33.33 when they are notselected. When selected, they display their actual values (for example,33.33333333333333). Because the number of decimal places for storing values isfinite, when the values for Jan, Feb, and Mar aggregate to Q1, 33.33333333333333 ismultiplied by 3, and Q1's value is 99.99999999999998.
Setting Form Precision and Other OptionsTo set precision and other options:
1. See About Precision Settings.
2. Open the form, and then click Other Options.
See Selecting and Opening Forms and Folders.
3. In Precision, specify the number of decimal positions displayed in a cell forCurrency Values, Non-Currency Values, and Percentage Values.
Specify Minimum values to add zeros to numbers with few decimal places.Specify Maximum values to truncate and round the decimal portion of largenumbers. For example:
Table 18-21 Data Precision Examples
Value Minimum Precision Maximum Precision Displayed Value
100 0 Any 100
100 3 Any number greaterthan or equal to 3 orNone
100.000
100.12345 Any number lessthan or equal to 5
None 100.12345
100.12345 7 None 100.1234500
100.12345 Any number lessthan or equal to 3
3 100.123
100.12345 0 0 100
100.12345 2 4 100.1234
100 2 4 100.00
Chapter 18Administering Forms
18-78
Note:
Your selections override the precision set for the currency member. Touse the currency member's precision setting instead, select UseCurrency member precision setting.
4. Associate menus with the form by moving them from Available Menus toSelected Menus. For multiple menus, click a "move" options on the right tospecify the display order
5. Select Enable dynamic user variables to allow dynamic user variables in theform (see Working with Planning for Oracle Planning and Budgeting Cloud.)
Creating Asymmetric Rows and ColumnsAsymmetric rows and columns contain different sets of members selected across thesame dimensions. For example:
Row/Column A—Scenario = Actual, Time Period = Q1
Row/Column B—Scenario = Budget, Time Period = Q2, Q3, Q4
To create asymmetric rows or columns:
1. Open the form, and then click Layout.
See Selecting and Opening Forms and Folders.
2. Click to select the dimension to modify.
3. Click to the right of the dimension name, and then modify the membersselected for this dimension. See Using the Member Selector.
4. Click Save to continue, or click Finish to save and close.
Adding Formula Rows and ColumnsYou can define formulas for rows and columns. For example, you can create a formulacolumn to calculate the percentage variance between monthly sales columns. Theformula for a row or column applies to all row or column dimensions. To define orassign existing formulas to forms, select the row or column on the Layout tab, and usethe options under Segment Properties. See Creating Formulas.
Tip:
Add a formula row between two other rows to create a blank row. Blank rowshelp you visually separate subtotals and totals in a form.
To add formula rows and columns:
1. Open the form, and then click Layout.
See Selecting and Opening Forms and Folders.
Chapter 18Administering Forms
18-79
2. On the Layout tab, right-click Rows or Columns.
3. Select Add Formula Row or Add Formula Column.
4. Click the new Formula Label, and then enter the formula name.
5. Click the row or column number and specify Segment Properties, such as
Display formula on form so planners can view the formula when they click .
6. For each dimension in Formula Data Type, select how to display the formularesult, such as a percentage or in date format.
7. Enter the formula, and then click . See Editing Formulas.
8. Click Validate to find and fix any errors.
Defining Simple Form Page and Point of ViewYou can select dimensions and members for the page axis and point of view (POV).POV dimensions and members must be valid for the form cube, and not assigned to apage, column, or row axis. The POV sets the members that define data intersectionsand the form’s context. If you use user variables, variable names displays in the POV.See Managing User Variables
To define page axis and point of view:
1. Open the form, and then click Layout.
See Selecting and Opening Forms and Folders.
2. Click and then drag that dimension to Page .
3. Click for each page axis dimension and select members. See Using theMember Selector.
Note:
To shorten the number of members displayed in the member list so thatthe Search box can be easily seen, from the Home page, click
Navigator , and then under Setup, click System Settings andDefaults. Click Current Application Defaults, then Display Options,and then enter a lower value for Set the number of items on the Pagedrop-down.
4. Repeat Steps 2 and 3 as needed. Assign multiple dimensions to the page axis toenable planners to change dimensionality while entering data. They can useDisplay Options to use the most recent selection.
5. Specify Dimension Properties. See Editing Dimension Properties in theSimplified Dimension Editor.
6. Click and drag a dimension to Point of View to add them, or members, to theform’s point of view .
7. Specify Dimension Properties. See Editing Dimension Properties in theSimplified Dimension Editor.
Chapter 18Administering Forms
18-80
8. Click Save to continue, or Finish to save and close.
Creating Composite FormsComposite forms display several forms simultaneously, even those associated withdifferent cubes. Users can enter data and see results aggregated to an upper-levelintersection, such as Total Revenue.
Composite forms and dashboards each have advantages. See ComparingDashboards to Composite Forms.
To create composite forms:
1. Click the Navigator icon , and then under Create and Manage, click Forms.
2. Select the folder in which to store the form. See Selecting and Opening Forms andFolders.
3. Click Create Composite Form above the list of forms.
4. In the Properties tab, enter a form name of up to 80 characters, and an optionaldescription of up to 255 characters.
5. Optional: Select Hide Form to hide the form.
6. Optional: Enter instructions for the form.
7. Set the composite form layout. See Setting Composite Form Layout.
8. Set the composite form section properties. See Setting Composite Form SectionProperties.
9. Set the composite form Point of View and Page display options. See SettingComposite Form Point of View and Page Dimensions.
10. Click Save to save your work and continue, or click Finish to save your work andclose the form.
• Setting Composite Form Layout
• Setting Composite Form Section Properties
• Setting Composite Form Point of View and Page Dimensions
• Creating Master Composite Forms
• Embedding Charts in Composite Forms
Setting Composite Form LayoutThe application provides tools that allow you to create whatever composite form layoutis best for your application. Each area in the composite form is called a section.Initially, you specify whether to divide the composite form layout into two side-by-sidesections, or two sections that are stacked one above the other. There is also a customlayout option.
To set composite form layout:
1. Open the composite form, and then click Layout.
See Selecting and Opening Forms and Folders.
2. In Select Layout, select an option:
Chapter 18Administering Forms
18-81
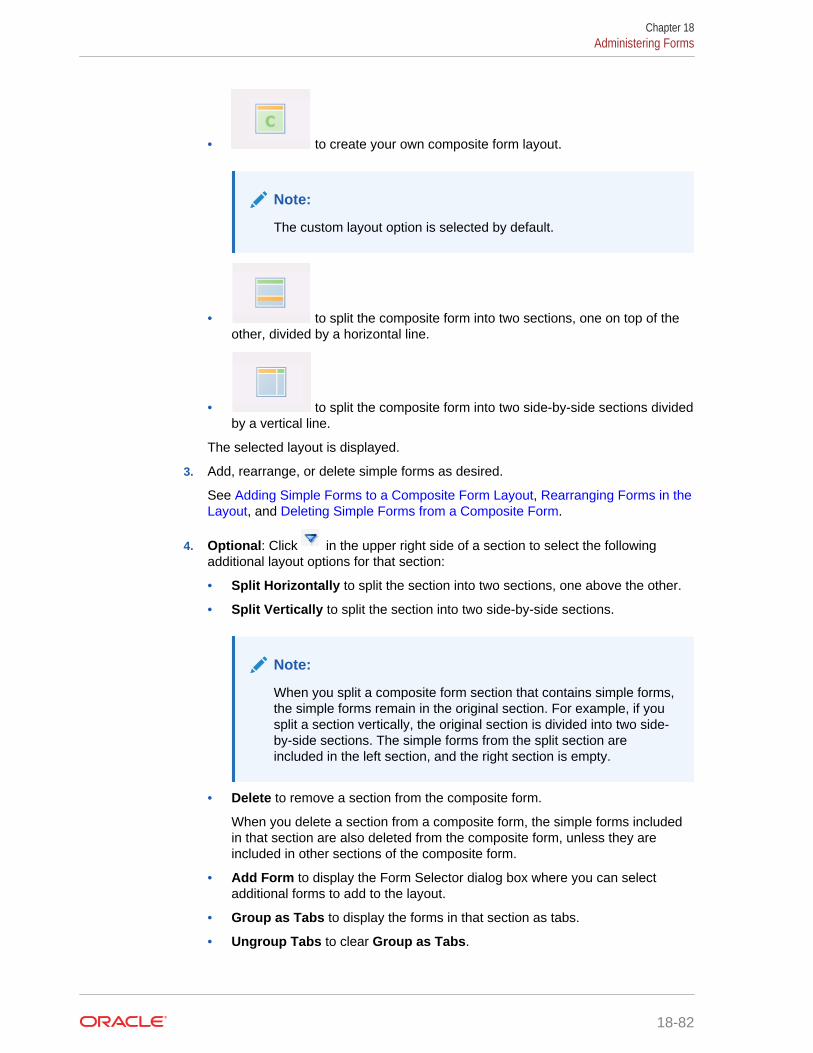
• to create your own composite form layout.
Note:
The custom layout option is selected by default.
• to split the composite form into two sections, one on top of theother, divided by a horizontal line.
• to split the composite form into two side-by-side sections dividedby a vertical line.
The selected layout is displayed.
3. Add, rearrange, or delete simple forms as desired.
See Adding Simple Forms to a Composite Form Layout, Rearranging Forms in theLayout, and Deleting Simple Forms from a Composite Form.
4. Optional: Click in the upper right side of a section to select the followingadditional layout options for that section:
• Split Horizontally to split the section into two sections, one above the other.
• Split Vertically to split the section into two side-by-side sections.
Note:
When you split a composite form section that contains simple forms,the simple forms remain in the original section. For example, if yousplit a section vertically, the original section is divided into two side-by-side sections. The simple forms from the split section areincluded in the left section, and the right section is empty.
• Delete to remove a section from the composite form.
When you delete a section from a composite form, the simple forms includedin that section are also deleted from the composite form, unless they areincluded in other sections of the composite form.
• Add Form to display the Form Selector dialog box where you can selectadditional forms to add to the layout.
• Group as Tabs to display the forms in that section as tabs.
• Ungroup Tabs to clear Group as Tabs.
Chapter 18Administering Forms
18-82
5. Click Save to save the Composite Form layout.
Tip:
You can edit a simple form from within a composite form. Right-click thesimple form, and then select Form Designer. Edit the form as describedin Editing Forms. Access permissions apply as described in Forms andPermissions.
Adding Simple Forms to a Composite Form LayoutTo add a simple form to a section in a composite form, do one of the following:
• Drag a form from the Forms in <Form Folder> pane to the desired section.
• Click in the desired section, select , and select Add Form. In the FormSelector dialog box, select a form and click OK.
• Expand Section Properties and click . In the Form Selector dialog box, selecta form and click OK.
When you're adding simple forms to a composite form, note the following:
• Composite forms can contain simple forms and ad hoc forms.
• During runtime, the simple forms selected for the composite form display from leftto right, and then from top to bottom within each composite form section.
• If you select Group as Tabs, the form displays in the order selected.
• You can drag simple forms between sections of a composite form.
Rearranging Forms in the LayoutTo rearrange the simple forms in the composite form layout, expand SectionProperties, select a form, can click an arrow key. You can:
• Move the form to the top
• Move the form up
• Move the form down
• Move the form to the bottom
Editing Simple Forms from within a Composite FormWhile editing a composite form, you can edit a single form from the Layout tab. Thisoption isn't available for ad hoc forms. Access permissions apply as described in Forms and Permissions.
To edit a simple form from a composite form:
1. Within the composite form, click the Layout tab.
2. Right-click a simple form, and then select Form Designer.
3. Edit the simple form as described in Editing Forms.
Chapter 18Administering Forms
18-83
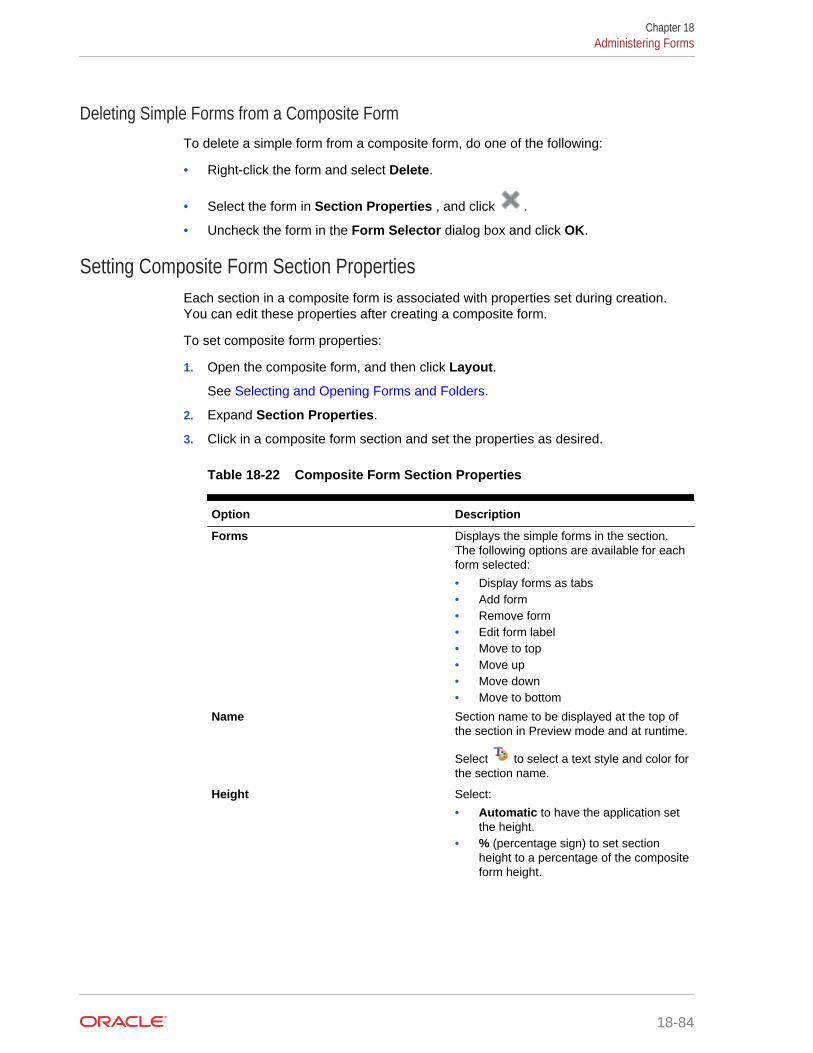
Deleting Simple Forms from a Composite FormTo delete a simple form from a composite form, do one of the following:
• Right-click the form and select Delete.
• Select the form in Section Properties , and click .
• Uncheck the form in the Form Selector dialog box and click OK.
Setting Composite Form Section PropertiesEach section in a composite form is associated with properties set during creation.You can edit these properties after creating a composite form.
To set composite form properties:
1. Open the composite form, and then click Layout.
See Selecting and Opening Forms and Folders.
2. Expand Section Properties.
3. Click in a composite form section and set the properties as desired.
Table 18-22 Composite Form Section Properties
Option Description
Forms Displays the simple forms in the section.The following options are available for eachform selected:
• Display forms as tabs• Add form• Remove form• Edit form label• Move to top• Move up• Move down• Move to bottom
Name Section name to be displayed at the top ofthe section in Preview mode and at runtime.
Select to select a text style and color forthe section name.
Height Select:
• Automatic to have the application setthe height.
• % (percentage sign) to set sectionheight to a percentage of the compositeform height.
Chapter 18Administering Forms
18-84
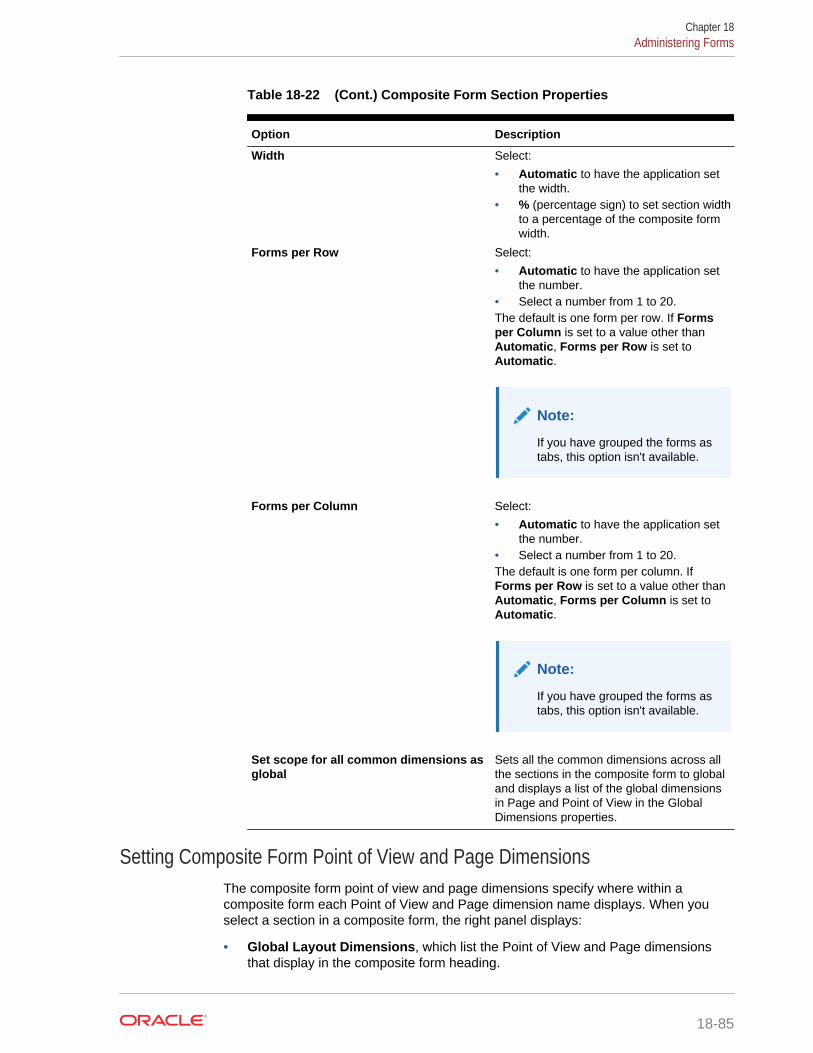
Table 18-22 (Cont.) Composite Form Section Properties
Option Description
Width Select:
• Automatic to have the application setthe width.
• % (percentage sign) to set section widthto a percentage of the composite formwidth.
Forms per Row Select:
• Automatic to have the application setthe number.
• Select a number from 1 to 20.The default is one form per row. If Formsper Column is set to a value other thanAutomatic, Forms per Row is set toAutomatic.
Note:
If you have grouped the forms astabs, this option isn't available.
Forms per Column Select:
• Automatic to have the application setthe number.
• Select a number from 1 to 20.The default is one form per column. IfForms per Row is set to a value other thanAutomatic, Forms per Column is set toAutomatic.
Note:
If you have grouped the forms astabs, this option isn't available.
Set scope for all common dimensions asglobal
Sets all the common dimensions across allthe sections in the composite form to globaland displays a list of the global dimensionsin Page and Point of View in the GlobalDimensions properties.
Setting Composite Form Point of View and Page DimensionsThe composite form point of view and page dimensions specify where within acomposite form each Point of View and Page dimension name displays. When youselect a section in a composite form, the right panel displays:
• Global Layout Dimensions, which list the Point of View and Page dimensionsthat display in the composite form heading.
Chapter 18Administering Forms
18-85
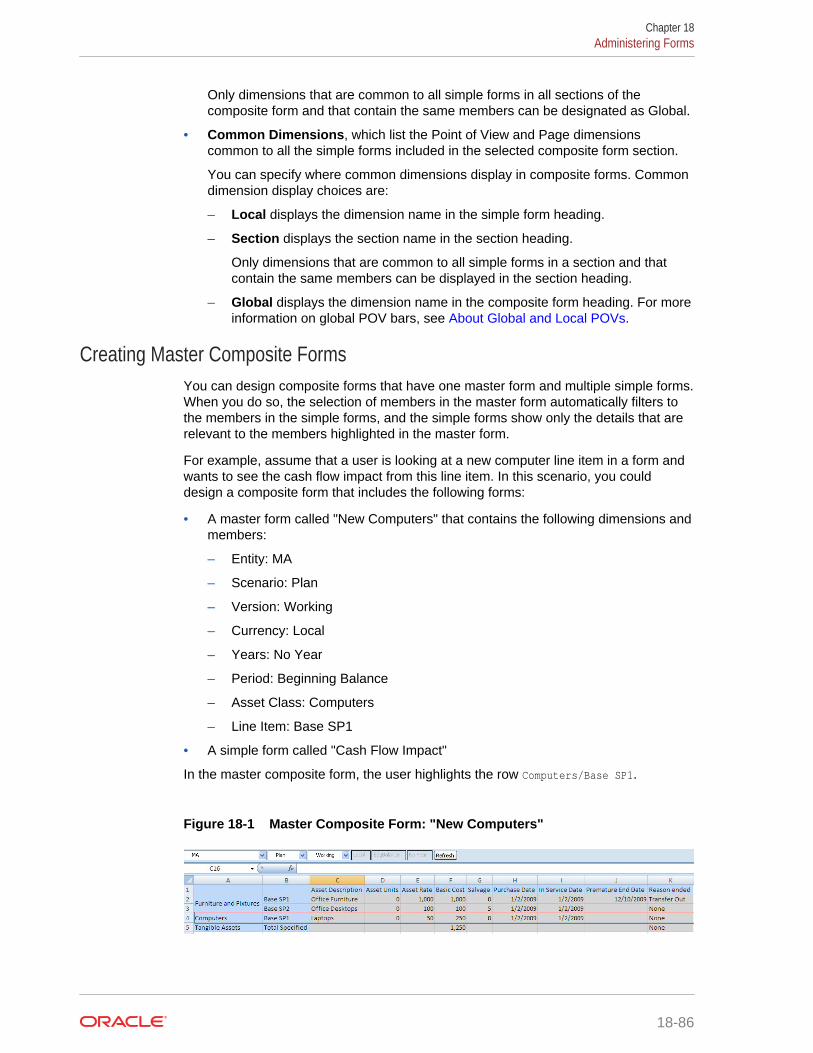
Only dimensions that are common to all simple forms in all sections of thecomposite form and that contain the same members can be designated as Global.
• Common Dimensions, which list the Point of View and Page dimensionscommon to all the simple forms included in the selected composite form section.
You can specify where common dimensions display in composite forms. Commondimension display choices are:
– Local displays the dimension name in the simple form heading.
– Section displays the section name in the section heading.
Only dimensions that are common to all simple forms in a section and thatcontain the same members can be displayed in the section heading.
– Global displays the dimension name in the composite form heading. For moreinformation on global POV bars, see About Global and Local POVs.
Creating Master Composite FormsYou can design composite forms that have one master form and multiple simple forms.When you do so, the selection of members in the master form automatically filters tothe members in the simple forms, and the simple forms show only the details that arerelevant to the members highlighted in the master form.
For example, assume that a user is looking at a new computer line item in a form andwants to see the cash flow impact from this line item. In this scenario, you coulddesign a composite form that includes the following forms:
• A master form called "New Computers" that contains the following dimensions andmembers:
– Entity: MA
– Scenario: Plan
– Version: Working
– Currency: Local
– Years: No Year
– Period: Beginning Balance
– Asset Class: Computers
– Line Item: Base SP1
• A simple form called "Cash Flow Impact"
In the master composite form, the user highlights the row Computers/Base SP1.
Figure 18-1 Master Composite Form: "New Computers"
Chapter 18Administering Forms
18-86
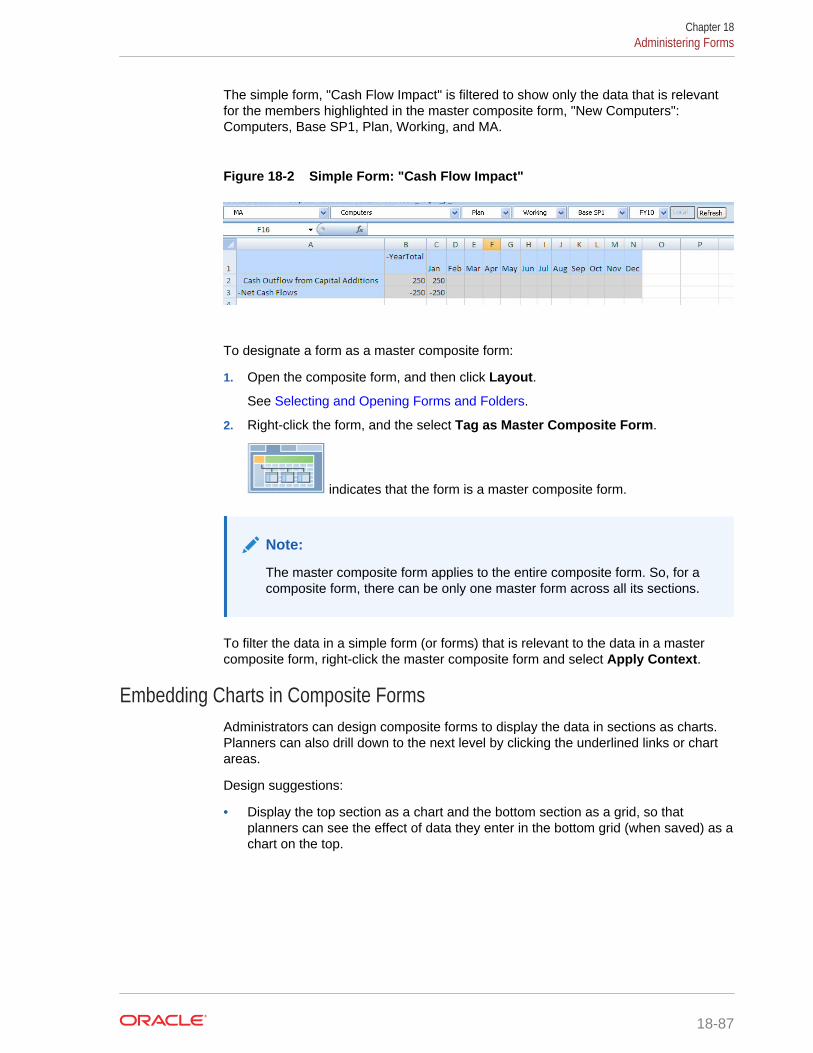
The simple form, "Cash Flow Impact" is filtered to show only the data that is relevantfor the members highlighted in the master composite form, "New Computers":Computers, Base SP1, Plan, Working, and MA.
Figure 18-2 Simple Form: "Cash Flow Impact"
To designate a form as a master composite form:
1. Open the composite form, and then click Layout.
See Selecting and Opening Forms and Folders.
2. Right-click the form, and the select Tag as Master Composite Form.
indicates that the form is a master composite form.
Note:
The master composite form applies to the entire composite form. So, for acomposite form, there can be only one master form across all its sections.
To filter the data in a simple form (or forms) that is relevant to the data in a mastercomposite form, right-click the master composite form and select Apply Context.
Embedding Charts in Composite FormsAdministrators can design composite forms to display the data in sections as charts.Planners can also drill down to the next level by clicking the underlined links or chartareas.
Design suggestions:
• Display the top section as a chart and the bottom section as a grid, so thatplanners can see the effect of data they enter in the bottom grid (when saved) as achart on the top.
Chapter 18Administering Forms
18-87
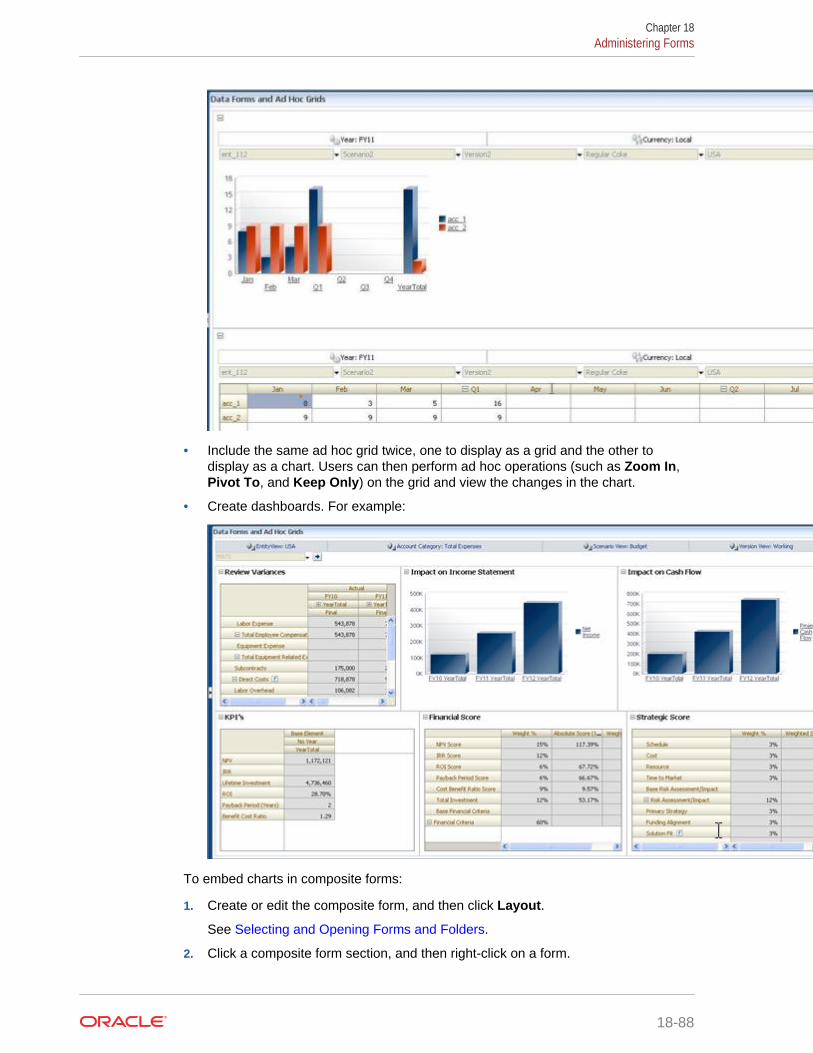
• Include the same ad hoc grid twice, one to display as a grid and the other todisplay as a chart. Users can then perform ad hoc operations (such as Zoom In,Pivot To, and Keep Only) on the grid and view the changes in the chart.
• Create dashboards. For example:
To embed charts in composite forms:
1. Create or edit the composite form, and then click Layout.
See Selecting and Opening Forms and Folders.
2. Click a composite form section, and then right-click on a form.
Chapter 18Administering Forms
18-88
3. Select Display as Chart.
Display as Chart toggles with Display as Grid, allowing you to switch betweenthem.
4. On Chart Properties, select a chart type:
• Bar—The length of each bar proportionally represents a value over anindependent variable (for example, time)
• Horizontal Bar—Like the regular bar chart, but turned on its side so that thedependent variable is displayed on the horizontal axis
• Line—Displays data points (for example, sales of various product lines) overtime, connected by lines
• Area—Like the Line chart, but the area between the axis and the line isemphasized with color
• Pie—Each slice of the pie chart proportionally represents a class of data inrelation to the whole
• Scatter—Each point represents the distribution of data for two variables
Read the onscreen text for advice on selecting a chart type.
5. Click OK.
6. Optional: To set where the chart displays the values that the chart represents(called the Legend), click Options, then click Legend, select one of the following,and then click OK:
• Right—To display the legend to the right of the chart (the default).
• Bottom—To display the legend at the bottom of the chart.
• Left—To display the legend to the left of the chart.
• Top—To display the legend at the top of the chart.
7. Optional: To set where the chart labels (that is, the member names or aliases) aredisplayed, on Options, click Label, select one of the following, and then click OK.
• Outside Max—To display the label above bar charts or, for non-bar charts,display the label above the data point for positive values and below the datapoint for negative values. Outside Max is the default.
• Center—To display the label centered on bar charts, or for non-bar charts,display the label above the data point for positive values and below the datapoint for negative values.
• Inside Max—To display the label on the bar, near the top, or for non-barcharts, display the label below the data point for positive numbers and abovethe data point for negative numbers.
• Inside Min—To display the label inside on the bar, near the bottom, or fornon-bar charts, display the label above the data point for positive values andbelow the data point for negative values.
• Max Edge—To display the label on the bar, or for non-bar charts, display thelabel at the data point.
Chapter 18Administering Forms
18-89
Designing Specific Types of FormsRelated Topics
• Designing Forms for Multiple Currencies
• Designing Forms with Formula Rows and Columns
• Designing Forms with Data Validation
• Designing Forms with Global Assumptions
• Designing Forms for Rolling Forecasts
Designing Forms for Multiple CurrenciesTo allow users to work with currencies other than entities’ base currencies, performone task:
• Select members from at least two currencies to compare converted currencies inthe same form.
• Assign the Currency dimension to the page axis and select reporting currencies asmembers to convert currencies for all the members in the form. Users can thenselect a currency member from the page axis and launch the Calculate Currenciesbusiness rule to view values in that currency.
Designing Forms with Formula Rows and ColumnsFormula rows and columns contain formulas that perform mathematical calculationson grid members. For example, you might want to rank values in a particular column orcalculate variance between two rows. A formula consists of grid references, arithmeticoperators, and mathematical functions. To define or assign existing formulas to forms,select the appropriate row or column on the Layout tab and then make selectionsunder Segment Properties.
See Adding Formula Rows and Columns. For information about creating formulas andusing the mathematical functions, see Form Formula Functions.
Designing Forms with Data ValidationYou can design forms that include predefined data validation rules that help implementbusiness policies and practices. You can specify cell colors and data validationmessages that are generated on the form if entered data violates a validation rule.Data validation rules are saved as part of the form. See Including Data ValidationRules in Forms and Managing Data Validation.
Designing Forms with Global AssumptionsForm designers typically create a specific-purpose form that stores global assumptions(also called “drivers” or “driver data”), such as a depreciation value, tax rate, or unitprice. This is useful if you want to migrate the form’s driver data using Migration, forexample, from a test environment to a production environment. Such forms aretypically small, and are used as “lookup tables” that drive calculations.
To enable transferring global assumptions from a test to production environment,during form design for a simple form, in the Layout tab select Grid Properties and
Chapter 18Administering Forms
18-90
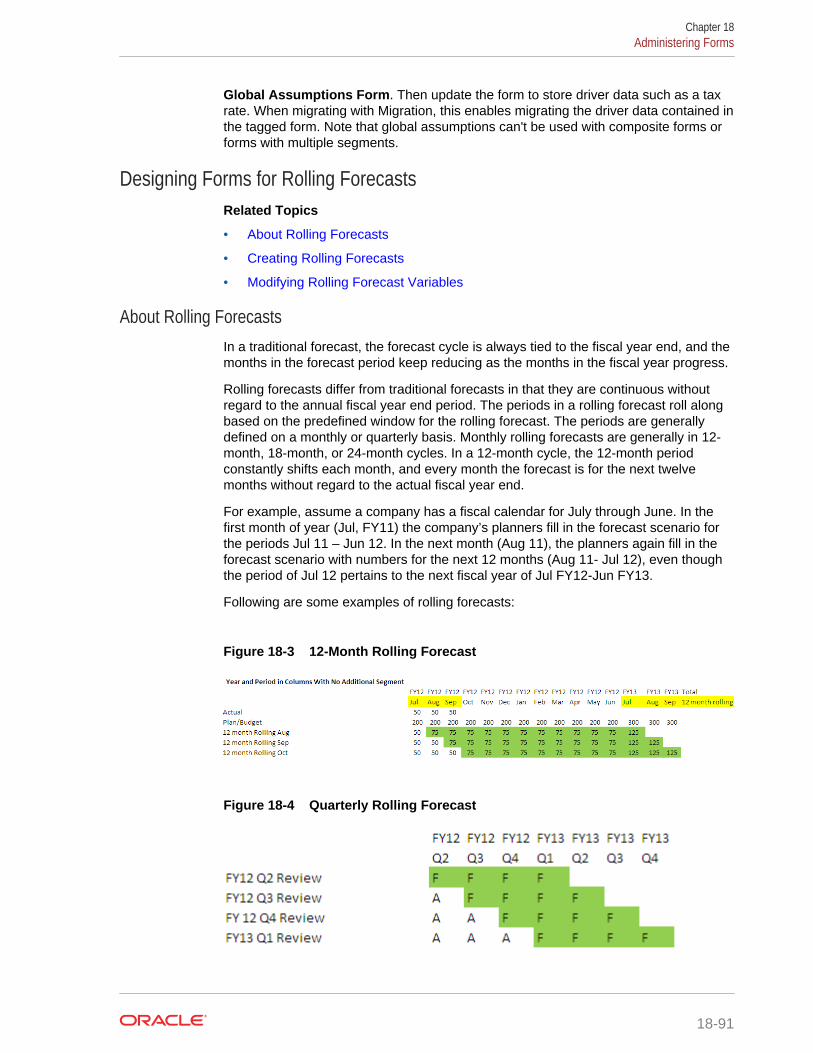
Global Assumptions Form. Then update the form to store driver data such as a taxrate. When migrating with Migration, this enables migrating the driver data contained inthe tagged form. Note that global assumptions can't be used with composite forms orforms with multiple segments.
Designing Forms for Rolling ForecastsRelated Topics
• About Rolling Forecasts
• Creating Rolling Forecasts
• Modifying Rolling Forecast Variables
About Rolling ForecastsIn a traditional forecast, the forecast cycle is always tied to the fiscal year end, and themonths in the forecast period keep reducing as the months in the fiscal year progress.
Rolling forecasts differ from traditional forecasts in that they are continuous withoutregard to the annual fiscal year end period. The periods in a rolling forecast roll alongbased on the predefined window for the rolling forecast. The periods are generallydefined on a monthly or quarterly basis. Monthly rolling forecasts are generally in 12-month, 18-month, or 24-month cycles. In a 12-month cycle, the 12-month periodconstantly shifts each month, and every month the forecast is for the next twelvemonths without regard to the actual fiscal year end.
For example, assume a company has a fiscal calendar for July through June. In thefirst month of year (Jul, FY11) the company’s planners fill in the forecast scenario forthe periods Jul 11 – Jun 12. In the next month (Aug 11), the planners again fill in theforecast scenario with numbers for the next 12 months (Aug 11- Jul 12), even thoughthe period of Jul 12 pertains to the next fiscal year of Jul FY12-Jun FY13.
Following are some examples of rolling forecasts:
Figure 18-3 12-Month Rolling Forecast
Figure 18-4 Quarterly Rolling Forecast
Chapter 18Administering Forms
18-91
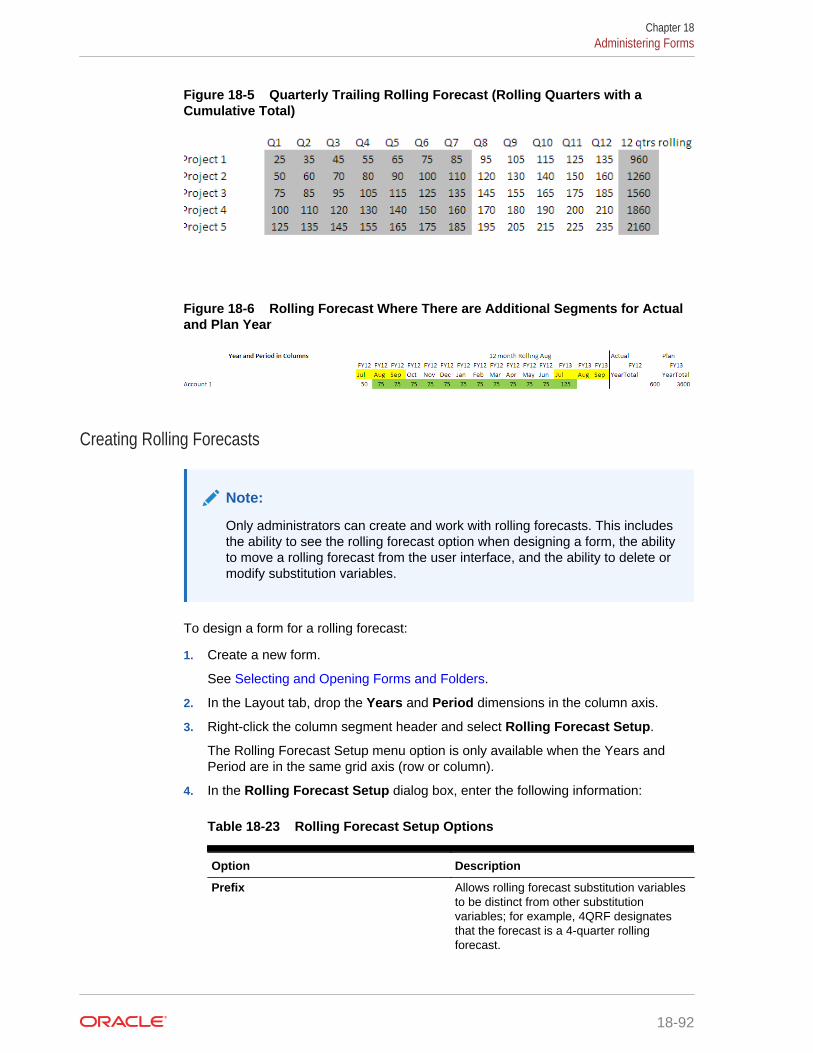
Figure 18-5 Quarterly Trailing Rolling Forecast (Rolling Quarters with aCumulative Total)
Figure 18-6 Rolling Forecast Where There are Additional Segments for Actualand Plan Year
Creating Rolling Forecasts
Note:
Only administrators can create and work with rolling forecasts. This includesthe ability to see the rolling forecast option when designing a form, the abilityto move a rolling forecast from the user interface, and the ability to delete ormodify substitution variables.
To design a form for a rolling forecast:
1. Create a new form.
See Selecting and Opening Forms and Folders.
2. In the Layout tab, drop the Years and Period dimensions in the column axis.
3. Right-click the column segment header and select Rolling Forecast Setup.
The Rolling Forecast Setup menu option is only available when the Years andPeriod are in the same grid axis (row or column).
4. In the Rolling Forecast Setup dialog box, enter the following information:
Table 18-23 Rolling Forecast Setup Options
Option Description
Prefix Allows rolling forecast substitution variablesto be distinct from other substitutionvariables; for example, 4QRF designatesthat the forecast is a 4-quarter rollingforecast.
Chapter 18Administering Forms
18-92
Table 18-23 (Cont.) Rolling Forecast Setup Options
Option Description
Reuse existing substitution variables Select if you wish to specify a prefix that youhave previously used.
Start Year The year in which the rolling forecast starts;for example, FY11.
Either enter the start year or click toopen the Member Selection dialog box.
If you entered a prefix that matches theprefix of an existing rolling forecastsubstitution variable and selected Reuseexisting substitution variables, the StartYear is automatically filled in with the startyear of the existing substitution variable.
Start Period The period in the year in which the rollingforecast starts; for example, Q1.
Either enter the start period or click toopen the Member Selection dialog box.
If you entered a prefix that matches theprefix of an existing rolling forecastsubstitution variable and selected Reuseexisting substitution variables, the StartPeriod is automatically filled in with the startperiod of the existing substitution variable.
Number of Periods Number of year/period combinations that willbe generated as separate segments.
5. Click Generate.
The defined substitution variables are created, and additional column segmentsare created in the form that contain the substitution variable combinations for therolling forecast.
Note:
• Substitution variables are based on the periods selected for the StartYear and Start Period. See Selecting Substitution Variables asMembers.
• When designing a form, if the Rolling Forecast Setup dialog box isbrought up from a row or column with the Year and Level 0 time periodselected (for example,FY12/Jan), the Start Year and Start Period areautomatically filled in. Values are not automatically filled in if members inthe column are selected using functions, variables, or non-level-0members.
• To reuse the rolling forecast variables in a different form, right-click thecolumn header in the new form to invoke the Member Selector.
Chapter 18Administering Forms
18-93
Modifying Rolling Forecast VariablesAdministrators can revise the values for rolling forecast substitution variables directlyin the form.
To modify rolling forecast variables in a form:
1. Click the Navigator icon , and then under Create and Manage, click Forms.
2. Open the rolling forecast form.
3. Right-click any column in the form and select Set Rolling Forecast Variables.
4. In the Set Rolling Forecast Variables dialog box, enter or edit values for theYears and Period dimensions.
You can shift the values up or down by changing the selection next to ShiftValues By. When you change the selection next to Shift Values By, the valuesfor the Years and Period dimensions are automatically repopulated to show theresulting year and period values after the shift.
5. Click Apply.
The new values flow through to all the forms where these substitution variablesare used, and those forms will reflect the changes.
Working with Forms and Form ComponentsRelated Topics
• Selecting and Opening Forms and Folders
• Previewing Forms
• Printing Form Definitions
• Searching for Forms
• Editing Forms
• Moving, Deleting, and Renaming Forms
• How Cell Formatting in Smart View Persists in Planning
Selecting and Opening Forms and FoldersUse these procedures to select and open form folders and the forms they contain.
To select and open forms or form folders from within the administrator's interface:
1. Click the Navigator icon , and then under Create and Manage, click Forms.
2. Perform one of the following steps:
• To open a form folder, select a form folder beneath Form Folders.
• To open a form, select a form from the list displayed beneath Form when theappropriate form folder is open.
3. After you select a form folder, use the buttons next to Form Folders to create,rename, and assign access to the folder. After displaying a form, use the buttons
Chapter 18Administering Forms
18-94
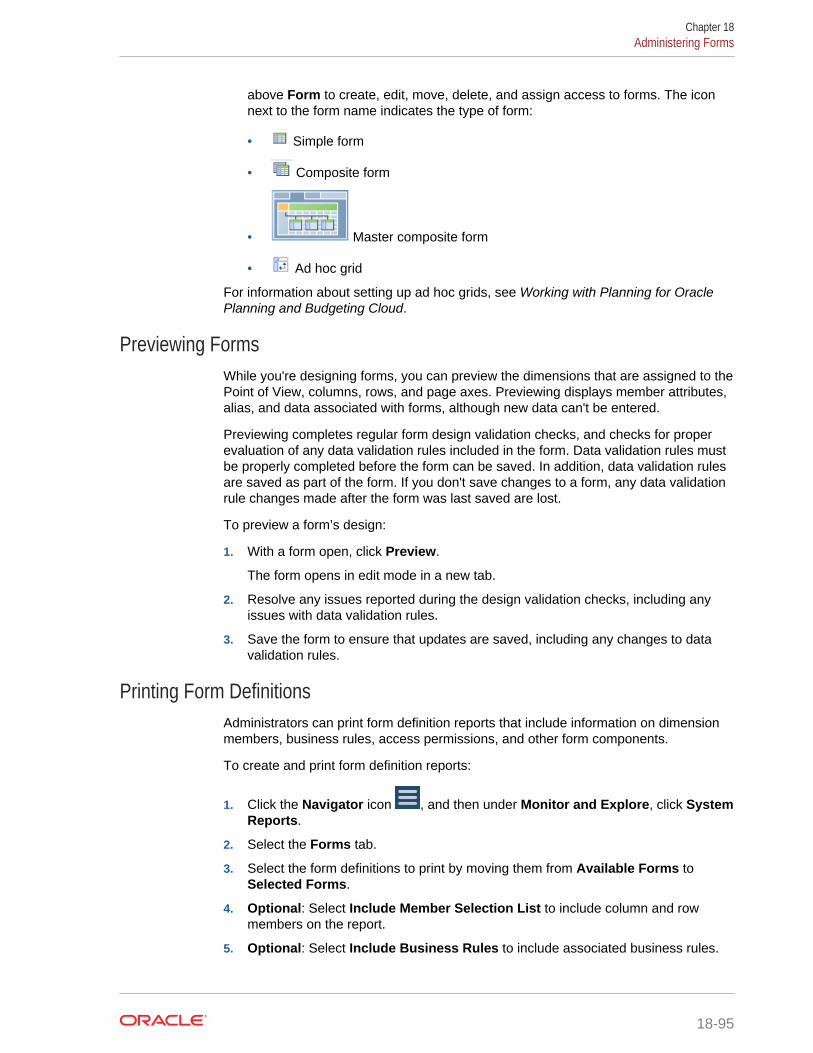
above Form to create, edit, move, delete, and assign access to forms. The iconnext to the form name indicates the type of form:
• Simple form
• Composite form
• Master composite form
• Ad hoc grid
For information about setting up ad hoc grids, see Working with Planning for OraclePlanning and Budgeting Cloud.
Previewing FormsWhile you're designing forms, you can preview the dimensions that are assigned to thePoint of View, columns, rows, and page axes. Previewing displays member attributes,alias, and data associated with forms, although new data can't be entered.
Previewing completes regular form design validation checks, and checks for properevaluation of any data validation rules included in the form. Data validation rules mustbe properly completed before the form can be saved. In addition, data validation rulesare saved as part of the form. If you don't save changes to a form, any data validationrule changes made after the form was last saved are lost.
To preview a form’s design:
1. With a form open, click Preview.
The form opens in edit mode in a new tab.
2. Resolve any issues reported during the design validation checks, including anyissues with data validation rules.
3. Save the form to ensure that updates are saved, including any changes to datavalidation rules.
Printing Form DefinitionsAdministrators can print form definition reports that include information on dimensionmembers, business rules, access permissions, and other form components.
To create and print form definition reports:
1. Click the Navigator icon , and then under Monitor and Explore, click SystemReports.
2. Select the Forms tab.
3. Select the form definitions to print by moving them from Available Forms toSelected Forms.
4. Optional: Select Include Member Selection List to include column and rowmembers on the report.
5. Optional: Select Include Business Rules to include associated business rules.
Chapter 18Administering Forms
18-95
6. Click Create Report.
Adobe Acrobat generates a consolidated report, including:
• Cube
• Description
• Column dimension and members and additional column definitions
• Row dimension and members and additional row definitions
• Page and Point of View dimensions
• Form access permissions
• Associated business rules
7. To print the report, select File, and then Print on the Adobe toolbar.
Searching for FormsTo search for forms:
1. Click the Navigator icon , and then under Create and Manage, click Forms.
2. For Search, enter part or all the form name.
Ignoring capitalization, Search finds the next match.
3. Click to search forward (down) or to search backwards (up).
Editing FormsYou can edit the layout, members, and properties of both simple and composite forms.For example, you can add formula rows or columns to a simple form, or add forms to acomposite form.
• Editing Simple Forms
• Editing Composite Forms
Editing Simple FormsTo edit simple forms:
1. Select the form, then click (see Selecting and Opening Forms and Folders).
2. Select:
a. Properties to edit the form name, description and instructions. See CreatingSimple Forms.
b. Layout to edit form layout. See Defining the Layout.
c. Other Options to edit form precision and to change which context menus areassociated with the form. See Setting Form Precision and Other Options.
d. Business Rules to change which business rules are associated with the form,or modify business rule properties. See Administering Rules.
3. Click Finish to save your work and close the form.
Chapter 18Administering Forms
18-96
Editing Composite FormsTo edit composite forms:
1. Take one of these actions:
• Select the form, click the Show Usage icon , select the simple form, andthen click Edit.
• Select the form, and then click (see Selecting and Opening Forms andFolders).
Note:
When editing a composite form, if this message displays, "Modificationshave been made to one or more included forms; if you want to savechanges to common dimensions, save the composite form," determinewhat changes were made to the common dimensions of the includedsimple forms before saving changes to the composite form.
2. Select:
• Properties to edit the composite form name, description or instructions. See Creating Composite Forms.
• Layout to edit form layout and properties. See Setting Composite FormLayout.
• Business Rules to change which business rules are associated with the form,or modify business rule properties. See Administering Rules.
3. Click Finish to save your work and close the form.
Moving, Deleting, and Renaming FormsTo move, delete, and rename forms:
1. Select the form.
See Selecting and Opening Forms and Folders.
2. Select a task:
• To move a form, click Move, and then select the destination folder.
Note:
You can move multiple forms simultaneously if they are in the samefolder.
• To delete a form, click Delete.
• To rename a form, click Rename, and then enter the new name.
3. Click OK.
Chapter 18Administering Forms
18-97
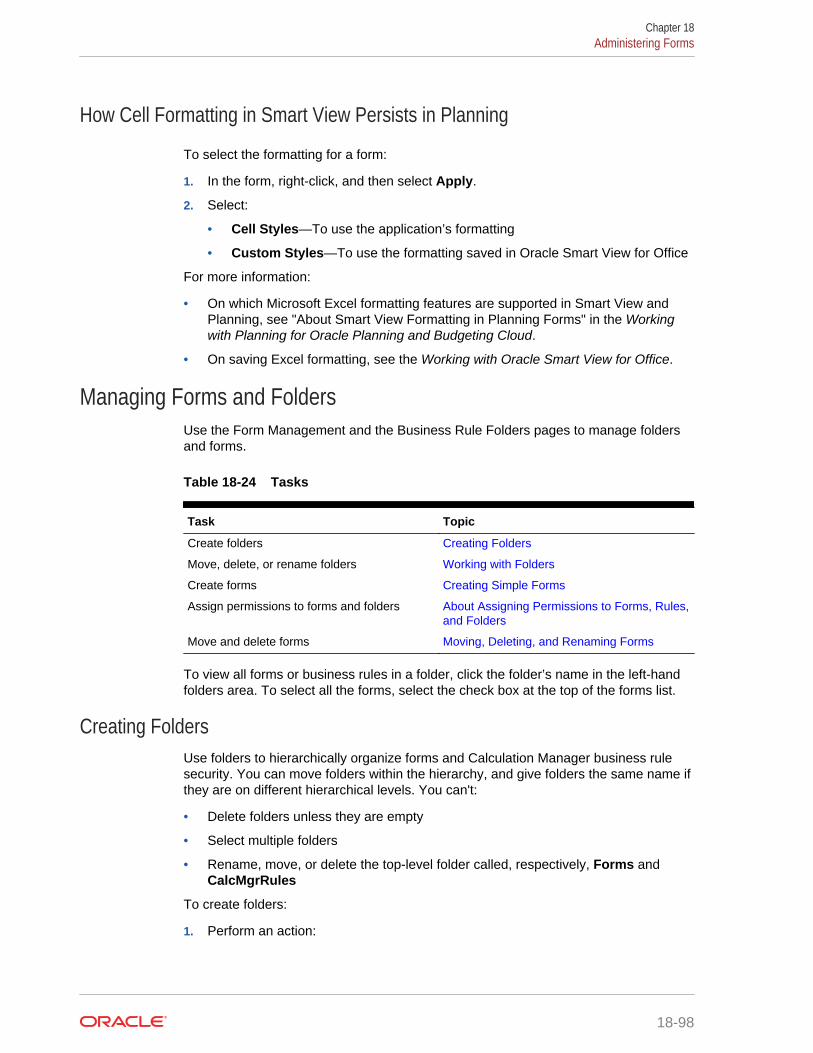
How Cell Formatting in Smart View Persists in Planning
To select the formatting for a form:
1. In the form, right-click, and then select Apply.
2. Select:
• Cell Styles—To use the application’s formatting
• Custom Styles—To use the formatting saved in Oracle Smart View for Office
For more information:
• On which Microsoft Excel formatting features are supported in Smart View andPlanning, see "About Smart View Formatting in Planning Forms" in the Workingwith Planning for Oracle Planning and Budgeting Cloud.
• On saving Excel formatting, see the Working with Oracle Smart View for Office.
Managing Forms and FoldersUse the Form Management and the Business Rule Folders pages to manage foldersand forms.
Table 18-24 Tasks
Task Topic
Create folders Creating Folders
Move, delete, or rename folders Working with Folders
Create forms Creating Simple Forms
Assign permissions to forms and folders About Assigning Permissions to Forms, Rules,and Folders
Move and delete forms Moving, Deleting, and Renaming Forms
To view all forms or business rules in a folder, click the folder’s name in the left-handfolders area. To select all the forms, select the check box at the top of the forms list.
Creating FoldersUse folders to hierarchically organize forms and Calculation Manager business rulesecurity. You can move folders within the hierarchy, and give folders the same name ifthey are on different hierarchical levels. You can't:
• Delete folders unless they are empty
• Select multiple folders
• Rename, move, or delete the top-level folder called, respectively, Forms andCalcMgrRules
To create folders:
1. Perform an action:
Chapter 18Administering Forms
18-98
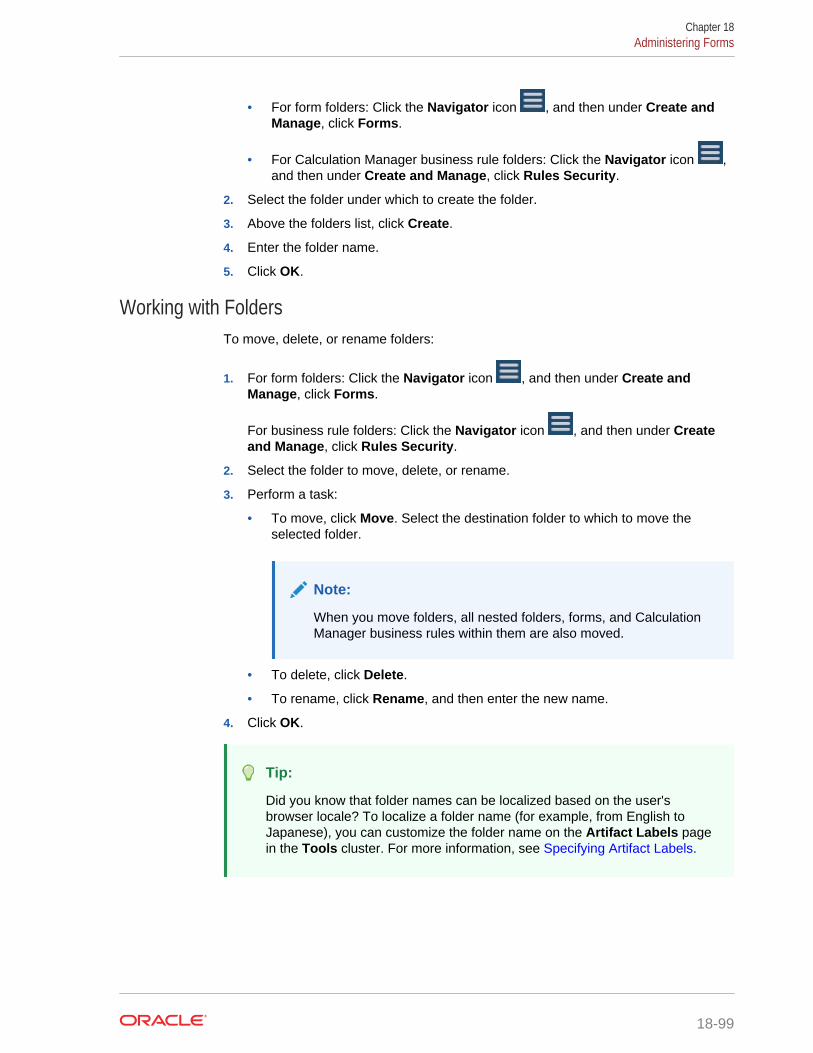
• For form folders: Click the Navigator icon , and then under Create andManage, click Forms.
• For Calculation Manager business rule folders: Click the Navigator icon ,and then under Create and Manage, click Rules Security.
2. Select the folder under which to create the folder.
3. Above the folders list, click Create.
4. Enter the folder name.
5. Click OK.
Working with FoldersTo move, delete, or rename folders:
1. For form folders: Click the Navigator icon , and then under Create andManage, click Forms.
For business rule folders: Click the Navigator icon , and then under Createand Manage, click Rules Security.
2. Select the folder to move, delete, or rename.
3. Perform a task:
• To move, click Move. Select the destination folder to which to move theselected folder.
Note:
When you move folders, all nested folders, forms, and CalculationManager business rules within them are also moved.
• To delete, click Delete.
• To rename, click Rename, and then enter the new name.
4. Click OK.
Tip:
Did you know that folder names can be localized based on the user'sbrowser locale? To localize a folder name (for example, from English toJapanese), you can customize the folder name on the Artifact Labels pagein the Tools cluster. For more information, see Specifying Artifact Labels.
Chapter 18Administering Forms
18-99
Administering RulesRelated Topics
• About Rules
• Selecting Business Rules
• Setting Business Rule Properties
• Viewing Rules Usage
• About Runtime Prompts
• Understanding Runtime Prompts
• About Runtime Prompts and Approvals Security
• Designing Secure Runtime Prompts
• Using Groovy Rules
About RulesWith appropriate access, users can launch business rules from the application. Rulescan also prompt users for input when rules are launched.
For optimum performance, rules that run in forms should be designed to executewithin three minutes. For rules with a longer execution time, you can schedule batchprocessing or run the rules during non-peak hours.
For information on:
• Creating and updating business rules, see Designing with Calculation Manager forOracle Enterprise Performance Management Cloud
• Using runtime prompts, see About Runtime Prompts
• Generating a report that details where rules are used, see Viewing Rules Usage
Selecting Business RulesYou can associate multiple business rules with a form, by cube. Users can launchassociated business rules from the form to calculate and allocate values. You can setwhether each business rule associated with a form automatically launches when theform is opened or saved.
To select business rules for forms:
1. Take an action:
• To update the current form, click Actions, and then click Business Rules.
• To open a form for editing, go to the Home page and click the Navigator icon
, and then under Create and Manage, click Forms. Select the form, click
, and then click Business Rules.
2. From the Cube drop-down menu, select the cube.
Chapter 18Administering Rules
18-100
3. From the Business Rules list, select the business rules to associate with theform, and move them to Selected Business Rules. See Using the MemberSelector.
By default, the Calculate Form and Calculate Currencies business rules areselected. Calculate Form is automatically created for forms to calculate subtotals.Calculate Currencies is created for forms that include multiple currencies in a row,column, or page, to enable converting values among the available currencies. Youcan clear Calculate Currencies if you use customized calculation scripts tocalculate currency conversions. You can clear Calculate Form to prevent plannersfrom calculating data in forms.
4. To change the order of selected business rules (the order in which rules displayand launch), select a business rule in Selected Business Rules and click the upor down arrow to move it up or down in the list. The rule listed first displays andlaunches first; the rule at the bottom of the list displays and launches last.
The order in which business rules launch is important and may affect data. Forexample, it's important to convert currencies first, before subtotaling.
5. To set business rule properties, click Properties. See Setting Business RuleProperties.
6. Click Save to save your work and continue creating or editing the form, or clickFinish to save your work and close the form.
Note:
When selecting business rules for composite forms, you can select whichincluded forms’ business rules run in composite forms. Business rules fromincluded forms don't run unless you select them for the composite form itself.For example, to run all the business rules associated with an included formnamed "Total Expense Impact", select" Business rules for Total ExpenseImpact".
Setting Business Rule PropertiesYou can specify whether business rules associated with forms launch automaticallywhen users load (open) or save the form. If business rules have runtime prompts, youcan set whether the default members in the runtime prompt match the membersselected in the page and Point of View axes.
To set business rule properties:
1. Take an action:
• To update the current form, click Actions, and then click Business Rules.
• To open a form for editing, go to the Home page and click the Navigator icon
, and then under Create and Manage, click Forms. Select the form, click
, and then click Business Rules.
2. There are four phases in a form where a rule can be assigned and each may haveinformation relevant to that phase. Select from the following:
• Run Before Load
Chapter 18Administering Rules
18-101
• Run After Load
• Run Before Save
• Run After Save
Note:
• Run After Load and Run Before Save are enabled only for Groovyrules. You can't select these options for calc scripts or graphicalrules. For more information about Groovy rules, see Using GroovyRules.
• You can use Groovy rules only in applications of type Enterprise(available with Enterprise PBCS or PBCS Plus One licenses orStrategic Workforce Planning).
• Some actions such as saving the grid, changing the page, orlaunching an action menu item will also reload the page after theoperation completes. This ensures the grid contains the newest data.When this happens, the before and after load actions will run as theydo in normal page loads.
• While hidden runtime prompts are not supported for calc script ruleson the before and after load options, they are supported for Groovyrules.
3. Optional: If a business rule has runtime prompts, select Use Members on Formto match the default member selection on the runtime prompt window to thecurrent members in the page and Point of View axes of the open form.
To learn how this option interacts with other settings and conditions, see Understanding Runtime Prompts.
4. Optional: To hide the runtime prompt value from the user, select Hide Prompt,which automatically selects Use Members on Form.
After saving the form, the next time you return to this page, Use Members onForm displays as selected.
You can hide runtime prompts if:
• All runtime prompt member values are filled in (appropriate dimensionmembers can be read from form's Page/Point of View)
• No dimensions are repeated in the runtime prompt
5. Click OK.
Viewing Rules UsageBusiness rules can be used in the following artifacts:
• Forms
• Rulesets
• Menus
• Task lists
Chapter 18Administering Rules
18-102
Service Administrators can generate a report, called the Rules Usage Report, thatdetails where rules are used. Filters enable you to refine the details by rule name, ruletype, and cube.
Note:
The only rules listed in the Rules Usage Report are those rules that aredeployed in Planning.
To view rules usage:
1. Click the Navigator icon , and then under Monitor and Explore, click SystemReports.
2. Click the Rules Details tab.
3. If filtering, select filter criteria, and then click Apply Filter:
• Rule Type—Choose one or more options: All, Rules, and Rulesets
• Cube—Choose from a list of available cubes.
• Name Filter—Enter a rule or ruleset name. Optionally, you can use wildcardcharacters.
The Rules list displays the rules that are deployed in Planning and that match thefilter criteria.
4. For File Format, select one of the following formats:
• XLSX (default)
• HTML
• XML
Note:
Choosing XML format enables you to configure the Rules UsageReport with the help of Oracle BI Publisher Add-in for MS Office. Youcan have greater control over which columns to display in yourreport, the order in which the columns are displayed, whether toapply sorting, and so on.
5. Click Create Report.
The Rules Usage Reports provides the following information:
• Rule Name
• Rule Type
• Cube
• Primary Association (Type and Name)
Chapter 18Administering Rules
18-103
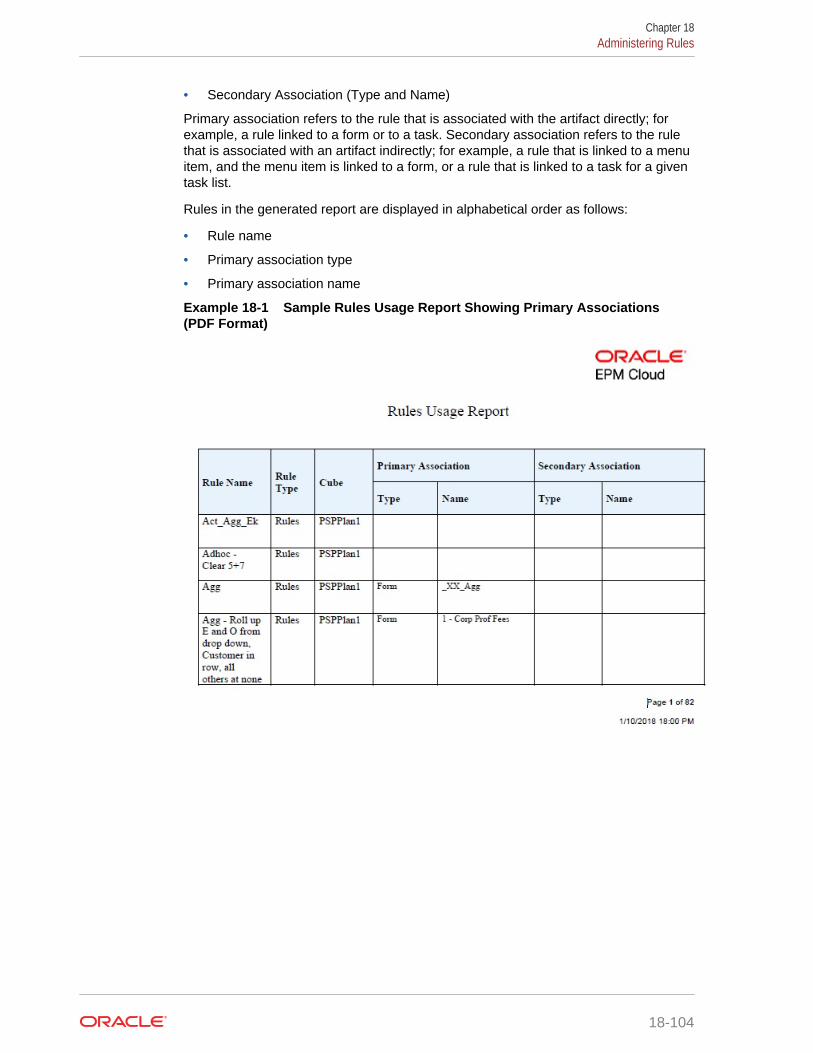
• Secondary Association (Type and Name)
Primary association refers to the rule that is associated with the artifact directly; forexample, a rule linked to a form or to a task. Secondary association refers to the rulethat is associated with an artifact indirectly; for example, a rule that is linked to a menuitem, and the menu item is linked to a form, or a rule that is linked to a task for a giventask list.
Rules in the generated report are displayed in alphabetical order as follows:
• Rule name
• Primary association type
• Primary association name
Example 18-1 Sample Rules Usage Report Showing Primary Associations(PDF Format)
Chapter 18Administering Rules
18-104
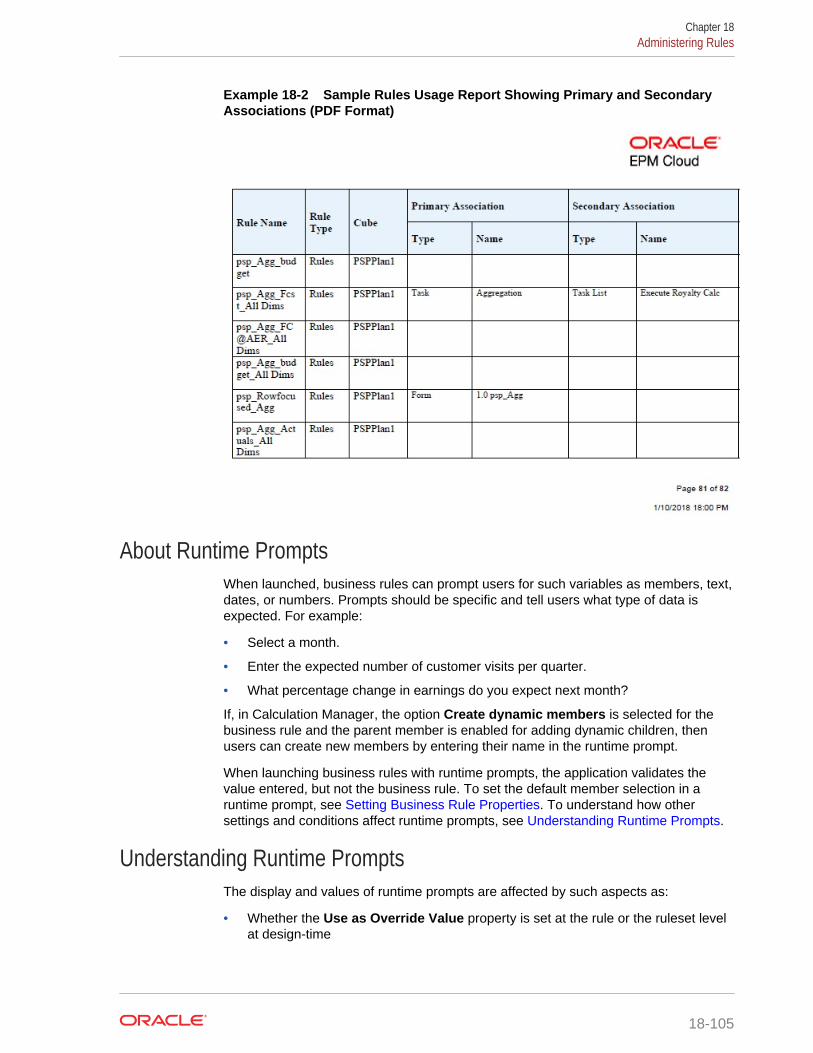
Example 18-2 Sample Rules Usage Report Showing Primary and SecondaryAssociations (PDF Format)
About Runtime PromptsWhen launched, business rules can prompt users for such variables as members, text,dates, or numbers. Prompts should be specific and tell users what type of data isexpected. For example:
• Select a month.
• Enter the expected number of customer visits per quarter.
• What percentage change in earnings do you expect next month?
If, in Calculation Manager, the option Create dynamic members is selected for thebusiness rule and the parent member is enabled for adding dynamic children, thenusers can create new members by entering their name in the runtime prompt.
When launching business rules with runtime prompts, the application validates thevalue entered, but not the business rule. To set the default member selection in aruntime prompt, see Setting Business Rule Properties. To understand how othersettings and conditions affect runtime prompts, see Understanding Runtime Prompts.
Understanding Runtime PromptsThe display and values of runtime prompts are affected by such aspects as:
• Whether the Use as Override Value property is set at the rule or the ruleset levelat design-time
Chapter 18Administering Rules
18-105
• Whether there are valid members on the form's Page/Point of View and whetherthe Use Members on Form and Hide Prompt options on the Business RuleProperties tab are selected (see Setting Business Rule Properties)
• Whether the Runtime Prompt option is set during form design or set whendesigning the runtime prompt (see Designing with Calculation Manager for OracleEnterprise Performance Management Cloud)
• Whether the Use Last Value property is set when designing the business rule
• Whether, in Calculation Manager, the option Create dynamic members isselected for the business rule and the parent member is enabled for addingdynamic children. If yes, then users can create new members by entering theirname in the runtime prompt.
Principles:
1. If the Use as Override Value property is set at the rule or the ruleset level atdesign-time, the value overridden at the rule level or the ruleset level will takeprecedence over the values of members in the Page/Point of View and the lastsaved value. This occurs regardless of where the rule is launched (from the formor from the Rules link on the Navigator menu), and regardless of whether theruntime prompt is hidden during design. The Override Value can be set as a uservariable, in which case the rule will be launched with the current value of thevariable.
2. When launched from a form, the values of members in the Page/Point of Viewtake precedence over the last saved value if the Use Members on Form option isselected, regardless of whether the runtime prompt is hidden during design. Thebusiness rule is run without displaying the hidden runtime prompt to users, and theruntime prompt values are taken from the Page/Point of View members.
This isn't the case when business rules associated with composite forms arelaunched on save or from the left-hand pane or when business rules are launchedfrom the Rules link on the Navigator menu. In these cases, the Use Members onForm setting is ignored, hidden runtime prompts get design-time values, and thelast saved value takes precedence.
3. If the Use Last Value option is selected for the runtime prompt at design time, andif any of these conditions exist:
• Use Members on Form isn't selected
• A runtime prompt is launched from the Rules link on the Navigator menu
• Values can't be pre-filled from the context
Then the precedence of runtime prompt values is determined by:
a. The last saved value takes precedence.
b. If a ruleset is launched, the value overridden at the ruleset level at design-timeis used.
c. If a business rule is launched, the value overridden at the rule-level at design-time is used. If it's not overridden at the rule-level, the runtime prompt value atdesign-time is used.
Runtime prompts that are hidden at design time never use the last saved value. Inthese cases, the Use Last Value setting is ignored.
Chapter 18Administering Rules
18-106
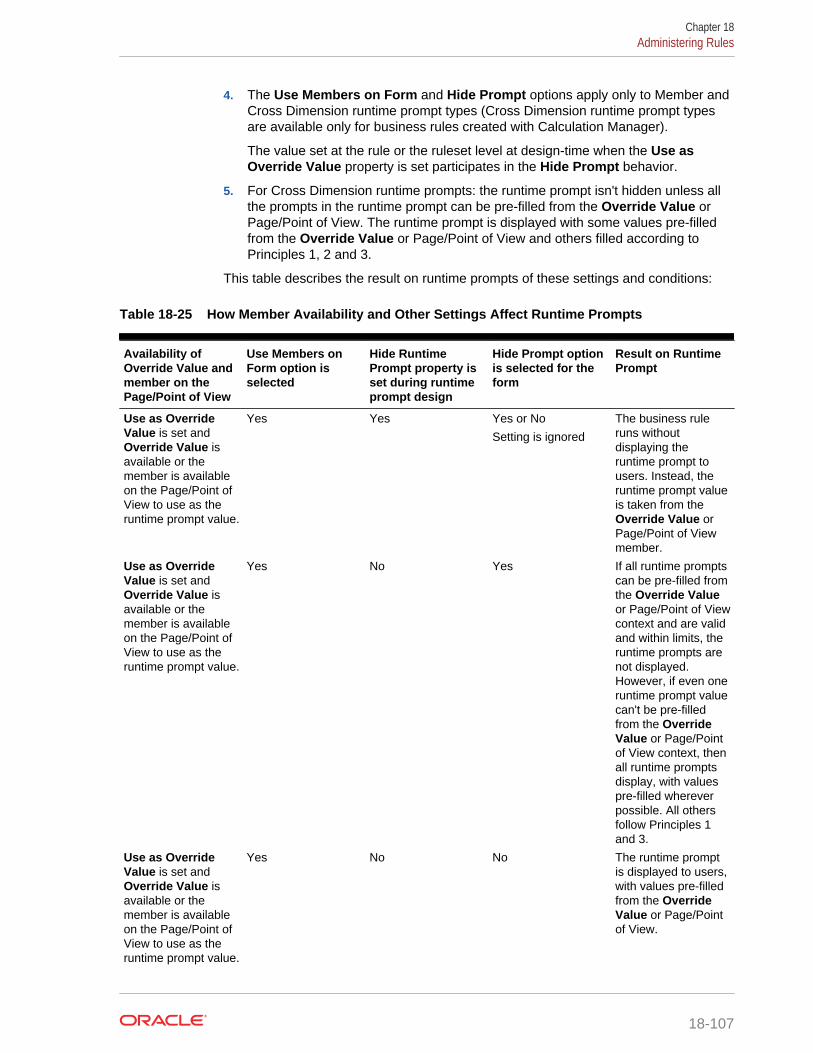
4. The Use Members on Form and Hide Prompt options apply only to Member andCross Dimension runtime prompt types (Cross Dimension runtime prompt typesare available only for business rules created with Calculation Manager).
The value set at the rule or the ruleset level at design-time when the Use asOverride Value property is set participates in the Hide Prompt behavior.
5. For Cross Dimension runtime prompts: the runtime prompt isn't hidden unless allthe prompts in the runtime prompt can be pre-filled from the Override Value orPage/Point of View. The runtime prompt is displayed with some values pre-filledfrom the Override Value or Page/Point of View and others filled according toPrinciples 1, 2 and 3.
This table describes the result on runtime prompts of these settings and conditions:
Table 18-25 How Member Availability and Other Settings Affect Runtime Prompts
Availability ofOverride Value andmember on thePage/Point of View
Use Members onForm option isselected
Hide RuntimePrompt property isset during runtimeprompt design
Hide Prompt optionis selected for theform
Result on RuntimePrompt
Use as OverrideValue is set andOverride Value isavailable or themember is availableon the Page/Point ofView to use as theruntime prompt value.
Yes Yes Yes or No
Setting is ignored
The business ruleruns withoutdisplaying theruntime prompt tousers. Instead, theruntime prompt valueis taken from theOverride Value orPage/Point of Viewmember.
Use as OverrideValue is set andOverride Value isavailable or themember is availableon the Page/Point ofView to use as theruntime prompt value.
Yes No Yes If all runtime promptscan be pre-filled fromthe Override Valueor Page/Point of Viewcontext and are validand within limits, theruntime prompts arenot displayed.However, if even oneruntime prompt valuecan't be pre-filledfrom the OverrideValue or Page/Pointof View context, thenall runtime promptsdisplay, with valuespre-filled whereverpossible. All othersfollow Principles 1and 3.
Use as OverrideValue is set andOverride Value isavailable or themember is availableon the Page/Point ofView to use as theruntime prompt value.
Yes No No The runtime promptis displayed to users,with values pre-filledfrom the OverrideValue or Page/Pointof View.
Chapter 18Administering Rules
18-107
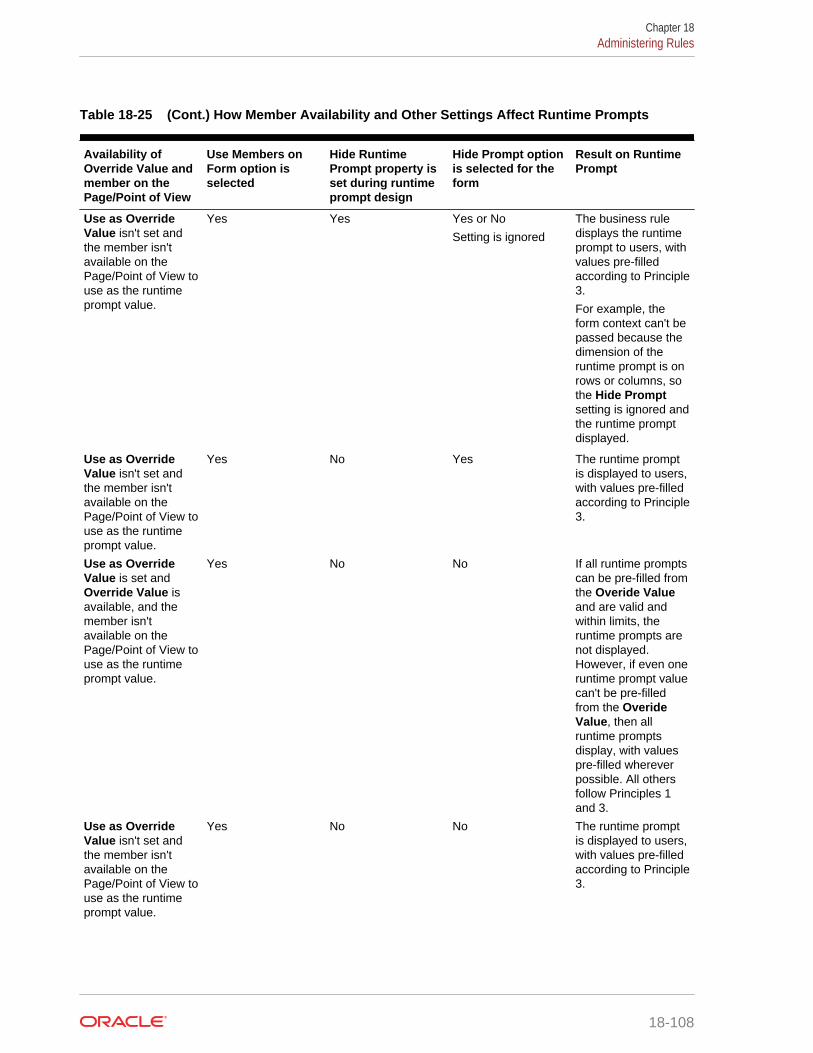
Table 18-25 (Cont.) How Member Availability and Other Settings Affect Runtime Prompts
Availability ofOverride Value andmember on thePage/Point of View
Use Members onForm option isselected
Hide RuntimePrompt property isset during runtimeprompt design
Hide Prompt optionis selected for theform
Result on RuntimePrompt
Use as OverrideValue isn't set andthe member isn'tavailable on thePage/Point of View touse as the runtimeprompt value.
Yes Yes Yes or No
Setting is ignored
The business ruledisplays the runtimeprompt to users, withvalues pre-filledaccording to Principle3.
For example, theform context can't bepassed because thedimension of theruntime prompt is onrows or columns, sothe Hide Promptsetting is ignored andthe runtime promptdisplayed.
Use as OverrideValue isn't set andthe member isn'tavailable on thePage/Point of View touse as the runtimeprompt value.
Yes No Yes The runtime promptis displayed to users,with values pre-filledaccording to Principle3.
Use as OverrideValue is set andOverride Value isavailable, and themember isn'tavailable on thePage/Point of View touse as the runtimeprompt value.
Yes No No If all runtime promptscan be pre-filled fromthe Overide Valueand are valid andwithin limits, theruntime prompts arenot displayed.However, if even oneruntime prompt valuecan't be pre-filledfrom the OverideValue, then allruntime promptsdisplay, with valuespre-filled whereverpossible. All othersfollow Principles 1and 3.
Use as OverrideValue isn't set andthe member isn'tavailable on thePage/Point of View touse as the runtimeprompt value.
Yes No No The runtime promptis displayed to users,with values pre-filledaccording to Principle3.
Chapter 18Administering Rules
18-108
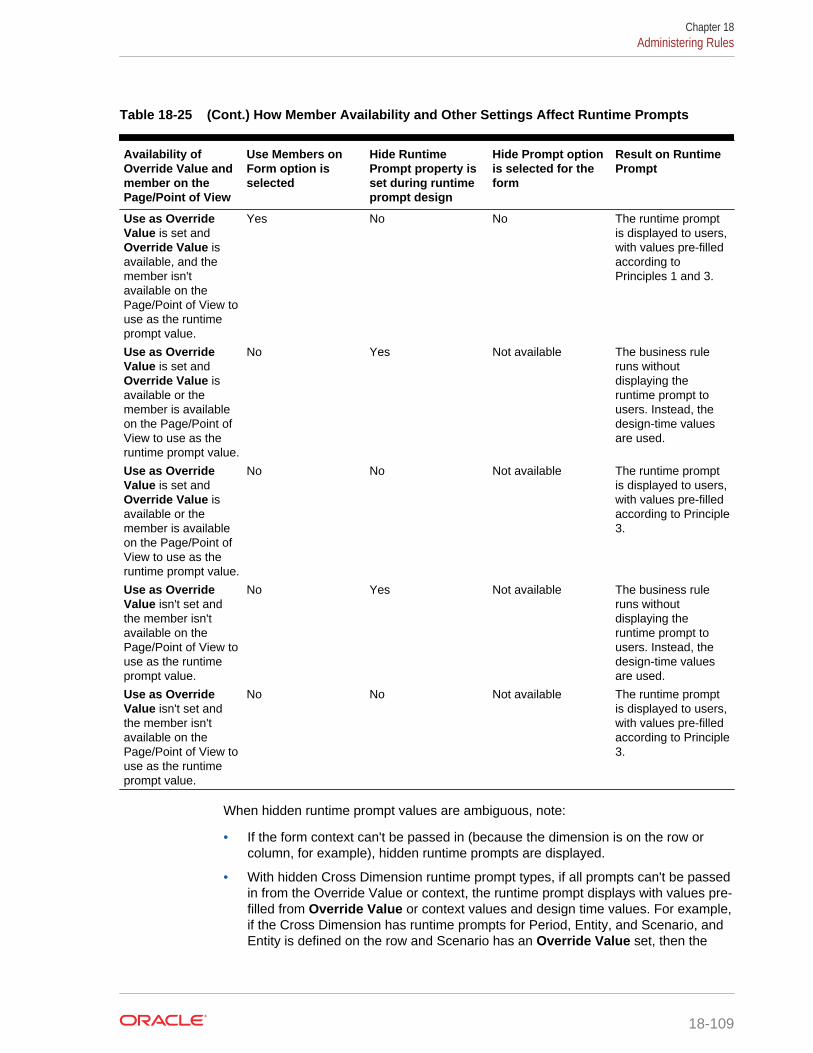
Table 18-25 (Cont.) How Member Availability and Other Settings Affect Runtime Prompts
Availability ofOverride Value andmember on thePage/Point of View
Use Members onForm option isselected
Hide RuntimePrompt property isset during runtimeprompt design
Hide Prompt optionis selected for theform
Result on RuntimePrompt
Use as OverrideValue is set andOverride Value isavailable, and themember isn'tavailable on thePage/Point of View touse as the runtimeprompt value.
Yes No No The runtime promptis displayed to users,with values pre-filledaccording toPrinciples 1 and 3.
Use as OverrideValue is set andOverride Value isavailable or themember is availableon the Page/Point ofView to use as theruntime prompt value.
No Yes Not available The business ruleruns withoutdisplaying theruntime prompt tousers. Instead, thedesign-time valuesare used.
Use as OverrideValue is set andOverride Value isavailable or themember is availableon the Page/Point ofView to use as theruntime prompt value.
No No Not available The runtime promptis displayed to users,with values pre-filledaccording to Principle3.
Use as OverrideValue isn't set andthe member isn'tavailable on thePage/Point of View touse as the runtimeprompt value.
No Yes Not available The business ruleruns withoutdisplaying theruntime prompt tousers. Instead, thedesign-time valuesare used.
Use as OverrideValue isn't set andthe member isn'tavailable on thePage/Point of View touse as the runtimeprompt value.
No No Not available The runtime promptis displayed to users,with values pre-filledaccording to Principle3.
When hidden runtime prompt values are ambiguous, note:
• If the form context can't be passed in (because the dimension is on the row orcolumn, for example), hidden runtime prompts are displayed.
• With hidden Cross Dimension runtime prompt types, if all prompts can't be passedin from the Override Value or context, the runtime prompt displays with values pre-filled from Override Value or context values and design time values. For example,if the Cross Dimension has runtime prompts for Period, Entity, and Scenario, andEntity is defined on the row and Scenario has an Override Value set, then the
Chapter 18Administering Rules
18-109
runtime prompt displays with the Override Scenario, then design time value forEntity, then Page Period.
• If the Override Value is present, or context can be passed in for the runtimeprompt value but it's out of limits, then the runtime prompt is displayed with thecontext value pre-filled.
• If there is more than one runtime prompt of type Member or type Cross Dimensioncombined, then the runtime prompts are displayed with the Override Value orcontext values pre-filled. For example, if there is a member type runtime promptfor the Entity dimension and a Cross Dimension type runtime prompt with oneprompt for the Entity dimension, then both runtime prompts are displayed. Thisrule doesn't apply to Calculation Manager rulesets.
• When launched from the Rules link on the Navigator menu, runtime prompts arehidden and the design-time value (overridden at the rule or ruleset level) is used tolaunch the business rule. If the provided design-time value is out of limits, then theruntime prompt is displayed with the design-time value pre-filled.
• Runtime variables that are hidden during design never use the last saved value.The Use Last Value property is ignored, and the values are not saved to thedatabase.
About Runtime Prompts and Approvals SecurityAdministrators can design runtime prompts to honor Approvals security for members.Doing so prevents planners from changing data in approval units to which they don'thave access, according to Approvals rules. For example, the administrator may notwant planners to change data after they have promoted the related approval unit. InCalculation Manager, administrators can set runtime Security for a member ormembers:
• Approvals—The application allows a user to change member data if both theseconditions are true:
– The user has write access to the members (as assigned in the application).
– If the members belong to an approval unit, the user owns the approval unit.
If both conditions are not met, the user can't change the members' data.
• Write—Users launching the business rule who have write access to the members(as assigned in the application) can change its data. The members' Approvalsstatus is ignored.
• Read—Users launching the business rule have read access to the members (asassigned in the application). Approvals status is ignored.
• Use Default—Security is applied to the runtime prompt only if member accessisn't set to None (that is, either read or write).
See Designing Secure Runtime Prompts.
Designing Secure Runtime PromptsThe application supports runtime security on Scenario, Version, Entity, and secondarydimension intersections by relying on the order in which runtime prompts aredesigned. For the business rule to apply Approvals security, the Calculation Managerdesigner must place runtime prompts for Scenario and Version with Write or Approvalssecurity before the Entity runtime prompt.
Chapter 18Administering Rules
18-110
Runtime prompts for Version and Scenario members are filtered by write access whenSecurity in Calculation Manager is set to either Approvals or Write. Runtime promptsfor Entities with the Security set to Approvals are filtered according to the lastScenario/Version that is displayed before the Entity runtime prompt. If either theScenario or Version runtime prompt doesn't exist, Entities are filtered by write access.
Runtime prompts for other dimensions with Security set to Approvals are consideredto be secondary dimensions and are filtered according to the last Scenario/Version/Entity that displays before that runtime prompt.
So, for runtime prompts using Approvals security defined in this order:
Scenario1: Version2: To_Entity1, Scenario2: Version1, To_Entity2, To_Product
Runtime prompts are filtered as follows:
• To_Entity1 is filtered by the combination—Scenario1: Version2
• To_Entity2 is filtered by the combination—Scenario2: Version1
• To_Product is filtered by the combination—Scenario2, Version1, To_Entity2,To_Product
For example:
Fix (FY11, Jan,{EntitySalesByCountry},{MyScenario2},{MyVersion2})
Fix ({MyProduct},{MyCountry})
{ToAccount} = {FromAccount} * 2;
ENDFIX
Endfix
Note:
If the business rule designer omits an approval unit dimension from the list ofruntime prompts (for example, the runtime prompt doesn't include a Scenarioor Entity), then Approvals security isn't applied and the hierarchy is filtered bywrite access.
See About Runtime Prompts and Approvals Security.
Using Groovy RulesRelated Topics
• About Creating a Groovy Business Rule
• Groovy Business Rule Examples
Chapter 18Administering Rules
18-111
About Creating a Groovy Business Rule
Note:
You can use Groovy rules only for applications of type "Enterprise" (availablewith Enterprise PBCS or PBCS Plus One licenses) or Strategic WorkforcePlanning.
Oracle supports the creation of business rules written in the Groovy scriptinglanguage. Groovy business rules allow you to design sophisticated rules that solve usecases that normal business rules can't solve; for example, rules to prevent users fromsaving data on forms if the data value is above a predefined threshold.
You create Groovy rules in Calculation Manager and execute them from any place thatyou can execute a calc script rule in a Planning application; for example, on the Rulespage, within the context of a form, in the job scheduler, in dashboards, in task lists,and so on. Groovy rules are also supported in rulesets. You can have a combination ofcalc script rules and Groovy rules within a ruleset.
Oracle supports two types of Groovy rules:
• Rules that can dynamically generate calc scripts at runtime based on context otherthan the runtime prompts and return the calc script which is then executed againstEssbase.
For example, you could create a rule to calculate expenses for projects only for theduration (start and end dates) of the project.
Another example is a trend-based calculation that restricts the calculation to theaccounts available on the form. You could use this calculation for various forms inRevenue, Expense, Balance Sheet, and Cash Flow. This allows for optimizationand reuse.
• Pure Groovy rules that can, for example, perform data validations and cancel theoperation if the data entered violates company policies.
Chapter 18Administering Rules
18-112
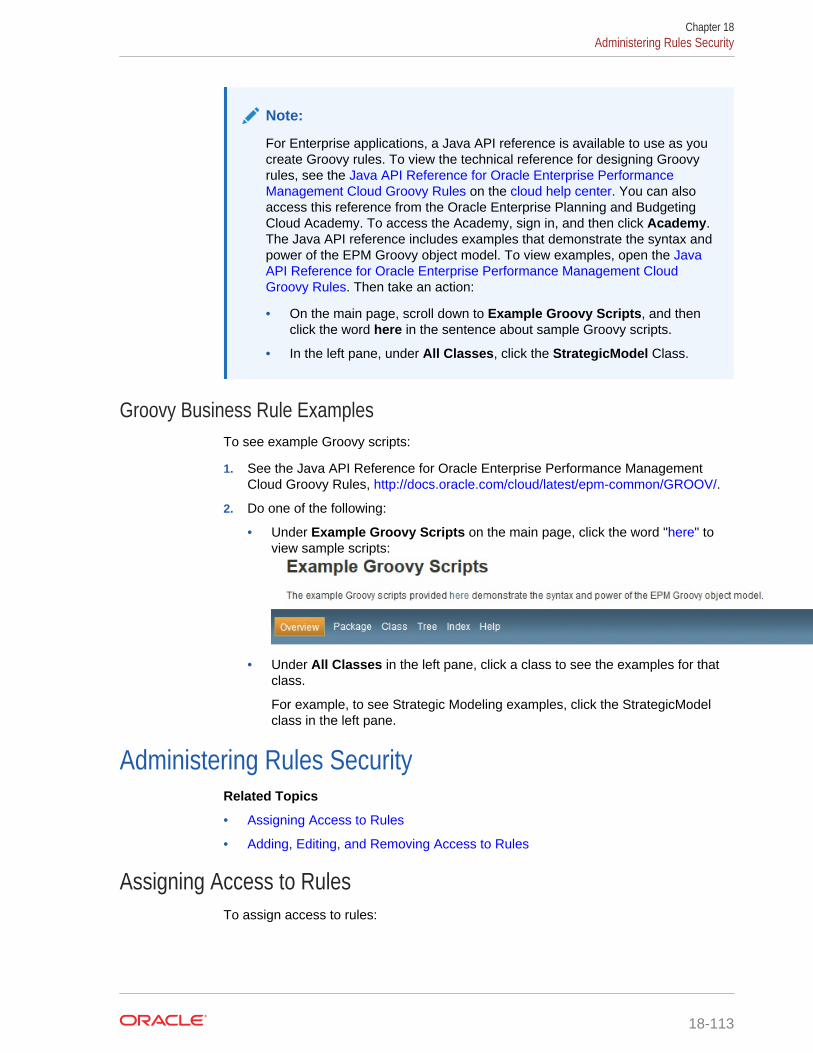
Note:
For Enterprise applications, a Java API reference is available to use as youcreate Groovy rules. To view the technical reference for designing Groovyrules, see the Java API Reference for Oracle Enterprise PerformanceManagement Cloud Groovy Rules on the cloud help center. You can alsoaccess this reference from the Oracle Enterprise Planning and BudgetingCloud Academy. To access the Academy, sign in, and then click Academy.The Java API reference includes examples that demonstrate the syntax andpower of the EPM Groovy object model. To view examples, open the JavaAPI Reference for Oracle Enterprise Performance Management CloudGroovy Rules. Then take an action:
• On the main page, scroll down to Example Groovy Scripts, and thenclick the word here in the sentence about sample Groovy scripts.
• In the left pane, under All Classes, click the StrategicModel Class.
Groovy Business Rule ExamplesTo see example Groovy scripts:
1. See the Java API Reference for Oracle Enterprise Performance ManagementCloud Groovy Rules, http://docs.oracle.com/cloud/latest/epm-common/GROOV/.
2. Do one of the following:
• Under Example Groovy Scripts on the main page, click the word "here" toview sample scripts:
• Under All Classes in the left pane, click a class to see the examples for thatclass.
For example, to see Strategic Modeling examples, click the StrategicModelclass in the left pane.
Administering Rules SecurityRelated Topics
• Assigning Access to Rules
• Adding, Editing, and Removing Access to Rules
Assigning Access to RulesTo assign access to rules:
Chapter 18Administering Rules Security
18-113
1. Click the Navigator icon , and then under Create and Manage, click RulesSecurity.
2. Under Business Rule Folders, select the folder containing the rules, and thenselect the rules.
3. Click .
4. Add, edit, or remove access.
See Adding, Editing, and Removing Access to Rules.
Adding, Editing, and Removing Access to RulesYou can specify which users and groups can access the selected rule.
Note:
Rulesets inherit launch permissions from the rules included in the ruleset.
To assign, edit, and remove access permissions to rules:
1. Click the Navigator icon , and then under Create and Manage, click RulesSecurity.
2. Under Business Rule Folders, select the folder containing the rules, and thenselect the rules.
3. Click .
4. Perform a task:
• To add access, click , and then select from the list of available users andgroups.
For Type of Access:
– Select Launch to allow the selected users and groups to launch theselected rules.
– Select No Launch to prevent the selected users and groups fromlaunching the selected rules.
• To edit access, click , and then select the applicable Type of Access.
• To remove access, select the users or groups for which to remove access,
and then click .
Administering Smart ListsRelated Topics
• Working with Smart Lists
• Adding or Changing Smart List Properties
Chapter 18Administering Smart Lists
18-114
• Adding or Changing Smart List Entries
• Previewing Smart Lists
• Displaying #MISSING with Smart Lists
Working with Smart ListsAdministrators use Smart Lists to create custom drop-down lists that users accessfrom form cells. When clicking in cells whose members are associated with a SmartList (as a member property), users select items from drop-down lists instead ofentering data. Users can't type in cells that contain Smart Lists. Smart Lists display incells as down arrows that expand when users click into the cells.
Perform these tasks to create and administer Smart Lists:
• Define Smart Lists, described here.
• Associate Smart Lists with members.
• Select dimensions for which Smart Lists are displayed.
• Optionally:
– Use Smart List values in member formulas.
– Set how #MISSING cells associated with Smart Lists display in forms.
– Synchronize Smart Lists in reporting applications
To create or work with Smart Lists:
1. Click the Navigator icon , and then under Create and Manage, click SmartLists.
2. Perform one action:
• To create a Smart List, click .
• To change a Smart List, select it and click .
Note:
For descriptions of the Smart List properties, see Adding orChanging Smart List Properties.
• To delete Smart Lists, select them, click , and then click OK. DeletingSmart lists also deletes any associated mappings with dimension membersand reporting applications.
Data cells can display only one Smart List. If multiple Smart Lists intersect atcells, set which one takes precedence.
• Optional: Click to synchronize Smart Lists between an application thatuses Planning application administration and a reporting application. See Synchronizing Smart Lists in Reporting Applications.
Chapter 18Administering Smart Lists
18-115
Adding or Changing Smart List PropertiesUse the Edit Smart List Properties tab to set Smart List properties.
To set Smart List properties:
1. Click the Navigator icon , and then under Create and Manage, click SmartLists.
2. Select a Smart List and click .
3. Define Smart List properties on the Properties tab:
Table 18-26 Smart List Properties
Property Description
Smart List Enter a unique name containing onlyalphanumeric and underscore characters(for example: Position) and no specialcharacters or spaces. Smart List names canbe referenced in formula expressions.
Label Enter the text to display when the Smart Listis selected. Spaces and special charactersare allowed.
Display Order How Smart Lists are sorted in the drop-down list: by ID, Name, or Label
#MISSING Drop-Down Label Enter a label (for example, "NoJustification") to be displayed as an entry inthe Smart List whose value is #MISSING.
Note the following:
• It displays as the first selection in theSmart List drop-down, allowing#MISSING as a selection in the form.
• When the cell isn't in focus, this labeldisplays only if Drop-Down Setting isselected in the next option. Otherwise,#MISSING or a blank cell is displayed,depending on the Display MissingValues As Blank selection for the form.
• #MISSING labels determine only thedisplay of cells with #MISSING data;#MISSING remains the stored value.
Chapter 18Administering Smart Lists
18-116
Table 18-26 (Cont.) Smart List Properties
Property Description
#MISSING Form Label Determines how #MISSING values arerepresented in cells associated with SmartLists. Options:
• Drop-Down Setting—Displays thelabel set in #MISSING Drop-DownLabel.
• Form Setting—Displays #MISSING orleaves cells blank, depending on theDisplay Missing Values As Blankselection for the form. This selectiondetermines what is displayed in the cellwhen it's not the focus. When the cell isin focus, the Smart List item that isselected from the drop-down isdisplayed.
Automatically Generate ID Generate a numeric ID for each Smart Listentry. If you don't select this option, you cancustomize Smart List ID values.
Create from Members Create a Smart List based on dimensionhierarchies. Smart List values aredynamically updated when members areupdated.
Note:
User security for the dimension ishonored for Smart Lists createdfrom the dimension's hierarchy.
Member Selection
4. Click Save.
5. Select Entries.
Use the Entries tab to define selections on Smart Lists. See Adding or ChangingSmart List Entries.
Adding or Changing Smart List EntriesUse the Entries tab to define the selections in the Smart List.
To define Smart List entries:
1. Click the Navigator icon , and then under Create and Manage, click SmartLists.
2. Select a Smart List and click .
3. On Entries, define drop-down list items:
• For first items only: enter information into the first row.
Chapter 18Administering Smart Lists
18-117
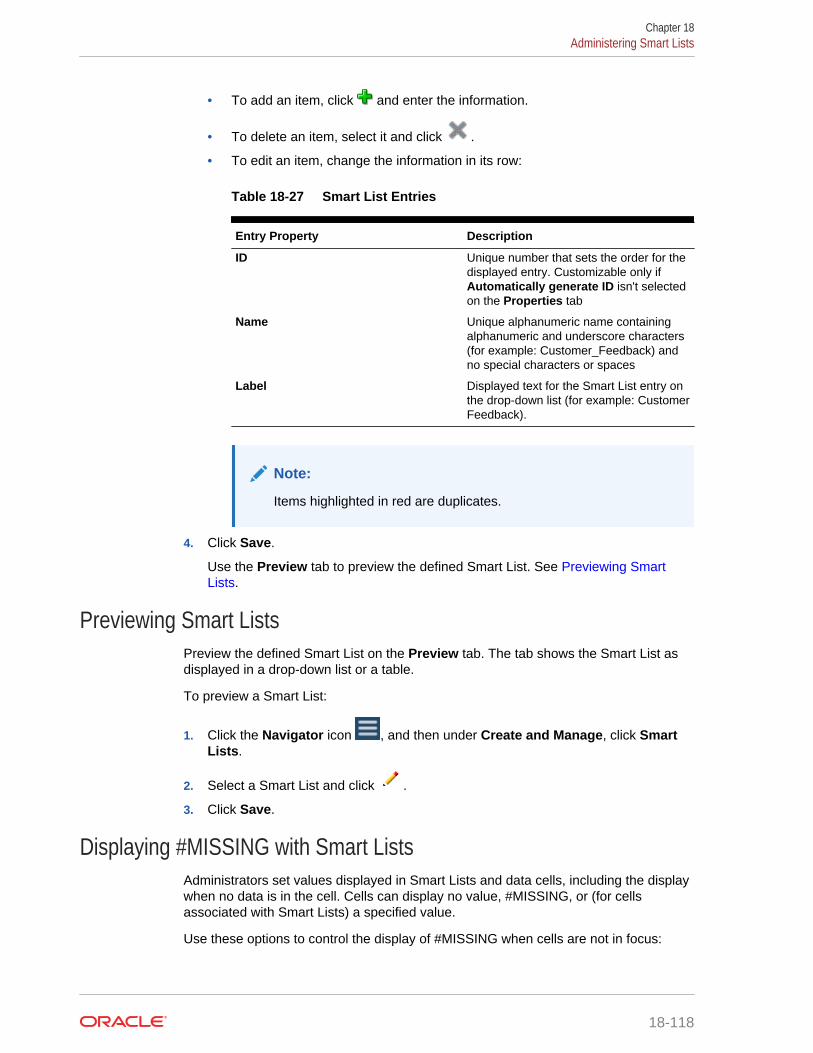
• To add an item, click and enter the information.
• To delete an item, select it and click .
• To edit an item, change the information in its row:
Table 18-27 Smart List Entries
Entry Property Description
ID Unique number that sets the order for thedisplayed entry. Customizable only ifAutomatically generate ID isn't selectedon the Properties tab
Name Unique alphanumeric name containingalphanumeric and underscore characters(for example: Customer_Feedback) andno special characters or spaces
Label Displayed text for the Smart List entry onthe drop-down list (for example: CustomerFeedback).
Note:
Items highlighted in red are duplicates.
4. Click Save.
Use the Preview tab to preview the defined Smart List. See Previewing SmartLists.
Previewing Smart ListsPreview the defined Smart List on the Preview tab. The tab shows the Smart List asdisplayed in a drop-down list or a table.
To preview a Smart List:
1. Click the Navigator icon , and then under Create and Manage, click SmartLists.
2. Select a Smart List and click .
3. Click Save.
Displaying #MISSING with Smart ListsAdministrators set values displayed in Smart Lists and data cells, including the displaywhen no data is in the cell. Cells can display no value, #MISSING, or (for cellsassociated with Smart Lists) a specified value.
Use these options to control the display of #MISSING when cells are not in focus:
Chapter 18Administering Smart Lists
18-118
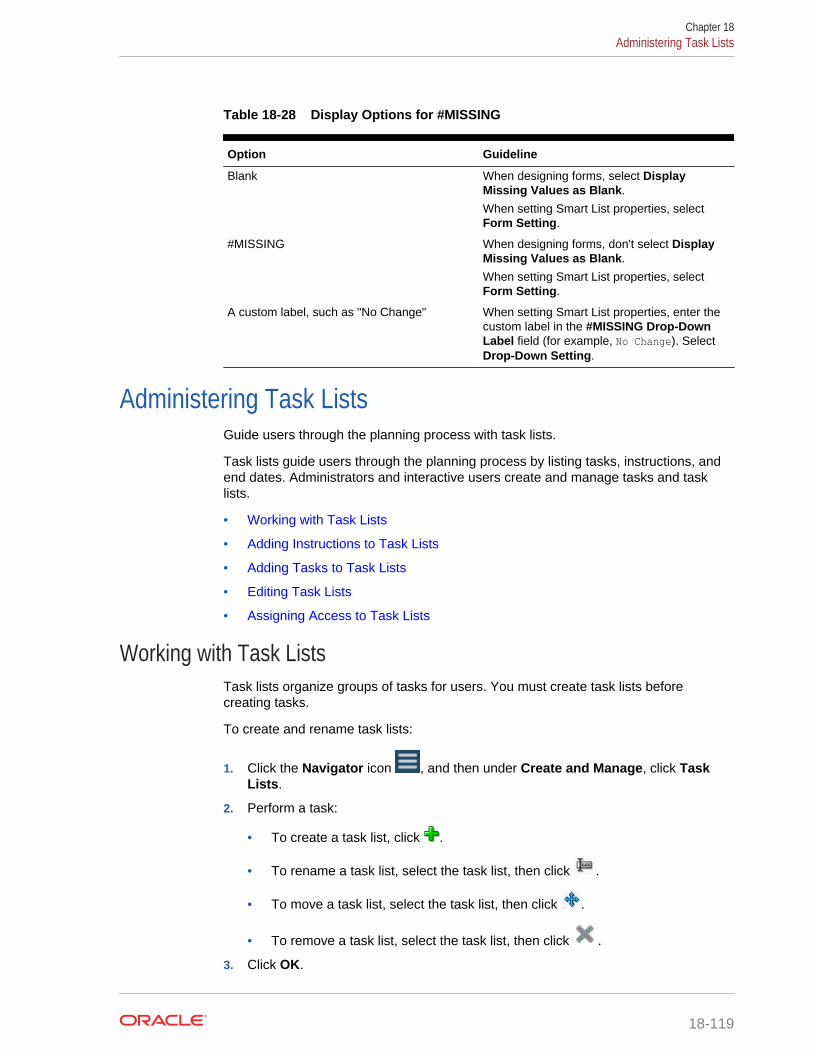
Table 18-28 Display Options for #MISSING
Option Guideline
Blank When designing forms, select DisplayMissing Values as Blank.
When setting Smart List properties, selectForm Setting.
#MISSING When designing forms, don't select DisplayMissing Values as Blank.
When setting Smart List properties, selectForm Setting.
A custom label, such as "No Change" When setting Smart List properties, enter thecustom label in the #MISSING Drop-DownLabel field (for example, No Change). SelectDrop-Down Setting.
Administering Task ListsGuide users through the planning process with task lists.
Task lists guide users through the planning process by listing tasks, instructions, andend dates. Administrators and interactive users create and manage tasks and tasklists.
• Working with Task Lists
• Adding Instructions to Task Lists
• Adding Tasks to Task Lists
• Editing Task Lists
• Assigning Access to Task Lists
Working with Task ListsTask lists organize groups of tasks for users. You must create task lists beforecreating tasks.
To create and rename task lists:
1. Click the Navigator icon , and then under Create and Manage, click TaskLists.
2. Perform a task:
• To create a task list, click .
• To rename a task list, select the task list, then click .
• To move a task list, select the task list, then click .
• To remove a task list, select the task list, then click .
3. Click OK.
Chapter 18Administering Task Lists
18-119
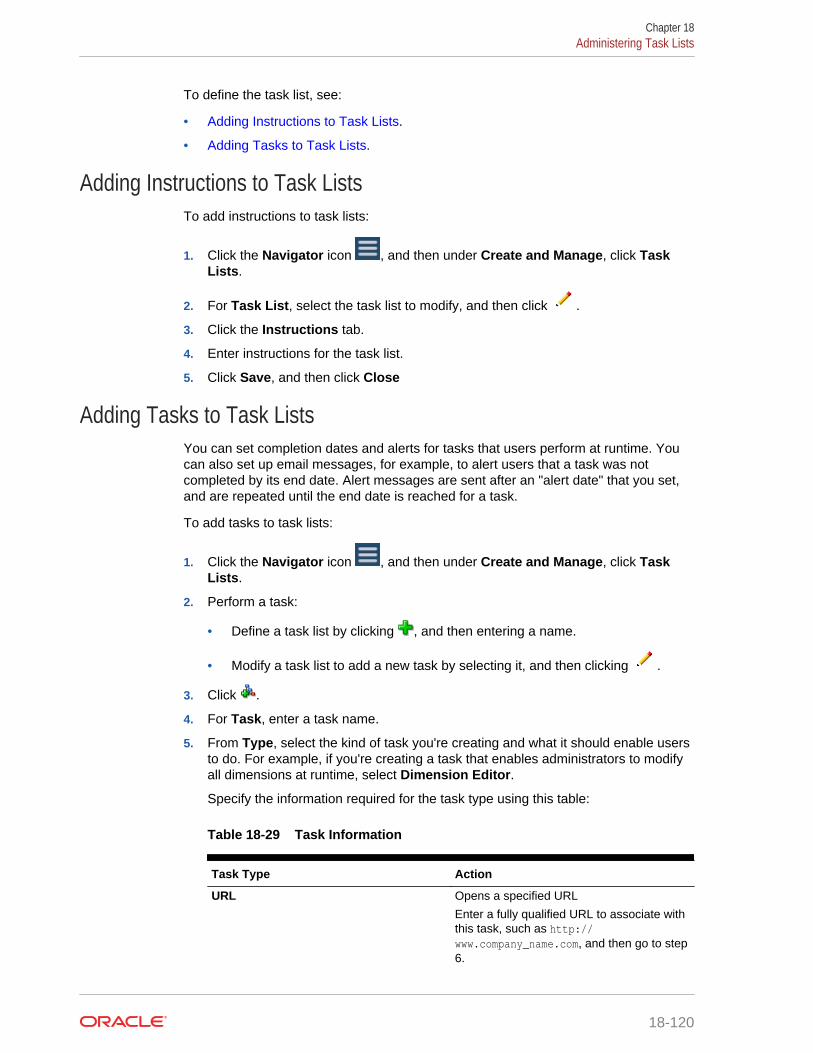
To define the task list, see:
• Adding Instructions to Task Lists.
• Adding Tasks to Task Lists.
Adding Instructions to Task ListsTo add instructions to task lists:
1. Click the Navigator icon , and then under Create and Manage, click TaskLists.
2. For Task List, select the task list to modify, and then click .
3. Click the Instructions tab.
4. Enter instructions for the task list.
5. Click Save, and then click Close
Adding Tasks to Task ListsYou can set completion dates and alerts for tasks that users perform at runtime. Youcan also set up email messages, for example, to alert users that a task was notcompleted by its end date. Alert messages are sent after an "alert date" that you set,and are repeated until the end date is reached for a task.
To add tasks to task lists:
1. Click the Navigator icon , and then under Create and Manage, click TaskLists.
2. Perform a task:
• Define a task list by clicking , and then entering a name.
• Modify a task list to add a new task by selecting it, and then clicking .
3. Click .
4. For Task, enter a task name.
5. From Type, select the kind of task you're creating and what it should enable usersto do. For example, if you're creating a task that enables administrators to modifyall dimensions at runtime, select Dimension Editor.
Specify the information required for the task type using this table:
Table 18-29 Task Information
Task Type Action
URL Opens a specified URL
Enter a fully qualified URL to associate withthis task, such as http://www.company_name.com, and then go to step6.
Chapter 18Administering Task Lists
18-120
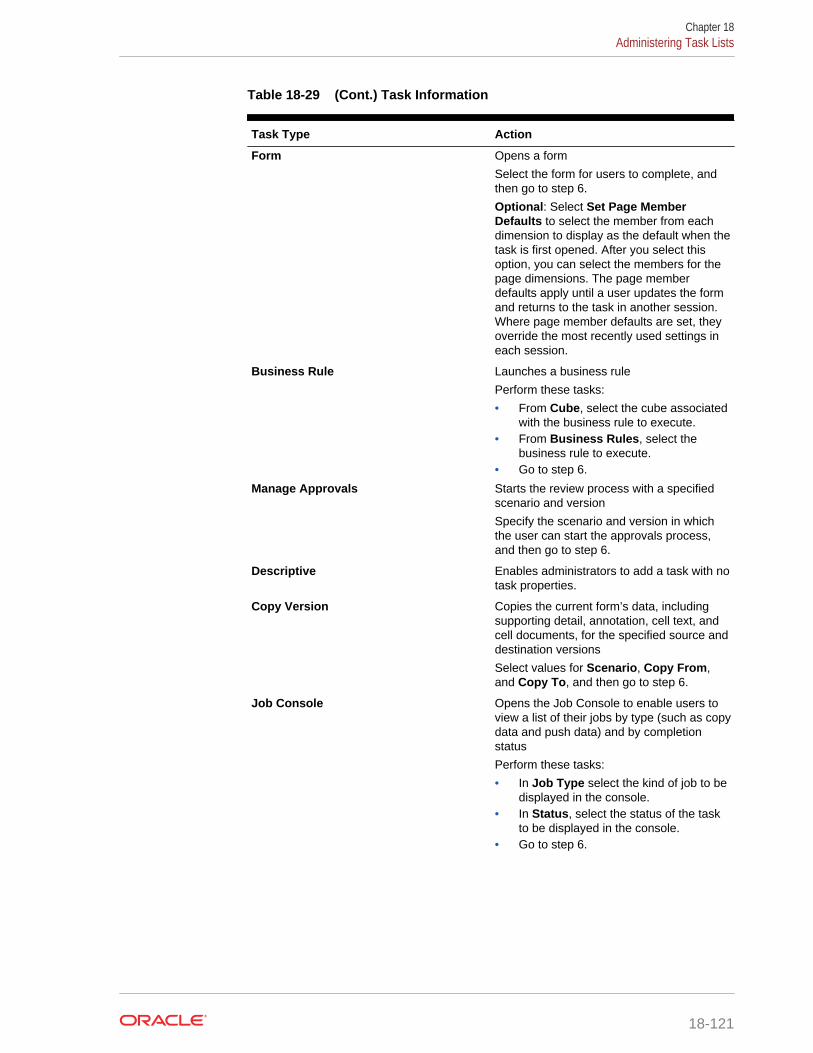
Table 18-29 (Cont.) Task Information
Task Type Action
Form Opens a form
Select the form for users to complete, andthen go to step 6.
Optional: Select Set Page MemberDefaults to select the member from eachdimension to display as the default when thetask is first opened. After you select thisoption, you can select the members for thepage dimensions. The page memberdefaults apply until a user updates the formand returns to the task in another session.Where page member defaults are set, theyoverride the most recently used settings ineach session.
Business Rule Launches a business rule
Perform these tasks:
• From Cube, select the cube associatedwith the business rule to execute.
• From Business Rules, select thebusiness rule to execute.
• Go to step 6.
Manage Approvals Starts the review process with a specifiedscenario and version
Specify the scenario and version in whichthe user can start the approvals process,and then go to step 6.
Descriptive Enables administrators to add a task with notask properties.
Copy Version Copies the current form’s data, includingsupporting detail, annotation, cell text, andcell documents, for the specified source anddestination versions
Select values for Scenario, Copy From,and Copy To, and then go to step 6.
Job Console Opens the Job Console to enable users toview a list of their jobs by type (such as copydata and push data) and by completionstatus
Perform these tasks:
• In Job Type select the kind of job to bedisplayed in the console.
• In Status, select the status of the taskto be displayed in the console.
• Go to step 6.
Chapter 18Administering Task Lists
18-121
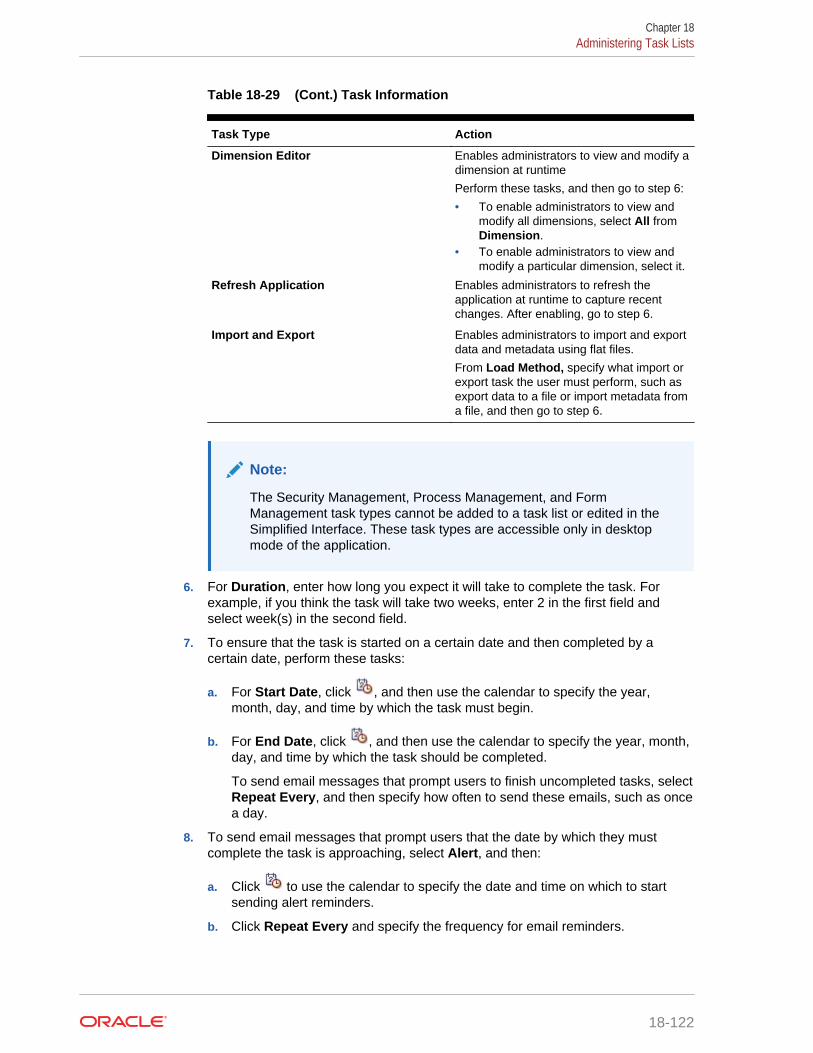
Table 18-29 (Cont.) Task Information
Task Type Action
Dimension Editor Enables administrators to view and modify adimension at runtime
Perform these tasks, and then go to step 6:
• To enable administrators to view andmodify all dimensions, select All fromDimension.
• To enable administrators to view andmodify a particular dimension, select it.
Refresh Application Enables administrators to refresh theapplication at runtime to capture recentchanges. After enabling, go to step 6.
Import and Export Enables administrators to import and exportdata and metadata using flat files.
From Load Method, specify what import orexport task the user must perform, such asexport data to a file or import metadata froma file, and then go to step 6.
Note:
The Security Management, Process Management, and FormManagement task types cannot be added to a task list or edited in theSimplified Interface. These task types are accessible only in desktopmode of the application.
6. For Duration, enter how long you expect it will take to complete the task. Forexample, if you think the task will take two weeks, enter 2 in the first field andselect week(s) in the second field.
7. To ensure that the task is started on a certain date and then completed by acertain date, perform these tasks:
a. For Start Date, click , and then use the calendar to specify the year,month, day, and time by which the task must begin.
b. For End Date, click , and then use the calendar to specify the year, month,day, and time by which the task should be completed.
To send email messages that prompt users to finish uncompleted tasks, selectRepeat Every, and then specify how often to send these emails, such as oncea day.
8. To send email messages that prompt users that the date by which they mustcomplete the task is approaching, select Alert, and then:
a. Click to use the calendar to specify the date and time on which to startsending alert reminders.
b. Click Repeat Every and specify the frequency for email reminders.
Chapter 18Administering Task Lists
18-122
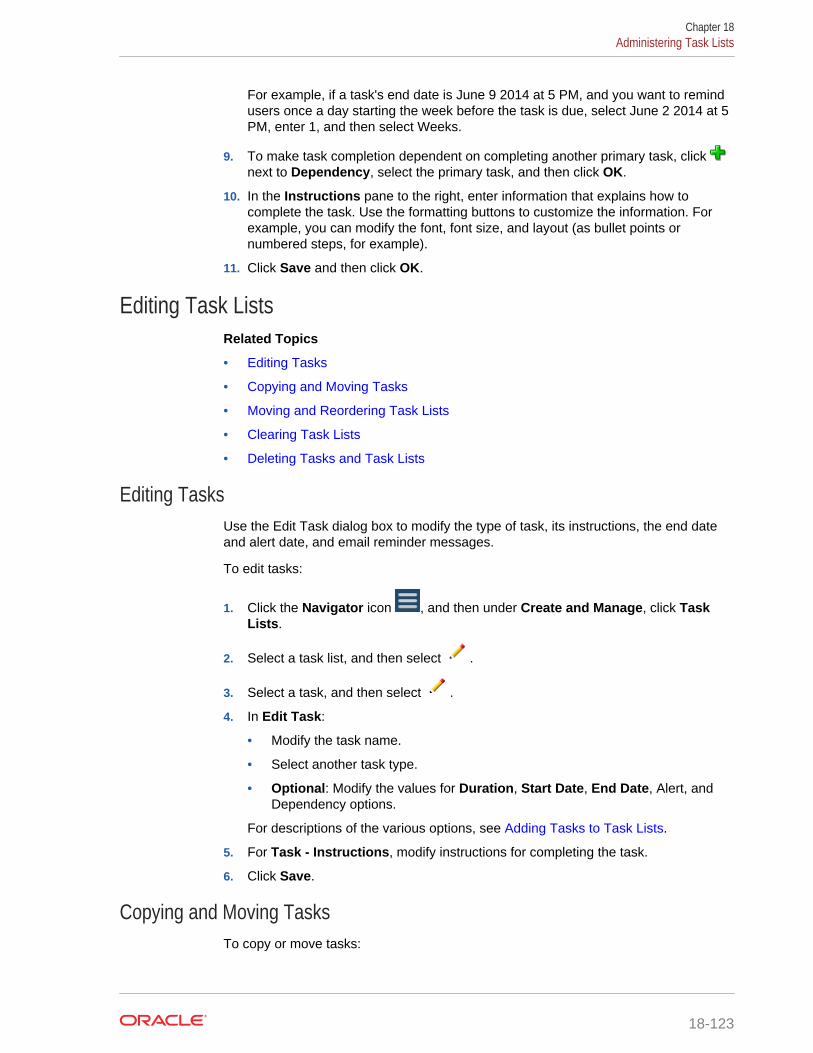
For example, if a task's end date is June 9 2014 at 5 PM, and you want to remindusers once a day starting the week before the task is due, select June 2 2014 at 5PM, enter 1, and then select Weeks.
9. To make task completion dependent on completing another primary task, click next to Dependency, select the primary task, and then click OK.
10. In the Instructions pane to the right, enter information that explains how tocomplete the task. Use the formatting buttons to customize the information. Forexample, you can modify the font, font size, and layout (as bullet points ornumbered steps, for example).
11. Click Save and then click OK.
Editing Task ListsRelated Topics
• Editing Tasks
• Copying and Moving Tasks
• Moving and Reordering Task Lists
• Clearing Task Lists
• Deleting Tasks and Task Lists
Editing TasksUse the Edit Task dialog box to modify the type of task, its instructions, the end dateand alert date, and email reminder messages.
To edit tasks:
1. Click the Navigator icon , and then under Create and Manage, click TaskLists.
2. Select a task list, and then select .
3. Select a task, and then select .
4. In Edit Task:
• Modify the task name.
• Select another task type.
• Optional: Modify the values for Duration, Start Date, End Date, Alert, andDependency options.
For descriptions of the various options, see Adding Tasks to Task Lists.
5. For Task - Instructions, modify instructions for completing the task.
6. Click Save.
Copying and Moving TasksTo copy or move tasks:
Chapter 18Administering Task Lists
18-123
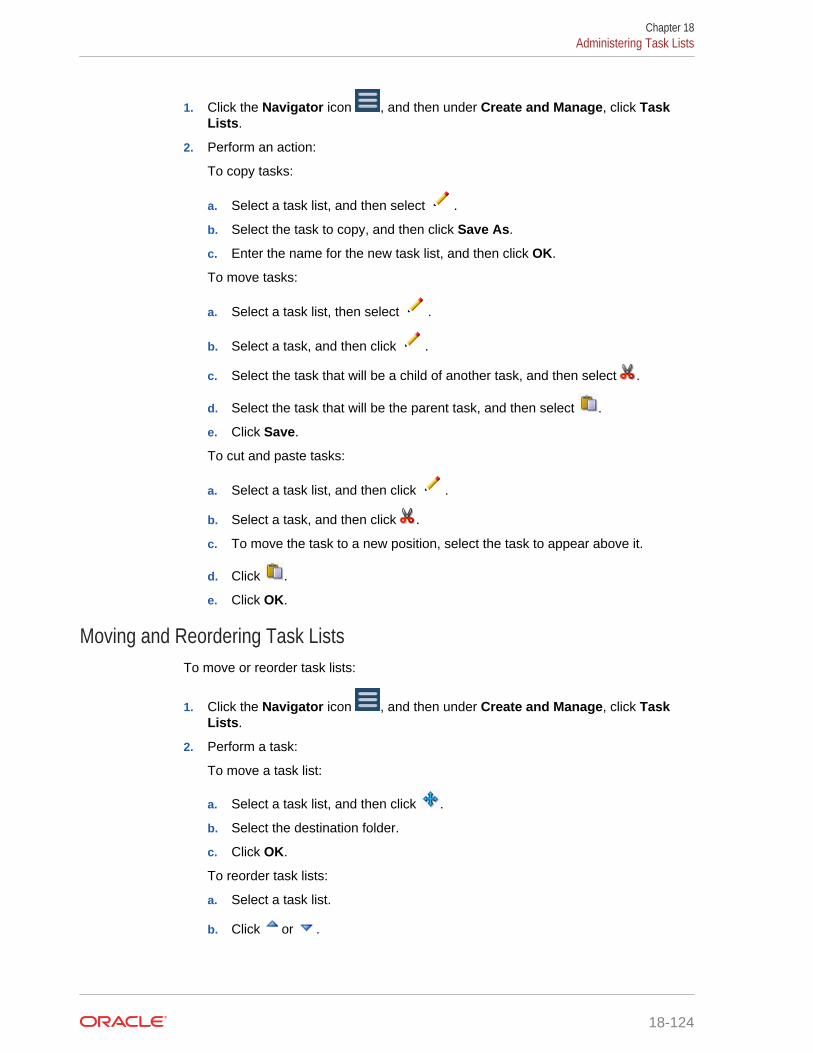
1. Click the Navigator icon , and then under Create and Manage, click TaskLists.
2. Perform an action:
To copy tasks:
a. Select a task list, and then select .
b. Select the task to copy, and then click Save As.
c. Enter the name for the new task list, and then click OK.
To move tasks:
a. Select a task list, then select .
b. Select a task, and then click .
c. Select the task that will be a child of another task, and then select .
d. Select the task that will be the parent task, and then select .
e. Click Save.
To cut and paste tasks:
a. Select a task list, and then click .
b. Select a task, and then click .
c. To move the task to a new position, select the task to appear above it.
d. Click .
e. Click OK.
Moving and Reordering Task ListsTo move or reorder task lists:
1. Click the Navigator icon , and then under Create and Manage, click TaskLists.
2. Perform a task:
To move a task list:
a. Select a task list, and then click .
b. Select the destination folder.
c. Click OK.
To reorder task lists:
a. Select a task list.
b. Click or .
Chapter 18Administering Task Lists
18-124
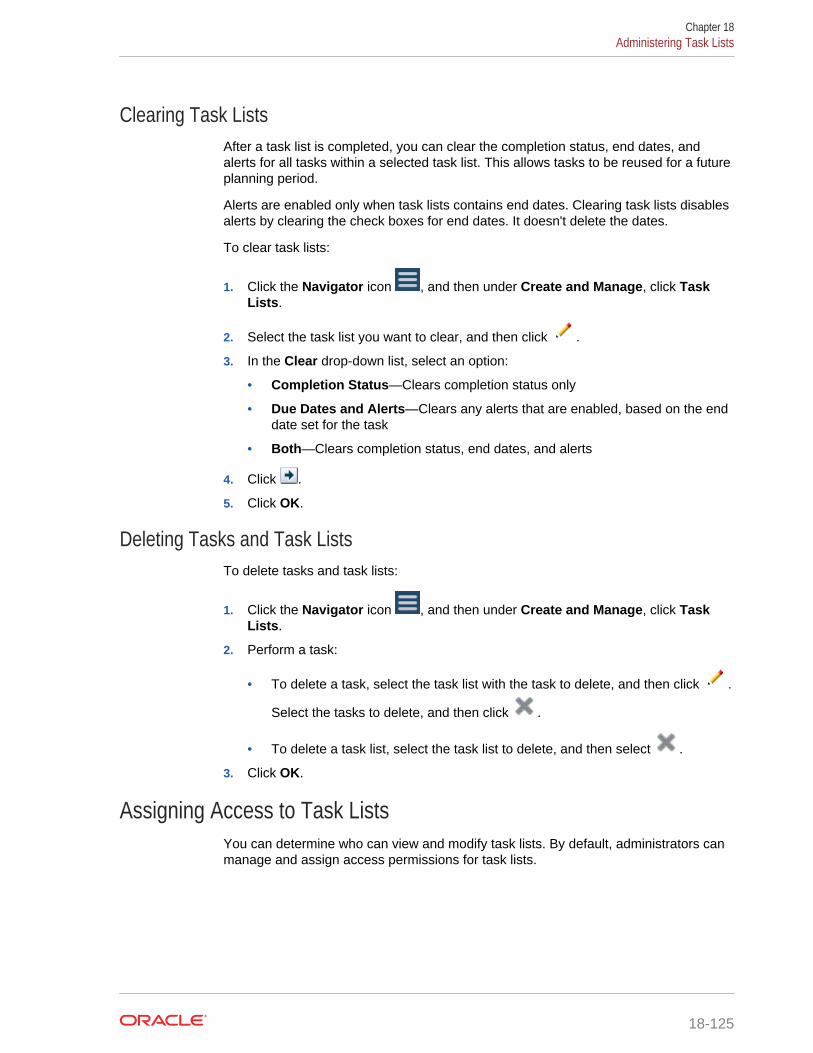
Clearing Task ListsAfter a task list is completed, you can clear the completion status, end dates, andalerts for all tasks within a selected task list. This allows tasks to be reused for a futureplanning period.
Alerts are enabled only when task lists contains end dates. Clearing task lists disablesalerts by clearing the check boxes for end dates. It doesn't delete the dates.
To clear task lists:
1. Click the Navigator icon , and then under Create and Manage, click TaskLists.
2. Select the task list you want to clear, and then click .
3. In the Clear drop-down list, select an option:
• Completion Status—Clears completion status only
• Due Dates and Alerts—Clears any alerts that are enabled, based on the enddate set for the task
• Both—Clears completion status, end dates, and alerts
4. Click .
5. Click OK.
Deleting Tasks and Task ListsTo delete tasks and task lists:
1. Click the Navigator icon , and then under Create and Manage, click TaskLists.
2. Perform a task:
• To delete a task, select the task list with the task to delete, and then click .
Select the tasks to delete, and then click .
• To delete a task list, select the task list to delete, and then select .
3. Click OK.
Assigning Access to Task ListsYou can determine who can view and modify task lists. By default, administrators canmanage and assign access permissions for task lists.
Chapter 18Administering Task Lists
18-125
Note:
Being assigned to a task list means being able to access and complete tasksin the task list. It doesn't mean being able to assign tasks to someone else.
• Adding Access to Task Lists
• Changing and Removing Access to Task Lists
Adding Access to Task ListsTo assign access to task lists:
1. Click the Navigator icon , and then under Create and Manage, click TaskLists.
2. Select the task list to modify.
3. Click .
4. Click .
5. Select the users or groups to access the task list.
• Click Users to display all user names; click Groups to display all groups.
• If there are multiple pages of users and groups, type the page number to go toin Page, and click Go.
• Click Start or End to navigate to the first or last page.
• Click Prev or Next to move to the previous or next page.
6. For Type of Access, select how users or groups can use the task list:
• Assigned—View and use
• Manage—Modify
• Manage and Assign—View, use, and modify
• None—No access
7. Click Add.
8. Click Close.
Changing and Removing Access to Task ListsTo change or remove access to task lists:
1. Click the Navigator icon , and then under Create and Manage, click TaskLists.
2. Select the task list to modify, then click .
3. Perform a task:
To change access to task lists:
Chapter 18Administering Task Lists
18-126
a. Select users or groups, and click .
b. For Type of Access, select:
• Assigned—View and use
• Manage—Modify
• Manage and Assign—View, use, and modify
• None—No access
c. Click Set.
To remove access to task lists:
a. Select the user or group, and click .
b. Click OK.
4. Click Close.
Setting User PreferencesAdministrators specify defaults for the current application. However, users canoverride these application defaults by setting preferences on the Preferences page.
To set user preferences:
1. Click the Navigator icon , and then under Create and Manage, clickPreferences.
2. Perform an action:
• Select Application Settings to manage email options, specify alias settings,set options for approvals, and specify out of office settings.
• Select Display Options to set number formatting, remember selected pagemembers, allow a search if the number of pages exceeds a number youspecify, set member indentation, use consolidation operators, partial gridfetch, specify date formats, enable high contrast, and to add a user image.
• Select Printing Options to specify how pages are printed. You can selectfrom print options such as data format, applying precision, including supportingdetail, and showing account annotations, comments, attribute members, andcurrency codes.
• Select User Variables Options to limit the number of members that displayon a form by setting a user variable. See Working with User Variables.
3. To restore application defaults, select Use Application Default where available.
Administering VariablesRelated Topics
• Working with Substitution Variables
• Working with User Variables
Chapter 18Setting User Preferences
18-127
Working with Substitution VariablesRelated Topics
• About Substitution Variables
• Creating and Assigning Values to Substitution Variables
• Deleting Substitution Variables
About Substitution VariablesSubstitution variables act as global placeholders for information that changesregularly. For example, you could set the current month member to the substitutionvariable CurMnth so that when the month changes, you need not update the monthvalue manually in the form or the report script. You create and assign values tosubstitution variables within the application. These substitution variables are thenavailable in the application when you select members for a form.
For more information about selecting substitution variables, see Selecting SubstitutionVariables as Members.
Note:
If you migrated an application that uses Global variables, you can view, butnot edit, them in the application.
Creating and Assigning Values to Substitution VariablesTo create a substitution variable and assign values to it:
1. Click the Navigator icon , and then under Create and Manage, clickVariables.
2. Select the Substitution Variables tab.
3. Click .
4. On the Add Substitution Variable page, select the Cube.
5. For Name, enter the name of the substitution variable (up to 80 characters).
6. For Value, enter a value for the substitution variable (up to 255 characters).
You can specify a range of values when defining substitution variables; forexample, FY16:FY18.
Chapter 18Administering Variables
18-128
Note:
You can define a substitution variable range for base members andparent members. For base members, you can use a single colon (:) or adouble colon (::) as delimiters; for example, SunEnT 110::111. Howeverfor parent members, you can only use a single colon (:).
7. Click OK.
Deleting Substitution VariablesTo delete substitution variables:
1. Click the Navigator icon , and then under Create and Manage, clickVariables.
2. Select the Substitution Variables tab.
3. Select the substitution variable to delete.
4. Click Actions, then select Delete.
5. Click Yes.
Working with User VariablesRelated Topics
• About User Variables
• Managing User Variables
• Creating User Variables
• Setting Limits for User Variables on Forms
• Deleting User Variables
About User VariablesUser variables act as filters in forms, enabling planners to focus only on certainmembers, such as a department. Before you can associate a user variable with aform, you must create the user variable. When you create forms with user variables,planners must first select values in preferences for the variable before opening forms.Afterward, planners can change the variable on the form only if it's a dynamic uservariables. Otherwise, they must continue to set the variable in preferences. Forexample, if you create a user variable called Division, planners must select a divisionbefore working in the form.
Chapter 18Administering Variables
18-129
Tip:
Attributes are another way to filter forms. But instead of explicitly filtering byan attribute (like Red), you can create a user variable for the attributedimension, and then use the user variable as the filter. Then you can enablethe user variable as a dynamic user variable which allows users to changethe value of the filter at runtime. This is a useful technique that allows fordynamic filtering.
The first time planners select a variable for a form, they do so in preferences.Afterward, they can update the variable in preferences or in the form. For informationabout selecting user variables as members, see Selecting User Variables asMembers.
Managing User VariablesYou can set user variables to limit the number of members displayed on a form,helping users focus on certain members. For example, if you create a user variablecalled Division for the Entity dimension, users can select a member for their owndivision. You can create any number of user variables for each dimension (includingattribute dimensions), and select user variables for any axis in the form. See DefiningSimple Form Page and Point of View.
The typical sequence of steps:
1. If necessary, create the appropriate parent-level members in the dimensionoutline.
2. Define user variables for each dimension you want users to be able to filter(including attribute dimensions).
See Creating User Variables.
3. When designing the form, associate the user variable with the form.
See Selecting User Variables as Members.
4. Instruct users to select a member for the user variable associated with the form.
Before users can open forms that have user variables, they must select a memberfor User Variable Options in preferences. After selecting an initial value, they canchange it in the form or in preferences. See Working with Planning for OraclePlanning and Budgeting Cloud.
Creating User VariablesTo create user variables:
1. Click the Navigator icon , and then under Create and Manage, clickVariables.
2. Select the User Variables tab.
3. Click Actions, then select Add.
4. In the User Variables window, for Dimension Name, select the dimension forwhich to create a user variable (including attribute dimensions).
Chapter 18Administering Variables
18-130
5. For User Variable Name, enter the name of the user variable.
Note:
The Use Context setting means the value can't be chosen by the userfrom user preferences. Instead, the value is passed from another formbased on its Point of View context and the value will change dynamicallybased on the context of the form. However if the user variable is usedelsewhere, such as in rows and columns, you must create a differentuser variable so the user can set its own value for it because it won’t beset dynamically.
6. Click OK.
You can now associate the user variable with a form. See Selecting UserVariables as Members. You can also set limits for user variables on forms. See Setting Limits for User Variables on Forms.
Afterward, planners can select members for the user variable. See Working withPlanning for Oracle Planning and Budgeting Cloud.
Setting Limits for User Variables on FormsYou can limit which members users can see or select on individual forms by limitingtheir member selections for a user variable. The user variable limit applies therestriction to all Planners at the form level, regardless of their access permissions. Inaddition to setting the limits by members, administrators can select limits by function(for example, "IChildren(Existing Employees)".
To set up user variable limits:
1. During form design, select Enable Dynamic User Variables to allow dynamicuser variables in the form.
See Setting Form Precision and Other Options.
2. Create a user variable.
See Creating User Variables.
3. In the User Variable Definition field on the Variables page under the User
Variables tab, click , and add or remove members to set limits.
To select members by function, click and select from the available options.
4. In the form designer, assign the user variable to the page axis.
See Defining Simple Form Page and Point of View.
Deleting User VariablesTo delete user variables:
1. Click the Navigator icon , and then under Create and Manage, clickVariables.
2. Select the User Variables tab.
Chapter 18Administering Variables
18-131
3. Select the user variable to delete.
4. Click Actions, then select Delete.
5. Click Yes.
Clearing Cell DetailsYou can clear these cell details for a cube: account annotations, supporting detail, celltext, and cell-level documents. For information on creating and viewing accountannotations, supporting detail, cell text, and cell-level documents, see Working withPlanning for Oracle Planning and Budgeting Cloud.
Note:
• You can't delete approval unit annotations.
• Because this function is for administrators and interactive users, theapplication assumes that you have full access to details you delete.
To clear cell details:
1. Click the Navigator icon , and then under Actions, click Clear Cell Details.
2. For Cube, select a cube.
3. To select all dimensions in the cube, click Add All Dimensions.
Select members for the displayed dimensions.
4. Specify the type of information to delete by selecting at least one option fromClear Options.
5. Select members for the data intersections:
a. In Dimension, select at least one dimension with details to delete.
b. For displayed dimensions, click . On the Member Selection page, makea selection that includes the details to delete.
Note:
For every dimension selected, you must select at least one member. If adimension isn't selected, the application includes all its members whenclearing cell details.
Chapter 18Clearing Cell Details
18-132
Caution:
To clear exactly the data you want, select at least one Account memberand members from all other dimensions. If you don't select at least oneAccount member, no data is cleared, even if you select the Yes, setvalue to #Missing option. If you don't select members from the otherdimensions, all data for the selected Account member is cleared acrossall other dimensions.
6. Optional: To select another dimension so you can select its members, click .
7. Click Clear.
A Confirmation page displays your selections.
8. Click Finish to proceed, or Back to change your selections.
If Clear Cell Details is successful, data is deleted from the cube. If data isn'tdeleted successfully, a message is displayed. You can also check the log file.
9. Optional: To view the execution status of Clear Cell Details and review theinformation that was deleted, view the Job . See Managing Jobs.
10. To clear cell details for another cube, select another cube in step 2, and repeat theprocedure.
Copying DataYou can copy plans from one dimensional intersection to another, including relationaldata and supporting detail. For example, you can copy Budget, FY10, Final toForecast, FY11, First Draft.
Chapter 18Copying Data
18-133
Note:
• Selected Copy Data settings are preserved for the current session only.
• Copied dimension members must be present in the selected cubes.
• Data must be copied into cells that can accept data. For example, youcan't copy data into read-only or dynamic cells.
• You can copy account annotations, supporting detail, and cell text. Youcan't copy approval unit annotations.
• You can't use this feature with attributes, so don't select attributes to becopied.
• Because this is an administrative function, the application assumes youhave full access to data you copy. You're not prevented from copying toapproval units that are approved.
• This feature doesn't calculate data. To perform calculations, such asincreasing the forecast by 5%, apply the business rule after copyingdata.
• For Copy Data to be successful, you must select at least one member forScenario, Account, Entity, Period, and Version dimensions.
To copy data:
1. Click the Navigator icon , and then under Actions, click Copy Data.
2. In Cube, select a cube.
Dimensions are displayed for this cube. You can only copy from one cube at atime.
3. In Copy Data Options, select the type of information to copy.
4. Under Static Dimensions, select the members for the data intersections:
a. For Dimension, select a dimension from which to copy.
b. For Members, click to make a selection from which to copy. You canselect multiple members. You must select at least one member for Scenario,Account, Entity, Period, and Version dimensions.
5. Optional: To add another static dimension to the list, click and selectdimension members.
Note:
To remove a dimension, select Select Dimension. The dimensionmoves to the Dimensions with Source and Destination area.
6. In Dimensions with Source and Destination, enter dimensions into which tocopy data.
Chapter 18Copying Data
18-134
In Source and Destination click .
7. Click Copy Data.
Data is copied from one intersection to the other. If data isn't copied successfully,a message is displayed. You can also check the log file.
8. To copy data for another cube, select another cube in step 2, and repeat theprocedure.
Administering the Application MonitorRelated Topics
• About the Application Monitor
• Assumptions
• How the Application Monitor Works
• Using the Application Monitor Graphs
• Launching the Application Monitor
• Modifying Artifacts for Optimal Performance
About the Application MonitorThe application monitor enables administrators, at design-time, to identify and resolvedesign flaws before an application is placed in production (and on an ongoing basis,as the application evolves with new members and data is added to the application)and used by end users. Administrators can use the application monitor to evaluate thefollowing:
• An entire application
• Types of artifacts such as forms and approval units
• Individual "cherry picked" artifacts
The application monitor identifies changes that administrators can make at design-timeto resolve artifacts with design flaws, and provides easy access to the editors requiredto modify them. At runtime, internal processes perform checks that may deny systemrequest if artifacts need to be modified. The application monitor evaluates yourapplication and artifacts based on the user an administrator selects. This enables youto determine the potential problems that may occur at runtime given the individualuser's variables and security access as part of the analysis.
AssumptionsOracle can only provide general guidelines about how to design your application andartifacts to ensure reasonable performance. Oracle can't specify precise value rangesfor artifacts and operations.
How the Application Monitor WorksThe application monitor evaluates applications as follows:
Chapter 18Administering the Application Monitor
18-135
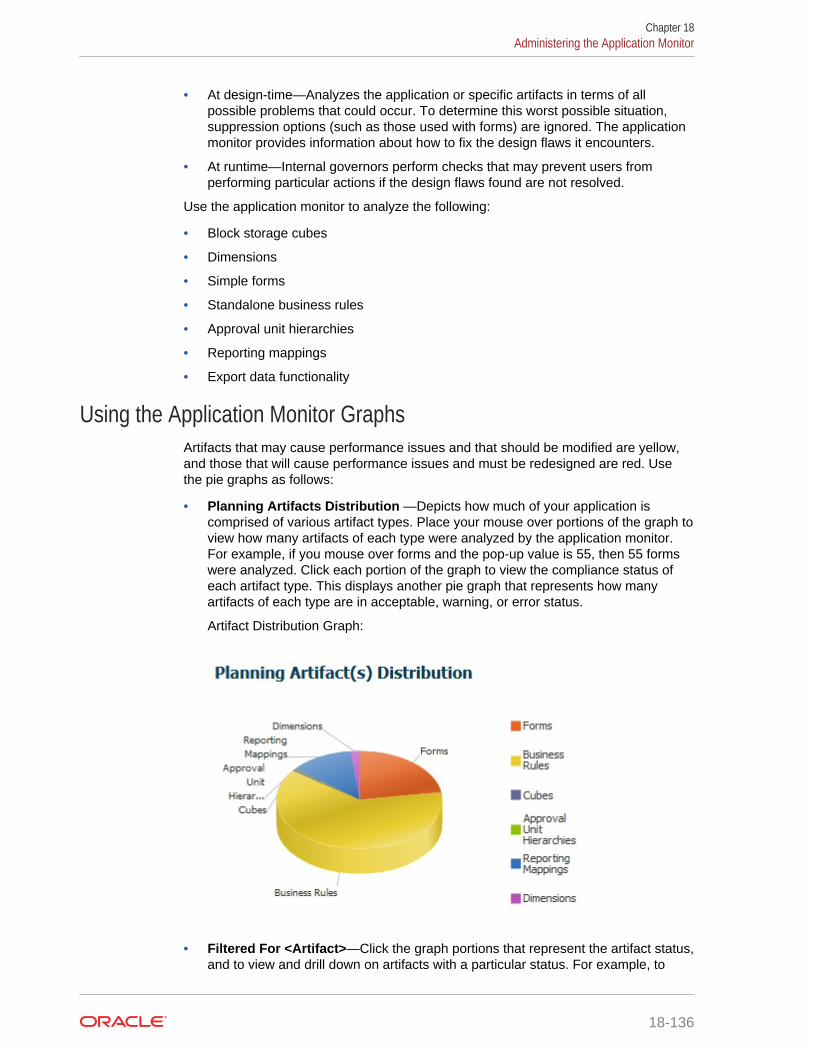
• At design-time—Analyzes the application or specific artifacts in terms of allpossible problems that could occur. To determine this worst possible situation,suppression options (such as those used with forms) are ignored. The applicationmonitor provides information about how to fix the design flaws it encounters.
• At runtime—Internal governors perform checks that may prevent users fromperforming particular actions if the design flaws found are not resolved.
Use the application monitor to analyze the following:
• Block storage cubes
• Dimensions
• Simple forms
• Standalone business rules
• Approval unit hierarchies
• Reporting mappings
• Export data functionality
Using the Application Monitor GraphsArtifacts that may cause performance issues and that should be modified are yellow,and those that will cause performance issues and must be redesigned are red. Usethe pie graphs as follows:
• Planning Artifacts Distribution —Depicts how much of your application iscomprised of various artifact types. Place your mouse over portions of the graph toview how many artifacts of each type were analyzed by the application monitor.For example, if you mouse over forms and the pop-up value is 55, then 55 formswere analyzed. Click each portion of the graph to view the compliance status ofeach artifact type. This displays another pie graph that represents how manyartifacts of each type are in acceptable, warning, or error status.
Artifact Distribution Graph:
• Filtered For <Artifact>—Click the graph portions that represent the artifact status,and to view and drill down on artifacts with a particular status. For example, to
Chapter 18Administering the Application Monitor
18-136
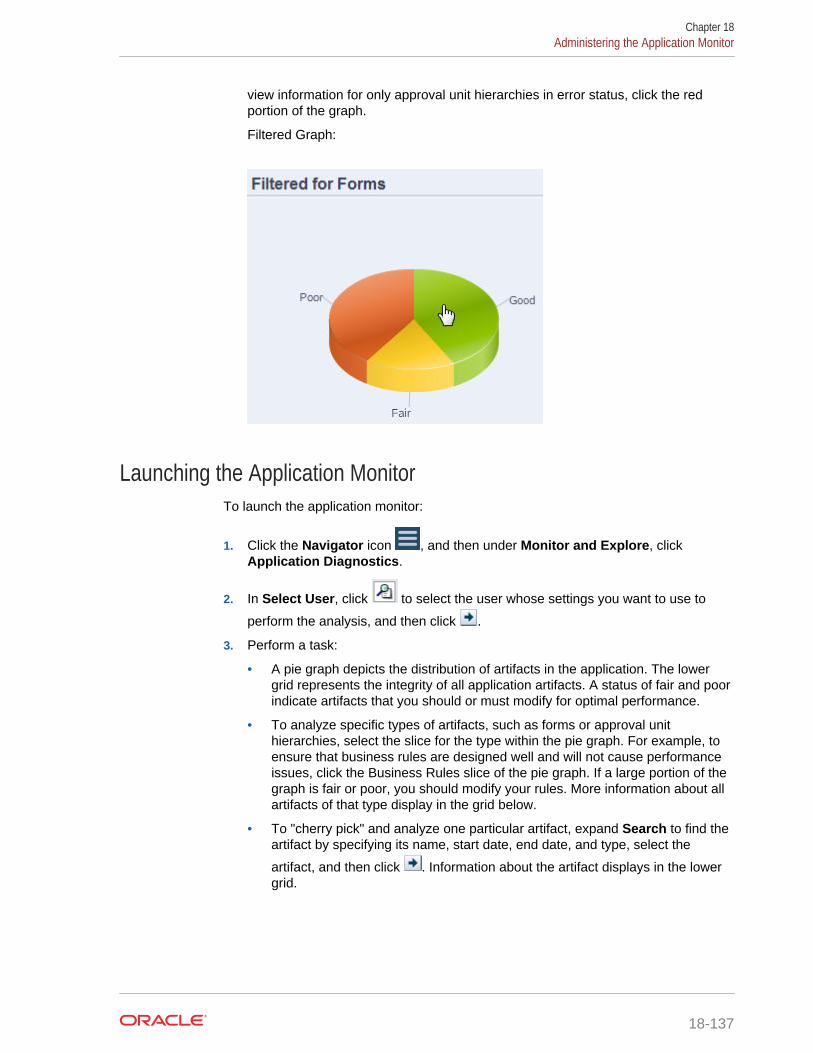
view information for only approval unit hierarchies in error status, click the redportion of the graph.
Filtered Graph:
Launching the Application MonitorTo launch the application monitor:
1. Click the Navigator icon , and then under Monitor and Explore, clickApplication Diagnostics.
2. In Select User, click to select the user whose settings you want to use to
perform the analysis, and then click .
3. Perform a task:
• A pie graph depicts the distribution of artifacts in the application. The lowergrid represents the integrity of all application artifacts. A status of fair and poorindicate artifacts that you should or must modify for optimal performance.
• To analyze specific types of artifacts, such as forms or approval unithierarchies, select the slice for the type within the pie graph. For example, toensure that business rules are designed well and will not cause performanceissues, click the Business Rules slice of the pie graph. If a large portion of thegraph is fair or poor, you should modify your rules. More information about allartifacts of that type display in the grid below.
• To "cherry pick" and analyze one particular artifact, expand Search to find theartifact by specifying its name, start date, end date, and type, select the
artifact, and then click . Information about the artifact displays in the lowergrid.
Chapter 18Administering the Application Monitor
18-137
Tip:
For information about what the pie graphs display and how to drill downto access more information, see Using the Application Monitor Graphs.
4. Click or select Actions, and then Run Application Monitor.
5. If the View Details column doesn't display in the grid, select View, then Columns,and then View Details. This also enables you to display or conceal different typesof artifact data.
6. To display information about how to fix artifacts, click in View Details. Thenclick artifacts to launch editors that enable you to modify them.
Modifying Artifacts for Optimal PerformanceAfter reviewing the details provided by the application monitor that tell you how tomodify your artifacts, edit them as follows:
• Simple forms—Clicking on the form artifact name launches the Form Designer ina new tab. Edit forms as described in Administering Forms.
• Business Rules—Clicking a business rule name launches the System View whichdisplays all application artifacts that you can access. You can perform tasks suchas:
– Use the upper Rule Designer to view the individual components of the rule,such as conditions, commands, and scripts. Click each component to modifythem in the lower portion of the page. You can also insert and removecomponents like formulas, system templates, and scripts by dragging anddropping them from the Rule Pallet and Existing Object panes to the left.
– From Designer, select Edit Script to modify and format the script byperforming tasks such as inserting functions, editing templates, insertingvariables, inserting member ranges, use comments, and validate syntax.
– Create, open, delete, and refresh artifacts, pages, and other documents.
– Import and export business rules and other objects.
– Determine how and where artifacts are used.
See Designing with Calculation Manager for Oracle Enterprise PerformanceManagement Cloud and Understanding Runtime Prompts.
• Approval unit hierarchies—Clicking an approval unit hierarchy artifact namelaunches the Approval Unit Hierarchy Designer in a new tab. Edit approval unitsas described in Creating Approval Unit Hierarchies.
• Cubes—Clicking the cube artifact name launches the Performance Settings tabof the dimension editor in a new tab. Edit the dimensional outline or dimensionalsparsity as described in Editing Dimensions in the Simplified Dimension Editor.
• Reporting Mappings—Clicking the reporting mapping artifact name launches theReport Mapping Designer in a new tab. Edit reporting mappings as described in Defining Data Maps.
Chapter 18Administering the Application Monitor
18-138
Managing ApprovalsManage the approvals process by creating approval units, setting the promotionalpath, tracking budgets, and reviewing status, process issues, and ownership.
Related Topics
• About the Approvals Process
• Defining the Approvals Process
• Starting and Supporting the Review Process
• Printing Approval Unit Annotations
• Creating Approval Status Reports
• Approval Unit Promotional Path
About the Approvals ProcessYou can track budgets and review status, process issues, and approval unit ownershipusing approval units. Budget cycle time is reduced:
• Approval path is independent of organizational structure
• Exceptions and problem areas are highlighted
• Audit information includes annotations and process status
• Reviews include annotations and comments
Related Links
• About Approval Units
• Approvals Process
• Data Validation Rules
• Task Lists
• Setting Up Email for Approvals Notification
About Approval UnitsAn approval unit is the basic unit for preparing, annotating, reviewing, and approvingplan data. Approval units are combinations of scenario, version, and entity or part ofan entity. You can have one scenario/version combination per approval unit. Scenariosand versions are the basis of the review cycle. Approval units submit planning data fora scenario and version. For example, an approval unit might consist of a version (BestCase), a scenario (Actual), and an entity (New York). Approval units can also includesecondary dimensions within any entity, refining the granularity of an approval unit.
Approvals ProcessThe approval unit moves from one reviewer to another until the budget process iscomplete. The review process follows the promotional path you set up when you selectthe owner and reviewers for an approval unit, unless an event triggers a change in thepromotional path. Events that affect the promotional path include:
Chapter 18Managing Approvals
18-139
• Exceeding or not reaching expense boundaries for budget items such as salaries,new hires or capital equipment
• The current owner returning the budget to the previous owner for additionalinformation
• The current owner requesting help from an authorized user who isn't necessarilyon the promotional path
The selected approvals template determines the first user to review the budget (see Setting Approval Unit Hierarchy Name, Scope, and Template). The first usercompletes the assigned tasks, then promotes (Bottom Up template) or submits(Distribute template) the budget, which alerts the next owner that the budget requirestheir attention. Other users may also be notified whenever the budget passes from oneuser to another.
Each reviewer must validate the approval unit before sending the budget to the nextreviewer. The validation runs all data validation rules defined for the approval unit withwhich the reviewer is working, and reports any data errors or changes in the approvalunit promotional path. See Modifying the Approval Unit Promotional Path.
Tip:
To display users' full names (instead of their user IDs) in Approvals, selectthe option Display Users' Full Names, as described in Specifying SystemSettings.
Data Validation RulesTo implement business policies and practices, administrators can build data validationrules that are checked when conditions are met in forms. Rules can generatevalidation messages, enforce limits on submitted approval unit data, and designate aspecific reviewer or owner to review data that meets some condition.
For example:
• Conditionalizing the approval unit promotional path
• Preventing the promotion of approval units that include invalid data
When you design rules that affect the approval unit promotional path, you need tounderstand the order in which these rules are evaluated and applied. For informationabout designing data validation rules and expected outcomes, see Managing DataValidation.
Task ListsTask lists guide users through the planning process by listing tasks, instructions, andend dates. Administrators and interactive users create and manage tasks and tasklists. See Administering Task Lists.
Chapter 18Managing Approvals
18-140
Setting Up Email for Approvals NotificationOwners and reviewers must enable approvals notifications if they want to get an emailnotice when there’s a change in approvals status or approvals ownership. Approvalsnotifications are enabled on the Application Settings page.
Approvals notification emails contain the following information:
• URL to Check Status
• Application Name
• Approval unit
• Current Owner
• Previous Owner
• Last Action
• Current Status
• Time
• Annotation Title
• Annotation Text
To enable approvals notifications:
1. From the home page, click Application, and then click Settings.
2. Under Notifications, select Approvals.
3. Enter your email address.
See also, Managing Application Settings.
Defining the Approvals ProcessRelated Topics
• Budget Process
• Approval Operations and Data Validations
Budget ProcessThe application supports bottom-up, distributed, or free-form budgeting. Typically,high-level users start the approval units containing loaded data, and then delegatedata entry into the lowest-level members to their direct reports, who distribute to theirdirect reports, and so on. Until a budget is distributed, users can't access it.
To define the budget process, administrators define:
• Approval unit hierarchies
• Owners and reviewers of the approval unit hierarchies
• Validation rules for evaluating submitted data
When a user submits budget data, the data is subjected to validation rules. If the datapasses the validations, the budget is promoted to the next owner, and the original user
Chapter 18Managing Approvals
18-141
can't edit the data unless ownership is granted again. The submission process locksthe data from being edited by anyone except the current owner.
Approval Operations and Data ValidationsDuring approvals operations that invoke data validations, user variables and contextuser variables on the forms that are replaced with the distinct union of the result setsof all possible inputs. User variables and context user variables on the POV will betreated as a page.
Note:
To view the results of the user variable substitution, navigate to the datavalidation report task list. You may need to purposely cause a validation tofail on the form and then run a validation operation for the approval unit for itto display on the report.
Starting and Supporting the Review ProcessAfter administrators start the review process, the approval unit moves from onereviewer to another until the budget process is complete. The selected approvalstemplate determines the first user to review the budget.
You can view and provide detailed status of the approval process using approvalstatus reports. See Creating Approval Status Reports.
To start the review process:
1. Click the Navigator icon , and then under Workflow, click ManageApprovals.
2. In Scenario, select a scenario.
3. In Version, select a version.
4. Click Go to display the approval units associated with the selected scenario andversion combination.
The approval units displayed are enabled for approvals.
If no approval units are started with the selected scenario and version, thismessage is displayed: You have not assigned Approval Unit Hierarchy to theselected Scenario and Version combination.
5. In the upper-right corner of the page for View, select Tree View, and then in PlanCycle, click Start to begin the review process.
Chapter 18Managing Approvals
18-142
Note:
If the approval unit hierarchy uses the Bottom Up template, selectingStart starts the approval unit and runs the Originate action. Theseactions set the user defined as the approval unit owner in the approvalunit hierarchy as the current owner, and the approval unit status changesto Under Review.
6. Optional: Select Exclude to remove an approval unit from the planning process orfrom being tracked in the system.
Caution:
After you exclude an approval unit, all associated annotations andhistory are discarded. Approval unit status is returned to Not Startedand the owner is set to No Owner. Data values are retained.
Printing Approval Unit AnnotationsAdministrators can check approval unit status by reporting on annotations for a set ofscenarios, versions, and approval unit members. Reports can be based on processstatus. The application name, selected scenarios, versions, and entities, approval unittitle, status, author, origin date, and annotations are displayed. Annotation textdisplays chronologically, with the most recent entry first.
To create and print reports for approval unit annotations:
1. Click the Navigator icon , and then under Monitor and Explore, click SystemReports.
2. Select Approval Unit, and then click Annotations.
3. Under Select Report Options, select the Scenario, Version, and Entitycombination for which you want to generate a report. If Custom is selected, click
to select the custom scenarios, versions, and entities.
4. Under Approvals Status, select status states.
5. Click Create Report.
6. Click Print on the Adobe Acrobat toolbar.
Creating Approval Status ReportsYou can view detailed status of the approval process using approval status reports. Allusers can access this report, however you'll only see the approval units to which youhave write access.
Filters allow you to generate more focused reports. You can filter by:
• Approval Status
Chapter 18Managing Approvals
18-143
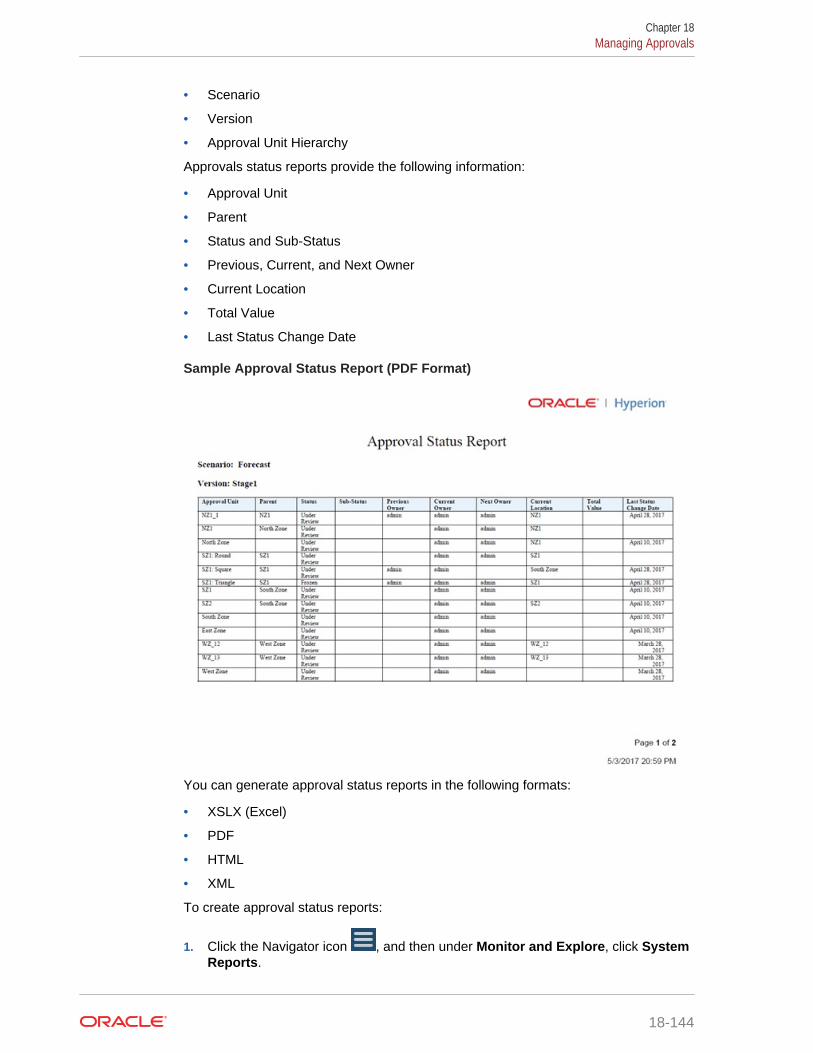
• Scenario
• Version
• Approval Unit Hierarchy
Approvals status reports provide the following information:
• Approval Unit
• Parent
• Status and Sub-Status
• Previous, Current, and Next Owner
• Current Location
• Total Value
• Last Status Change Date
Sample Approval Status Report (PDF Format)
You can generate approval status reports in the following formats:
• XSLX (Excel)
• HTML
• XML
To create approval status reports:
1. Click the Navigator icon , and then under Monitor and Explore, click SystemReports.
Chapter 18Managing Approvals
18-144
2. Click Approval Unit, and then click Approval Status.
3. Make your selections:
• Under Select Approval Status, select which states you'd like to view in thereport or select All.
• Under Filters, select the Scenario and Version. Click to open theMember Selection dialog.
Note:
Filtering on Approval Unit Hierarchy is optional. Use this option ifyou want to filter on a subset of an approval unit hierarchy.
• Under Select Format, choose a file format (XSLX, PDF, HTML, or XML).
4. Click Create Report and select where to save the report.
Approval Unit Promotional PathAn approval unit moves from person to person and department to department basedon the owners and reviewers you assign to each approval unit and its parents in theapproval unit hierarchy.
There are two ways to affect the promotional path of an approval unit hierarchy:
• Modify owners and reviewers for approval units and their descendants usingapprovals actions (for example, Promote or Reject)
• Use data validation rules to determine whether a change in the approval unitpromotional path is necessary
• Modifying the Approval Unit Promotional Path
• Design Considerations for Approval Unit Promotional Path Data Validation Rules
Modifying the Approval Unit Promotional PathWhen you select an owner and reviewers for an approval unit and its parents, you setthe approval unit promotional path (see Approval Unit Promotional Path). Sometimes,however, budget calculation results change the person who reviews the budget next.For example, if salaries for a sales group are more than 10% over the previous budgetyear, approval from someone other than the next reviewer may be required. Toautomate redirecting the budget in these cases, add conditions and actions to datavalidation rules that test for these exceptions, and then modify the promotional pathwhen necessary. You can also use data validation rules to stop an approval unit frompassing to the next reviewer when data errors exist in the approval unit.
To modify the approval unit promotional path:
1. Create or select a data validation rule (see Managing Data Validation).
2. In the Data Validation Rule Builder, click to create promotional pathconditions and specify the action taken when a budget calculation doesn't meetthese conditions.
Chapter 18Managing Approvals
18-145
3. Select one action:
• Update Promotional Path to create a promotional path condition that addsreviewers or owners to the promotional path if the condition you set istriggered.
• Do Not Promote to prevent promoting an approval unit to the next reviewer.This action usually indicates invalid data in the budget.
4. In the Process Cell dialog box, beneath Approvals, click Add to add apromotional path condition.
Promotional path conditions are processed in the order they are listed. Use the and to move them up or down within the list.
5. Optional: To duplicate a promotional path condition:
a. Select a promotional path condition, and then click Copy.
b. Select the promotional path condition that will precede the copied one in thelist, and then click Paste to add the copied promotional path condition.
6. Optional: Click Delete to remove a promotional path condition.
7. In Approval Unit Hierarchy and Approval Units, click to select theapproval unit hierarchy and approval units the promotional path condition affects.
8. In Promotional Path Condition, specify the promotional path changes for theapproval units selected in Promotional Path Condition. Select:
a. In Position, specify where the promotional path changes for the approval unitsselected in Approval Units. Select:
• Before to insert the alternate owner or reviewer before ownership reachesthe approval units specified in Promotional Path Condition.
• After to insert the alternate owner or reviewer after ownership reaches theapproval units specified in Promotional Path Condition.
• Before and After to insert the alternate owner or reviewer before andafter ownership reaches the approval units specified in Promotional PathCondition.
b. In the Approval Units column of Promotional Path Condition, click toselect the approval units the action selected in Position affects.
Note:
The selected approval units must be ancestors of the approval unitsselected in the previous step. If you select approval units that are notancestors, the promotional path condition isn't evaluated when theapproval unit hierarchy is validated.
9. In the Assign column, specify the role, user type, and the user or UDA for eachalternate owner, reviewer, and user to be notified if the rule exception occurs.
a. In Role, select:
• Owner to select the alternate owner
Chapter 18Managing Approvals
18-146
• Reviewer to select the alternate reviewer
• Notified Users to select the user to be notified
b. In Type, select:
• User Name to specify the alternate user
• From UDA to select the dimension and to enter the prefix that wasassigned to the UDA
c. In Users, specify:
• For User Name, the name of the alternate user or choose one from theuser selector
• For From UDA, the dimension from the Select a Dimension drop down,and then specify the prefix that was used in the UDA to indicate that theUDA contains a user name (for example, ProdMgr:)
Note:
Ensure the prefix specified is the same as the prefix that wasassigned while creating the UDA, including any spaces. Forinstance, if there is a space between the prefix and theusername (ProdMgr Kim), ensure there is a space afterProdMgr.
10. Optional: Provide messages for the users involved in the approval unitpromotional path changes:
a. Click in:
• Sender Message to enter the email message text sent to the userpromoting the approval unit when the promotional path changes.
• In Reviewer Message to enter the email message text sent to the userreceiving the approval unit for review due to the rule exception.
b. Click OK to save the messages.
The text you enter is added to the messages sent when the approval unit changesstatus.
11. Click OK to save the promotional path conditions, and return to data validation rulecreation.
Design Considerations for Approval Unit Promotional Path Data ValidationRules
When you design rules that affect the approval unit promotional path, you need tounderstand the order in which these rules are evaluated and applied. For informationabout designing data validation rules and expected outcomes, see Managing DataValidation.
Chapter 18Managing Approvals
18-147
Managing Approval Unit HierarchiesRelated Topics
• About Approval Unit Hierarchies
• Working with Approval Unit Hierarchies
About Approval Unit HierarchiesAn approval unit hierarchy contains approval units and entities that are part of thereview process.
Parent/child relationships between approval unit hierarchy members affect the reviewprocess:
• When you promote or reject a parent, its children are promoted or rejected unlessthey are Approved. The owner for the parent becomes the owner of the children.
• When you approve a parent, its children are approved.
• After all children are promoted to the same owner, the parent is promoted to theowner.
• When the status of all children changes to one status, for example Signed Off,parent status changes to the same status.
You can't change the status of a parent if its children have different owners. If thechildren are promoted to, submitted to, or signed off by different users, the parent hasno owner and only administrators can change its status.
Working with Approval Unit HierarchiesUse approval unit hierarchies to adapt the budgeting process to all types oforganizational requirements.
• Approval units are a combination of the entity and other dimensions. For example,if an application includes all of a company's products, the approval unit hierarchyfor North America can include dimensions and members appropriate to productssold in North America. Similarly, the approval unit hierarchy for the Europeandivision can include dimensions and members for products sold in Europe. Withinthe same approvals hierarchy, Latin America entities can be enhanced using theAccount dimension, creating approval units such as Entities by HR, Entities byCapital Expenditures, and Entities by Revenue.
• Use preset budgeting mode templates to create hierarchies that are bottom-up,distributed, or free form.
• Include dynamic links to dimensions based on generation numbers for the entitydimension and the secondary dimension that is used. For example, automaticallyadd generations 0 to 3 in the entity or segment dimension to the approval unithierarchy. If a change occurs in the dimension, the approval unit hierarchy can beeasily updated.
• Import and export approval unit hierarchies.
• Create approval unit hierarchies that differ by scenario and version. For example,the Budget scenario can have a large approval unit hierarchy consisting of
Chapter 18Managing Approval Unit Hierarchies
18-148
departments, accounts, and products, while the Forecast has a simpler processorganization with fewer levels of approval.
Related Links
• Creating Approval Unit Hierarchies
• Selecting Approval Unit Hierarchy Scenario and Version
• Editing Approval Unit Hierarchies
• Deleting and Renaming Approval Unit Hierarchies
• Viewing Approval Unit Hierarchy Usage
• Synchronizing Approval Unit Hierarchies
• Exporting Approval Unit Hierarchies
• Importing Approval Unit Hierarchies
Creating Approval Unit HierarchiesEntity is the primary dimension for each approval unit hierarchy. As members areadded to the Entity dimension, the inclusion rules you create determine whether a newmember is part of the approval process. An administrator can also add members to thehierarchy as exceptions to the approval unit hierarchy structure.
To create an approval unit hierarchy:
1. Click the Navigator icon , and then under Workflow, click Approval Unit.
2. Click .
Note:
The approvals dimension is set to Entity. There are no other choices.
3. Create the generic rule that defines which Entity members are included in theapproval process (see Setting Approval Unit Hierarchy Name, Scope, andTemplate).
4. Select the primary and subhierarchy members to include in the approval process(see Selecting Approval Unit Hierarchy Members).
5. Assign owners and reviewers for each stage of the approval process and createthe approval unit promotional path (see Assigning Approval Unit Owners andReviewers).
6. Click Save.
Setting Approval Unit Hierarchy Name, Scope, and TemplateTo set up an approval unit hierarchy:
1. Click the Navigator icon , and then under Workflow, click Approval Unit.
2. Take an action:
Chapter 18Managing Approval Unit Hierarchies
18-149
• To create a new hierarchy, click .
• To edit an existing hierarchy, select an approval unit hierarchy, and then click
.
3. Complete the Approvals Dimension details:
• For Hierarchy Name, provide the approval unit hierarchy name.
• Optional: For Description, provide a description.
• In Enable Approvals, select:
– All to add all approval units to the approval process.
– None to include no approval units in the approval process by default.
To add approval unit groups or individual approval units to the approvalprocess, see Selecting Approval Unit Hierarchy Members.
– Custom to define which approval units to include in the approval process.
You can add individual approval units and approval units based on Parentmember and generation criteria. See Selecting Approval Unit HierarchyMembers.
• For Approvals Template, select:
– Bottom Up (see Bottom-Up Budgeting)
– Distribute (see Distributed Budgeting)
– Free Form (see Free-Form Budgeting)
• For Cube, select the cube from which aggregated approval unit values arederived.
See Assigning Approval Unit Owners and Reviewers.
4. Take an action:
• Click Next or select Primary and Subhierarchy Selection to select theapproval unit hierarchy members (see Selecting Approval Unit HierarchyMembers).
• Click Save and then OK to save changes and close the approval unithierarchy.
Bottom-Up BudgetingData is input at the leaf member level (for example, children of Budget Group) andconsolidated by rolling data up the organizational hierarchy. When the budget isstarted, data is populated for each scenario and user independently. The ownershipfollows the hierarchy of approval in bottom-up mode. Users can view or edit databased on access permissions defined for the approval unit. The topmost BudgetGroup owner consolidates individually approved budgets into a final consolidatedbudget.
Distributed BudgetingBudget data is entered at the leaf level of the organization, and ownership starts at thetop level of the organization. Ownership is then distributed down the organizationhierarchy. After ownership reaches the lower levels, budgets are submitted back to the
Chapter 18Managing Approval Unit Hierarchies
18-150
top through the approval process. The top budget group owner reviews, approves, andloads the budgets for budgetary control, transaction control, and reporting.
Free-Form BudgetingWith free-form budgeting, data is input at the leaf member, and planners select thenext owner from a drop-down list. The free-form budgeting mode allows planners toselect the next owner from a drop-down list. Select this budget template if you're notusing the approvals features described in Creating Approval Unit Hierarchies.
Selecting Approval Unit Hierarchy MembersTo select approval unit hierarchy members:
1. Take an action:
• From Approvals Dimension, click Next or select Primary and SubhierarchySelection to continue defining an approval unit hierarchy.
• Click the Navigator icon , and then under Workflow, click Approval Unit.
Select an approval unit hierarchy, then click , and then select Primaryand Subhierarchy Selection to edit members.
Note:
• At any time during approval unit hierarchy member selection, youcan click Reset to Default Hierarchy to reset the approval unithierarchy to its default membership defined in the ApprovalsDimension page.
• Shared members are not displayed in the approval unit hierarchy.
2. Define how to display the approval unit hierarchy:
• All Entities—Displays all potential approval units
• Approval Units—Displays only enabled approval units
• Search—Searches approval units by Name, Alias, or Both.
Enter any part or all of a name in Search to locate an entity, then click or
in the approval unit hierarchy.
• To move from page to page in a multipage approval unit hierarchy, enter apage number in Page and click Go, or click Start (first page), Prev (previouspage), Next, or End (last page).
3. Optional: For approval units not included in the default settings for the approvalprocess, check the box to the left of the approval unit name to include the approvalunit in the approval process.
4. Optional: Right-click an approval unit name to define subhierarchy members forthe approval process, and then select one option:
• Include Children to include the children of the approval unit.
Chapter 18Managing Approval Unit Hierarchies
18-151
• Include Member to include just the approval unit, but none of its descendants.
• Include All Descendants to include all descendants of the approval unit.
• Include Generation to include one or more approval unit generations. Specifythe generations to include when prompted.
• Exclude Children to exclude the children of the approval unit.
• Exclude Member to exclude just the approval unit, but none of itsdescendants.
• Exclude All Descendants to exclude all descendants of the approval unit.
• Exclude Generation to exclude approval unit generations. Specify thegenerations to exclude when prompted.
5. Optional: Add a secondary dimension to an approval unit included in the approvalprocess to provide finer granularity:
a. Select a dimension from Dimension.
b. In Parent Member, click to display the member selection window, andthen select one member as the parent member for that dimension.
c. In Relative Generation, specify the parent-member generations to include.
Adding a generation adds all members of that generation to the approvalprocess.
d. Check Auto Include to automatically include newly-added members to theapproval unit hierarchy that meet the selected criteria.
e. Optional: Click under Selected Members for the approval unit to refinethe members it includes. Clear the check box next to any member you want toremove.
6. Take an action:
• Click Next or select Assign Owners to specify approval unit ownership (see Assigning Approval Unit Owners and Reviewers).
• Click Save and then OK to save changes and close the approval unithierarchy.
Assigning Approval Unit Owners and ReviewersApproval unit ownership is inherited from the approval unit parents. Approval unitreviewers are also inherited. You can also explicitly specify approval unit owners andreviewers to assign owners and reviewers other than those approval units inherit.
To assign approval unit reviewers and owners:
1. Take an action:
• From Primary and Subhierarchy Selection, click Next or select AssignOwners to continue defining an approval unit hierarchy.
• Click the Navigator icon , and then under Workflow, click Approval Unit.
Select an approval unit hierarchy, click , and then select Assign Ownersto specify approval unit ownership.
Chapter 18Managing Approval Unit Hierarchies
18-152

2. Select an approval unit, then under Owner, click to select an owner.
An approval unit can have only one owner. Either a user or a group can be theowner. Select the Users tab to assign an individual user as the owner. Select theGroups tab to assign a group as the owner. See About Group-based Approvals.
3. Under Reviewer, click and select approval unit reviewers.
Reviewers can be individual users, a single group, or multiple groups. Select theUsers tab to assign individual users as reviewers. Select the Groups tab to assigna single group or multiple groups as the reviewer. See About Group-basedApprovals.
Note:
When using the Bottom Up or Distribute template, if the reviewers areindividual users, select the reviewers in the order you want them toreview the approval unit. The first reviewer in the list is the first user towork on the approval unit. When the first reviewer promotes or submitsthe approval unit, the second reviewer selected becomes the approvalunit owner, and so on through the list of reviewers you create.
4. To enable viewing the aggregated value of approval units during approvals, under
Value Definition Members, click to define the intersection of non-approvalunit dimensions.
Chapter 18Managing Approval Unit Hierarchies
18-153
Note:
• For non-approval unit dimensions: To view aggregated approval unitvalues, on Member Selection, you must select one member foreach non-approval unit dimension in the cube selected on theApprovals Dimension tab. If you don't select members for the non-approval unit dimensions, the aggregated approval unit value isblank.
• For approval unit dimensions: Value definition members specified fora parent member in the approval unit hierarchy are inherited by thedescendants of that member. If value definition members areselected for both a parent and child member of an approval unitdimension, then the child's selection takes precedence. Forexample, you select a value definition member for both the parentUS and its child, Western Region; the value definition member forWestern Region takes precedence. At runtime, the Entity, Scenario,Version, and secondary dimension members specified in theapproval unit hierarchy are selected.
• In Standard multicurrency applications: In Preferences, users setthe Reporting Currency in which to display the aggregatedapproval unit. See Working with Planning for Oracle Planning andBudgeting Cloud. To ensure that totals are correct, remind users tolaunch the Currency Conversion business rule.
Note that in Standard multicurrency applications, the reportingcurrency is assumed, so you don't select a value definition memberfor currency.
5. Under Promotional Path, click to display the approval unit promotional path,verify that it's correct, and then correct any errors.
6. Under Notify These Users, click to select the users to notify for each moveof the approval unit from one user to another.
7. Optional: Repeat Steps 2 through 6 for other approval units to change theirinherited owners or reviewers.
8. Click Save to save your work and continue, or click OK to save your work andclose the approval unit hierarchy.
About Group-based ApprovalsWhen assigning approval unit owners, you can assign individual users, or you canassign a group. When assigning approval unit reviewers, you can assign individualusers, a group, or multiple groups.
See the following topics for more information:
• Assigning a Group as the Owner
• Assigning a Group or Groups as the Reviewer
Chapter 18Managing Approval Unit Hierarchies
18-154

Assigning a Group as the OwnerOnly one user or one group can be assigned as an owner of an approval unit. Within agroup, any user can become the owner, but only one user can be the owner at a time.Only the user assigned as an owner can perform actions. Other group members cantake ownership away from the current owner. If no one is assigned as the owner, thenanyone in the group can perform actions on behalf of the group without having to firstclaim ownership.
Assigning a Group or Groups as the ReviewerIf you select individual users as reviewers, all users must approve, and the approvalsmust follow the order in which the users are entered. If you select a group (or groups)as a reviewer, any user within the group can be the reviewer and can promote to thenext level.
The following are some examples of how you can enter multiple reviewers:
Example 18-3 Example 1
North America - Bill USA - Nick, Sandy, Kim CA - John
The approval path is John, Nick, Sandy, Kim, Bill.
Example 18-4 Example 2
North America - Bill USA – {Group A} CA - John
The approval path is John, any user in Group A, Bill.
Example 18-5 Example 3
North America – {Group B}, Bill USA – Susan, {Group A} CA - John
The approval path is John, Susan, any user in Group A, any user in Group B, Bill.
Example 18-6 Example 4
North America – {Group B}, Bill USA – Susan, {Group A} CA - John**A validation rule indicates that if New Hires > 4, then before USA, set {Group HR} as reviewer.
If the condition is true for the CA approval unit, then the path is: John, any user inGroup HR, Susan, any user in Group A, any user in Group B, Bill.
Selecting Approval Unit Hierarchy Scenario and VersionTo select the approval unit hierarchy scenario and version:
Chapter 18Managing Approval Unit Hierarchies
18-155
1. Click the Navigator icon , and then under Workflow, click ManageApprovals.
2. In Scenario, select a scenario.
3. In Version, select a version.
4. Click Go to display the approval unit hierarchy defined for the selected scenarioand version.
5. In View, click one of the view options.
6. Optional: If you own approval units for this hierarchy, click Display My ApprovalUnits to select them.
7. For each approval unit, the following is displayed:
• Plan Cycle (Tree View only), which displays whether the approval unit isstarted and if it's included in the budget process
• Approvals Status, for example, 1st Pass
• Sub-Status
• Current Owner
• Location
• In Path, click to view the potential promotional path.
• Click Details, to display approval unit details and add or edit approval unitannotations.
Editing Approval Unit HierarchiesTo edit an approval unit hierarchy:
1. Click the Navigator icon , and then under Workflow, click Approval Unit.
2. Select the approval unit hierarchy with which you want to work.
3. Click .
4. Select the appropriate tab, depending on the changes you want to make (forexample, select Assign Owners to edit ownership of the approval units in thehierarchy):
• Select the Approvals Dimension tab to modify the approval unit hierarchydescription or approvals default scope. See Setting Approval Unit HierarchyName, Scope, and Template.
• Select the Primary and Subhierarchy Selection tab to select or removemembers from approvals. See Selecting Approval Unit Hierarchy Members.
• Select the Assign Owners tab to modify approval unit owners or reviewers.See Assigning Approval Unit Owners and Reviewers.
• Select the Usage tab to view the application objects (forms or scenario andversion combinations) that reference the approval unit hierarchy. See ViewingApproval Unit Hierarchy Usage.
5. Click Save when done.
Chapter 18Managing Approval Unit Hierarchies
18-156
To select an approval unit hierarchy scenario and version with which to work, see Selecting Approval Unit Hierarchy Scenario and Version.
Deleting and Renaming Approval Unit HierarchiesYou can delete an approval unit hierarchy if it's not referenced by other applicationobjects such as forms or scenario and version combinations. The Usage tab displaysobjects that reference the selected approval unit hierarchy and links you to the objectsso you can disassociate them from the hierarchy.
You can also change the name of an approval unit hierarchy. Renaming an approvalunit hierarchy doesn't affect application objects that reference the hierarchy.
To delete or rename approval unit hierarchies:
1. Click the Navigator icon , and then under Workflow, click Approval Unit.
2. Take an action:
• To delete, select the approval unit hierarchy to delete, and then click .
• To rename, select the approval unit hierarchy to rename, and then click .Enter the new name for the approval unit hierarchy in the dialog box.
3. Click OK.
If you select an approval unit hierarchy that is referenced by other application objects,an error message is displayed. See Viewing Approval Unit Hierarchy Usage to viewand edit the application objects that reference the approval unit hierarchy.
Viewing Approval Unit Hierarchy UsageApproval unit hierarchies might have dependencies such as approval unit assignmentsor data validation rules which are defined in forms. If dependencies exist for anapproval unit hierarchy, the hierarchy can't be deleted until the dependencies areremoved. The Usage tab enables you to view approval unit hierarchy dependenciesand links you to the forms or scenario and version combinations so you can removethe dependencies, if needed.
To view approval unit hierarchy usage:
1. Click the Navigator icon , and then under Workflow, click Approval Unit.
2. Select an approval unit hierarchy, then click , and then select the Usage tab toview approval unit hierarchy dependencies.
3. Select Forms to view associated data validation rules:
• If no data validation rules are associated, a message is displayed.
• If data validation rules are associated, they are listed by form. Click the rulehyperlink to display the form in edit mode in a new tab. You can then update ordelete the data validation rule to disassociate it from the approval unithierarchy. See Creating and Updating Data Validation Rules.
4. Select Approval Unit Assignment to view associated scenario and versioncombinations:
Chapter 18Managing Approval Unit Hierarchies
18-157
• If no scenario and version combinations are associated, a message isdisplayed.
• If scenario and version combinations are associated, they are listed byscenario. Click the version hyperlink to display the combination in a new tab.You can then remove the approval unit assignment to disassociate it from theapproval unit hierarchy. See Assigning Approval Unit Hierarchy Scenario andVersion Combinations.
5. If dependencies are removed during steps 3 or 4, click Refresh on the Usage tabto view the remaining dependencies.
6. If you're deleting an approval unit hierarchy, repeat steps 3, 4, and 5 until alldependencies are removed.
Once all dependencies are removed from an approval unit hierarchy, you can deletethe hierarchy. See Deleting and Renaming Approval Unit Hierarchies.
Synchronizing Approval Unit HierarchiesWhen you add, delete, or modify dimension members that are used in approval unithierarchies, the affected approval unit hierarchy must be synchronized with thechanges. When you display the list of approval unit hierarchies, the entry for eachapproval unit hierarchy specifies whether recent changes are reflected in the approvalunit hierarchy. Use this procedure to synchronize dimension member changes with theapproval unit hierarchy.
Note:
When you add dimension members, they are added as approval units only ifthey meet the criteria in the inclusion rules for the approval unit hierarchy.For example, if the added entity is a fourth-generation entity, and theinclusion rules specify generations one through three as approval units, theentity isn't added as an approval unit. If the entity is a third-generationmember, however, it's added as an approval unit the next time the approvalunit hierarchy is edited and saved, or synchronized.
To synchronize changes to approval unit hierarchies:
1. Click the Navigator icon , and then under Workflow, click Approval Unit.
2. In the Synchronized column, approval unit hierarchies are labeled as follows:
• Synchronized—Changes are synchronized with the approval unit hierarchy
• Not Synchronized—Changes are not synchronized with the approval unithierarchy
• Locked By user—A user is editing or synchronizing the approval unithierarchy
Chapter 18Managing Approval Unit Hierarchies
18-158
Note:
If a user begins editing or synchronizing an approval unit hierarchy afteryou display the approval unit hierarchy list, the approval unit hierarchylist doesn't display "Locked" for the approval unit hierarchy. If you try tosynchronize this approval unit hierarchy, the synchronization doesn'toccur, and an error message states that it's being edited.
3. Select an approval unit hierarchy listed as Not Synchronized, and then clickSynchronize.
Changes are applied to the approval unit hierarchy, and the list of approval units isupdated according to the inclusion rules defined for the approval unit hierarchy.
Note:
You can't synchronize changes to an approval unit hierarchy that anotheruser is editing or synchronizing.
Exporting Approval Unit HierarchiesWhen you export an approval unit hierarchy, you create a file that contains theapproval unit hierarchy information. After you create this file, you can copy its contentsto an existing approval unit hierarchy (see Importing Approval Unit Hierarchies).
To export approval unit hierarchies:
1. Click the Navigator icon , and then under Workflow, click Import andExport.
2. Select Export Approval Unit Hierarchy.
3. In Existing Approval Unit Hierarchy Name, select an approval unit hierarchy toexport.
4. Click OK.
5. When the Save dialog box is displayed, save the export file to a location of yourchoice.
6. Click Export or Done. Export performs the action, and Done closes the dialogbox.
Importing Approval Unit HierarchiesAn approval unit hierarchy can be populated with the contents of an approval unithierarchy import file. The import file is the result of exporting an existing approval unithierarchy. See Exporting Approval Unit Hierarchies.
Importing the approval unit hierarchy information doesn't create an approval unithierarchy. The approval unit hierarchy populated from the export file must exist andhave at least a name before the import. Loading approval unit hierarchies first deletesall members of the approval unit hierarchy, and then adds each member specified inthe input file as a new member.
Chapter 18Managing Approval Unit Hierarchies
18-159
Note:
An approval unit hierarchy load deletes an existing member and its childrenfrom the hierarchy if the member isn't specified in the input file.
To import an approval unit hierarchy:
1. Click the Navigator icon , and then under Workflow, click Import andExport.
2. Select Import Approval Unit Hierarchy.
3. In Existing Approval Unit Hierarchy Name, select the approval unit hierarchyreceiving the exported information.
Note:
The imported approval unit hierarchy includes the defined owner,reviewers, and rules for determining the promotional path.
4. For Approval Unit Hierarchy with Ownership, click Browse to select theexported approval unit hierarchy file to import.
5. Click OK.
6. Click Import or Done. Import performs the action, and Done closes the dialogbox.
If the message Import successful is displayed, the approval unit hierarchyinformation in the exported file was successfully copied to the approval unithierarchy that you selected in Existing Approval Unit Hierarchy Name.
If the message Import not successful. Some items have not been imported isdisplayed, click Details to view the log file. Correct the errors and retry importingthe approval unit hierarchy.
Assigning Approval Unit Hierarchy Scenario and VersionCombinations
During the budget process, calculations are run for various scenarios, such as Q1 orFY10. For each scenario, calculations can be run for various versions, for exampleInitial or Final. Before beginning the budget process, assign approval unit hierarchiesto the scenario and version combinations included in the budget process.
To assign approval unit hierarchy scenario and version combinations:
1. Click the Navigator icon , and then under Workflow, click Approval UnitAssignment.
2. Add an approval unit assignment.
a. Click , in the Actions column, for the approval unit.
Chapter 18Assigning Approval Unit Hierarchy Scenario and Version Combinations
18-160
b. Click Select in the Scenario column, and then select the scenario to associatewith the approval unit hierarchy
c. Click Select in the Version column, and then select one or more versions toassociate with the selected scenario.
d. Click OK.
A new assignment row is displayed.
3. Optional: Click to remove an approval unit assignment.
4. Click Save to save the approval unit assignments and continue or click Cancel toundo any changes made since the last save.
Chapter 18Assigning Approval Unit Hierarchy Scenario and Version Combinations
18-161
ANaming Restrictions
Related Topics
• Restrictions for Applications and Databases
• Restrictions for Dimensions, Members, Aliases, and Forms
• Dimension and Member Names in Calculation Scripts, Report Scripts, Formulas,Filters, and Substitution Variables
• Restrictions for User and Group Names
Restrictions for Applications and DatabasesWhen naming an application, follow these rules:
• Use no more than eight characters for an application's name.
• Don't use spaces.
• Don't use these special characters:
– asterisks
– backslashes
– brackets
– colons
– commas
– equal signs
– greater than signs
– less than signs
– periods
– plus signs
– question marks
– quotation marks (double and single)
– semicolons
– slashes
– tabs
– vertical bars
• For application names in relational database environments, don't use extendedcharacters (except for underscores).
• For aggregate storage databases, don't use DEFAULT, LOG, METADATA, orTEMP as application names.
Enter names in the preferred case. Application names are created exactly as entered.
A-1
Restrictions for Dimensions, Members, Aliases, and FormsWhen naming dimensions, members, and aliases, follow these rules:
• For dimensions, members, or aliases, use no more than 80 characters.
• Don't use dimension names that are the same name as a member property or acolumn header in the metadata load file (for example, Data Type).
• Don't use HTML tags in member names, dimension names, aliases, anddescriptions.
• Don't use quotation marks ( " ), brackets ( [ ] ), backslashes ( \ ), slashes ( / ), ortabs. Brackets are permitted but not recommended in block storage outlines. Theycause errors when converting to aggregate storage outlines.
• Don't use these characters to begin dimension or member names:
– at sign ( @ )
– backslash ( \ )
– bracket ( [ ] )
– comma ( , )
– dash, hyphen, or minus sign ( - )
– equal sign ( = )
– less than sign ( < )
– parentheses ( )
– period ( . )
– plus sign ( + )
– quotation mark ( " )
– slash ( / )
– underscore ( _ )
– vertical bar ( | )
• Don't place spaces at the beginning or end of names.
• For time periods in custom calendars, don't use spaces in prefixes.
• Don't use these words as dimension or member names:
– Calculation script commands, operators, and keywords.
– Function names and function arguments.
– Names of other dimensions and members (unless the member is shared).
– If Dynamic Time Series is enabled, don't use History, Year, Season, Period,Quarter, Month, Week, or Day.
– In unique member outlines that contain an attribute dimension, don't use Sum,Count, Min, Max, and Avg as member or dimension names. Using thesenames causes duplicate name conflicts.
Appendix ARestrictions for Dimensions, Members, Aliases, and Forms
A-2
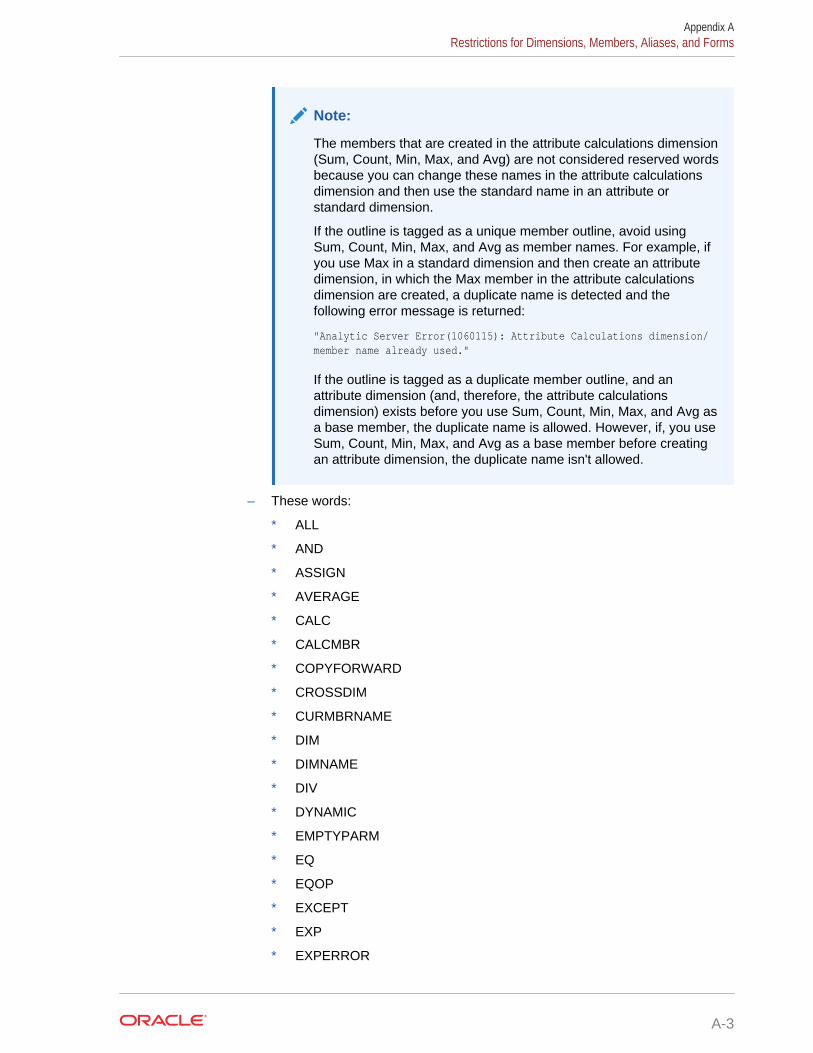
Note:
The members that are created in the attribute calculations dimension(Sum, Count, Min, Max, and Avg) are not considered reserved wordsbecause you can change these names in the attribute calculationsdimension and then use the standard name in an attribute orstandard dimension.
If the outline is tagged as a unique member outline, avoid usingSum, Count, Min, Max, and Avg as member names. For example, ifyou use Max in a standard dimension and then create an attributedimension, in which the Max member in the attribute calculationsdimension are created, a duplicate name is detected and thefollowing error message is returned:
"Analytic Server Error(1060115): Attribute Calculations dimension/member name already used."
If the outline is tagged as a duplicate member outline, and anattribute dimension (and, therefore, the attribute calculationsdimension) exists before you use Sum, Count, Min, Max, and Avg asa base member, the duplicate name is allowed. However, if, you useSum, Count, Min, Max, and Avg as a base member before creatingan attribute dimension, the duplicate name isn't allowed.
– These words:
* ALL
* AND
* ASSIGN
* AVERAGE
* CALC
* CALCMBR
* COPYFORWARD
* CROSSDIM
* CURMBRNAME
* DIM
* DIMNAME
* DIV
* DYNAMIC
* EMPTYPARM
* EQ
* EQOP
* EXCEPT
* EXP
* EXPERROR
Appendix ARestrictions for Dimensions, Members, Aliases, and Forms
A-3
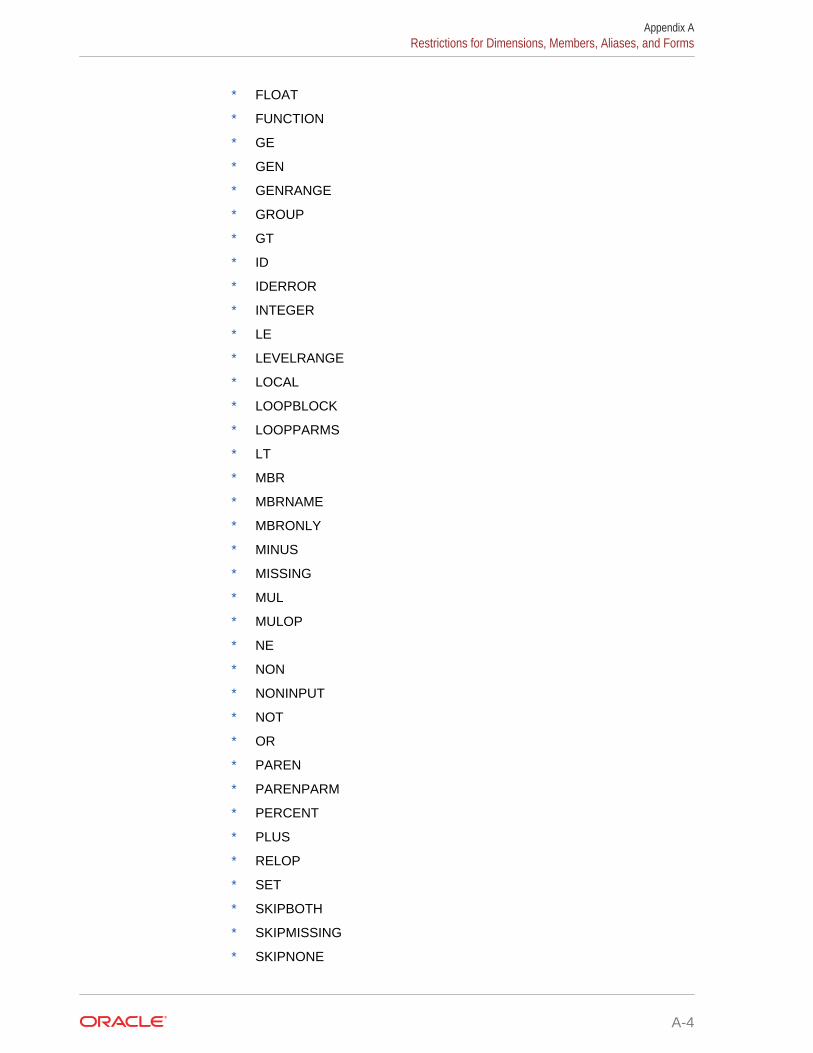
* FLOAT
* FUNCTION
* GE
* GEN
* GENRANGE
* GROUP
* GT
* ID
* IDERROR
* INTEGER
* LE
* LEVELRANGE
* LOCAL
* LOOPBLOCK
* LOOPPARMS
* LT
* MBR
* MBRNAME
* MBRONLY
* MINUS
* MISSING
* MUL
* MULOP
* NE
* NON
* NONINPUT
* NOT
* OR
* PAREN
* PARENPARM
* PERCENT
* PLUS
* RELOP
* SET
* SKIPBOTH
* SKIPMISSING
* SKIPNONE
Appendix ARestrictions for Dimensions, Members, Aliases, and Forms
A-4
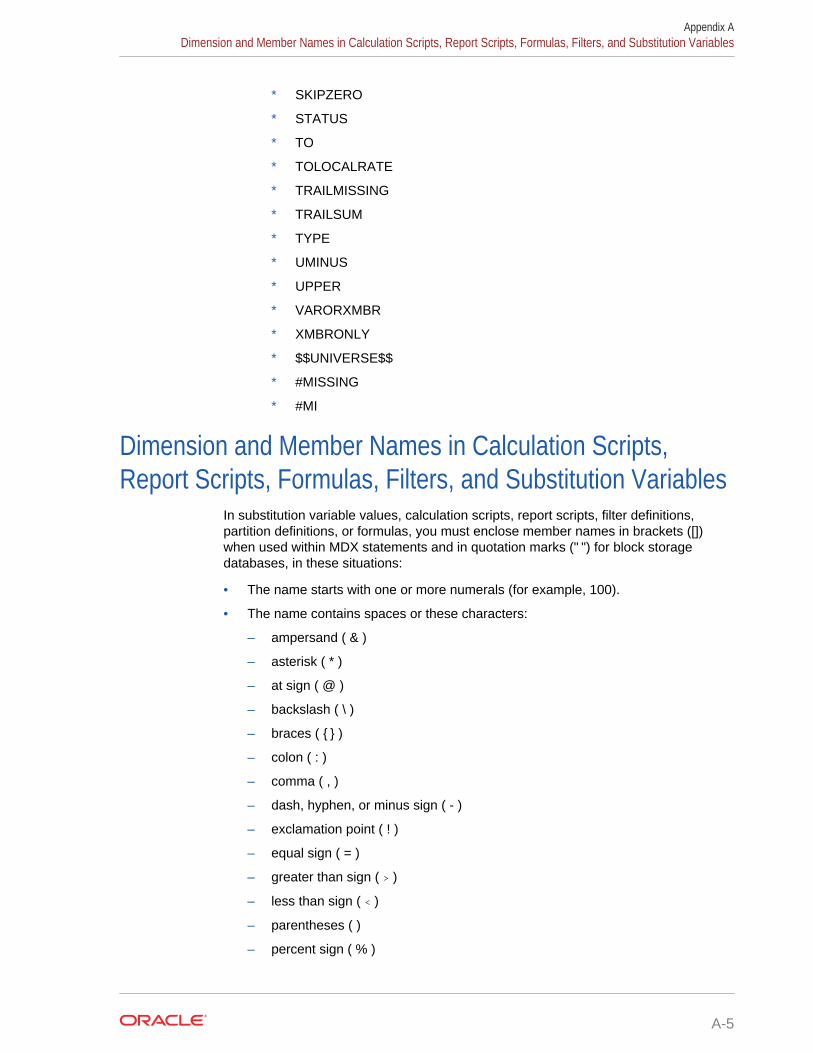
* SKIPZERO
* STATUS
* TO
* TOLOCALRATE
* TRAILMISSING
* TRAILSUM
* TYPE
* UMINUS
* UPPER
* VARORXMBR
* XMBRONLY
* $$UNIVERSE$$
* #MISSING
* #MI
Dimension and Member Names in Calculation Scripts,Report Scripts, Formulas, Filters, and Substitution Variables
In substitution variable values, calculation scripts, report scripts, filter definitions,partition definitions, or formulas, you must enclose member names in brackets ([])when used within MDX statements and in quotation marks (" ") for block storagedatabases, in these situations:
• The name starts with one or more numerals (for example, 100).
• The name contains spaces or these characters:
– ampersand ( & )
– asterisk ( * )
– at sign ( @ )
– backslash ( \ )
– braces ( { } )
– colon ( : )
– comma ( , )
– dash, hyphen, or minus sign ( - )
– exclamation point ( ! )
– equal sign ( = )
– greater than sign ( > )
– less than sign ( < )
– parentheses ( )
– percent sign ( % )
Appendix ADimension and Member Names in Calculation Scripts, Report Scripts, Formulas, Filters, and Substitution Variables
A-5
– period ( . )
– plus sign ( + )
– semicolon ( ; )
– slash ( / )
– tilde ( ~ )
In calculation scripts and formulas, enclose member names that are also Essbasekeywords in quotation marks (" ") for block storage databases, and in brackets ([ ]) foraggregate storage databases including these member names:
BEGIN DOUBLE ELSE END FUNCTION GLOBAL IF MACRO MEMBER RANGE RETURN STRING THEN
Enclose in quotation marks names, in calculation scripts, report scripts, or formulas,that contain or start with spaces or these characters: + - * / ( ) : , @ ; ) { } [ ] <
Also enclose in quotation marks names that start with numbers. For example:
@SUM(ac1, "12345");
Restrictions for User and Group NamesUser and group names can have up to 80 characters.
Appendix ARestrictions for User and Group Names
A-6
BForm Formula Functions
Related Topics
• About Form Formula Functions
• Working with Formulas
• Formula Functions
About Form Formula FunctionsAfter you create a formula row or column, define the formula using the SegmentProperties pane. Formulas include grid references, mathematical operators, and,optionally, mathematical functions. For a complete list, see Formula Functions.
Note:
The application requires level 0 members that are Dynamic Calc to have amember formula. For Dynamic Calc members that don't have a formula, theapplication inserts a semicolon (;) when refreshed.
Working with FormulasRelated Topics
• Creating Formulas
• Editing Formulas
• Deleting Formulas
Creating FormulasTo create formulas:
1. Select the row or column for which to associate the formula.
2. If it doesn't automatically expand, select Segment Properties.
3. In Formula, enter the name for the formula and then click .
4. In the Formula box that is displayed, select the operation or function that theformula will perform, such as COUNT(), MAX(), and IfThen(). See FormulaFunctions.
5. Click Validate to ensure that the formula doesn't contain any errors.
B-1
Editing FormulasTo edit formulas:
1. Open a form with a formula row or column.
2. In Layout, select a numbered formula row or column.
3. Use Segment Properties to modify the formula properties.
4. Click to change the operation or function performed.
5. Save the form.
Deleting FormulasTo delete a formula:
1. Select the formula row or column.
2. Click Delete.
3. To verify formula deletion:
a. Click the checkmark in the formula bar.
b. Click another cell within the grid to reset the formula bar.
c. Click the cell from which you deleted the formula to verify deletion.
Formula FunctionsThis section defines the mathematical functions available for creating formulas for formformula rows and columns. To insert formula rows and columns in forms, see AddingFormula Rows and Columns.
The syntax for mathematical functions:
FunctionName(arguments)
For more information about arguments, see Arguments.
Table B-1 Mathematical Function Syntax
Variable Description
FunctionName The name of a mathematical function
arguments A numeric value, a row, column, or cellreference, or an embedded function
Appendix BFormula Functions
B-2
Mathematical Functions
Table B-2 Mathematical Functions
Function Description
Abs Returns the absolute value of numeric valuesor references. See Abs.
Average Returns the average of a group of numericvalues or references. See Average.
AverageA Returns the average of a group of numericvalues or references. The calculation includes#MISSING cells only for rows or columns thatare not suppressed. See AverageA.
Count Returns the number of values in a group ofnumeric values or references. See Count.
CountA Returns the number of values in a group ofnumeric values or references. The calculationincludes #MISSING cells only for rows orcolumns that are not suppressed. See CountA.
Difference Returns the absolute value of a numeric valueor reference subtracted from another numericvalue or reference. See Difference.
Eval Evaluates an expression. Eval is useful forembedding expressions as functionarguments. See Eval.
IfThen, If Returns one value if a condition equals true,and another value if a specified conditionequals false. See IfThen, If.
Max Returns the maximum value from a group ofnumeric values or references. See Max.
Min Returns the minimum value from a group ofnumeric values or references. See Min.
Mod Returns the remainder, modulus, from adivision formula. See Mod.
PercentOfTotal Returns the result of a numeric value orreference divided by another numeric value orreference, multiplied by 100. See PercentOfTotal.
Pi Returns the number 3.14159265358979, to 15digits. See Pi.
Product Multiplies all numbers or references andreturns the product. See Product.
Random Returns a random number between 0.0 and1.0. See Random.
Round Rounds a number up or down by specifieddigits. See Round.
Sqrt Returns the square root of a numeric value,row, column, or cell. See Sqrt.
Sum Returns the sum of a group of numeric valuesor references. See Sum.
Appendix BFormula Functions
B-3
Table B-2 (Cont.) Mathematical Functions
Function Description
Truncate / Trunc Removes the specified number of digits fromnumeric values. See Truncate/Trunc.
Variance / Var Evaluates the difference between the specifiedvalues based on the account type for thecurrent account. See Variance/Var.
VariancePercent / VarPer Evaluates the percentage difference betweenthe specified values based on account type forthe current account. See VariancePercent/VarPer.
ArgumentsMathematical functions accept numeric values, row, column, or cell references, orembedded functions as arguments. There are four argument types:
• Numeric—See Numeric Arguments.
• Property—See Property Arguments.
• Row, column, or cell reference—See Row, Column, or Cell Reference Arguments.
• Embedded functions—See Embedded Functions as Arguments.
Numeric ArgumentsThe syntax for a numeric argument is
(numeral1, numeral2,...numeraln)
where numerals 1 through n are any numbers including decimals and negative values.For example, the expression Average(10,20,30) returns the value 20.
Row, Column, or Cell Reference ArgumentsThe row, column, or cell argument identifies a row, column, or cell in a grid. Thesyntax:
FunctionName(GridName.GridElement[segment(range)].Property)
Table B-3 Argument Components
Argument Description
GridName The form name. For example:
Difference (grid1.row[5], grid1.row[6]) returnsthe difference of two rows on form grid1.
Optional. If GridName isn't specified, thedefault is the name of the current form.
Appendix BFormula Functions
B-4
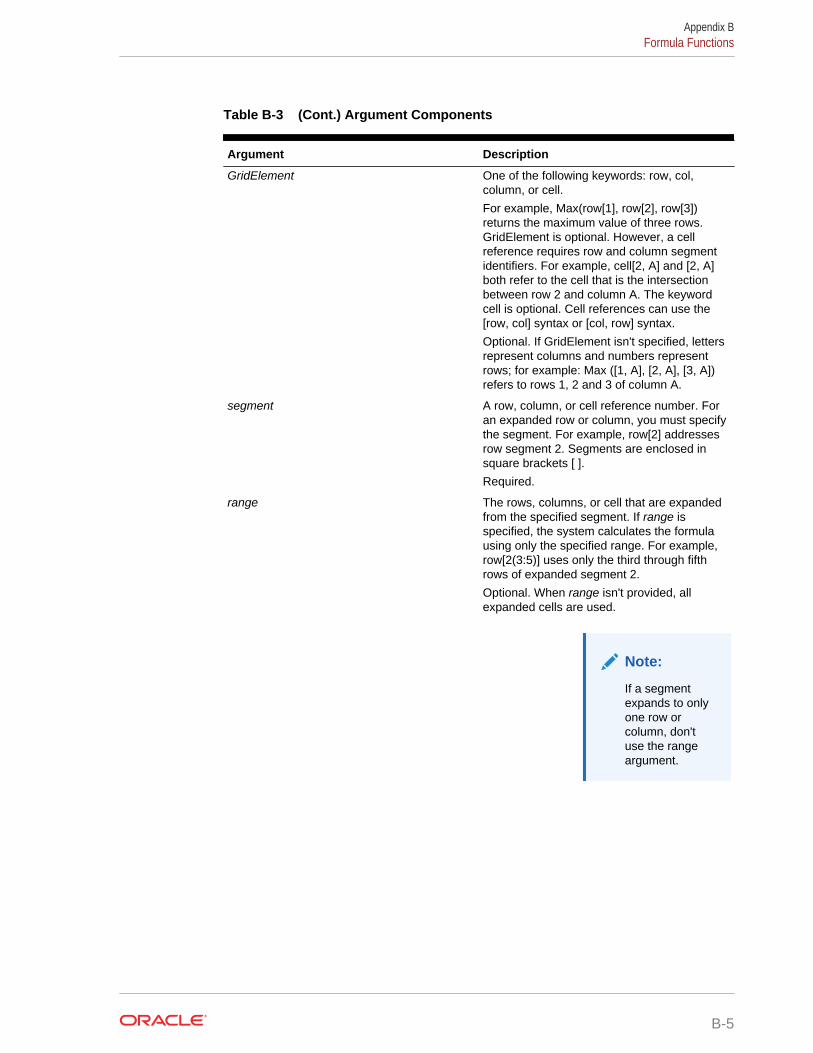
Table B-3 (Cont.) Argument Components
Argument Description
GridElement One of the following keywords: row, col,column, or cell.
For example, Max(row[1], row[2], row[3])returns the maximum value of three rows.GridElement is optional. However, a cellreference requires row and column segmentidentifiers. For example, cell[2, A] and [2, A]both refer to the cell that is the intersectionbetween row 2 and column A. The keywordcell is optional. Cell references can use the[row, col] syntax or [col, row] syntax.
Optional. If GridElement isn't specified, lettersrepresent columns and numbers representrows; for example: Max ([1, A], [2, A], [3, A])refers to rows 1, 2 and 3 of column A.
segment A row, column, or cell reference number. Foran expanded row or column, you must specifythe segment. For example, row[2] addressesrow segment 2. Segments are enclosed insquare brackets [ ].
Required.
range The rows, columns, or cell that are expandedfrom the specified segment. If range isspecified, the system calculates the formulausing only the specified range. For example,row[2(3:5)] uses only the third through fifthrows of expanded segment 2.
Optional. When range isn't provided, allexpanded cells are used.
Note:
If a segmentexpands to onlyone row orcolumn, don'tuse the rangeargument.
Appendix BFormula Functions
B-5
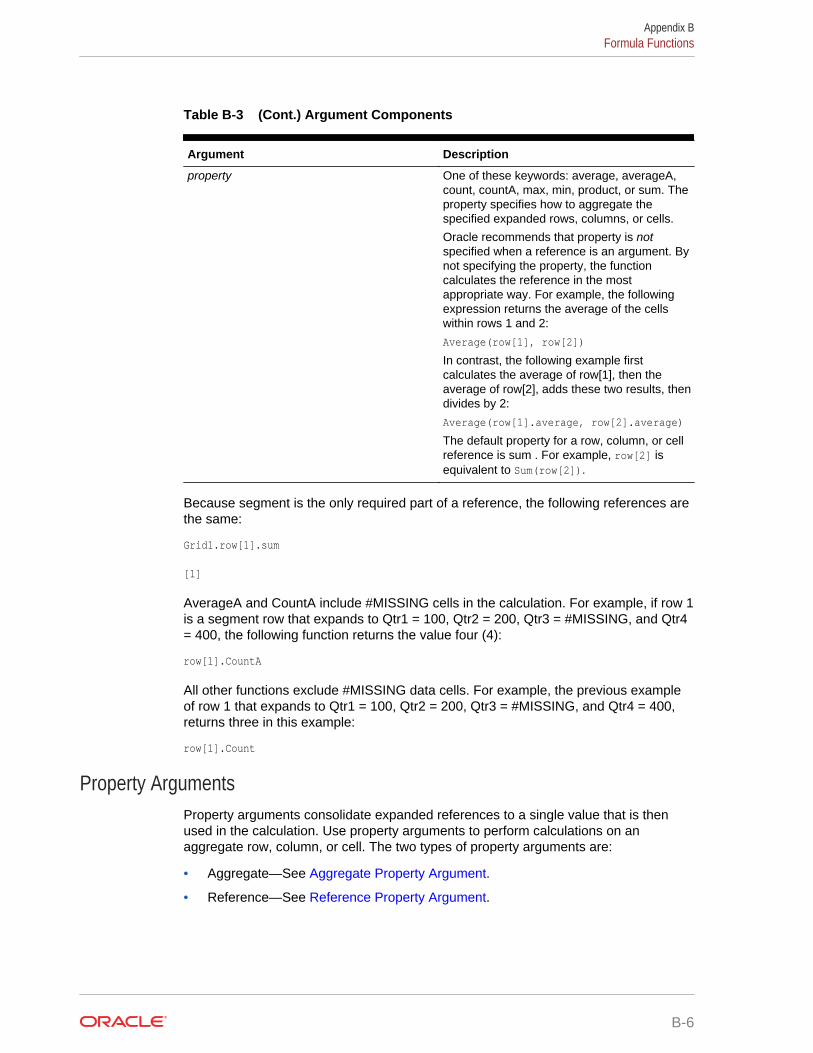
Table B-3 (Cont.) Argument Components
Argument Description
property One of these keywords: average, averageA,count, countA, max, min, product, or sum. Theproperty specifies how to aggregate thespecified expanded rows, columns, or cells.
Oracle recommends that property is notspecified when a reference is an argument. Bynot specifying the property, the functioncalculates the reference in the mostappropriate way. For example, the followingexpression returns the average of the cellswithin rows 1 and 2:
Average(row[1], row[2])
In contrast, the following example firstcalculates the average of row[1], then theaverage of row[2], adds these two results, thendivides by 2:
Average(row[1].average, row[2].average)
The default property for a row, column, or cellreference is sum . For example, row[2] isequivalent to Sum(row[2]).
Because segment is the only required part of a reference, the following references arethe same:
Grid1.row[1].sum
[1]
AverageA and CountA include #MISSING cells in the calculation. For example, if row 1is a segment row that expands to Qtr1 = 100, Qtr2 = 200, Qtr3 = #MISSING, and Qtr4= 400, the following function returns the value four (4):
row[1].CountA
All other functions exclude #MISSING data cells. For example, the previous exampleof row 1 that expands to Qtr1 = 100, Qtr2 = 200, Qtr3 = #MISSING, and Qtr4 = 400,returns three in this example:
row[1].Count
Property ArgumentsProperty arguments consolidate expanded references to a single value that is thenused in the calculation. Use property arguments to perform calculations on anaggregate row, column, or cell. The two types of property arguments are:
• Aggregate—See Aggregate Property Argument.
• Reference—See Reference Property Argument.
Appendix BFormula Functions
B-6
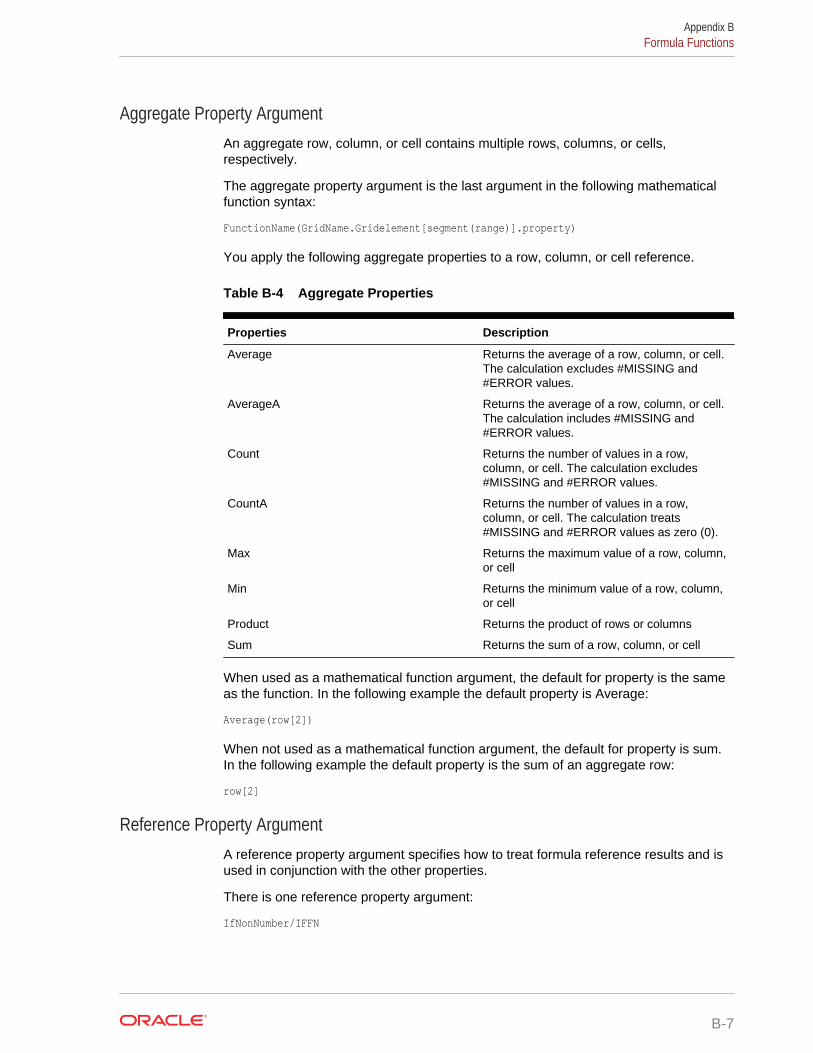
Aggregate Property ArgumentAn aggregate row, column, or cell contains multiple rows, columns, or cells,respectively.
The aggregate property argument is the last argument in the following mathematicalfunction syntax:
FunctionName(GridName.Gridelement[segment(range)].property)
You apply the following aggregate properties to a row, column, or cell reference.
Table B-4 Aggregate Properties
Properties Description
Average Returns the average of a row, column, or cell.The calculation excludes #MISSING and#ERROR values.
AverageA Returns the average of a row, column, or cell.The calculation includes #MISSING and#ERROR values.
Count Returns the number of values in a row,column, or cell. The calculation excludes#MISSING and #ERROR values.
CountA Returns the number of values in a row,column, or cell. The calculation treats#MISSING and #ERROR values as zero (0).
Max Returns the maximum value of a row, column,or cell
Min Returns the minimum value of a row, column,or cell
Product Returns the product of rows or columns
Sum Returns the sum of a row, column, or cell
When used as a mathematical function argument, the default for property is the sameas the function. In the following example the default property is Average:
Average(row[2])
When not used as a mathematical function argument, the default for property is sum.In the following example the default property is the sum of an aggregate row:
row[2]
Reference Property ArgumentA reference property argument specifies how to treat formula reference results and isused in conjunction with the other properties.
There is one reference property argument:
IfNonNumber/IFFN
Appendix BFormula Functions
B-7
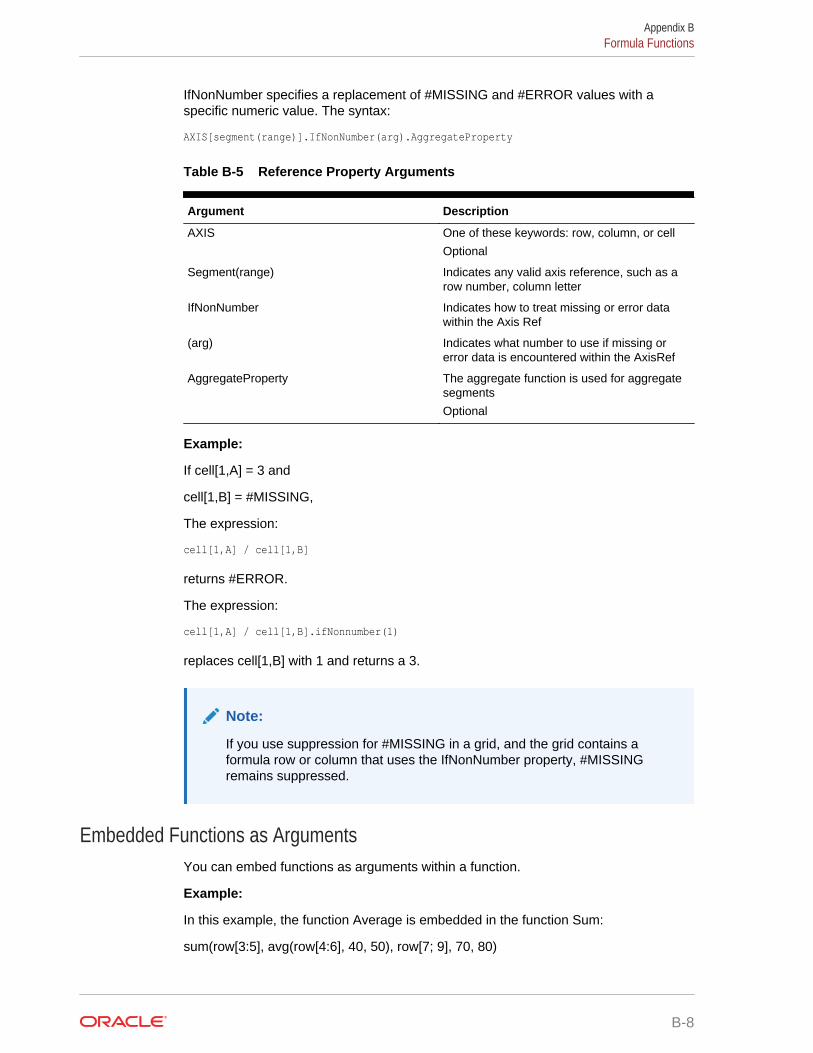
IfNonNumber specifies a replacement of #MISSING and #ERROR values with aspecific numeric value. The syntax:
AXIS[segment(range)].IfNonNumber(arg).AggregateProperty
Table B-5 Reference Property Arguments
Argument Description
AXIS One of these keywords: row, column, or cell
Optional
Segment(range) Indicates any valid axis reference, such as arow number, column letter
IfNonNumber Indicates how to treat missing or error datawithin the Axis Ref
(arg) Indicates what number to use if missing orerror data is encountered within the AxisRef
AggregateProperty The aggregate function is used for aggregatesegments
Optional
Example:
If cell[1,A] = 3 and
cell[1,B] = #MISSING,
The expression:
cell[1,A] / cell[1,B]
returns #ERROR.
The expression:
cell[1,A] / cell[1,B].ifNonnumber(1)
replaces cell[1,B] with 1 and returns a 3.
Note:
If you use suppression for #MISSING in a grid, and the grid contains aformula row or column that uses the IfNonNumber property, #MISSINGremains suppressed.
Embedded Functions as ArgumentsYou can embed functions as arguments within a function.
Example:
In this example, the function Average is embedded in the function Sum:
sum(row[3:5], avg(row[4:6], 40, 50), row[7; 9], 70, 80)
Appendix BFormula Functions
B-8
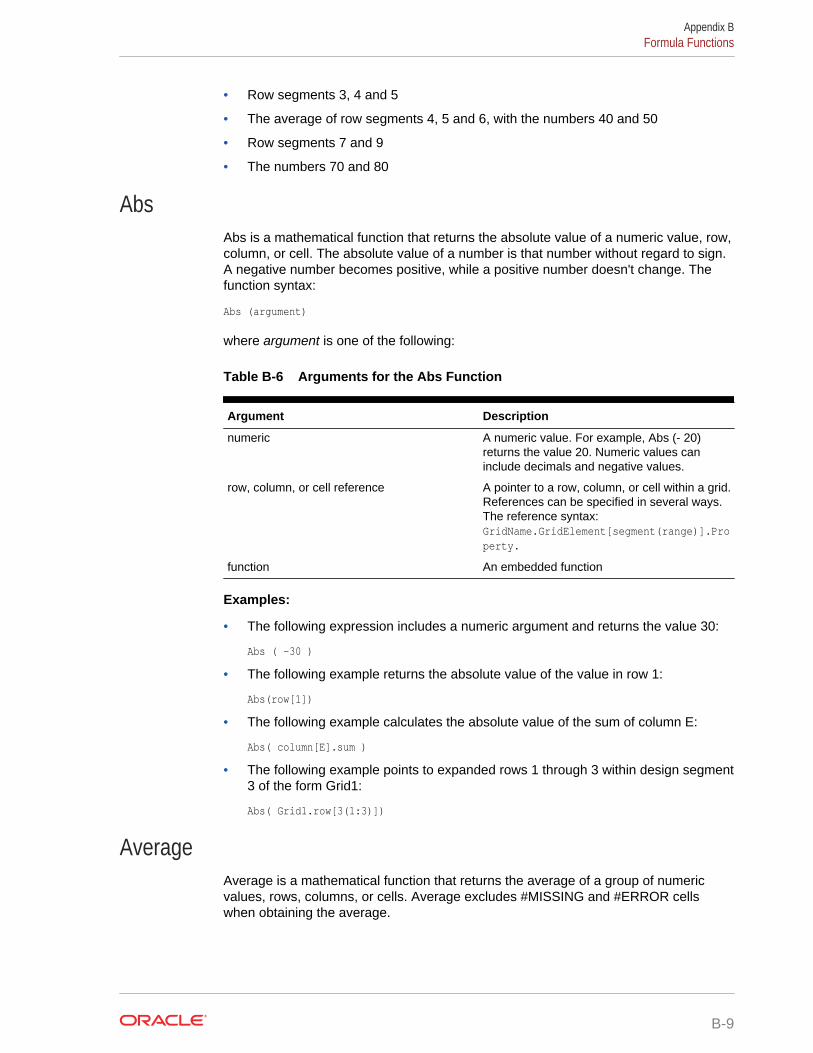
• Row segments 3, 4 and 5
• The average of row segments 4, 5 and 6, with the numbers 40 and 50
• Row segments 7 and 9
• The numbers 70 and 80
AbsAbs is a mathematical function that returns the absolute value of a numeric value, row,column, or cell. The absolute value of a number is that number without regard to sign.A negative number becomes positive, while a positive number doesn't change. Thefunction syntax:
Abs (argument)
where argument is one of the following:
Table B-6 Arguments for the Abs Function
Argument Description
numeric A numeric value. For example, Abs (- 20)returns the value 20. Numeric values caninclude decimals and negative values.
row, column, or cell reference A pointer to a row, column, or cell within a grid.References can be specified in several ways.The reference syntax:GridName.GridElement[segment(range)].Property.
function An embedded function
Examples:
• The following expression includes a numeric argument and returns the value 30:
Abs ( -30 )
• The following example returns the absolute value of the value in row 1:
Abs(row[1])
• The following example calculates the absolute value of the sum of column E:
Abs( column[E].sum )
• The following example points to expanded rows 1 through 3 within design segment3 of the form Grid1:
Abs( Grid1.row[3(1:3)])
AverageAverage is a mathematical function that returns the average of a group of numericvalues, rows, columns, or cells. Average excludes #MISSING and #ERROR cellswhen obtaining the average.
Appendix BFormula Functions
B-9
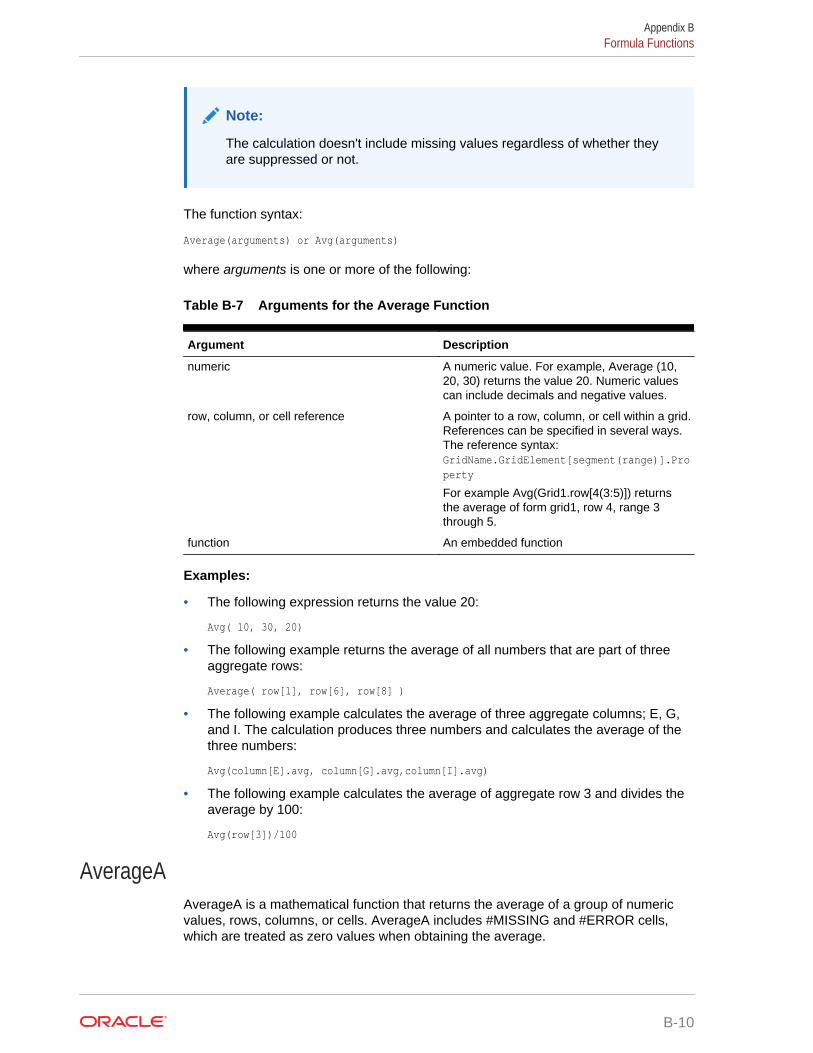
Note:
The calculation doesn't include missing values regardless of whether theyare suppressed or not.
The function syntax:
Average(arguments) or Avg(arguments)
where arguments is one or more of the following:
Table B-7 Arguments for the Average Function
Argument Description
numeric A numeric value. For example, Average (10,20, 30) returns the value 20. Numeric valuescan include decimals and negative values.
row, column, or cell reference A pointer to a row, column, or cell within a grid.References can be specified in several ways.The reference syntax:GridName.GridElement[segment(range)].Property
For example Avg(Grid1.row[4(3:5)]) returnsthe average of form grid1, row 4, range 3through 5.
function An embedded function
Examples:
• The following expression returns the value 20:
Avg( 10, 30, 20)
• The following example returns the average of all numbers that are part of threeaggregate rows:
Average( row[1], row[6], row[8] )
• The following example calculates the average of three aggregate columns; E, G,and I. The calculation produces three numbers and calculates the average of thethree numbers:
Avg(column[E].avg, column[G].avg,column[I].avg)
• The following example calculates the average of aggregate row 3 and divides theaverage by 100:
Avg(row[3])/100
AverageAAverageA is a mathematical function that returns the average of a group of numericvalues, rows, columns, or cells. AverageA includes #MISSING and #ERROR cells,which are treated as zero values when obtaining the average.
Appendix BFormula Functions
B-10
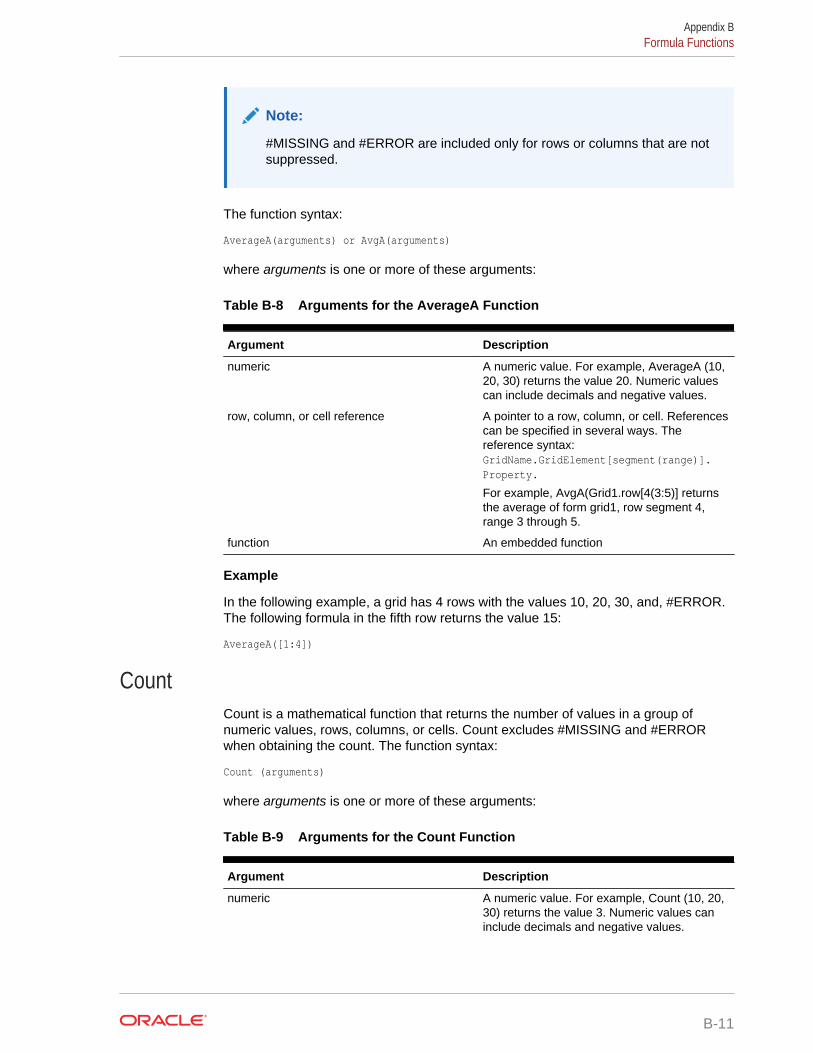
Note:
#MISSING and #ERROR are included only for rows or columns that are notsuppressed.
The function syntax:
AverageA(arguments) or AvgA(arguments)
where arguments is one or more of these arguments:
Table B-8 Arguments for the AverageA Function
Argument Description
numeric A numeric value. For example, AverageA (10,20, 30) returns the value 20. Numeric valuescan include decimals and negative values.
row, column, or cell reference A pointer to a row, column, or cell. Referencescan be specified in several ways. Thereference syntax:GridName.GridElement[segment(range)].Property.
For example, AvgA(Grid1.row[4(3:5)] returnsthe average of form grid1, row segment 4,range 3 through 5.
function An embedded function
Example
In the following example, a grid has 4 rows with the values 10, 20, 30, and, #ERROR.The following formula in the fifth row returns the value 15:
AverageA([1:4])
CountCount is a mathematical function that returns the number of values in a group ofnumeric values, rows, columns, or cells. Count excludes #MISSING and #ERRORwhen obtaining the count. The function syntax:
Count (arguments)
where arguments is one or more of these arguments:
Table B-9 Arguments for the Count Function
Argument Description
numeric A numeric value. For example, Count (10, 20,30) returns the value 3. Numeric values caninclude decimals and negative values.
Appendix BFormula Functions
B-11
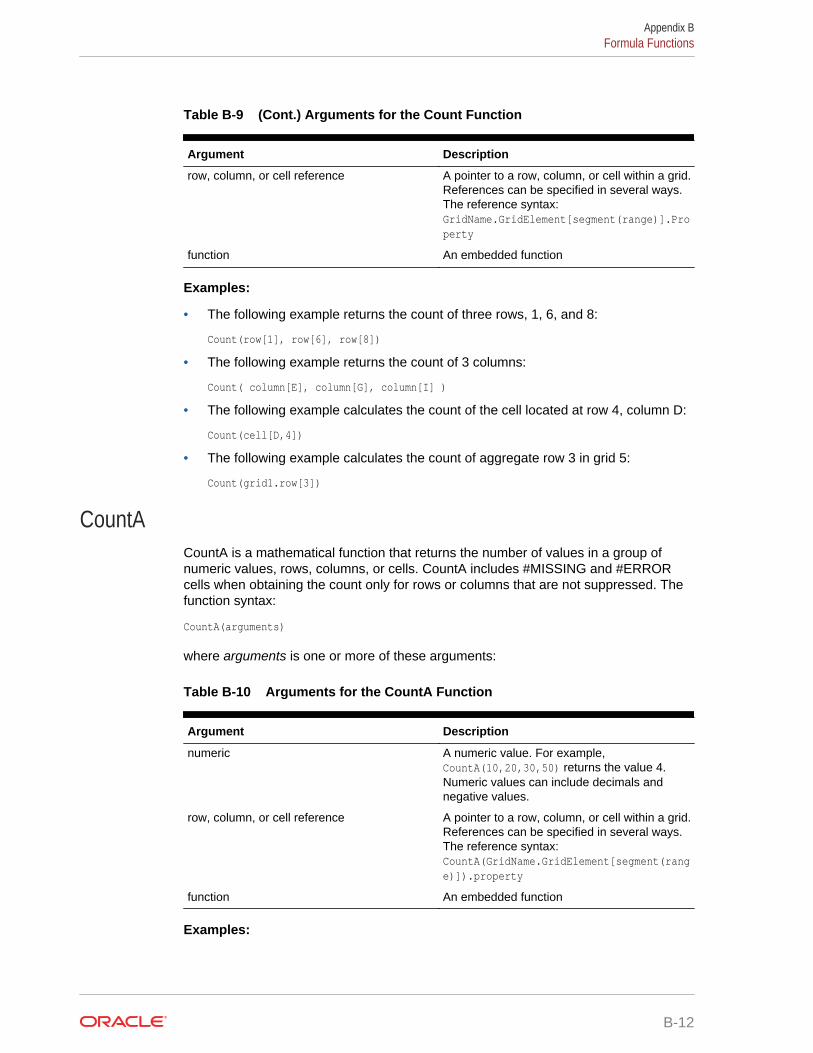
Table B-9 (Cont.) Arguments for the Count Function
Argument Description
row, column, or cell reference A pointer to a row, column, or cell within a grid.References can be specified in several ways.The reference syntax:GridName.GridElement[segment(range)].Property
function An embedded function
Examples:
• The following example returns the count of three rows, 1, 6, and 8:
Count(row[1], row[6], row[8])
• The following example returns the count of 3 columns:
Count( column[E], column[G], column[I] )
• The following example calculates the count of the cell located at row 4, column D:
Count(cell[D,4])
• The following example calculates the count of aggregate row 3 in grid 5:
Count(grid1.row[3])
CountACountA is a mathematical function that returns the number of values in a group ofnumeric values, rows, columns, or cells. CountA includes #MISSING and #ERRORcells when obtaining the count only for rows or columns that are not suppressed. Thefunction syntax:
CountA(arguments)
where arguments is one or more of these arguments:
Table B-10 Arguments for the CountA Function
Argument Description
numeric A numeric value. For example,CountA(10,20,30,50) returns the value 4.Numeric values can include decimals andnegative values.
row, column, or cell reference A pointer to a row, column, or cell within a grid.References can be specified in several ways.The reference syntax:CountA(GridName.GridElement[segment(range)]).property
function An embedded function
Examples:
Appendix BFormula Functions
B-12
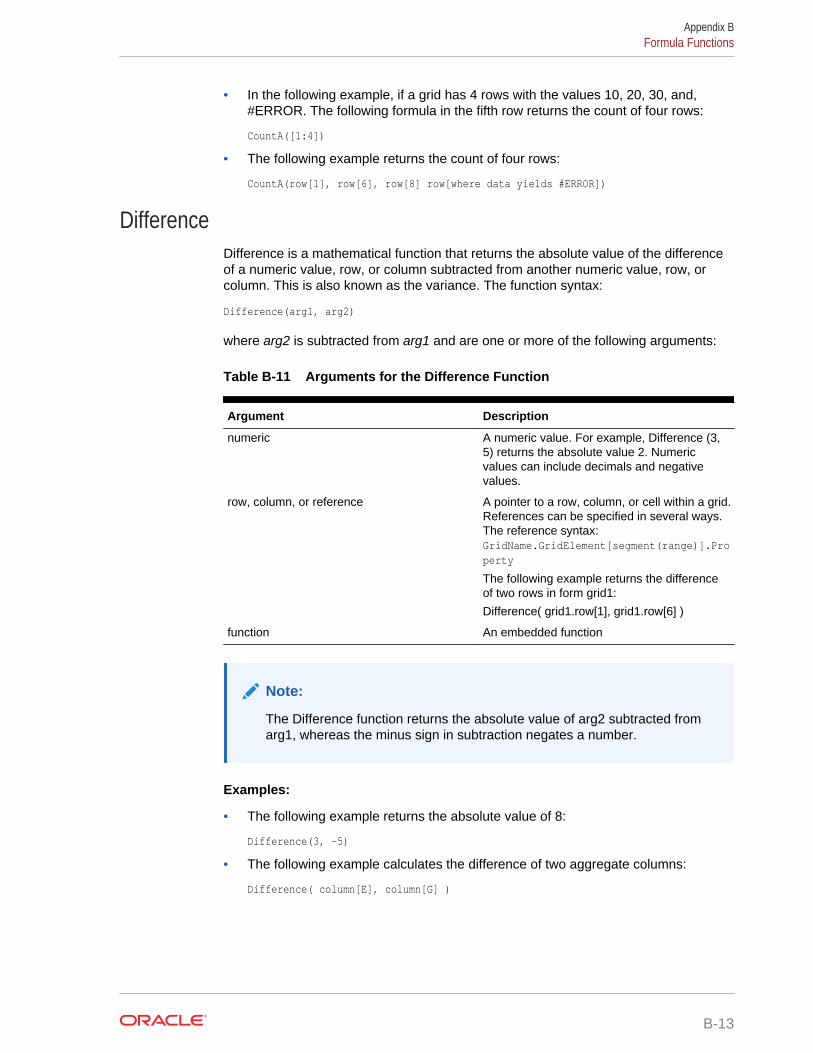
• In the following example, if a grid has 4 rows with the values 10, 20, 30, and,#ERROR. The following formula in the fifth row returns the count of four rows:
CountA([1:4])
• The following example returns the count of four rows:
CountA(row[1], row[6], row[8] row[where data yields #ERROR])
DifferenceDifference is a mathematical function that returns the absolute value of the differenceof a numeric value, row, or column subtracted from another numeric value, row, orcolumn. This is also known as the variance. The function syntax:
Difference(arg1, arg2)
where arg2 is subtracted from arg1 and are one or more of the following arguments:
Table B-11 Arguments for the Difference Function
Argument Description
numeric A numeric value. For example, Difference (3,5) returns the absolute value 2. Numericvalues can include decimals and negativevalues.
row, column, or reference A pointer to a row, column, or cell within a grid.References can be specified in several ways.The reference syntax:GridName.GridElement[segment(range)].Property
The following example returns the differenceof two rows in form grid1:
Difference( grid1.row[1], grid1.row[6] )
function An embedded function
Note:
The Difference function returns the absolute value of arg2 subtracted fromarg1, whereas the minus sign in subtraction negates a number.
Examples:
• The following example returns the absolute value of 8:
Difference(3, -5)
• The following example calculates the difference of two aggregate columns:
Difference( column[E], column[G] )
Appendix BFormula Functions
B-13
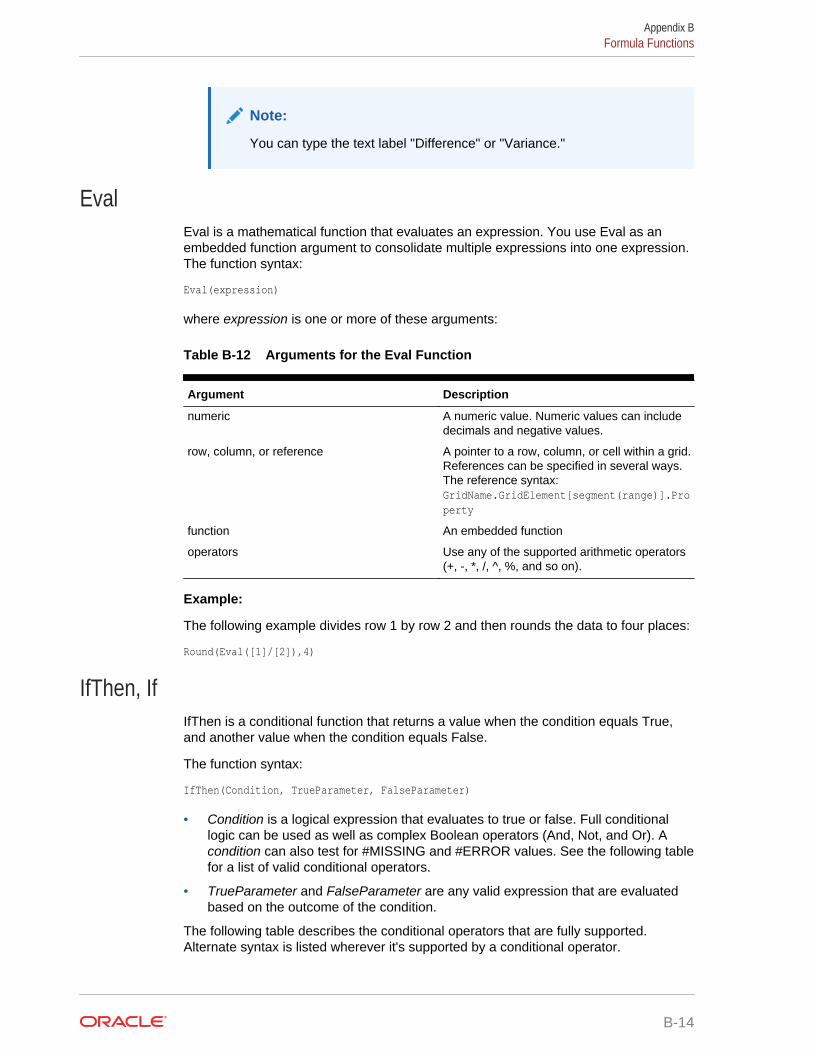
Note:
You can type the text label "Difference" or "Variance."
EvalEval is a mathematical function that evaluates an expression. You use Eval as anembedded function argument to consolidate multiple expressions into one expression.The function syntax:
Eval(expression)
where expression is one or more of these arguments:
Table B-12 Arguments for the Eval Function
Argument Description
numeric A numeric value. Numeric values can includedecimals and negative values.
row, column, or reference A pointer to a row, column, or cell within a grid.References can be specified in several ways.The reference syntax:GridName.GridElement[segment(range)].Property
function An embedded function
operators Use any of the supported arithmetic operators(+, -, *, /, ^, %, and so on).
Example:
The following example divides row 1 by row 2 and then rounds the data to four places:
Round(Eval([1]/[2]),4)
IfThen, IfIfThen is a conditional function that returns a value when the condition equals True,and another value when the condition equals False.
The function syntax:
IfThen(Condition, TrueParameter, FalseParameter)
• Condition is a logical expression that evaluates to true or false. Full conditionallogic can be used as well as complex Boolean operators (And, Not, and Or). Acondition can also test for #MISSING and #ERROR values. See the following tablefor a list of valid conditional operators.
• TrueParameter and FalseParameter are any valid expression that are evaluatedbased on the outcome of the condition.
The following table describes the conditional operators that are fully supported.Alternate syntax is listed wherever it's supported by a conditional operator.
Appendix BFormula Functions
B-14
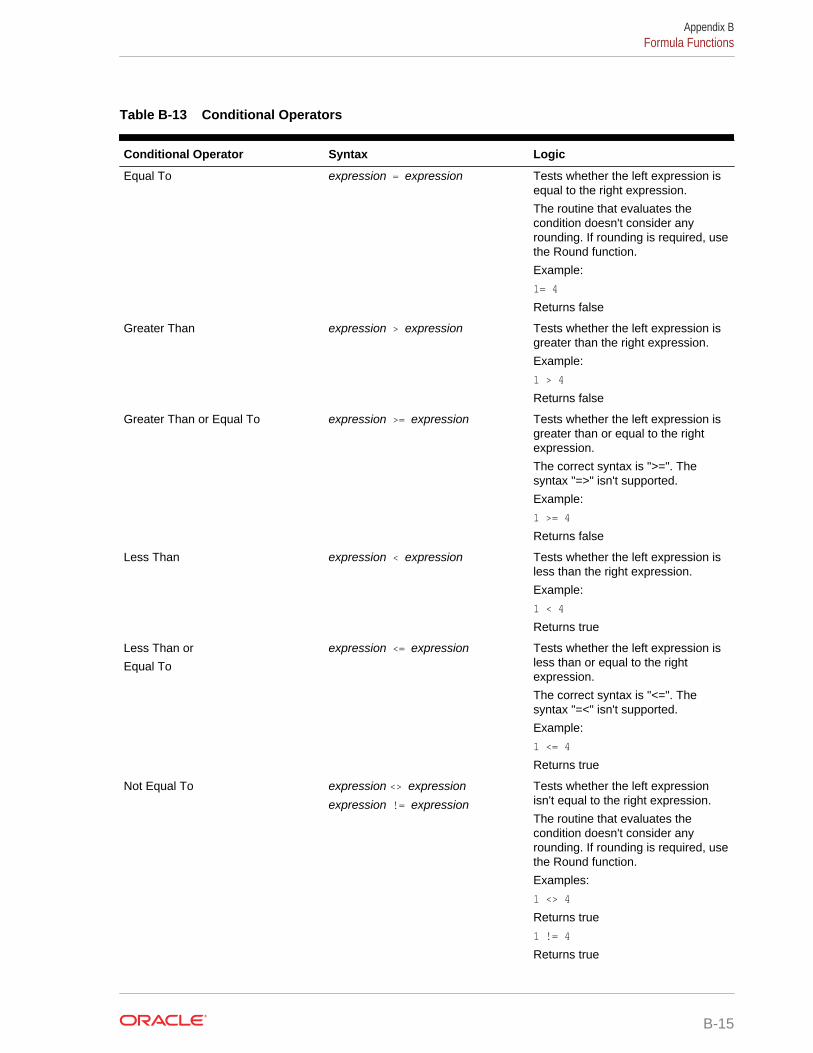
Table B-13 Conditional Operators
Conditional Operator Syntax Logic
Equal To expression = expression Tests whether the left expression isequal to the right expression.
The routine that evaluates thecondition doesn't consider anyrounding. If rounding is required, usethe Round function.
Example:
1= 4
Returns false
Greater Than expression > expression Tests whether the left expression isgreater than the right expression.
Example:
1 > 4
Returns false
Greater Than or Equal To expression >= expression Tests whether the left expression isgreater than or equal to the rightexpression.
The correct syntax is ">=". Thesyntax "=>" isn't supported.
Example:
1 >= 4
Returns false
Less Than expression < expression Tests whether the left expression isless than the right expression.
Example:
1 < 4
Returns true
Less Than or
Equal To
expression <= expression Tests whether the left expression isless than or equal to the rightexpression.
The correct syntax is "<=". Thesyntax "=<" isn't supported.
Example:
1 <= 4
Returns true
Not Equal To expression <> expressionexpression != expression
Tests whether the left expressionisn't equal to the right expression.
The routine that evaluates thecondition doesn't consider anyrounding. If rounding is required, usethe Round function.
Examples:
1 <> 4
Returns true
1 != 4
Returns true
Appendix BFormula Functions
B-15
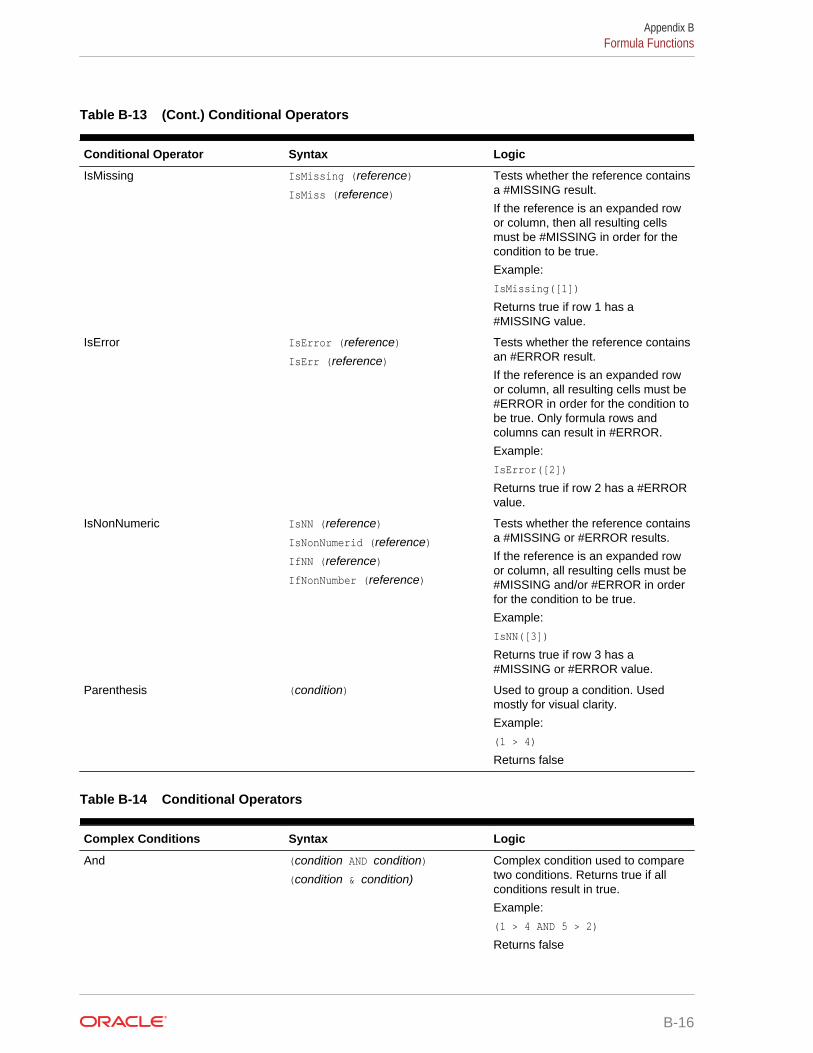
Table B-13 (Cont.) Conditional Operators
Conditional Operator Syntax Logic
IsMissing IsMissing (reference)IsMiss (reference)
Tests whether the reference containsa #MISSING result.
If the reference is an expanded rowor column, then all resulting cellsmust be #MISSING in order for thecondition to be true.
Example:
IsMissing([1])
Returns true if row 1 has a#MISSING value.
IsError IsError (reference)IsErr (reference)
Tests whether the reference containsan #ERROR result.
If the reference is an expanded rowor column, all resulting cells must be#ERROR in order for the condition tobe true. Only formula rows andcolumns can result in #ERROR.
Example:
IsError([2])
Returns true if row 2 has a #ERRORvalue.
IsNonNumeric IsNN (reference)IsNonNumerid (reference)IfNN (reference)IfNonNumber (reference)
Tests whether the reference containsa #MISSING or #ERROR results.
If the reference is an expanded rowor column, all resulting cells must be#MISSING and/or #ERROR in orderfor the condition to be true.
Example:
IsNN([3])
Returns true if row 3 has a#MISSING or #ERROR value.
Parenthesis (condition) Used to group a condition. Usedmostly for visual clarity.
Example:
(1 > 4)
Returns false
Table B-14 Conditional Operators
Complex Conditions Syntax Logic
And (condition AND condition)(condition & condition)
Complex condition used to comparetwo conditions. Returns true if allconditions result in true.
Example:
(1 > 4 AND 5 > 2)
Returns false
Appendix BFormula Functions
B-16
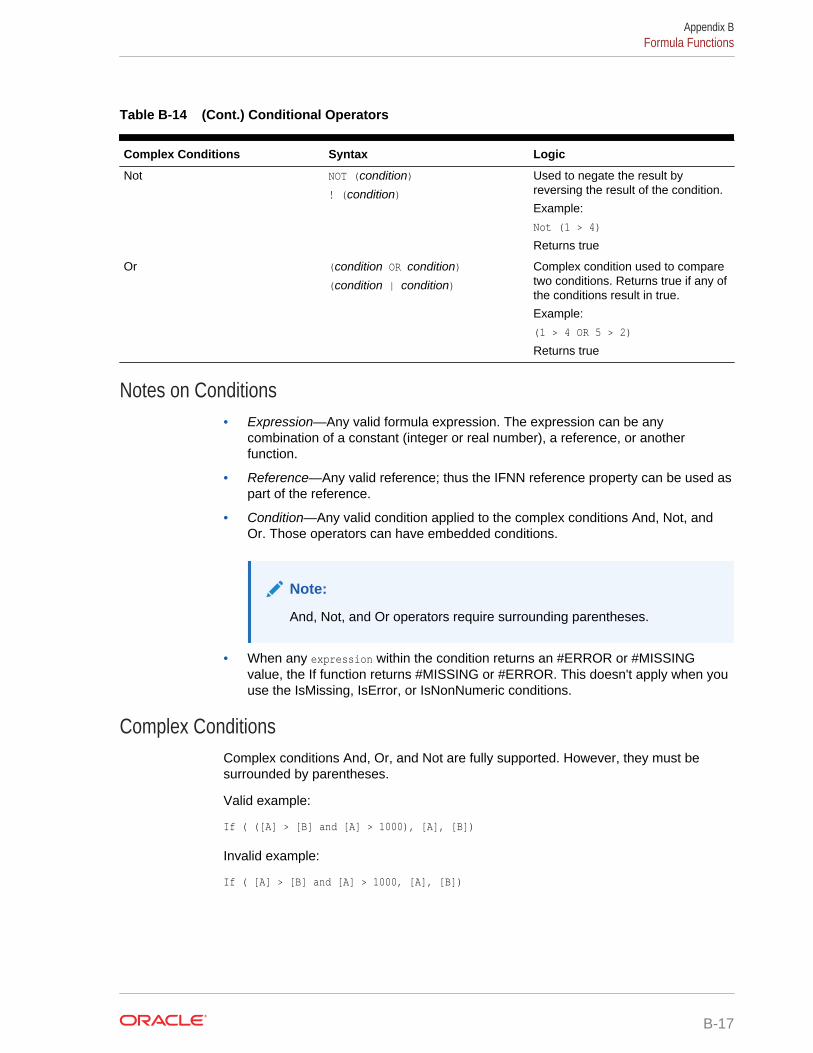
Table B-14 (Cont.) Conditional Operators
Complex Conditions Syntax Logic
Not NOT (condition)! (condition)
Used to negate the result byreversing the result of the condition.
Example:
Not (1 > 4)
Returns true
Or (condition OR condition)(condition | condition)
Complex condition used to comparetwo conditions. Returns true if any ofthe conditions result in true.
Example:
(1 > 4 OR 5 > 2)
Returns true
Notes on Conditions• Expression—Any valid formula expression. The expression can be any
combination of a constant (integer or real number), a reference, or anotherfunction.
• Reference—Any valid reference; thus the IFNN reference property can be used aspart of the reference.
• Condition—Any valid condition applied to the complex conditions And, Not, andOr. Those operators can have embedded conditions.
Note:
And, Not, and Or operators require surrounding parentheses.
• When any expression within the condition returns an #ERROR or #MISSINGvalue, the If function returns #MISSING or #ERROR. This doesn't apply when youuse the IsMissing, IsError, or IsNonNumeric conditions.
Complex ConditionsComplex conditions And, Or, and Not are fully supported. However, they must besurrounded by parentheses.
Valid example:
If ( ([A] > [B] and [A] > 1000), [A], [B])
Invalid example:
If ( [A] > [B] and [A] > 1000, [A], [B])
Appendix BFormula Functions
B-17
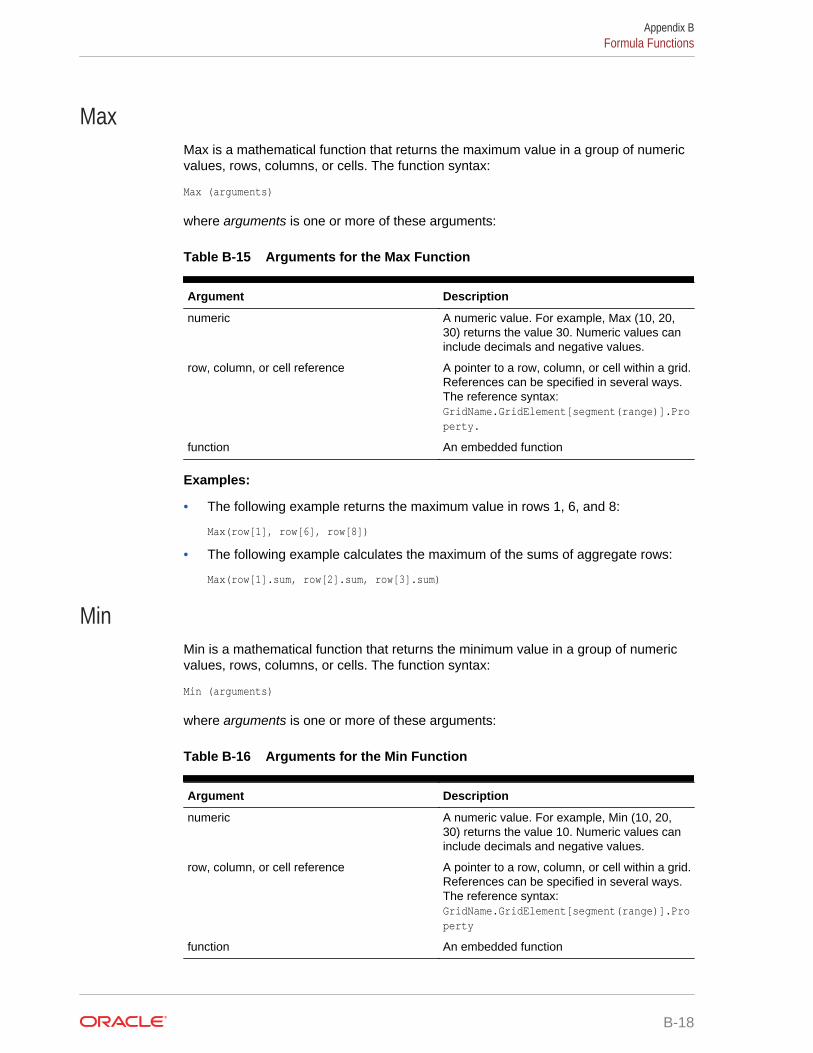
MaxMax is a mathematical function that returns the maximum value in a group of numericvalues, rows, columns, or cells. The function syntax:
Max (arguments)
where arguments is one or more of these arguments:
Table B-15 Arguments for the Max Function
Argument Description
numeric A numeric value. For example, Max (10, 20,30) returns the value 30. Numeric values caninclude decimals and negative values.
row, column, or cell reference A pointer to a row, column, or cell within a grid.References can be specified in several ways.The reference syntax:GridName.GridElement[segment(range)].Property.
function An embedded function
Examples:
• The following example returns the maximum value in rows 1, 6, and 8:
Max(row[1], row[6], row[8])
• The following example calculates the maximum of the sums of aggregate rows:
Max(row[1].sum, row[2].sum, row[3].sum)
MinMin is a mathematical function that returns the minimum value in a group of numericvalues, rows, columns, or cells. The function syntax:
Min (arguments)
where arguments is one or more of these arguments:
Table B-16 Arguments for the Min Function
Argument Description
numeric A numeric value. For example, Min (10, 20,30) returns the value 10. Numeric values caninclude decimals and negative values.
row, column, or cell reference A pointer to a row, column, or cell within a grid.References can be specified in several ways.The reference syntax:GridName.GridElement[segment(range)].Property
function An embedded function
Appendix BFormula Functions
B-18
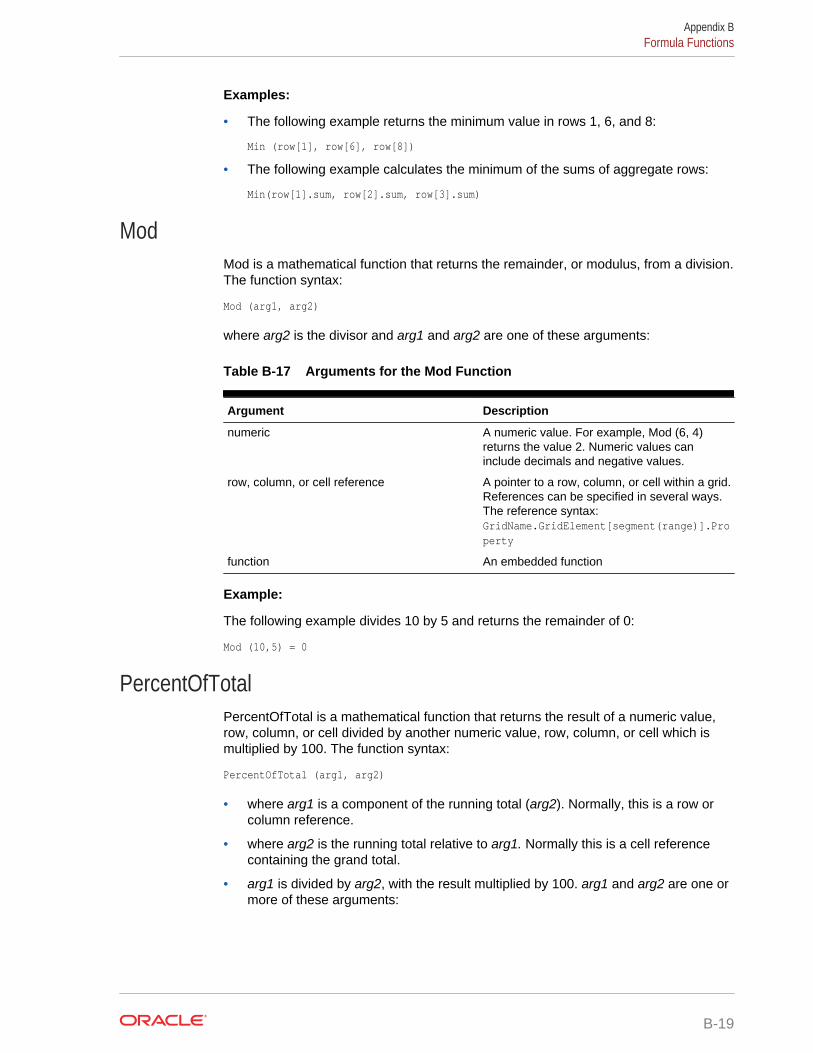
Examples:
• The following example returns the minimum value in rows 1, 6, and 8:
Min (row[1], row[6], row[8])
• The following example calculates the minimum of the sums of aggregate rows:
Min(row[1].sum, row[2].sum, row[3].sum)
ModMod is a mathematical function that returns the remainder, or modulus, from a division.The function syntax:
Mod (arg1, arg2)
where arg2 is the divisor and arg1 and arg2 are one of these arguments:
Table B-17 Arguments for the Mod Function
Argument Description
numeric A numeric value. For example, Mod (6, 4)returns the value 2. Numeric values caninclude decimals and negative values.
row, column, or cell reference A pointer to a row, column, or cell within a grid.References can be specified in several ways.The reference syntax:GridName.GridElement[segment(range)].Property
function An embedded function
Example:
The following example divides 10 by 5 and returns the remainder of 0:
Mod (10,5) = 0
PercentOfTotalPercentOfTotal is a mathematical function that returns the result of a numeric value,row, column, or cell divided by another numeric value, row, column, or cell which ismultiplied by 100. The function syntax:
PercentOfTotal (arg1, arg2)
• where arg1 is a component of the running total (arg2). Normally, this is a row orcolumn reference.
• where arg2 is the running total relative to arg1. Normally this is a cell referencecontaining the grand total.
• arg1 is divided by arg2, with the result multiplied by 100. arg1 and arg2 are one ormore of these arguments:
Appendix BFormula Functions
B-19

Table B-18 Arguments for the PercentOfTotal Function
Argument Description
numeric A numeric value. For example,PercentofTotal (100, 20) returns the value500.
Numeric values can include decimals andnegative values.
row, column, or cell reference A pointer to a row, column, or cell within agrid. References can be specified in severalways. The reference syntax:GridName.GridElement[segment(range)].Property
function An embedded function
Note:
This function requires two arguments.
Examples:
• The following example returns the value of 5 percent.
PercentofTotal(20, 400)
• The following example divides the value of each cell in column A by the Total Mktvalue in cell A5, multiplies the result by 100, and displays the resultingPercentOfTotal in column B. The formula:
PercentOfTotal ([A], [A,5]),
Results for the PercentOfTotal Function
Using the above example, the following table shows the PercentOfTotal results incolumn B:
Tip:
You enter the formula by clicking on the header for Column B and using theformula bar.
Appendix BFormula Functions
B-20
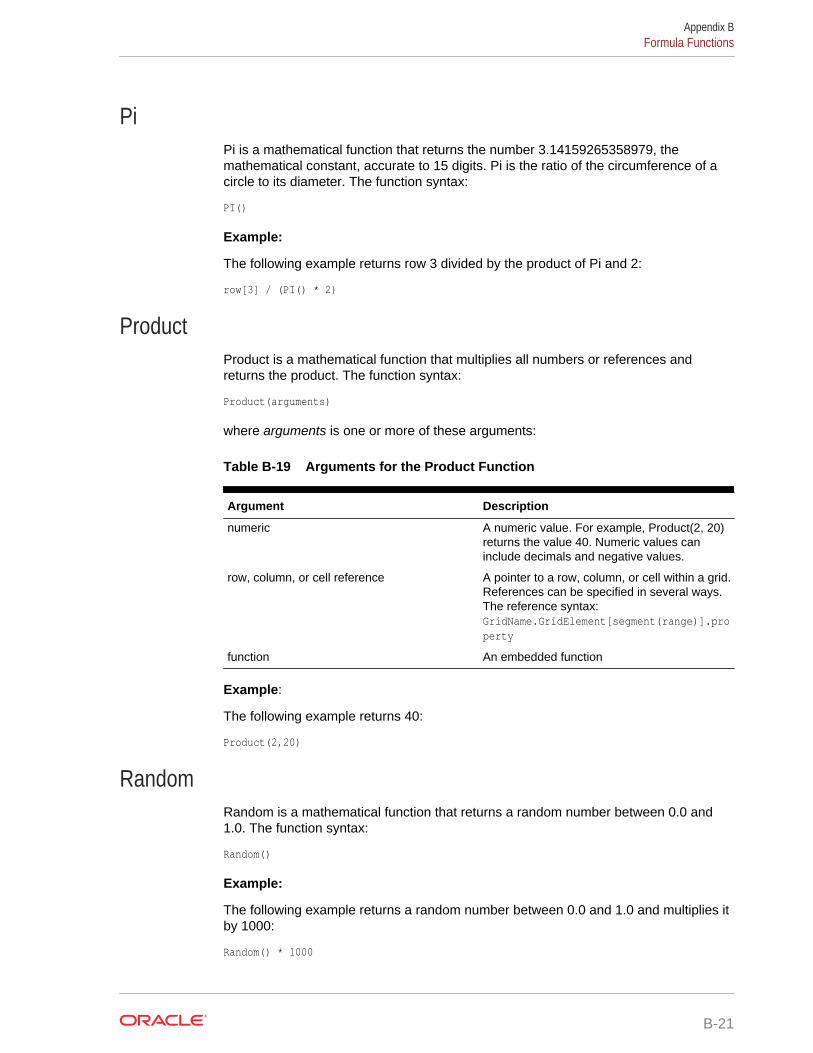
PiPi is a mathematical function that returns the number 3.14159265358979, themathematical constant, accurate to 15 digits. Pi is the ratio of the circumference of acircle to its diameter. The function syntax:
PI()
Example:
The following example returns row 3 divided by the product of Pi and 2:
row[3] / (PI() * 2)
ProductProduct is a mathematical function that multiplies all numbers or references andreturns the product. The function syntax:
Product(arguments)
where arguments is one or more of these arguments:
Table B-19 Arguments for the Product Function
Argument Description
numeric A numeric value. For example, Product(2, 20)returns the value 40. Numeric values caninclude decimals and negative values.
row, column, or cell reference A pointer to a row, column, or cell within a grid.References can be specified in several ways.The reference syntax:GridName.GridElement[segment(range)].property
function An embedded function
Example:
The following example returns 40:
Product(2,20)
RandomRandom is a mathematical function that returns a random number between 0.0 and1.0. The function syntax:
Random()
Example:
The following example returns a random number between 0.0 and 1.0 and multiplies itby 1000:
Random() * 1000
Appendix BFormula Functions
B-21
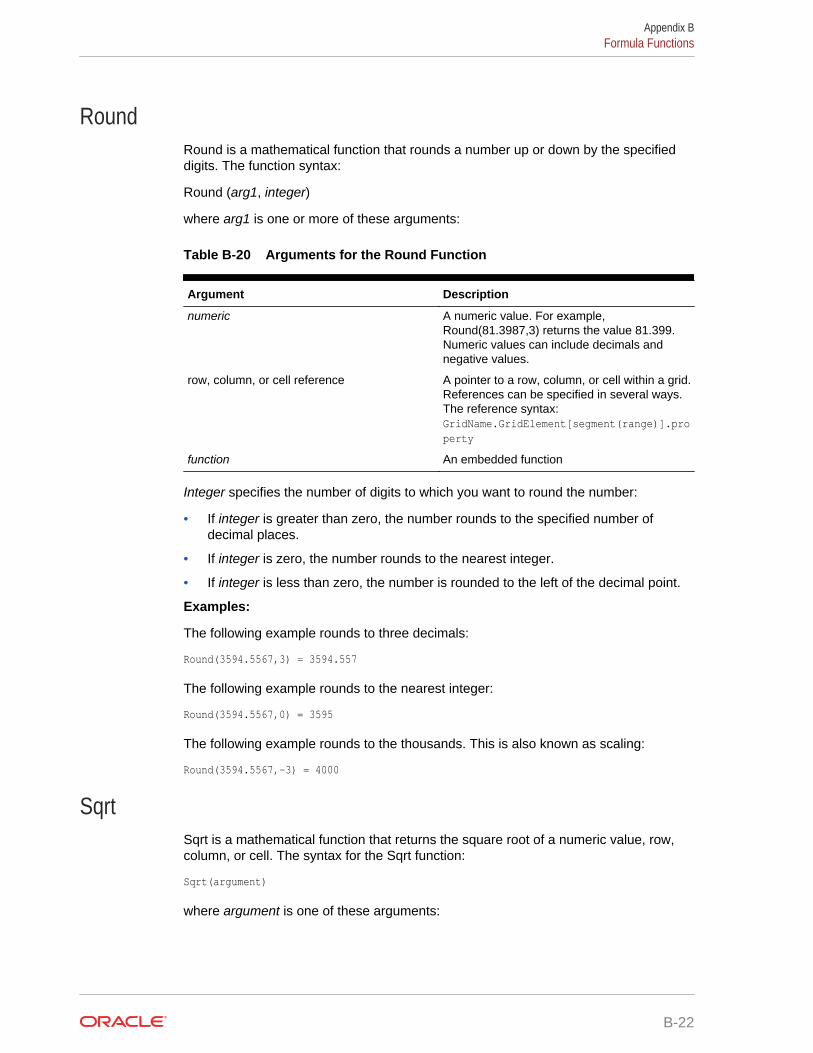
RoundRound is a mathematical function that rounds a number up or down by the specifieddigits. The function syntax:
Round (arg1, integer)
where arg1 is one or more of these arguments:
Table B-20 Arguments for the Round Function
Argument Description
numeric A numeric value. For example,Round(81.3987,3) returns the value 81.399.Numeric values can include decimals andnegative values.
row, column, or cell reference A pointer to a row, column, or cell within a grid.References can be specified in several ways.The reference syntax:GridName.GridElement[segment(range)].property
function An embedded function
Integer specifies the number of digits to which you want to round the number:
• If integer is greater than zero, the number rounds to the specified number ofdecimal places.
• If integer is zero, the number rounds to the nearest integer.
• If integer is less than zero, the number is rounded to the left of the decimal point.
Examples:
The following example rounds to three decimals:
Round(3594.5567,3) = 3594.557
The following example rounds to the nearest integer:
Round(3594.5567,0) = 3595
The following example rounds to the thousands. This is also known as scaling:
Round(3594.5567,-3) = 4000
SqrtSqrt is a mathematical function that returns the square root of a numeric value, row,column, or cell. The syntax for the Sqrt function:
Sqrt(argument)
where argument is one of these arguments:
Appendix BFormula Functions
B-22
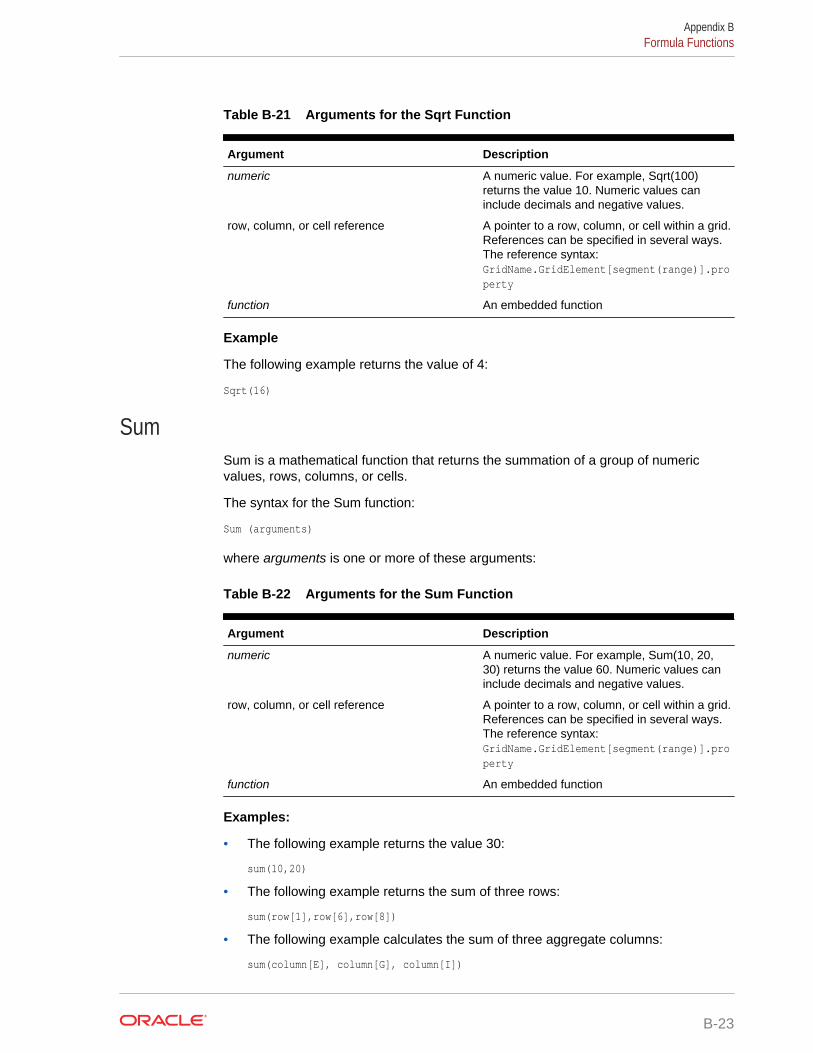
Table B-21 Arguments for the Sqrt Function
Argument Description
numeric A numeric value. For example, Sqrt(100)returns the value 10. Numeric values caninclude decimals and negative values.
row, column, or cell reference A pointer to a row, column, or cell within a grid.References can be specified in several ways.The reference syntax:GridName.GridElement[segment(range)].property
function An embedded function
Example
The following example returns the value of 4:
Sqrt(16)
SumSum is a mathematical function that returns the summation of a group of numericvalues, rows, columns, or cells.
The syntax for the Sum function:
Sum (arguments)
where arguments is one or more of these arguments:
Table B-22 Arguments for the Sum Function
Argument Description
numeric A numeric value. For example, Sum(10, 20,30) returns the value 60. Numeric values caninclude decimals and negative values.
row, column, or cell reference A pointer to a row, column, or cell within a grid.References can be specified in several ways.The reference syntax:GridName.GridElement[segment(range)].property
function An embedded function
Examples:
• The following example returns the value 30:
sum(10,20)
• The following example returns the sum of three rows:
sum(row[1],row[6],row[8])
• The following example calculates the sum of three aggregate columns:
sum(column[E], column[G], column[I])
Appendix BFormula Functions
B-23
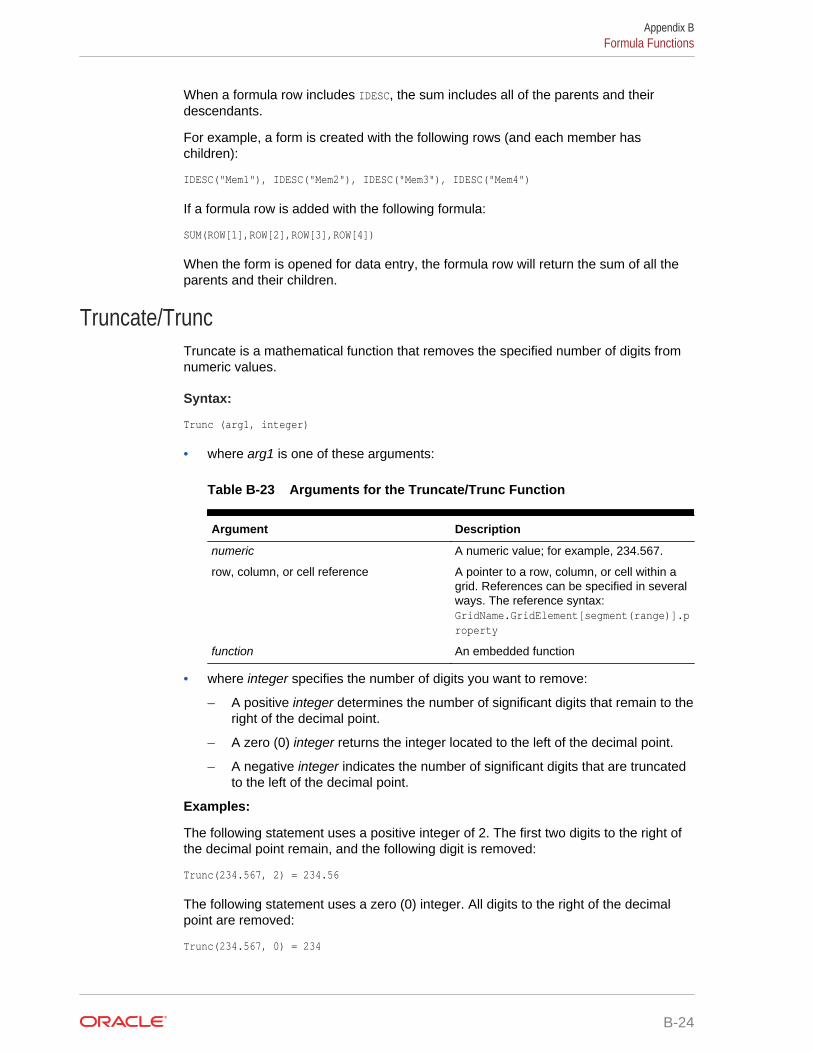
When a formula row includes IDESC, the sum includes all of the parents and theirdescendants.
For example, a form is created with the following rows (and each member haschildren):
IDESC("Mem1"), IDESC("Mem2"), IDESC("Mem3"), IDESC("Mem4")
If a formula row is added with the following formula:
SUM(ROW[1],ROW[2],ROW[3],ROW[4])
When the form is opened for data entry, the formula row will return the sum of all theparents and their children.
Truncate/TruncTruncate is a mathematical function that removes the specified number of digits fromnumeric values.
Syntax:
Trunc (arg1, integer)
• where arg1 is one of these arguments:
Table B-23 Arguments for the Truncate/Trunc Function
Argument Description
numeric A numeric value; for example, 234.567.
row, column, or cell reference A pointer to a row, column, or cell within agrid. References can be specified in severalways. The reference syntax:GridName.GridElement[segment(range)].property
function An embedded function
• where integer specifies the number of digits you want to remove:
– A positive integer determines the number of significant digits that remain to theright of the decimal point.
– A zero (0) integer returns the integer located to the left of the decimal point.
– A negative integer indicates the number of significant digits that are truncatedto the left of the decimal point.
Examples:
The following statement uses a positive integer of 2. The first two digits to the right ofthe decimal point remain, and the following digit is removed:
Trunc(234.567, 2) = 234.56
The following statement uses a zero (0) integer. All digits to the right of the decimalpoint are removed:
Trunc(234.567, 0) = 234
Appendix BFormula Functions
B-24
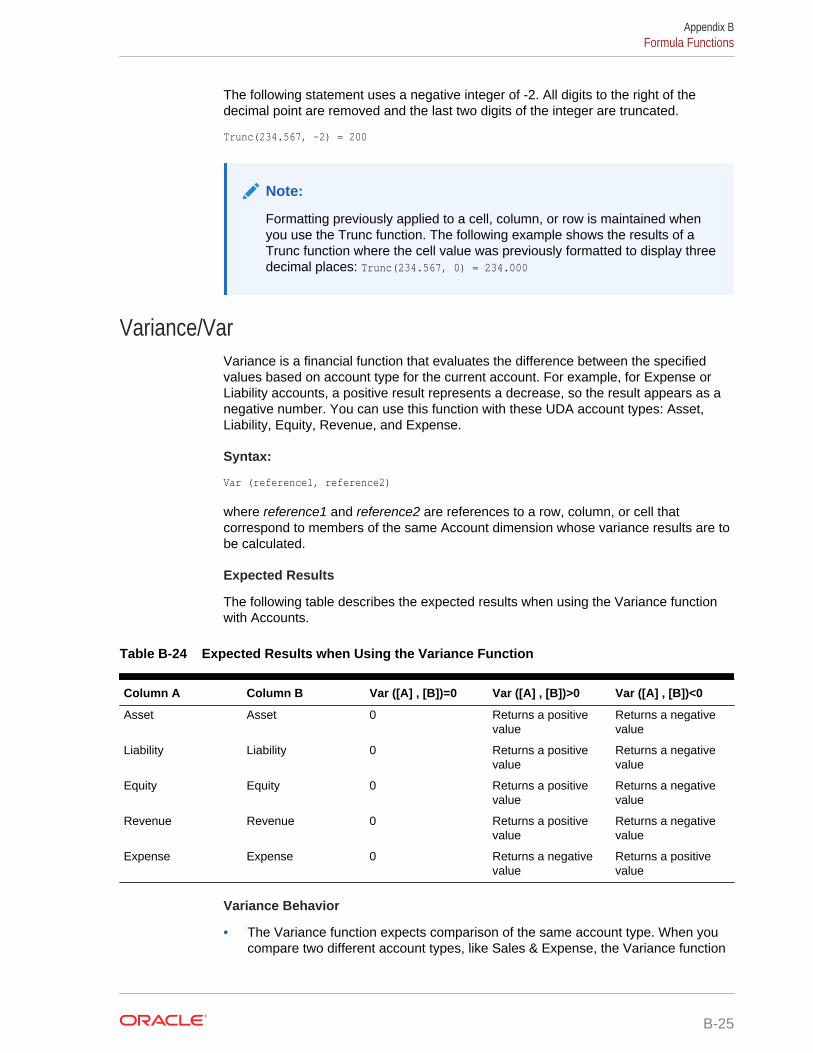
The following statement uses a negative integer of -2. All digits to the right of thedecimal point are removed and the last two digits of the integer are truncated.
Trunc(234.567, -2) = 200
Note:
Formatting previously applied to a cell, column, or row is maintained whenyou use the Trunc function. The following example shows the results of aTrunc function where the cell value was previously formatted to display threedecimal places: Trunc(234.567, 0) = 234.000
Variance/VarVariance is a financial function that evaluates the difference between the specifiedvalues based on account type for the current account. For example, for Expense orLiability accounts, a positive result represents a decrease, so the result appears as anegative number. You can use this function with these UDA account types: Asset,Liability, Equity, Revenue, and Expense.
Syntax:
Var (reference1, reference2)
where reference1 and reference2 are references to a row, column, or cell thatcorrespond to members of the same Account dimension whose variance results are tobe calculated.
Expected Results
The following table describes the expected results when using the Variance functionwith Accounts.
Table B-24 Expected Results when Using the Variance Function
Column A Column B Var ([A] , [B])=0 Var ([A] , [B])>0 Var ([A] , [B])<0
Asset Asset 0 Returns a positivevalue
Returns a negativevalue
Liability Liability 0 Returns a positivevalue
Returns a negativevalue
Equity Equity 0 Returns a positivevalue
Returns a negativevalue
Revenue Revenue 0 Returns a positivevalue
Returns a negativevalue
Expense Expense 0 Returns a negativevalue
Returns a positivevalue
Variance Behavior
• The Variance function expects comparison of the same account type. When youcompare two different account types, like Sales & Expense, the Variance function
Appendix BFormula Functions
B-25
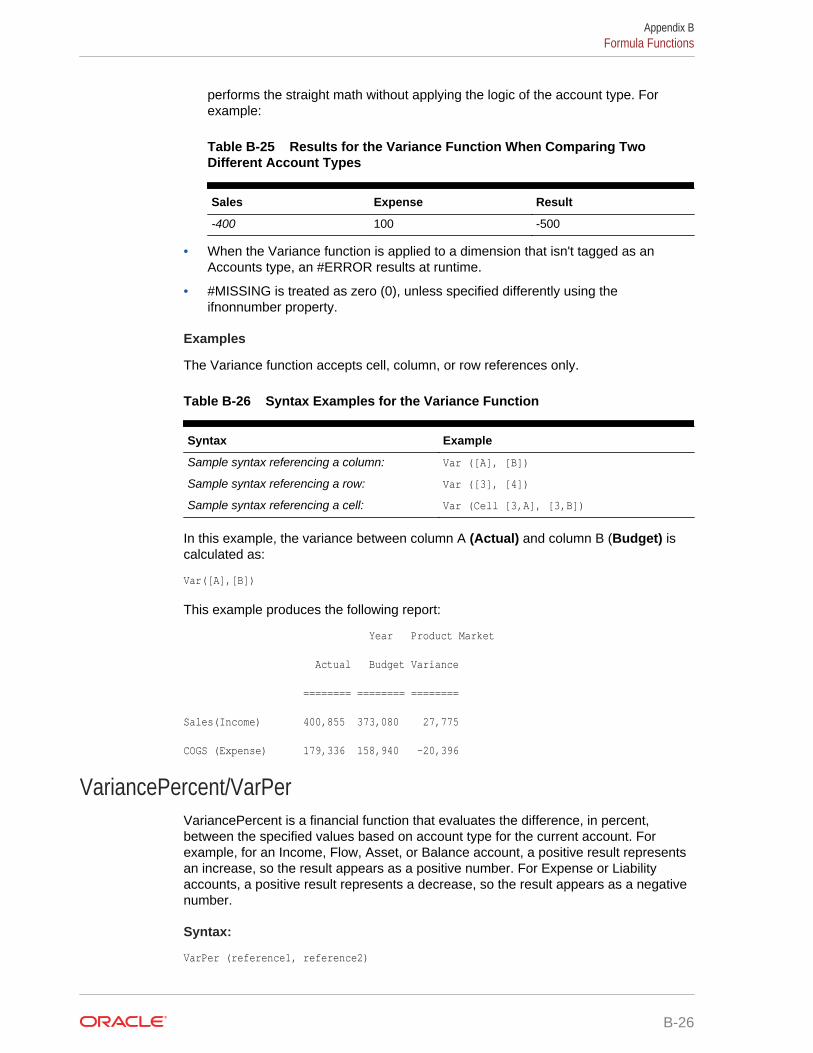
performs the straight math without applying the logic of the account type. Forexample:
Table B-25 Results for the Variance Function When Comparing TwoDifferent Account Types
Sales Expense Result
-400 100 -500
• When the Variance function is applied to a dimension that isn't tagged as anAccounts type, an #ERROR results at runtime.
• #MISSING is treated as zero (0), unless specified differently using theifnonnumber property.
Examples
The Variance function accepts cell, column, or row references only.
Table B-26 Syntax Examples for the Variance Function
Syntax Example
Sample syntax referencing a column: Var ([A], [B])
Sample syntax referencing a row: Var ([3], [4])
Sample syntax referencing a cell: Var (Cell [3,A], [3,B])
In this example, the variance between column A (Actual) and column B (Budget) iscalculated as:
Var([A],[B])
This example produces the following report:
Year Product Market
Actual Budget Variance
======== ======== ========
Sales(Income) 400,855 373,080 27,775
COGS (Expense) 179,336 158,940 -20,396
VariancePercent/VarPerVariancePercent is a financial function that evaluates the difference, in percent,between the specified values based on account type for the current account. Forexample, for an Income, Flow, Asset, or Balance account, a positive result representsan increase, so the result appears as a positive number. For Expense or Liabilityaccounts, a positive result represents a decrease, so the result appears as a negativenumber.
Syntax:
VarPer (reference1, reference2)
Appendix BFormula Functions
B-26
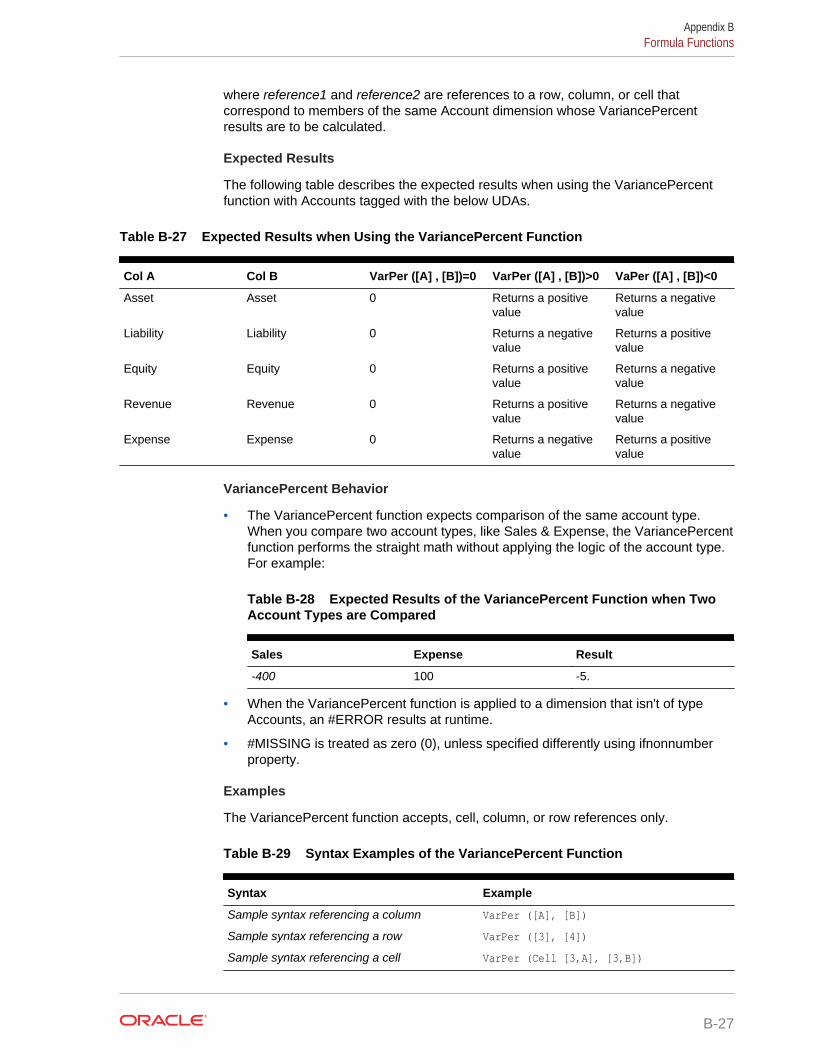
where reference1 and reference2 are references to a row, column, or cell thatcorrespond to members of the same Account dimension whose VariancePercentresults are to be calculated.
Expected Results
The following table describes the expected results when using the VariancePercentfunction with Accounts tagged with the below UDAs.
Table B-27 Expected Results when Using the VariancePercent Function
Col A Col B VarPer ([A] , [B])=0 VarPer ([A] , [B])>0 VaPer ([A] , [B])<0
Asset Asset 0 Returns a positivevalue
Returns a negativevalue
Liability Liability 0 Returns a negativevalue
Returns a positivevalue
Equity Equity 0 Returns a positivevalue
Returns a negativevalue
Revenue Revenue 0 Returns a positivevalue
Returns a negativevalue
Expense Expense 0 Returns a negativevalue
Returns a positivevalue
VariancePercent Behavior
• The VariancePercent function expects comparison of the same account type.When you compare two account types, like Sales & Expense, the VariancePercentfunction performs the straight math without applying the logic of the account type.For example:
Table B-28 Expected Results of the VariancePercent Function when TwoAccount Types are Compared
Sales Expense Result
-400 100 -5.
• When the VariancePercent function is applied to a dimension that isn't of typeAccounts, an #ERROR results at runtime.
• #MISSING is treated as zero (0), unless specified differently using ifnonnumberproperty.
Examples
The VariancePercent function accepts, cell, column, or row references only.
Table B-29 Syntax Examples of the VariancePercent Function
Syntax Example
Sample syntax referencing a column VarPer ([A], [B])
Sample syntax referencing a row VarPer ([3], [4])
Sample syntax referencing a cell VarPer (Cell [3,A], [3,B])
Appendix BFormula Functions
B-27
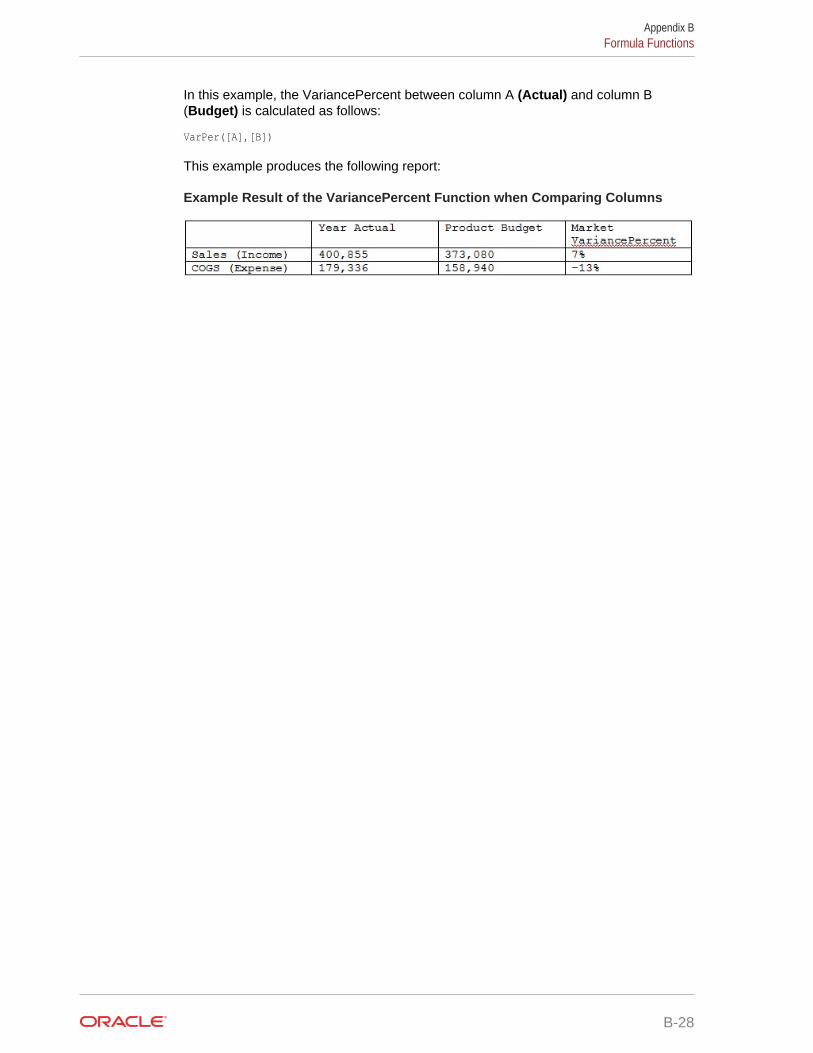
In this example, the VariancePercent between column A (Actual) and column B(Budget) is calculated as follows:
VarPer([A],[B])
This example produces the following report:
Example Result of the VariancePercent Function when Comparing Columns
Appendix BFormula Functions
B-28
COptimizing the Application
Related Topics
• Optimizing Performance
Optimizing PerformanceUse these methods to optimize performance:
• Strategically assign dimensions as dense or sparse and order them from most toleast dense (see About Sparse and Dense Dimensions, About ReorderingDimensions, and Editing Dimensions in the Simplified Dimension Editor).
• Set the Suppress Missing Blocks option (see Setting Form Grid Properties).
See also:
• Writing #MISSING Values
• Other Performance Optimization Tips
About Reordering DimensionsThe order of dimensions is critical for the structure and performance of an application.Optimize performance when ordering dimensions:
• Make Period and Account dense, and order dense dimensions from most to leastdense. The most dense is usually Period, followed by Account. Dense dimensionscalculate faster than sparse dimensions.
• Separate sparse dimensions into aggregating and nonaggregating dimensions.Place aggregating dimensions before nonaggregating dimensions. Order sparsedimensions from most to least dense. Aggregating dimensions, such as Entity,consolidate children into the parent to create new data. Nonaggregatingdimensions, such as Scenario, don't consolidate children to create data.
Writing #MISSING Values#MISSING in a cell indicates that the cell contains no data, whereas zero in a cell is adata value. #MISSING decreases the database size and improves performance.
To write #MISSING to cells:
1. Select the cells to change.
You can select contiguous cells by clicking in the upper-left cell in the range, andthen pressing Shift+Click to select the lower-right cell in the range. You can selectrows and columns by clicking row and column headings. Select a range of rows orcolumns by using Shift+Click.
If the designer sets a form to suppress missing data, and an entire row contains#MISSING (no data), that row doesn't display on the form.
C-1
2. Take an action:
• Press Delete.
• Enter #missing.
You can also enter #MISSING using Smart Lists.
3. Click Save.
The cells are set to #MISSING when you save the form.
Other Performance Optimization Tips• Set upper-level members in a dense dimension to Dynamic Calc.
• Clear unnecessary or historical data. For example, move historical data to aseparate cube to reduce the database size in your current cube.
• Split large forms into multiple smaller forms having fewer rows and columns.Organize related forms into folders.
• Using account annotations affects performance, so use them sparingly.
• The first time the application is launched and forms are opened, caches areloaded, which takes more time than in subsequent sessions. So, before your usersstart using the application, launch the application and open the most commonlyused forms to reduce the loading time for your users.
Appendix COptimizing Performance
C-2
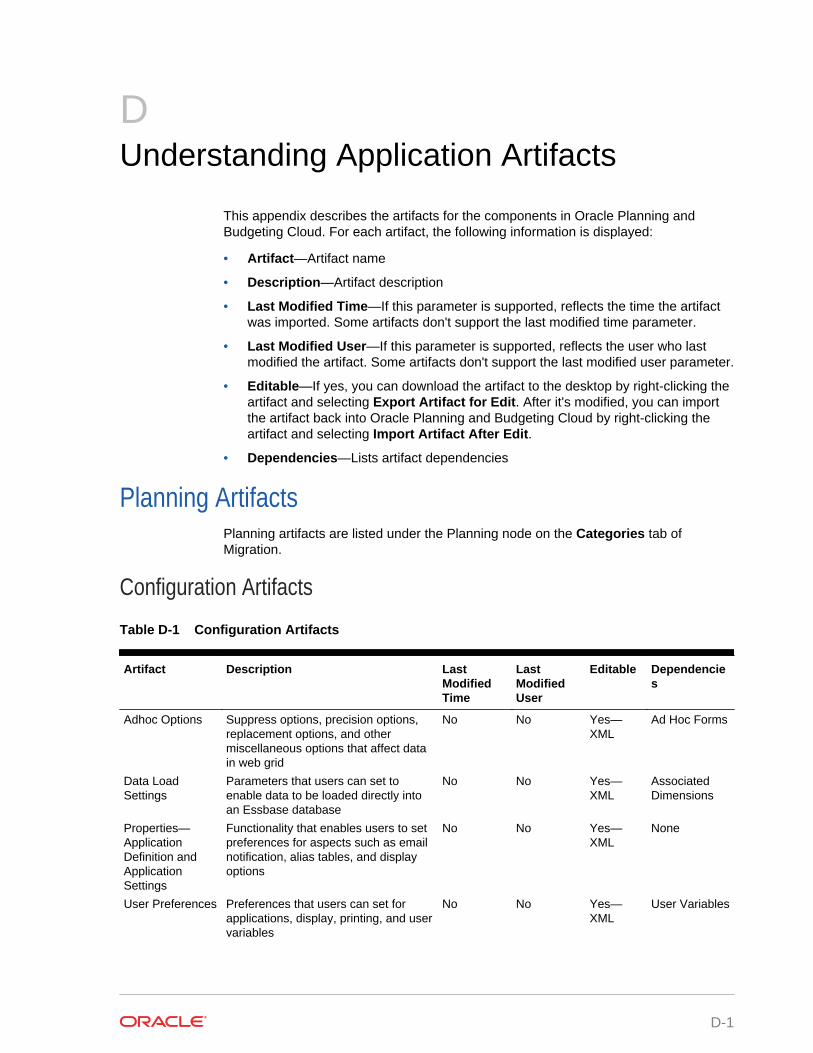
DUnderstanding Application Artifacts
This appendix describes the artifacts for the components in Oracle Planning andBudgeting Cloud. For each artifact, the following information is displayed:
• Artifact—Artifact name
• Description—Artifact description
• Last Modified Time—If this parameter is supported, reflects the time the artifactwas imported. Some artifacts don't support the last modified time parameter.
• Last Modified User—If this parameter is supported, reflects the user who lastmodified the artifact. Some artifacts don't support the last modified user parameter.
• Editable—If yes, you can download the artifact to the desktop by right-clicking theartifact and selecting Export Artifact for Edit. After it's modified, you can importthe artifact back into Oracle Planning and Budgeting Cloud by right-clicking theartifact and selecting Import Artifact After Edit.
• Dependencies—Lists artifact dependencies
Planning ArtifactsPlanning artifacts are listed under the Planning node on the Categories tab ofMigration.
Configuration Artifacts
Table D-1 Configuration Artifacts
Artifact Description LastModifiedTime
LastModifiedUser
Editable Dependencies
Adhoc Options Suppress options, precision options,replacement options, and othermiscellaneous options that affect datain web grid
No No Yes—XML
Ad Hoc Forms
Data LoadSettings
Parameters that users can set toenable data to be loaded directly intoan Essbase database
No No Yes—XML
AssociatedDimensions
Properties—ApplicationDefinition andApplicationSettings
Functionality that enables users to setpreferences for aspects such as emailnotification, alias tables, and displayoptions
No No Yes—XML
None
User Preferences Preferences that users can set forapplications, display, printing, and uservariables
No No Yes—XML
User Variables
D-1
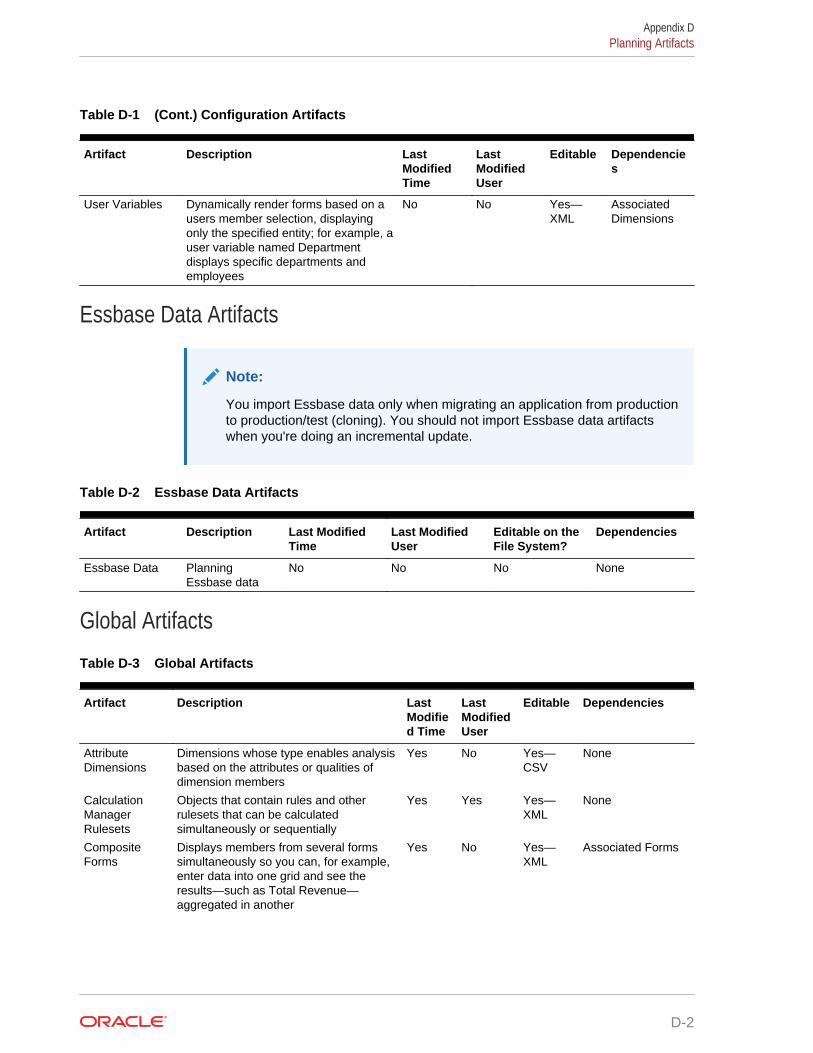
Table D-1 (Cont.) Configuration Artifacts
Artifact Description LastModifiedTime
LastModifiedUser
Editable Dependencies
User Variables Dynamically render forms based on ausers member selection, displayingonly the specified entity; for example, auser variable named Departmentdisplays specific departments andemployees
No No Yes—XML
AssociatedDimensions
Essbase Data Artifacts
Note:
You import Essbase data only when migrating an application from productionto production/test (cloning). You should not import Essbase data artifactswhen you're doing an incremental update.
Table D-2 Essbase Data Artifacts
Artifact Description Last ModifiedTime
Last ModifiedUser
Editable on theFile System?
Dependencies
Essbase Data PlanningEssbase data
No No No None
Global Artifacts
Table D-3 Global Artifacts
Artifact Description LastModified Time
LastModifiedUser
Editable Dependencies
AttributeDimensions
Dimensions whose type enables analysisbased on the attributes or qualities ofdimension members
Yes No Yes—CSV
None
CalculationManagerRulesets
Objects that contain rules and otherrulesets that can be calculatedsimultaneously or sequentially
Yes Yes Yes—XML
None
CompositeForms
Displays members from several formssimultaneously so you can, for example,enter data into one grid and see theresults—such as Total Revenue—aggregated in another
Yes No Yes—XML
Associated Forms
Appendix DPlanning Artifacts
D-2
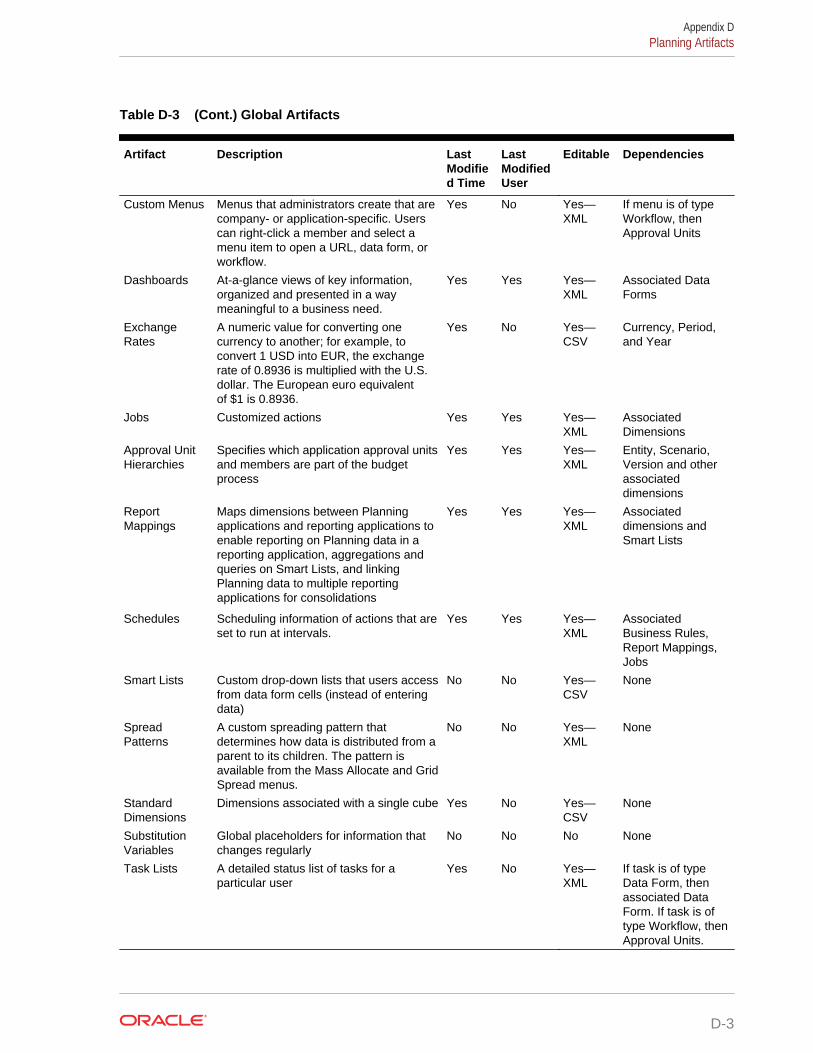
Table D-3 (Cont.) Global Artifacts
Artifact Description LastModified Time
LastModifiedUser
Editable Dependencies
Custom Menus Menus that administrators create that arecompany- or application-specific. Userscan right-click a member and select amenu item to open a URL, data form, orworkflow.
Yes No Yes—XML
If menu is of typeWorkflow, thenApproval Units
Dashboards At-a-glance views of key information,organized and presented in a waymeaningful to a business need.
Yes Yes Yes—XML
Associated DataForms
ExchangeRates
A numeric value for converting onecurrency to another; for example, toconvert 1 USD into EUR, the exchangerate of 0.8936 is multiplied with the U.S.dollar. The European euro equivalentof $1 is 0.8936.
Yes No Yes—CSV
Currency, Period,and Year
Jobs Customized actions Yes Yes Yes—XML
AssociatedDimensions
Approval UnitHierarchies
Specifies which application approval unitsand members are part of the budgetprocess
Yes Yes Yes—XML
Entity, Scenario,Version and otherassociateddimensions
ReportMappings
Maps dimensions between Planningapplications and reporting applications toenable reporting on Planning data in areporting application, aggregations andqueries on Smart Lists, and linkingPlanning data to multiple reportingapplications for consolidations
Yes Yes Yes—XML
Associateddimensions andSmart Lists
Schedules Scheduling information of actions that areset to run at intervals.
Yes Yes Yes—XML
AssociatedBusiness Rules,Report Mappings,Jobs
Smart Lists Custom drop-down lists that users accessfrom data form cells (instead of enteringdata)
No No Yes—CSV
None
SpreadPatterns
A custom spreading pattern thatdetermines how data is distributed from aparent to its children. The pattern isavailable from the Mass Allocate and GridSpread menus.
No No Yes—XML
None
StandardDimensions
Dimensions associated with a single cube Yes No Yes—CSV
None
SubstitutionVariables
Global placeholders for information thatchanges regularly
No No No None
Task Lists A detailed status list of tasks for aparticular user
Yes No Yes—XML
If task is of typeData Form, thenassociated DataForm. If task is oftype Workflow, thenApproval Units.
Appendix DPlanning Artifacts
D-3
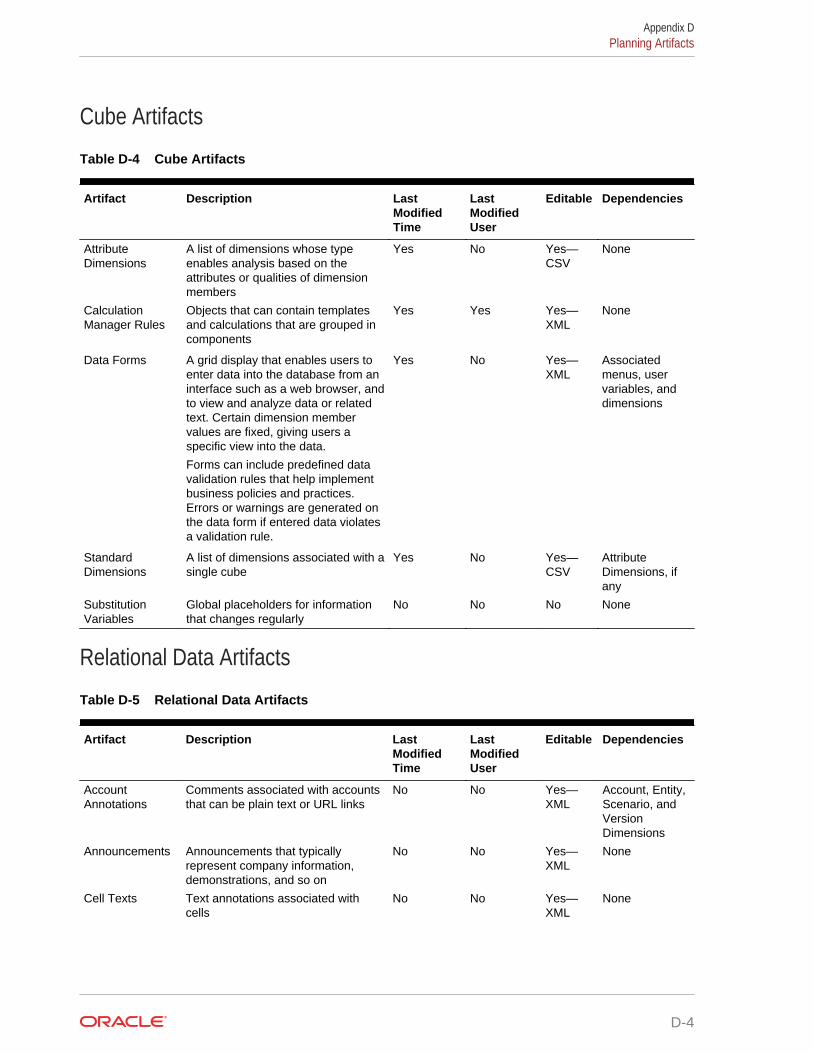
Cube Artifacts
Table D-4 Cube Artifacts
Artifact Description LastModifiedTime
LastModifiedUser
Editable Dependencies
AttributeDimensions
A list of dimensions whose typeenables analysis based on theattributes or qualities of dimensionmembers
Yes No Yes—CSV
None
CalculationManager Rules
Objects that can contain templatesand calculations that are grouped incomponents
Yes Yes Yes—XML
None
Data Forms A grid display that enables users toenter data into the database from aninterface such as a web browser, andto view and analyze data or relatedtext. Certain dimension membervalues are fixed, giving users aspecific view into the data.
Forms can include predefined datavalidation rules that help implementbusiness policies and practices.Errors or warnings are generated onthe data form if entered data violatesa validation rule.
Yes No Yes—XML
Associatedmenus, uservariables, anddimensions
StandardDimensions
A list of dimensions associated with asingle cube
Yes No Yes—CSV
AttributeDimensions, ifany
SubstitutionVariables
Global placeholders for informationthat changes regularly
No No No None
Relational Data Artifacts
Table D-5 Relational Data Artifacts
Artifact Description LastModifiedTime
LastModifiedUser
Editable Dependencies
AccountAnnotations
Comments associated with accountsthat can be plain text or URL links
No No Yes—XML
Account, Entity,Scenario, andVersionDimensions
Announcements Announcements that typicallyrepresent company information,demonstrations, and so on
No No Yes—XML
None
Cell Texts Text annotations associated withcells
No No Yes—XML
None
Appendix DPlanning Artifacts
D-4
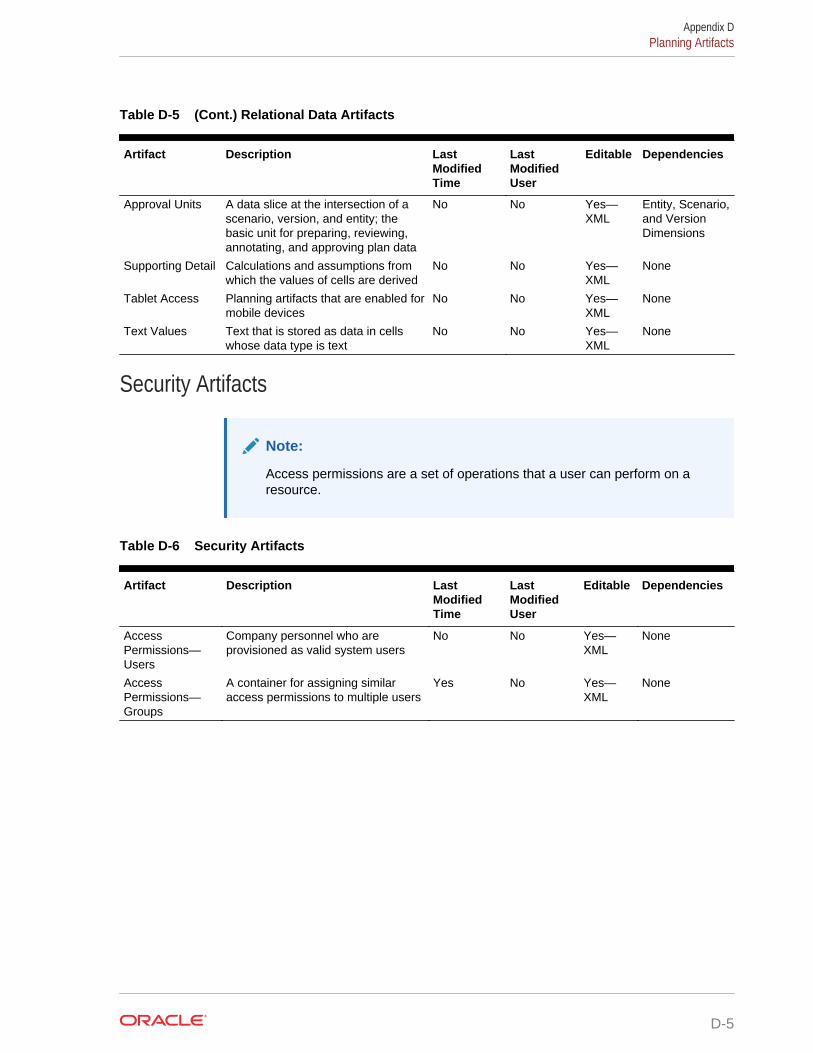
Table D-5 (Cont.) Relational Data Artifacts
Artifact Description LastModifiedTime
LastModifiedUser
Editable Dependencies
Approval Units A data slice at the intersection of ascenario, version, and entity; thebasic unit for preparing, reviewing,annotating, and approving plan data
No No Yes—XML
Entity, Scenario,and VersionDimensions
Supporting Detail Calculations and assumptions fromwhich the values of cells are derived
No No Yes—XML
None
Tablet Access Planning artifacts that are enabled formobile devices
No No Yes—XML
None
Text Values Text that is stored as data in cellswhose data type is text
No No Yes—XML
None
Security Artifacts
Note:
Access permissions are a set of operations that a user can perform on aresource.
Table D-6 Security Artifacts
Artifact Description LastModifiedTime
LastModifiedUser
Editable Dependencies
AccessPermissions—Users
Company personnel who areprovisioned as valid system users
No No Yes—XML
None
AccessPermissions—Groups
A container for assigning similaraccess permissions to multiple users
Yes No Yes—XML
None
Appendix DPlanning Artifacts
D-5
EUsing Smart View to Manage Applications
Related Topics
• About Managing Applications in Smart View
• Controlling the Display of Application Management Options in Smart View
• Downloading the Application Templates
• Creating an Application
• Working with Artifacts in the Application Template
• Updating an Application in Smart View
• Deleting an Application
About Managing Applications in Smart ViewAdministrators can use Excel to create applications in Oracle Smart View for Office.
Using a downloadable Excel workbook template, you can quickly create, model, andmanage applications in Smart View. By modifying the worksheets within theapplication template workbook, you can define application properties, dimension andmember properties, security (access permissions), and substitution variables to fit yourneeds. You can also load data from the template.
Once the application is created, it's available to users from both Smart View and theweb application. The application can be further updated and refreshed in Smart Viewas needed.
Application management in Smart View is a quick and easy way to get an applicationup and running in your service environment.
Get started by downloading and then editing the application template workbookavailable in Smart View. Or, download the application template zip file from OraclePlanning and Budgeting Cloud or Oracle Enterprise Planning and Budgeting Cloud.The template zip file contains starter workbooks for Oracle Planning and BudgetingCloud and Oracle Enterprise Planning and Budgeting Cloud applications, and asample Oracle Planning and Budgeting Cloud application.
Watch this overview video to learn about creating an application in Smart View.
Overview video
E-1
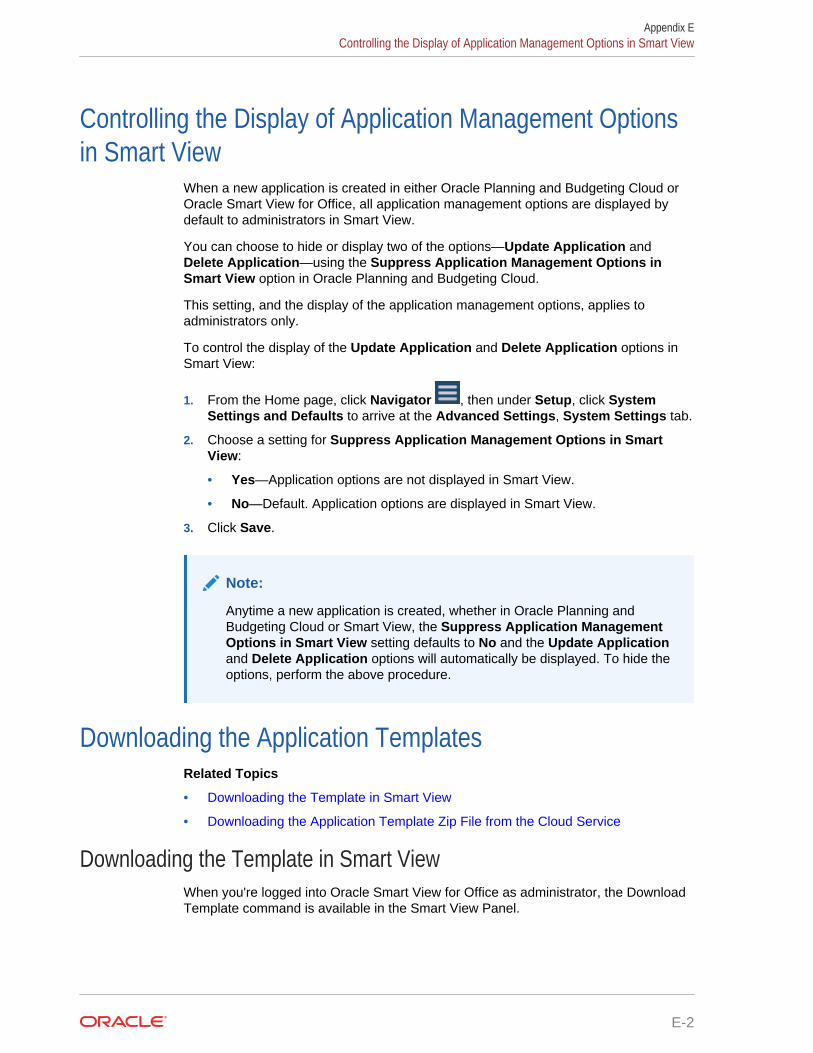
Controlling the Display of Application Management Optionsin Smart View
When a new application is created in either Oracle Planning and Budgeting Cloud orOracle Smart View for Office, all application management options are displayed bydefault to administrators in Smart View.
You can choose to hide or display two of the options—Update Application andDelete Application—using the Suppress Application Management Options inSmart View option in Oracle Planning and Budgeting Cloud.
This setting, and the display of the application management options, applies toadministrators only.
To control the display of the Update Application and Delete Application options inSmart View:
1. From the Home page, click Navigator , then under Setup, click SystemSettings and Defaults to arrive at the Advanced Settings, System Settings tab.
2. Choose a setting for Suppress Application Management Options in SmartView:
• Yes—Application options are not displayed in Smart View.
• No—Default. Application options are displayed in Smart View.
3. Click Save.
Note:
Anytime a new application is created, whether in Oracle Planning andBudgeting Cloud or Smart View, the Suppress Application ManagementOptions in Smart View setting defaults to No and the Update Applicationand Delete Application options will automatically be displayed. To hide theoptions, perform the above procedure.
Downloading the Application TemplatesRelated Topics
• Downloading the Template in Smart View
• Downloading the Application Template Zip File from the Cloud Service
Downloading the Template in Smart ViewWhen you're logged into Oracle Smart View for Office as administrator, the DownloadTemplate command is available in the Smart View Panel.
Appendix EControlling the Display of Application Management Options in Smart View
E-2
The default template that you download can be used immediately to begin creating aOracle Planning and Budgeting Cloud application. You can modify the template tocreate your own custom application.
To immediately create the Vision application for Oracle Planning and Budgeting Cloud,complete the task in Downloading the Application Template Zip File from the CloudService to download the PlanningApplicationTemplate_sample.xlsx
Note:
Before you begin, ensure that you have installed Smart View. Additionally,you must have administrator privileges to create, edit, and deleteapplications.
To download the application template:
1. Launch Excel and, from Smart View, log in to the applicable data source.
2. In the Smart View Panel, select the Download Template command.
The default application template, ApplicationTemplateFile.xlsx, is launched. Thedefault template contains the basic elements required to begin creating a standardOracle Planning and Budgeting Cloud application.
You can edit the default template to create a custom application, as described in Working with Artifacts in the Application Template.
Downloading the Application Template Zip File from the Cloud ServiceWhen you're logged into Oracle Planning and Budgeting Cloud or Oracle EnterprisePlanning and Budgeting Cloud as administrator, you can download a zip file containingthese application template workbook files:
• PlanningApplicationTemplate.xlsx—For creating an Oracle Planning andBudgeting Cloud application.
• PlanningApplicationTemplate_epbcs.xlsx—For creating an Oracle EnterprisePlanning and Budgeting Cloud application.
• PlanningApplicationTemplate_sample.xlsx—For creating the Oracle Planning andBudgeting Cloud sample application, Sample.
Note:
Before you begin, ensure that you have installed Oracle Smart View forOffice. Additionally, you must have administrator privileges to create, edit,and delete applications.
To download the application template zip file:
1. From the Windows computer where you want to install the client software, accessa service instance.
Appendix EDownloading the Application Templates
E-3
2. On the Home page, access Settings and Actions by clicking your user name atthe top right corner of the screen.
3. Click Downloads.
4. In the Downloads page, Planning Extension section, click Download forApplication Templates.
Note:
The Planning Admin Extension isn't required to create and manageapplications in Smart View.
5. Save the zip file locally to a server location that you can access, and unzip thecontents.
You should now have these files saved:
• PlanningApplicationTemplate.xlsx
• PlanningApplicationTemplate_epbcs.xlsx
• PlanningApplicationTemplate_sample.xlsx
6. Open the template file you require and modify according to the information in Working with Artifacts in the Application Template.
Creating an ApplicationFrom Oracle Smart View for Office, administrators can create a new application basedon either the downloaded template with no modifications or a modified template. Ineither case, the template must adhere to template rules and guidelines.
When you create an application, you can:
• Define plantypes
• Define dimensions
• Add a limited amount of data
• Define security and access permissions
• Define substitution variables
Only administrators can create an application and only when no application exists inthe cloud service. Once an application is created, the option is no longer available inthe Smart View Panel.
Before you begin, you should launch Excel and, from Smart View, log in to theapplicable data source.
To create a new application in Smart View:
1. If you have not already done so, perform one of the following actions:
• Download the application template as described in Downloading the Templatein Smart View.
Downloading the application template simply opens the template in SmartView.
Appendix ECreating an Application
E-4
• Download and unzip the application template zip file as described in Downloading the Application Template Zip File from the Cloud Service, thenopen one of the template files.
• Open a saved template file.
An Excel application template workbook must be open when creating anapplication.
2. Optional: Edit and then save the application template as needed.
See Working with Artifacts in the Application Template for information onmodifying the worksheets in the application template workbook.
3. With the application template workbook open in Smart View, select Create NewApplication.
The application creation status appears in the lower left corner of Excel.
4. When the application creation process is complete, verify that the applicationappears in the Smart View Panel.
Note that only one application per cloud service is allowed. Once an application iscreated, the Create New Application command no longer appears in the SmartView Panel.
The application is now available to the applicable Planning users.
Next steps include updating the application template workbook. You can alsodelete the application and create a new one. See:
• Working with Artifacts in the Application Template
• Updating an Application in Smart View
• Deleting an Application
Working with Artifacts in the Application TemplateRelated Topics
• About Working with Artifacts in the Application Template
• Application Definition
• Dimension Definition
• Attribute Dimension Definition
• Data Definition
• Substitution Variable Definition
• Security Definition
• Advanced Settings Definition
About Working with Artifacts in the Application TemplateEditing the application template involves editing Excel worksheets in the applicationworkbook.
Appendix EWorking with Artifacts in the Application Template
E-5
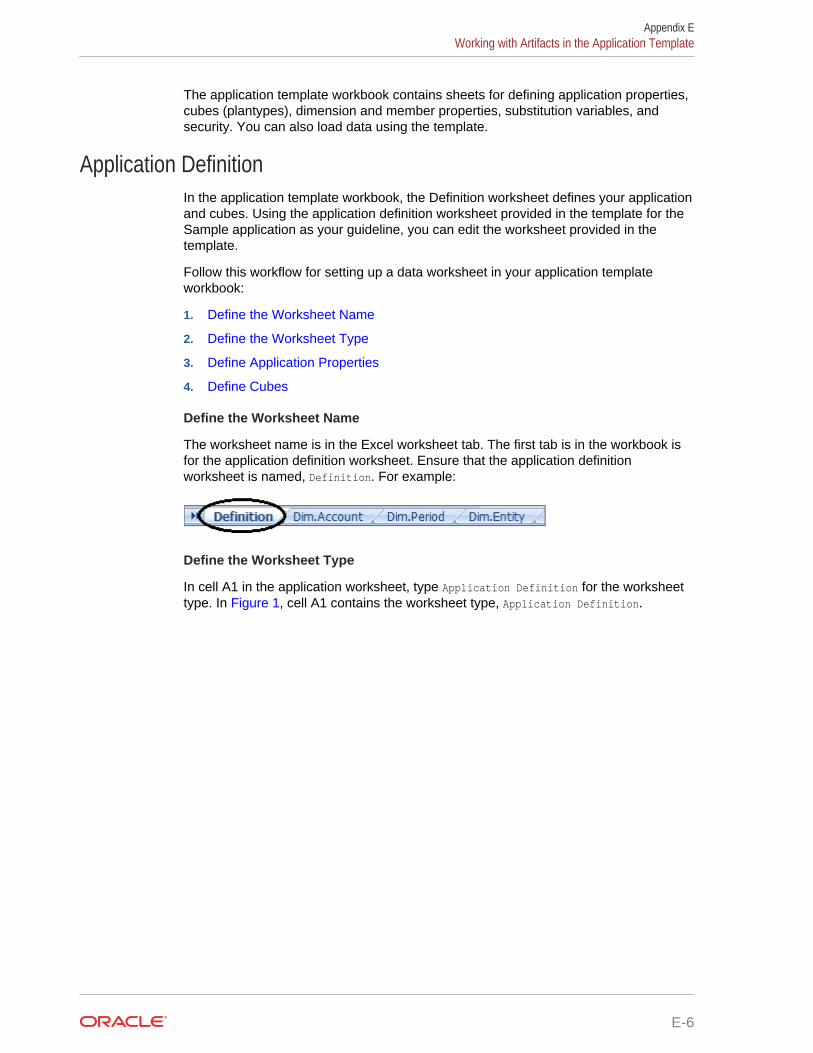
The application template workbook contains sheets for defining application properties,cubes (plantypes), dimension and member properties, substitution variables, andsecurity. You can also load data using the template.
Application DefinitionIn the application template workbook, the Definition worksheet defines your applicationand cubes. Using the application definition worksheet provided in the template for theSample application as your guideline, you can edit the worksheet provided in thetemplate.
Follow this workflow for setting up a data worksheet in your application templateworkbook:
1. Define the Worksheet Name
2. Define the Worksheet Type
3. Define Application Properties
4. Define Cubes
Define the Worksheet Name
The worksheet name is in the Excel worksheet tab. The first tab is in the workbook isfor the application definition worksheet. Ensure that the application definitionworksheet is named, Definition. For example:
Define the Worksheet Type
In cell A1 in the application worksheet, type Application Definition for the worksheettype. In Figure 1, cell A1 contains the worksheet type, Application Definition.
Appendix EWorking with Artifacts in the Application Template
E-6
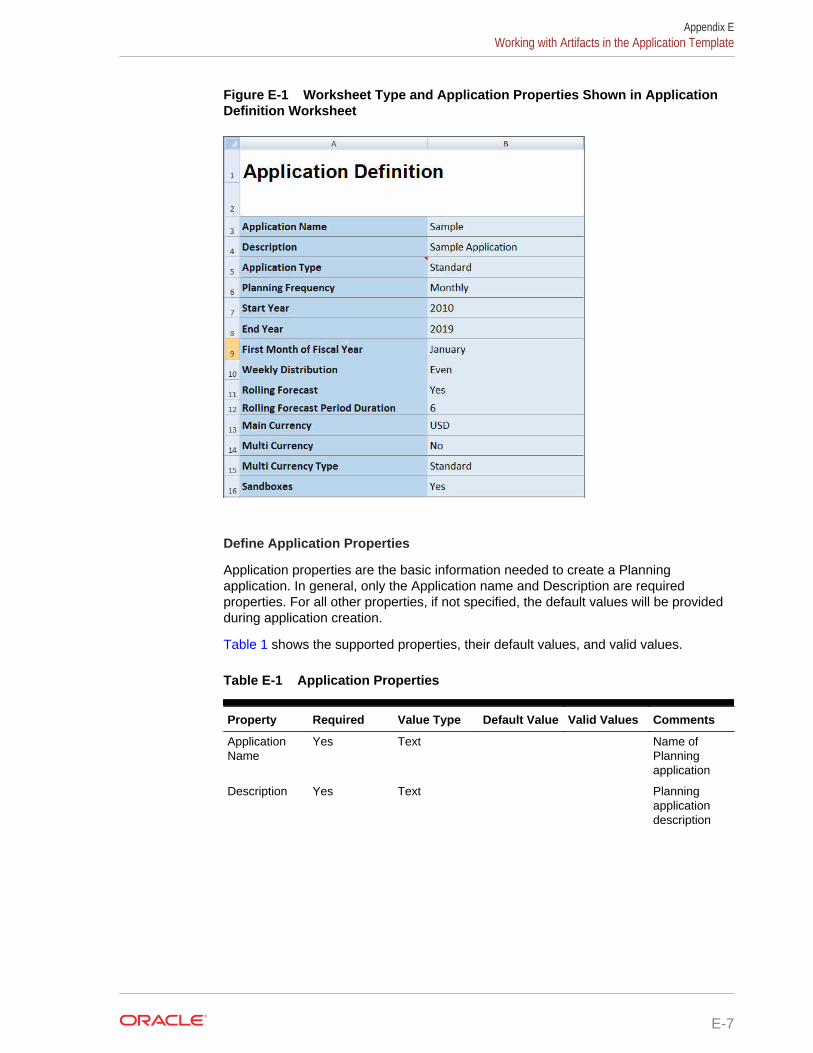
Figure E-1 Worksheet Type and Application Properties Shown in ApplicationDefinition Worksheet
Define Application Properties
Application properties are the basic information needed to create a Planningapplication. In general, only the Application name and Description are requiredproperties. For all other properties, if not specified, the default values will be providedduring application creation.
Table 1 shows the supported properties, their default values, and valid values.
Table E-1 Application Properties
Property Required Value Type Default Value Valid Values Comments
ApplicationName
Yes Text Name ofPlanningapplication
Description Yes Text Planningapplicationdescription
Appendix EWorking with Artifacts in the Application Template
E-7
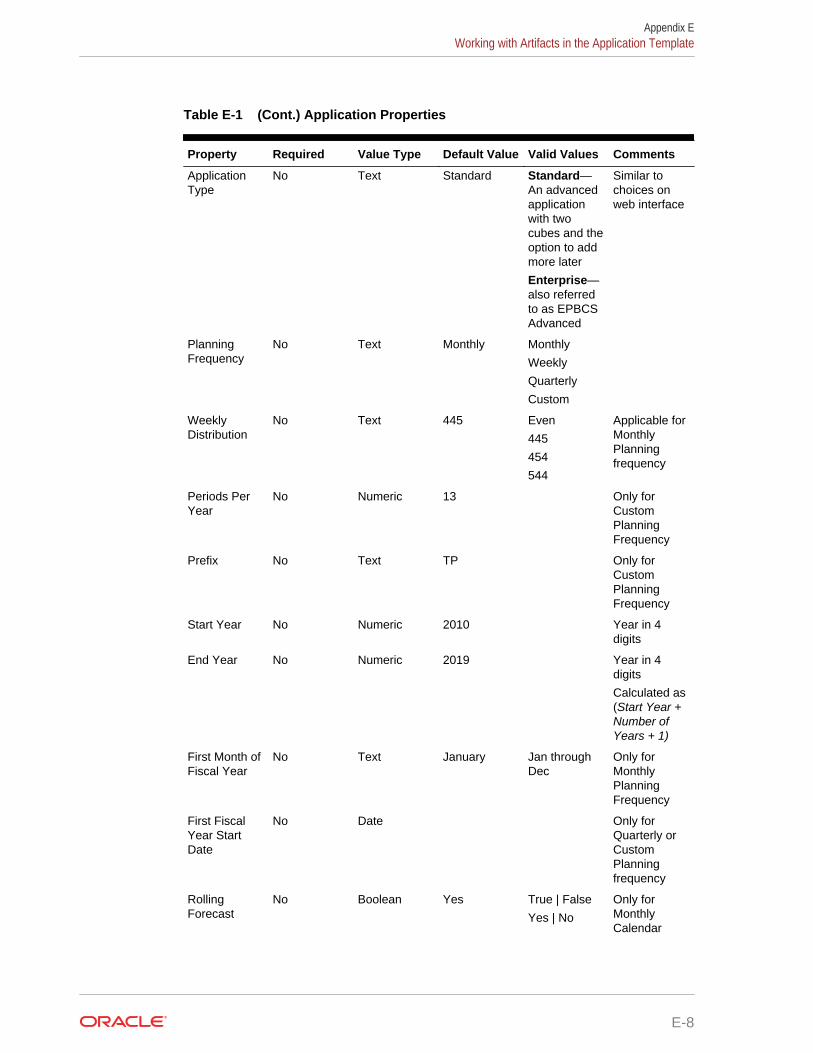
Table E-1 (Cont.) Application Properties
Property Required Value Type Default Value Valid Values Comments
ApplicationType
No Text Standard Standard—An advancedapplicationwith twocubes and theoption to addmore later
Enterprise—also referredto as EPBCSAdvanced
Similar tochoices onweb interface
PlanningFrequency
No Text Monthly Monthly
Weekly
Quarterly
Custom
WeeklyDistribution
No Text 445 Even
445
454
544
Applicable forMonthlyPlanningfrequency
Periods PerYear
No Numeric 13 Only forCustomPlanningFrequency
Prefix No Text TP Only forCustomPlanningFrequency
Start Year No Numeric 2010 Year in 4digits
End Year No Numeric 2019 Year in 4digits
Calculated as(Start Year +Number ofYears + 1)
First Month ofFiscal Year
No Text January Jan throughDec
Only forMonthlyPlanningFrequency
First FiscalYear StartDate
No Date Only forQuarterly orCustomPlanningfrequency
RollingForecast
No Boolean Yes True | False
Yes | No
Only forMonthlyCalendar
Appendix EWorking with Artifacts in the Application Template
E-8
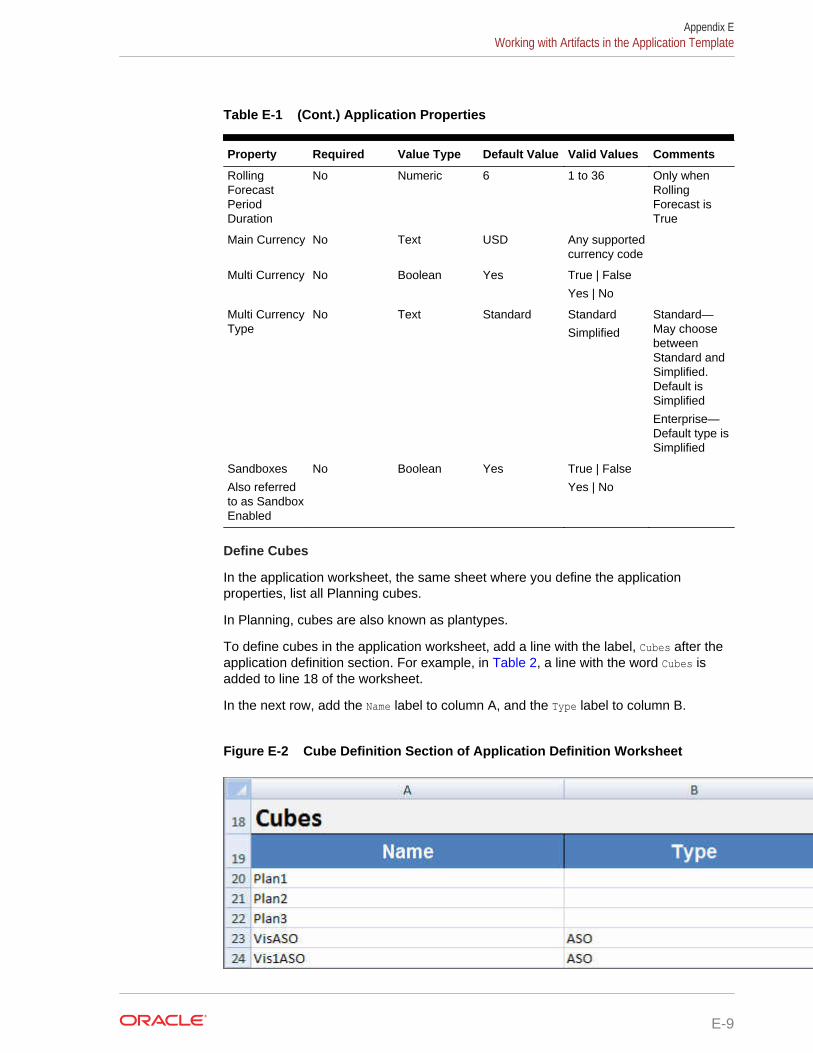
Table E-1 (Cont.) Application Properties
Property Required Value Type Default Value Valid Values Comments
RollingForecastPeriodDuration
No Numeric 6 1 to 36 Only whenRollingForecast isTrue
Main Currency No Text USD Any supportedcurrency code
Multi Currency No Boolean Yes True | False
Yes | No
Multi CurrencyType
No Text Standard Standard
Simplified
Standard—May choosebetweenStandard andSimplified.Default isSimplified
Enterprise—Default type isSimplified
Sandboxes
Also referredto as SandboxEnabled
No Boolean Yes True | False
Yes | No
Define Cubes
In the application worksheet, the same sheet where you define the applicationproperties, list all Planning cubes.
In Planning, cubes are also known as plantypes.
To define cubes in the application worksheet, add a line with the label, Cubes after theapplication definition section. For example, in Table 2, a line with the word Cubes isadded to line 18 of the worksheet.
In the next row, add the Name label to column A, and the Type label to column B.
Figure E-2 Cube Definition Section of Application Definition Worksheet
Appendix EWorking with Artifacts in the Application Template
E-9
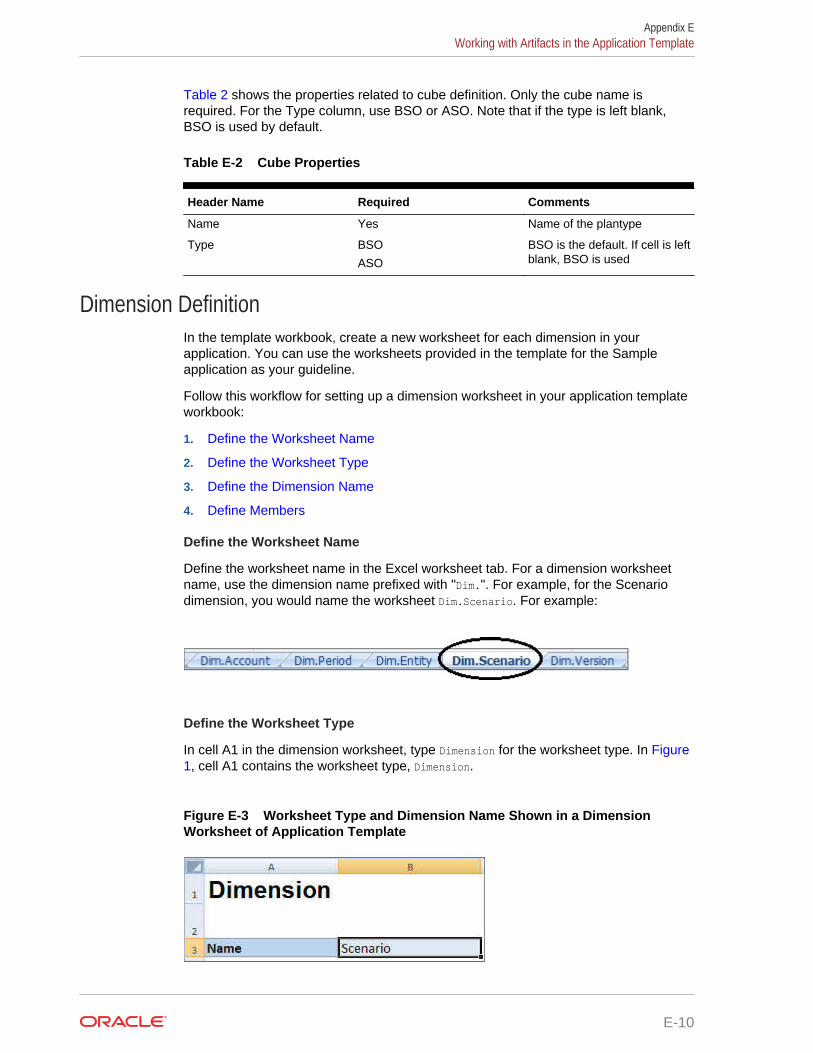
Table 2 shows the properties related to cube definition. Only the cube name isrequired. For the Type column, use BSO or ASO. Note that if the type is left blank,BSO is used by default.
Table E-2 Cube Properties
Header Name Required Comments
Name Yes Name of the plantype
Type BSO
ASO
BSO is the default. If cell is leftblank, BSO is used
Dimension DefinitionIn the template workbook, create a new worksheet for each dimension in yourapplication. You can use the worksheets provided in the template for the Sampleapplication as your guideline.
Follow this workflow for setting up a dimension worksheet in your application templateworkbook:
1. Define the Worksheet Name
2. Define the Worksheet Type
3. Define the Dimension Name
4. Define Members
Define the Worksheet Name
Define the worksheet name in the Excel worksheet tab. For a dimension worksheetname, use the dimension name prefixed with "Dim.". For example, for the Scenariodimension, you would name the worksheet Dim.Scenario. For example:
Define the Worksheet Type
In cell A1 in the dimension worksheet, type Dimension for the worksheet type. In Figure1, cell A1 contains the worksheet type, Dimension.
Figure E-3 Worksheet Type and Dimension Name Shown in a DimensionWorksheet of Application Template
Appendix EWorking with Artifacts in the Application Template
E-10
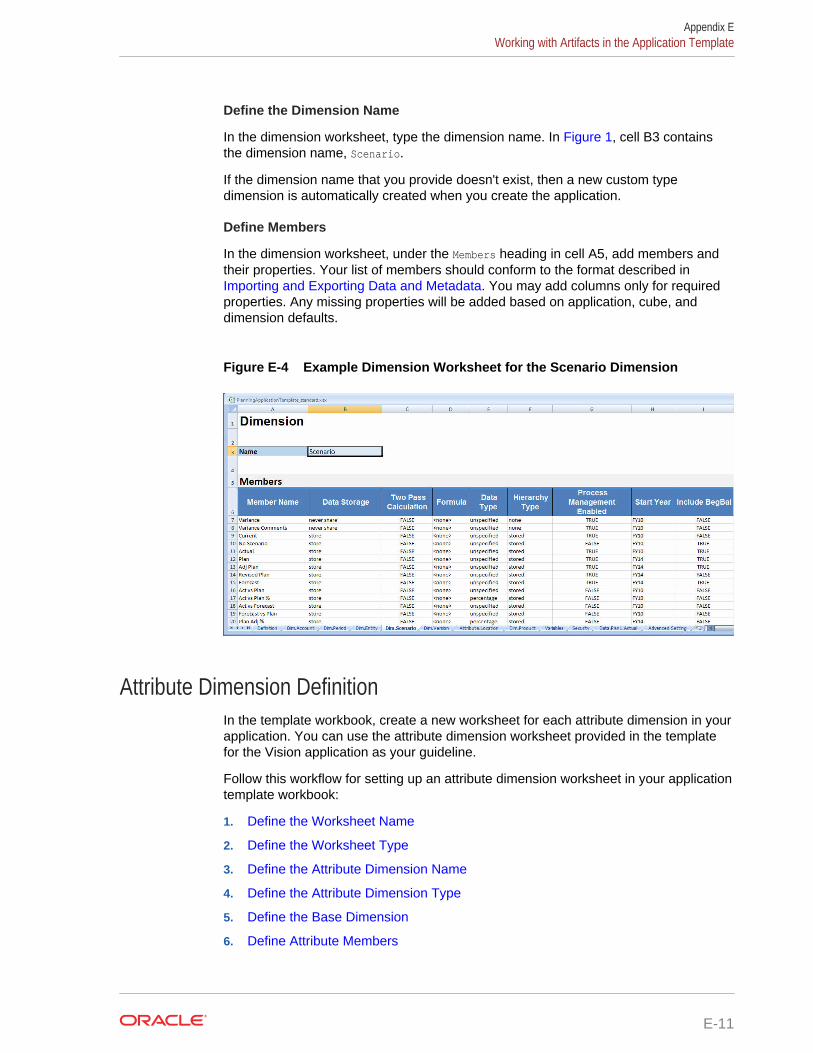
Define the Dimension Name
In the dimension worksheet, type the dimension name. In Figure 1, cell B3 containsthe dimension name, Scenario.
If the dimension name that you provide doesn't exist, then a new custom typedimension is automatically created when you create the application.
Define Members
In the dimension worksheet, under the Members heading in cell A5, add members andtheir properties. Your list of members should conform to the format described in Importing and Exporting Data and Metadata. You may add columns only for requiredproperties. Any missing properties will be added based on application, cube, anddimension defaults.
Figure E-4 Example Dimension Worksheet for the Scenario Dimension
Attribute Dimension DefinitionIn the template workbook, create a new worksheet for each attribute dimension in yourapplication. You can use the attribute dimension worksheet provided in the templatefor the Vision application as your guideline.
Follow this workflow for setting up an attribute dimension worksheet in your applicationtemplate workbook:
1. Define the Worksheet Name
2. Define the Worksheet Type
3. Define the Attribute Dimension Name
4. Define the Attribute Dimension Type
5. Define the Base Dimension
6. Define Attribute Members
Appendix EWorking with Artifacts in the Application Template
E-11
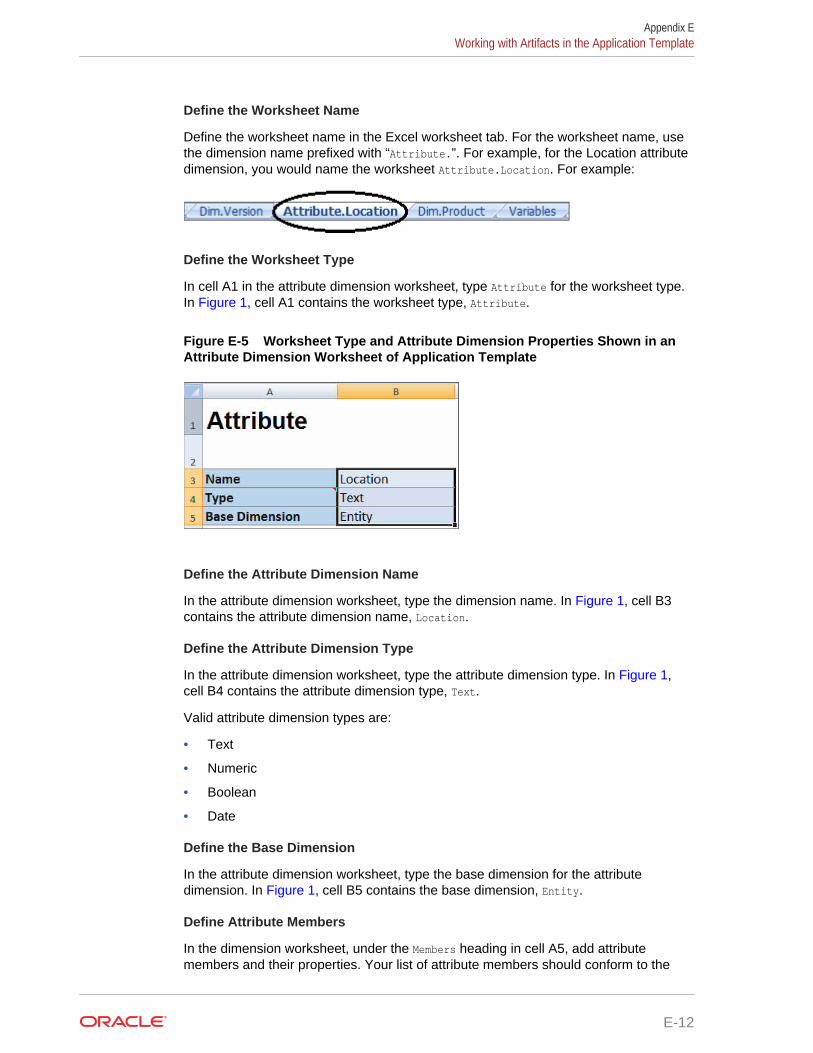
Define the Worksheet Name
Define the worksheet name in the Excel worksheet tab. For the worksheet name, usethe dimension name prefixed with “Attribute.”. For example, for the Location attributedimension, you would name the worksheet Attribute.Location. For example:
Define the Worksheet Type
In cell A1 in the attribute dimension worksheet, type Attribute for the worksheet type.In Figure 1, cell A1 contains the worksheet type, Attribute.
Figure E-5 Worksheet Type and Attribute Dimension Properties Shown in anAttribute Dimension Worksheet of Application Template
Define the Attribute Dimension Name
In the attribute dimension worksheet, type the dimension name. In Figure 1, cell B3contains the attribute dimension name, Location.
Define the Attribute Dimension Type
In the attribute dimension worksheet, type the attribute dimension type. In Figure 1,cell B4 contains the attribute dimension type, Text.
Valid attribute dimension types are:
• Text
• Numeric
• Boolean
• Date
Define the Base Dimension
In the attribute dimension worksheet, type the base dimension for the attributedimension. In Figure 1, cell B5 contains the base dimension, Entity.
Define Attribute Members
In the dimension worksheet, under the Members heading in cell A5, add attributemembers and their properties. Your list of attribute members should conform to the
Appendix EWorking with Artifacts in the Application Template
E-12
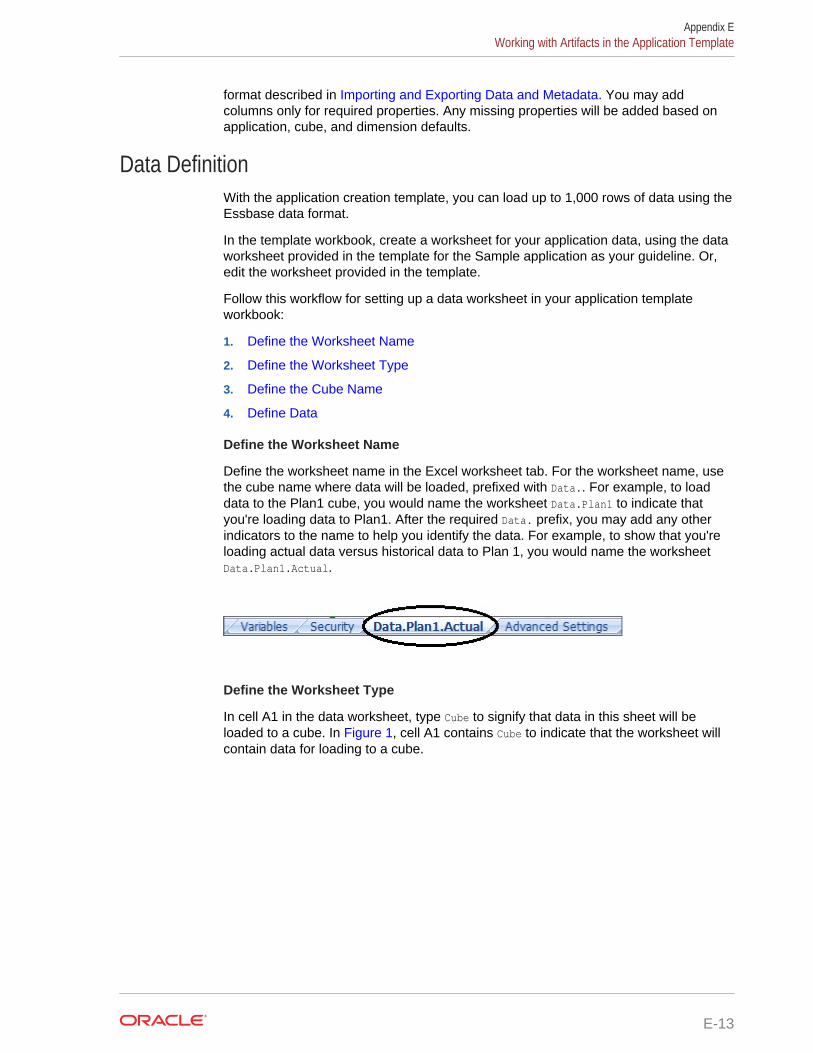
format described in Importing and Exporting Data and Metadata. You may addcolumns only for required properties. Any missing properties will be added based onapplication, cube, and dimension defaults.
Data DefinitionWith the application creation template, you can load up to 1,000 rows of data using theEssbase data format.
In the template workbook, create a worksheet for your application data, using the dataworksheet provided in the template for the Sample application as your guideline. Or,edit the worksheet provided in the template.
Follow this workflow for setting up a data worksheet in your application templateworkbook:
1. Define the Worksheet Name
2. Define the Worksheet Type
3. Define the Cube Name
4. Define Data
Define the Worksheet Name
Define the worksheet name in the Excel worksheet tab. For the worksheet name, usethe cube name where data will be loaded, prefixed with Data.. For example, to loaddata to the Plan1 cube, you would name the worksheet Data.Plan1 to indicate thatyou're loading data to Plan1. After the required Data. prefix, you may add any otherindicators to the name to help you identify the data. For example, to show that you'reloading actual data versus historical data to Plan 1, you would name the worksheetData.Plan1.Actual.
Define the Worksheet Type
In cell A1 in the data worksheet, type Cube to signify that data in this sheet will beloaded to a cube. In Figure 1, cell A1 contains Cube to indicate that the worksheet willcontain data for loading to a cube.
Appendix EWorking with Artifacts in the Application Template
E-13
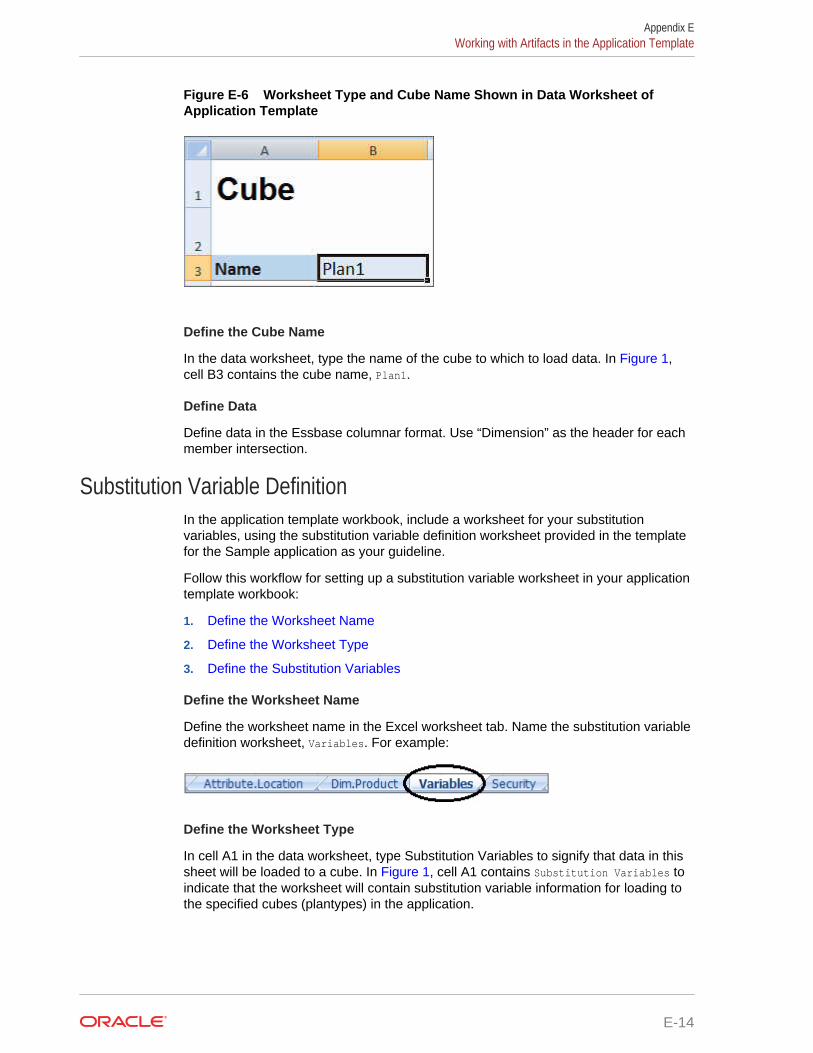
Figure E-6 Worksheet Type and Cube Name Shown in Data Worksheet ofApplication Template
Define the Cube Name
In the data worksheet, type the name of the cube to which to load data. In Figure 1,cell B3 contains the cube name, Plan1.
Define Data
Define data in the Essbase columnar format. Use “Dimension” as the header for eachmember intersection.
Substitution Variable DefinitionIn the application template workbook, include a worksheet for your substitutionvariables, using the substitution variable definition worksheet provided in the templatefor the Sample application as your guideline.
Follow this workflow for setting up a substitution variable worksheet in your applicationtemplate workbook:
1. Define the Worksheet Name
2. Define the Worksheet Type
3. Define the Substitution Variables
Define the Worksheet Name
Define the worksheet name in the Excel worksheet tab. Name the substitution variabledefinition worksheet, Variables. For example:
Define the Worksheet Type
In cell A1 in the data worksheet, type Substitution Variables to signify that data in thissheet will be loaded to a cube. In Figure 1, cell A1 contains Substitution Variables toindicate that the worksheet will contain substitution variable information for loading tothe specified cubes (plantypes) in the application.
Appendix EWorking with Artifacts in the Application Template
E-14
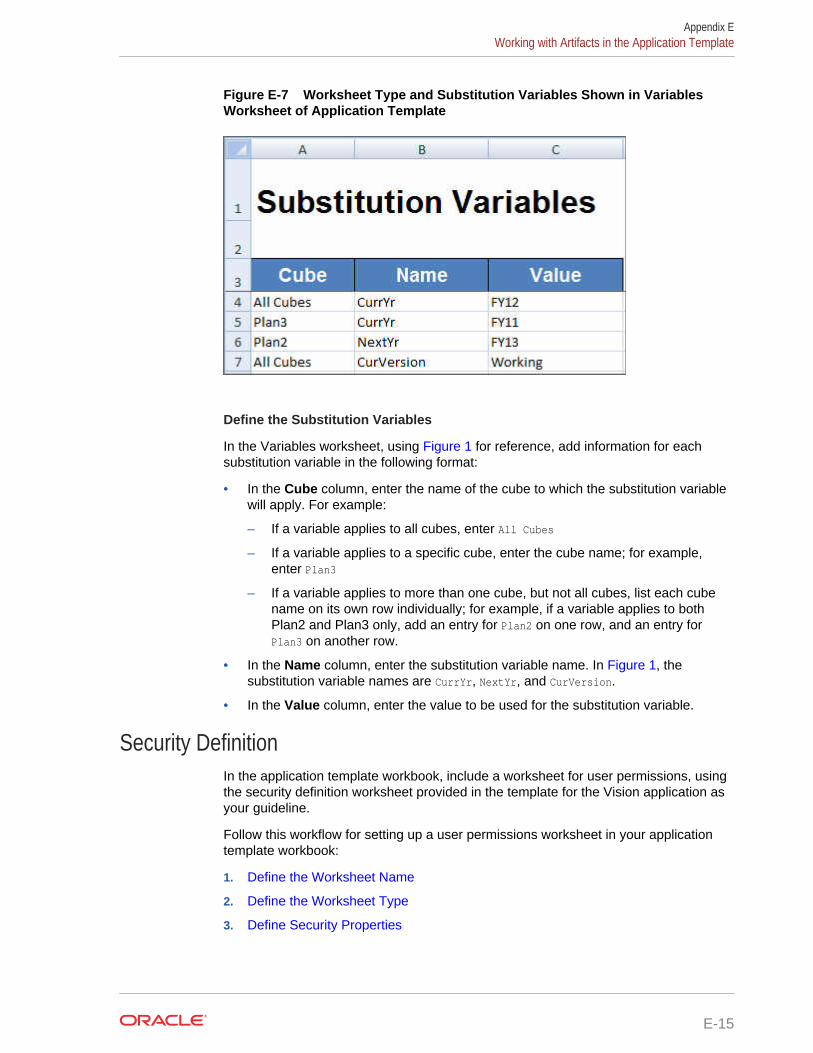
Figure E-7 Worksheet Type and Substitution Variables Shown in VariablesWorksheet of Application Template
Define the Substitution Variables
In the Variables worksheet, using Figure 1 for reference, add information for eachsubstitution variable in the following format:
• In the Cube column, enter the name of the cube to which the substitution variablewill apply. For example:
– If a variable applies to all cubes, enter All Cubes
– If a variable applies to a specific cube, enter the cube name; for example,enter Plan3
– If a variable applies to more than one cube, but not all cubes, list each cubename on its own row individually; for example, if a variable applies to bothPlan2 and Plan3 only, add an entry for Plan2 on one row, and an entry forPlan3 on another row.
• In the Name column, enter the substitution variable name. In Figure 1, thesubstitution variable names are CurrYr, NextYr, and CurVersion.
• In the Value column, enter the value to be used for the substitution variable.
Security DefinitionIn the application template workbook, include a worksheet for user permissions, usingthe security definition worksheet provided in the template for the Vision application asyour guideline.
Follow this workflow for setting up a user permissions worksheet in your applicationtemplate workbook:
1. Define the Worksheet Name
2. Define the Worksheet Type
3. Define Security Properties
Appendix EWorking with Artifacts in the Application Template
E-15
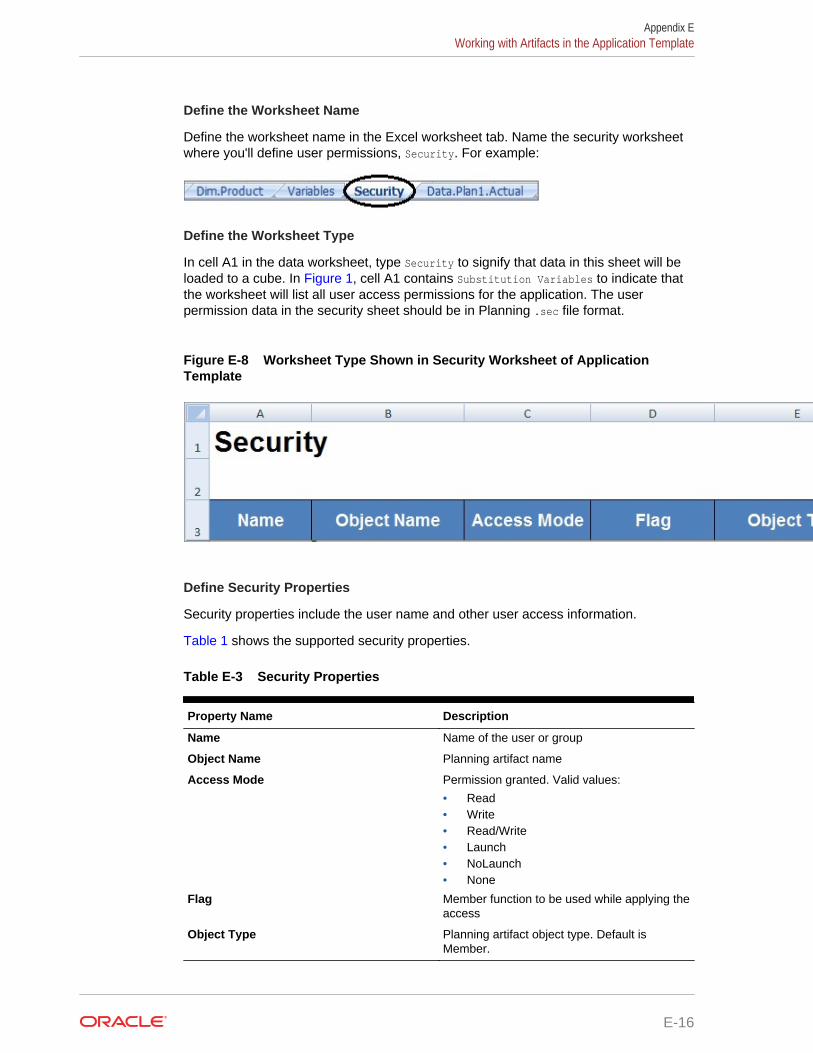
Define the Worksheet Name
Define the worksheet name in the Excel worksheet tab. Name the security worksheetwhere you'll define user permissions, Security. For example:
Define the Worksheet Type
In cell A1 in the data worksheet, type Security to signify that data in this sheet will beloaded to a cube. In Figure 1, cell A1 contains Substitution Variables to indicate thatthe worksheet will list all user access permissions for the application. The userpermission data in the security sheet should be in Planning .sec file format.
Figure E-8 Worksheet Type Shown in Security Worksheet of ApplicationTemplate
Define Security Properties
Security properties include the user name and other user access information.
Table 1 shows the supported security properties.
Table E-3 Security Properties
Property Name Description
Name Name of the user or group
Object Name Planning artifact name
Access Mode Permission granted. Valid values:
• Read• Write• Read/Write• Launch• NoLaunch• None
Flag Member function to be used while applying theaccess
Object Type Planning artifact object type. Default isMember.
Appendix EWorking with Artifacts in the Application Template
E-16
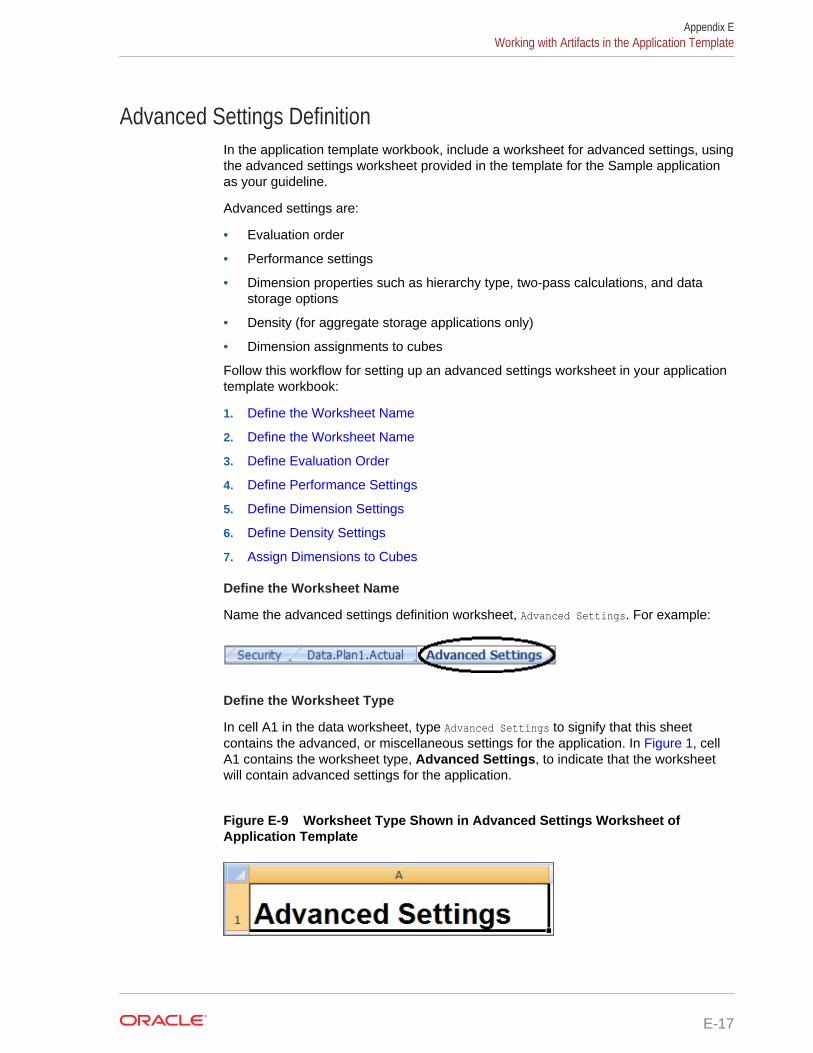
Advanced Settings DefinitionIn the application template workbook, include a worksheet for advanced settings, usingthe advanced settings worksheet provided in the template for the Sample applicationas your guideline.
Advanced settings are:
• Evaluation order
• Performance settings
• Dimension properties such as hierarchy type, two-pass calculations, and datastorage options
• Density (for aggregate storage applications only)
• Dimension assignments to cubes
Follow this workflow for setting up an advanced settings worksheet in your applicationtemplate workbook:
1. Define the Worksheet Name
2. Define the Worksheet Name
3. Define Evaluation Order
4. Define Performance Settings
5. Define Dimension Settings
6. Define Density Settings
7. Assign Dimensions to Cubes
Define the Worksheet Name
Name the advanced settings definition worksheet, Advanced Settings. For example:
Define the Worksheet Type
In cell A1 in the data worksheet, type Advanced Settings to signify that this sheetcontains the advanced, or miscellaneous settings for the application. In Figure 1, cellA1 contains the worksheet type, Advanced Settings, to indicate that the worksheetwill contain advanced settings for the application.
Figure E-9 Worksheet Type Shown in Advanced Settings Worksheet ofApplication Template
Appendix EWorking with Artifacts in the Application Template
E-17
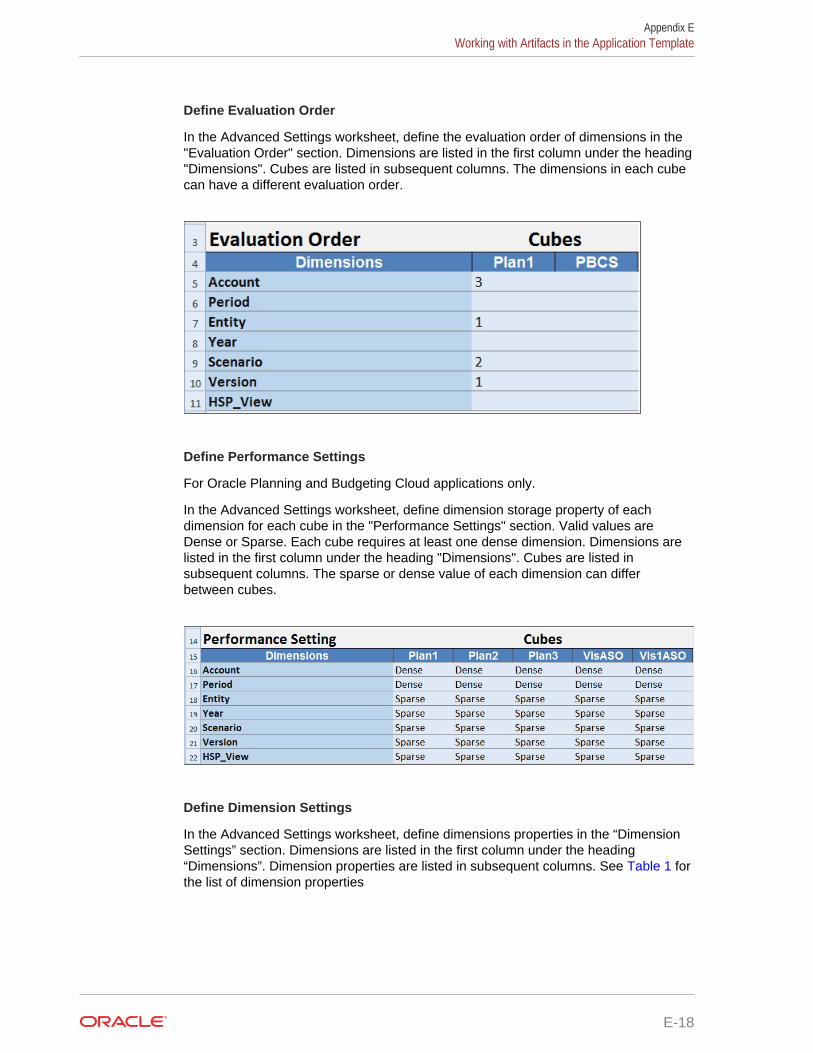
Define Evaluation Order
In the Advanced Settings worksheet, define the evaluation order of dimensions in the"Evaluation Order" section. Dimensions are listed in the first column under the heading"Dimensions". Cubes are listed in subsequent columns. The dimensions in each cubecan have a different evaluation order.
Define Performance Settings
For Oracle Planning and Budgeting Cloud applications only.
In the Advanced Settings worksheet, define dimension storage property of eachdimension for each cube in the "Performance Settings" section. Valid values areDense or Sparse. Each cube requires at least one dense dimension. Dimensions arelisted in the first column under the heading "Dimensions". Cubes are listed insubsequent columns. The sparse or dense value of each dimension can differbetween cubes.
Define Dimension Settings
In the Advanced Settings worksheet, define dimensions properties in the “DimensionSettings” section. Dimensions are listed in the first column under the heading“Dimensions”. Dimension properties are listed in subsequent columns. See Table 1 forthe list of dimension properties
Appendix EWorking with Artifacts in the Application Template
E-18
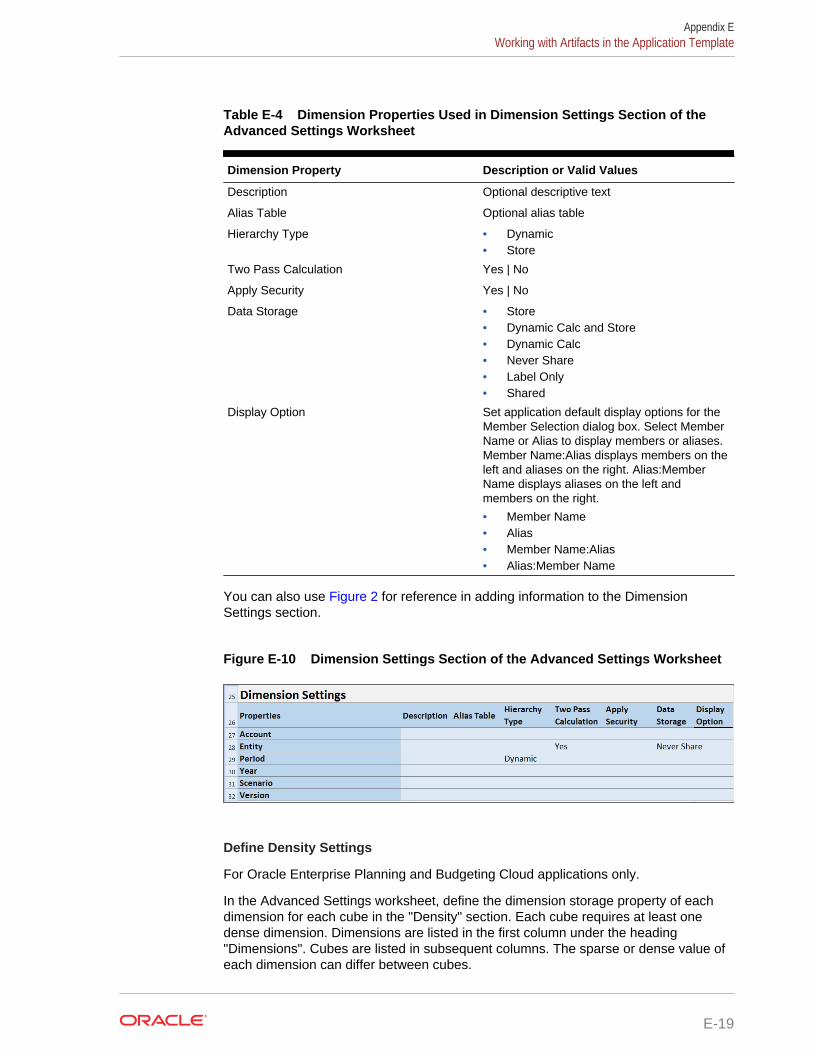
Table E-4 Dimension Properties Used in Dimension Settings Section of theAdvanced Settings Worksheet
Dimension Property Description or Valid Values
Description Optional descriptive text
Alias Table Optional alias table
Hierarchy Type • Dynamic• Store
Two Pass Calculation Yes | No
Apply Security Yes | No
Data Storage • Store• Dynamic Calc and Store• Dynamic Calc• Never Share• Label Only• Shared
Display Option Set application default display options for theMember Selection dialog box. Select MemberName or Alias to display members or aliases.Member Name:Alias displays members on theleft and aliases on the right. Alias:MemberName displays aliases on the left andmembers on the right.
• Member Name• Alias• Member Name:Alias• Alias:Member Name
You can also use Figure 2 for reference in adding information to the DimensionSettings section.
Figure E-10 Dimension Settings Section of the Advanced Settings Worksheet
Define Density Settings
For Oracle Enterprise Planning and Budgeting Cloud applications only.
In the Advanced Settings worksheet, define the dimension storage property of eachdimension for each cube in the "Density" section. Each cube requires at least onedense dimension. Dimensions are listed in the first column under the heading"Dimensions". Cubes are listed in subsequent columns. The sparse or dense value ofeach dimension can differ between cubes.
Appendix EWorking with Artifacts in the Application Template
E-19
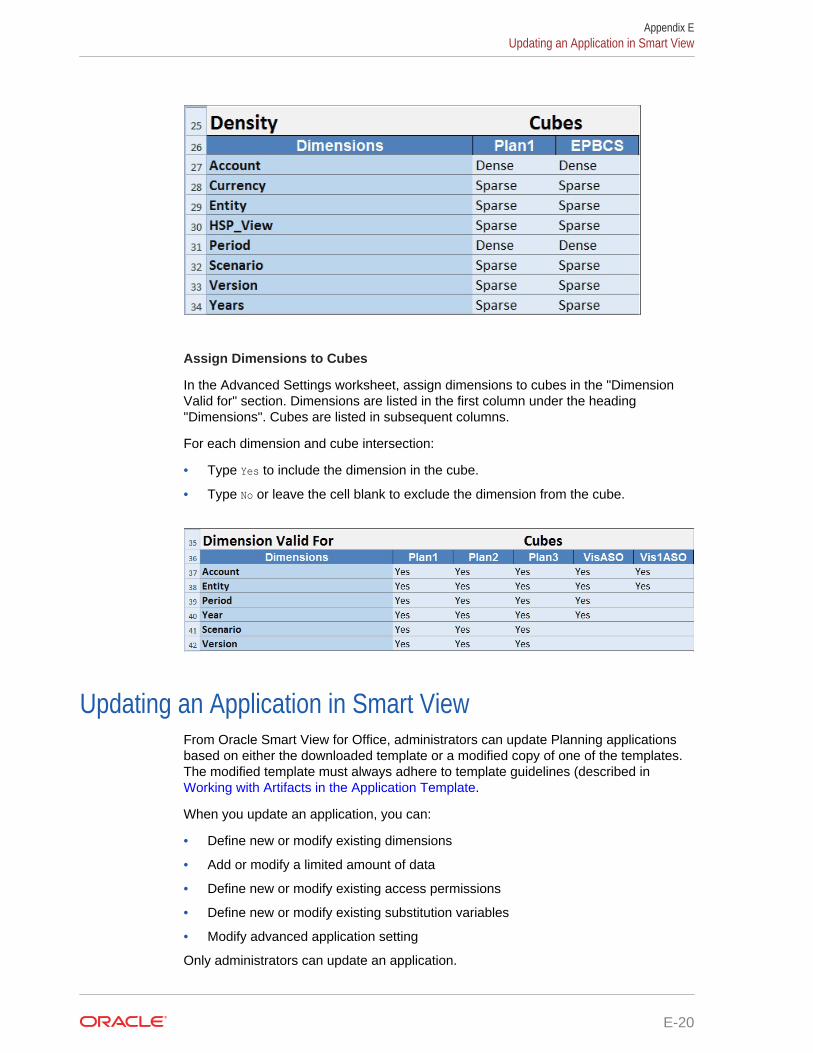
Assign Dimensions to Cubes
In the Advanced Settings worksheet, assign dimensions to cubes in the "DimensionValid for" section. Dimensions are listed in the first column under the heading"Dimensions". Cubes are listed in subsequent columns.
For each dimension and cube intersection:
• Type Yes to include the dimension in the cube.
• Type No or leave the cell blank to exclude the dimension from the cube.
Updating an Application in Smart ViewFrom Oracle Smart View for Office, administrators can update Planning applicationsbased on either the downloaded template or a modified copy of one of the templates.The modified template must always adhere to template guidelines (described in Working with Artifacts in the Application Template.
When you update an application, you can:
• Define new or modify existing dimensions
• Add or modify a limited amount of data
• Define new or modify existing access permissions
• Define new or modify existing substitution variables
• Modify advanced application setting
Only administrators can update an application.
Appendix EUpdating an Application in Smart View
E-20
Before you begin, you should launch Excel and, from Smart View, log in to theapplicable data source.
To update an application in Smart View:
1. If you have not already done so, open the modified application template file.
2. In the Smart View Panel, select the application.
3. In the Action Panel, select Application Management.
4. In the popup dialog, select Update Application.
The application update status appears in the lower left corner of Excel.
5. When the application update process is complete, access the application, either inthe Planning web application or in Smart View, and verify your changes.
Deleting an ApplicationAdministrators may delete applications from Oracle Smart View for Office.
Before you begin, you should launch Excel and, from Smart View, log in to theapplicable data source.
To delete an application from Smart View:
1. In the Smart View Panel, select the application.
2. In the Action Panel, select Application Management.
3. In the popup dialog, select Delete Application, and confirm in the subsequentdialog.
4. In the Smart View Panel, verify that the application is removed.
Appendix EDeleting an Application
E-21
FUsing Smart View to Import and EditApplication Metadata
Related Topics
• About Smart View
• Importing Planning Dimensions in Smart View
• Editing Members in Smart View
• Adding Application Members in Smart View
• Moving Members in Smart View
• Guidelines for Moving Members in Smart View
• Working with Attribute Dimensions
• Designating Shared Members in Smart View
• Refreshing and Creating Databases in Smart View
About Smart ViewOracle Smart View for Office is the Microsoft Office interface to the application, whereend users can perform their planning and forecasting activities. They can analyzeapplication data in Microsoft Outlook, Excel, Word, and PowerPoint. Ad hoc grids inSmart View enable application users to personalize focused data slices that theyfrequently access and share them with others through Smart View or Planning. SeeWorking with Oracle Smart View for Office and the Focusing Your Analysis with AdHoc Grids chapter in Working with Planning for Oracle Planning and Budgeting Cloud.
Administrators can use Smart View to quickly import and edit application metadata.
Note:
All procedures described in this appendix are performed within Smart Viewusing the Planning Admin Extension. See Getting Started with OracleEnterprise Performance Management Cloud for Administrators forinstructions on installing the extension.
Watch this video to learn about entering data in the application using Smart View.
Video
F-1
Importing Planning Dimensions in Smart ViewImporting a Planning dimension into Oracle Smart View for Office allows you to rapidlyadd, edit, and move the members of the dimension.
• Importing Dimensions in Smart View
• Using Smart View Grids
Importing Dimensions in Smart ViewImporting dimensions into the Oracle Smart View for Office grid refers to placing thedimension and its members, and their respective properties, on the grid in preparationfor editing.
Note:
You must have administrator privileges to import dimensions in Smart View.
To import a Planning dimension into a Smart View grid:
1. From the Smart View ribbon, click Panel.
2. In the Smart View Home panel, click Shared Connections, and provide yourdomain name, user name, and password in the login windows.
3. From the drop-down list in the Smart View Panel, select Planning.
4. Expand the Dimensions folder to view the application dimensions in the folder.
If attribute dimensions are defined, they are displayed in the Attributes folder.
If a Time Period dimension is defined, it's displayed in the Dimensions folder. Notethat for the Time Period dimension, Data Storage is the only editable property.
5. Right-click a dimension name and select Edit Dimension.
Using Smart View GridsThe Oracle Smart View for Office grid allows you to rapidly add, edit, and move themembers of a Planning dimension.
• Overview of the Smart View Grid
• The Smart View Grid and Ribbon Display
• Guidelines for Using the Smart View Grid
• Default Metadata Dimension Member Properties
Overview of the Smart View GridA Oracle Smart View for Office grid consists of two dimensions:
• A Planning dimension on one axis
Appendix FImporting Planning Dimensions in Smart View
F-2
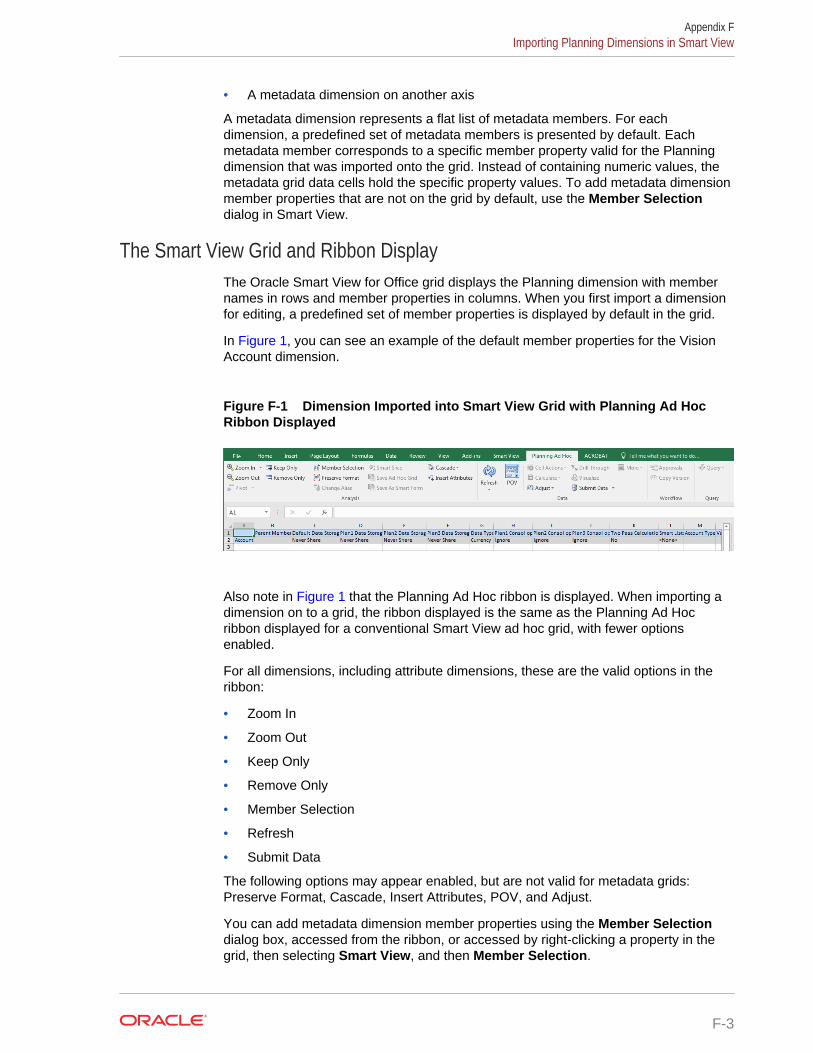
• A metadata dimension on another axis
A metadata dimension represents a flat list of metadata members. For eachdimension, a predefined set of metadata members is presented by default. Eachmetadata member corresponds to a specific member property valid for the Planningdimension that was imported onto the grid. Instead of containing numeric values, themetadata grid data cells hold the specific property values. To add metadata dimensionmember properties that are not on the grid by default, use the Member Selectiondialog in Smart View.
The Smart View Grid and Ribbon DisplayThe Oracle Smart View for Office grid displays the Planning dimension with membernames in rows and member properties in columns. When you first import a dimensionfor editing, a predefined set of member properties is displayed by default in the grid.
In Figure 1, you can see an example of the default member properties for the VisionAccount dimension.
Figure F-1 Dimension Imported into Smart View Grid with Planning Ad HocRibbon Displayed
Also note in Figure 1 that the Planning Ad Hoc ribbon is displayed. When importing adimension on to a grid, the ribbon displayed is the same as the Planning Ad Hocribbon displayed for a conventional Smart View ad hoc grid, with fewer optionsenabled.
For all dimensions, including attribute dimensions, these are the valid options in theribbon:
• Zoom In
• Zoom Out
• Keep Only
• Remove Only
• Member Selection
• Refresh
• Submit Data
The following options may appear enabled, but are not valid for metadata grids:Preserve Format, Cascade, Insert Attributes, POV, and Adjust.
You can add metadata dimension member properties using the Member Selectiondialog box, accessed from the ribbon, or accessed by right-clicking a property in thegrid, then selecting Smart View, and then Member Selection.
Appendix FImporting Planning Dimensions in Smart View
F-3
For detailed information on using the Smart View ribbon, see "Ad Hoc Analysis" inWorking with Oracle Smart View for Office.
For information on using the Member Selection dialog box in Smart View to addmetadata member properties to the grid, see "Selecting Members from the MemberSelector" in Working with Oracle Smart View for Office.
Guidelines for Using the Smart View GridThe following guidelines will assist you in using the Oracle Smart View for Office gridto edit Planning metadata:
• The following functionality isn't available in Smart View grids with Planningmetadata:
– Pivot
– Pivot to POV
– Cell Text
– Cell Notes
– Supporting Details
• Data cell values can be textual or enumeration or numerical.
• The Parent Member is used to specify or modify the parent/child relationship.
• The position of a member in a grid doesn't necessarily represent the actualposition of siblings in the outline.
• Each metadata grid must be linked to a corresponding Planning dimension.
• Columns for each Planning dimension are based on the corresponding set ofmember properties available in the Planning dimension editor.
When you first import a dimension, a predefined set of metadata dimensionmember properties is displayed. See Default Metadata Dimension MemberProperties for a list of those member properties.
• After a metadata grid is opened, it can't be relinked to a different dimension.
• The corresponding valid set of metadata members is specific to each dimension.
• Planning dimension members are valid for corresponding dimensions only.
• For the Time Period dimension, Data Storage is the only editable property.
Default Metadata Dimension Member PropertiesWhen you first import a dimension in the Planning Admin Extension, a predefined setof dimension metadata member properties is displayed by default. Use the MemberSelection dialog box to add other metadata member properties to the grid.
The sections below list the default member properties for the Planning dimensions.
For information on using the Member Selection dialog box in Oracle Smart View forOffice to add other member properties to the grid, see "Selecting Members from theMember Selector" in Working with Oracle Smart View for Office.
Account Dimension
• Parent Member
Appendix FImporting Planning Dimensions in Smart View
F-4
• Default Data Storage
• Data Type
• Consol op. for all Cubes
• Account Type
• Variance Reporting
• Time Balance
• Default Alias Table
• Default Formula
Entity Dimension
• Parent Member
• Default Data Storage
• Data Type
• Consol op. for all Cubes
• Base Currency
• Default Alias Table
Custom Dimensions
• Parent Member
• Default Data Storage
• Data Type
• Consol op. for all Cubes
• Default Alias Table
Scenario Dimension
• Parent Member
• Default Data Storage
• Data Type
• Consol op. for all Cubes
• Start Yr.
• End Yr.
• Start Period
• End Period
• Default Alias Table
• Default Formula
Version Dimension
• Parent Member
• Default Data Storage
Appendix FImporting Planning Dimensions in Smart View
F-5
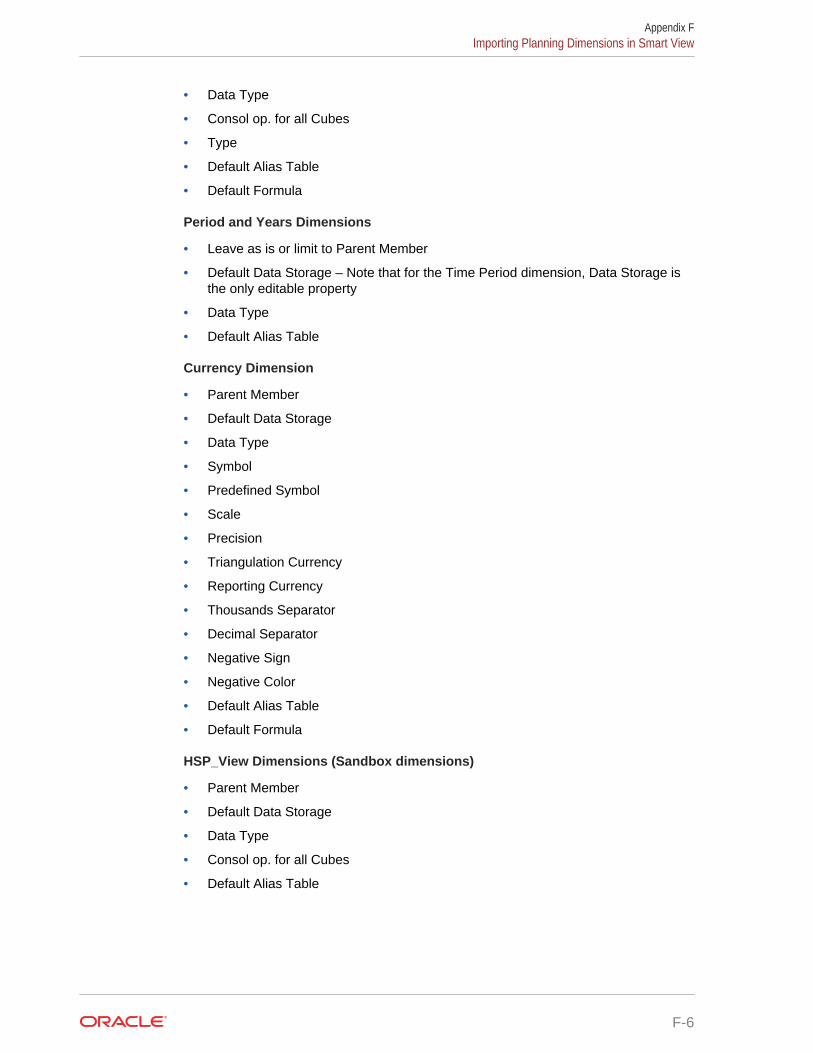
• Data Type
• Consol op. for all Cubes
• Type
• Default Alias Table
• Default Formula
Period and Years Dimensions
• Leave as is or limit to Parent Member
• Default Data Storage – Note that for the Time Period dimension, Data Storage isthe only editable property
• Data Type
• Default Alias Table
Currency Dimension
• Parent Member
• Default Data Storage
• Data Type
• Symbol
• Predefined Symbol
• Scale
• Precision
• Triangulation Currency
• Reporting Currency
• Thousands Separator
• Decimal Separator
• Negative Sign
• Negative Color
• Default Alias Table
• Default Formula
HSP_View Dimensions (Sandbox dimensions)
• Parent Member
• Default Data Storage
• Data Type
• Consol op. for all Cubes
• Default Alias Table
Appendix FImporting Planning Dimensions in Smart View
F-6
Editing Members in Smart ViewThe Oracle Smart View for Office grid allows you to rapidly edit the properties ofmembers of a Planning dimension.
To edit member properties in Smart View:
1. Within Smart View, import a Planning dimension into a Smart View grid (see Importing Dimensions in Smart View).
2. Highlight a member property in the grid.
Note that for the Time Period dimension, Data Storage is the only editableproperty.
3. In the drop-down menu, select a value.
Note:
Modified cells are displayed in a different color.
4. Click Submit Data to save the grid.
Note:
You can save changes to multiple members and properties in the sameSubmit Data operation. If Submit Data fails for one member, theapplication server will stop the operation and not save any changes.
Adding Application Members in Smart ViewThe Oracle Smart View for Office grid allows you to rapidly add members to aPlanning dimension.
• Adding Members in Smart View
• Guidelines for Adding Members in Smart View
Adding Members in Smart ViewThe Oracle Smart View for Office grid allows you to rapidly add members to aPlanning dimension.
• Watch this video to learn about adding Entity dimension members in Smart View.
Video
• Watch this video to learn about adding Account dimension members in SmartView.
Appendix FEditing Members in Smart View
F-7
Video
• Watch this video to learn about adding Scenario dimension members in SmartView.
Video
To add members in Smart View:
1. Within Smart View, import a Planning dimension into a Smart View grid (see Importing Dimensions in Smart View).
Note that Smart View does not support adding members to the Time Perioddimension.
2. Enter the name of a new member in the name column.
Note:
To add a member with a numeric name, place a single quote (') in frontof the numeric member name to inform the system that the number is amember name and not data. For example, to add a member named 123,enter '123.
3. Click Refresh.
New members are marked by an asterisk (*) in the grid after you perform theRefresh. A default set of properties is automatically applied to the new member.The default Parent Member is the root member of the dimension.
4. Optional: To change any property from the default value (the root member),highlight the appropriate cell in the grid, and then from the drop-down menu, selectanother value. (See Editing Members in Smart View.)
Note:
Perform a Refresh before you modify any properties in your newmember. The Refresh operation will replace any changed values withdefault values from server.
5. Click Submit Data to save the grid.
Note:
• To modify the properties of the new member, see Editing Members inSmart View.
• Member properties, including member names, can be localized based onthe particular Locale set by the Smart View application.
Appendix FAdding Application Members in Smart View
F-8
Guidelines for Adding Members in Smart View• A new member is added as the last sibling under the specified parent.
• Parent-child relationships are determined by the Parent Name column property.
• The relative position of a new member in the grid is insignificant.
• The relative position of a new member in the grid will not be changed afterperforming the Submit Data operation. To see the actual position of a newmember in the outline reflected in the ad hoc grid, perform Zoom Out, then ZoomIn.
• A full validity check of a new member name, including a check for invalidcharacters and a check for duplicate names, is performed during the Submit Dataoperation.
• Default properties are automatically applied by the application to a new member.The specific default properties are based upon those of the dimension.
• When adding new currency members to a Currency dimension in a simplifiedapplication, the parent member for the new currency defaults to the "Currency"dimension member. It should default to the "Input Currencies" member. You cancorrect this by doing the following:
1. Replace "Currency" with "Input Currencies" in the Parent Member column foreach new currency member that you added.
2. In the Planning Ad Hoc ribbon, click Submit Data.
3. Click Refresh.
4. Verify that for each new currency you added, the entry for the Parent Membercolumn is “Input Currencies.”
Moving Members in Smart ViewThe Oracle Smart View for Office grid allows you to rapidly move members from oneparent to another within a dimension.
For detailed information on the use of dimensions and members in Smart View, see"Dimensions and Members" in the Working with Oracle Smart View for Office.
To move a member in Smart View:
1. Within Smart View, import a Planning dimension into a Smart View grid (see Importing Dimensions in Smart View.)
2. Highlight the member in the Parent Member column in the grid.
Note:
An empty Parent Member property causes the value of the ParentMember to default to the root member.
3. Enter a parent name at the intersection of the member name and Parent column.
4. Click Submit Data to save the grid.
Appendix FMoving Members in Smart View
F-9
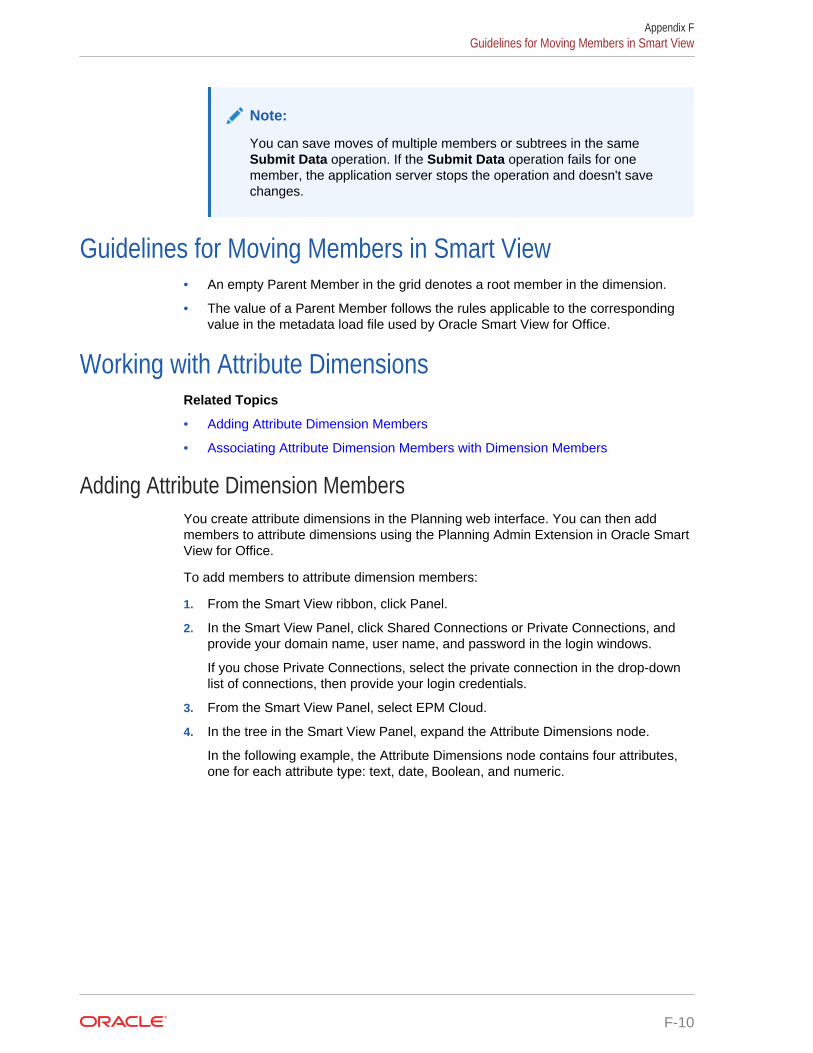
Note:
You can save moves of multiple members or subtrees in the sameSubmit Data operation. If the Submit Data operation fails for onemember, the application server stops the operation and doesn't savechanges.
Guidelines for Moving Members in Smart View• An empty Parent Member in the grid denotes a root member in the dimension.
• The value of a Parent Member follows the rules applicable to the correspondingvalue in the metadata load file used by Oracle Smart View for Office.
Working with Attribute DimensionsRelated Topics
• Adding Attribute Dimension Members
• Associating Attribute Dimension Members with Dimension Members
Adding Attribute Dimension MembersYou create attribute dimensions in the Planning web interface. You can then addmembers to attribute dimensions using the Planning Admin Extension in Oracle SmartView for Office.
To add members to attribute dimension members:
1. From the Smart View ribbon, click Panel.
2. In the Smart View Panel, click Shared Connections or Private Connections, andprovide your domain name, user name, and password in the login windows.
If you chose Private Connections, select the private connection in the drop-downlist of connections, then provide your login credentials.
3. From the Smart View Panel, select EPM Cloud.
4. In the tree in the Smart View Panel, expand the Attribute Dimensions node.
In the following example, the Attribute Dimensions node contains four attributes,one for each attribute type: text, date, Boolean, and numeric.
Appendix FGuidelines for Moving Members in Smart View
F-10
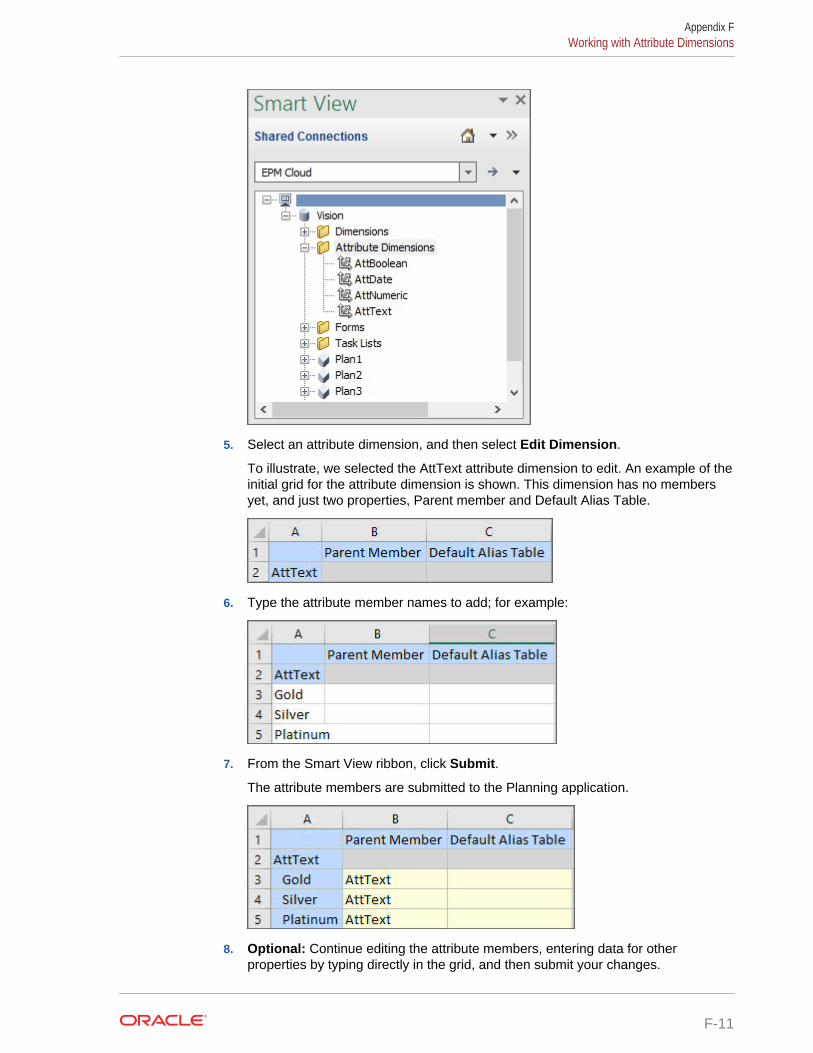
5. Select an attribute dimension, and then select Edit Dimension.
To illustrate, we selected the AttText attribute dimension to edit. An example of theinitial grid for the attribute dimension is shown. This dimension has no membersyet, and just two properties, Parent member and Default Alias Table.
6. Type the attribute member names to add; for example:
7. From the Smart View ribbon, click Submit.
The attribute members are submitted to the Planning application.
8. Optional: Continue editing the attribute members, entering data for otherproperties by typing directly in the grid, and then submit your changes.
Appendix FWorking with Attribute Dimensions
F-11
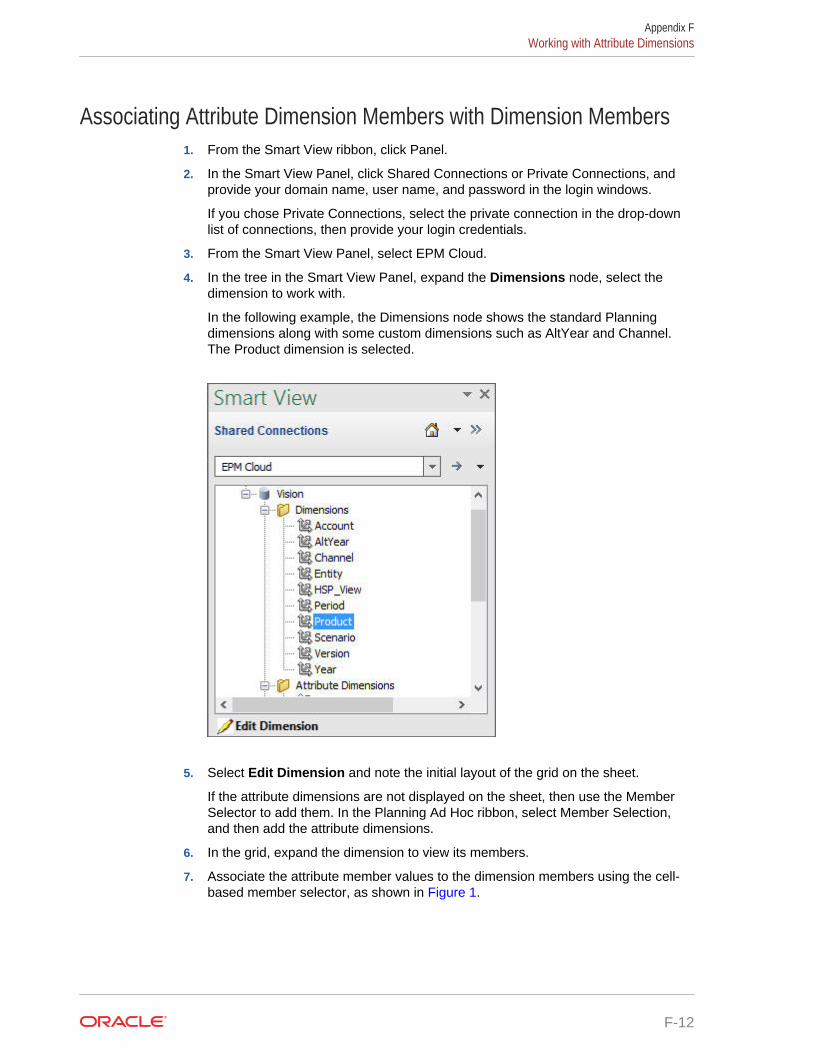
Associating Attribute Dimension Members with Dimension Members1. From the Smart View ribbon, click Panel.
2. In the Smart View Panel, click Shared Connections or Private Connections, andprovide your domain name, user name, and password in the login windows.
If you chose Private Connections, select the private connection in the drop-downlist of connections, then provide your login credentials.
3. From the Smart View Panel, select EPM Cloud.
4. In the tree in the Smart View Panel, expand the Dimensions node, select thedimension to work with.
In the following example, the Dimensions node shows the standard Planningdimensions along with some custom dimensions such as AltYear and Channel.The Product dimension is selected.
5. Select Edit Dimension and note the initial layout of the grid on the sheet.
If the attribute dimensions are not displayed on the sheet, then use the MemberSelector to add them. In the Planning Ad Hoc ribbon, select Member Selection,and then add the attribute dimensions.
6. In the grid, expand the dimension to view its members.
7. Associate the attribute member values to the dimension members using the cell-based member selector, as shown in Figure 1.
Appendix FWorking with Attribute Dimensions
F-12
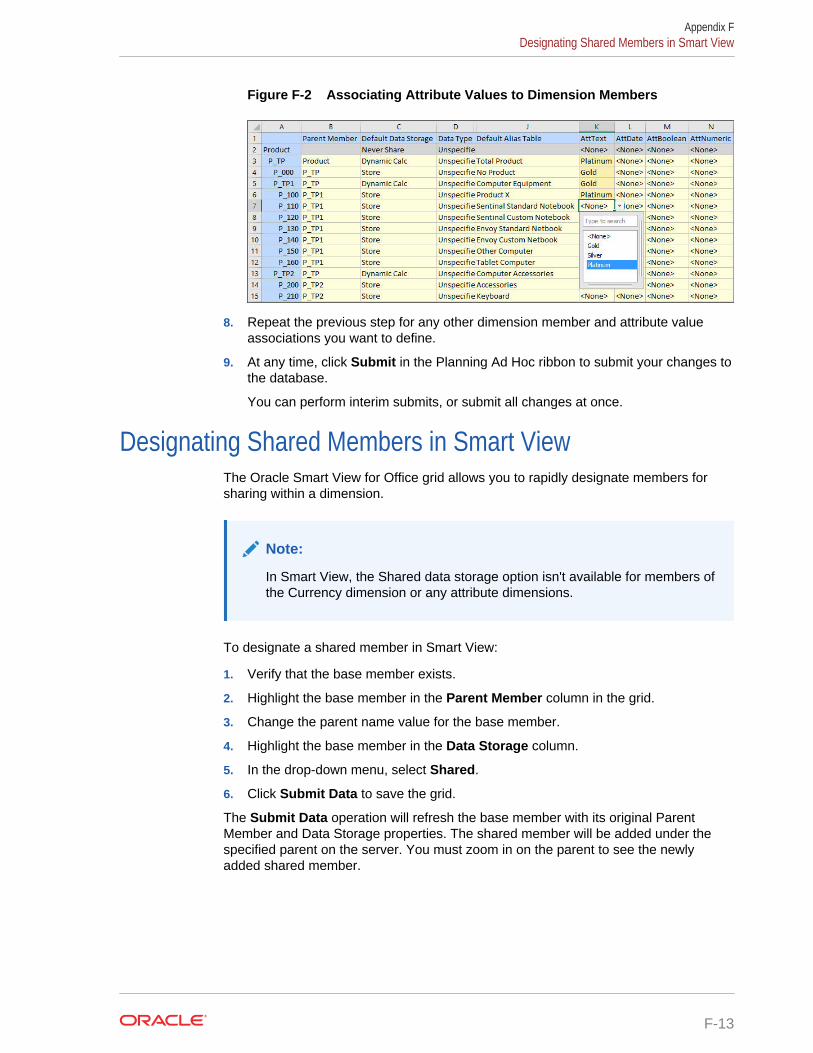
Figure F-2 Associating Attribute Values to Dimension Members
8. Repeat the previous step for any other dimension member and attribute valueassociations you want to define.
9. At any time, click Submit in the Planning Ad Hoc ribbon to submit your changes tothe database.
You can perform interim submits, or submit all changes at once.
Designating Shared Members in Smart ViewThe Oracle Smart View for Office grid allows you to rapidly designate members forsharing within a dimension.
Note:
In Smart View, the Shared data storage option isn't available for members ofthe Currency dimension or any attribute dimensions.
To designate a shared member in Smart View:
1. Verify that the base member exists.
2. Highlight the base member in the Parent Member column in the grid.
3. Change the parent name value for the base member.
4. Highlight the base member in the Data Storage column.
5. In the drop-down menu, select Shared.
6. Click Submit Data to save the grid.
The Submit Data operation will refresh the base member with its original ParentMember and Data Storage properties. The shared member will be added under thespecified parent on the server. You must zoom in on the parent to see the newlyadded shared member.
Appendix FDesignating Shared Members in Smart View
F-13
Note:
The new shared member will not be automatically added to the Smart Viewgrid. The list of members displayed in the grid remains unchanged.
Refreshing and Creating Databases in Smart ViewThe Oracle Smart View for Office grid allows you to quickly refresh a database orcreate a new one.
To refresh or create a database in Smart View:
1. From the Smart View ribbon, click Panel.
2. From the Smart View Panel, select Planning.
3. Expand the Dimensions folder to view the application dimensions in the folder.
If attribute dimensions are defined, they are displayed in the Attributes folder.
If a Time Period dimension is defined, it's displayed in the Dimensions folder.
4. Right-click the root Dimension folder and select Refresh Database or CreateDatabase.
The Smart View Refresh Database dialog box or Create Database dialog box isdisplayed.
5. Select Refresh or Create. A progress bar is displayed, indicating the percentageof steps completed for the refresh or create operation.
Appendix FRefreshing and Creating Databases in Smart View
F-14

GMigrating an On-Premises PlanningApplication to Oracle Planning andBudgeting Cloud
Related Topics
• Overview
• Supported Migration Paths
• Prerequisites and Notes
• Process Flow
OverviewUse the information in this chapter to migrate an Planning application running in an on-premises Oracle Enterprise Performance Management System productionenvironment to an Oracle Planning and Budgeting Cloud production environment.
Supported Migration PathsYou can migrate only on-premises Planning Release 11.1.2.1.x to Oracle Planningand Budgeting Cloud.
Currently, Oracle doesn't certify the migration of 11.1.2.2.x, 11.1.2.3.x and 11.1.2.4.xPlanning applications from an on-premises Oracle Enterprise PerformanceManagement System environment to Oracle Planning and Budgeting Cloud.
Prerequisites and Notes• General Prerequisites
• Default Application Properties
• Required Roles
• Artifacts Not Supported
• Modules and Applications Not Supported
• Reserved Words
• Report Mapping Artifacts and Aggregate Storage Database
• Business Rules
G-1
General Prerequisites• Before migrating to Oracle Planning and Budgeting Cloud, ensure that your on-
premises applications are stable. For example, there should be no cube refresherror or invalid rules.
• Ensure that the Oracle Planning and Budgeting Cloud application name is thesame as the on-premises application name.
Default Application PropertiesAny changes to default application properties made in the on-premises environmentare ignored. Upon import, all application properties default to preset values. Forexample, ORACLE_ADF_UI, sync_on_logon, JDBC/OLAP min/max connections, andedit_dim_enabled.
Required Roles• In Oracle Planning and Budgeting Cloud, the user performing the import operation
must have the Service Administrator role.
• In the on-premises Oracle Enterprise Performance Management System, the userperforming the export operation must have the LCM Administrator role and shouldbe an administrator of the Planning application.
Artifacts Not SupportedMigration of the following isn't supported:
• Shared Services custom roles
• Oracle Hyperion Reporting and Analysis Annotations and Batch Jobs
Note:
ACLs defined for Financial Reports are lost during migration and must bedefined manually in Oracle Planning and Budgeting Cloud.
• Essbase global substitution variables
If your application has global substitution variables, convert them into application-specific variables before migrating. Perform this task in Oracle EssbaseAdministration Services by opening the Substitution Variables Editor and changingthe value in the Applications column from All Apps to a specific application.
• Personal Pages
• Essbase report scripts and rules (RUL) files
Modules and Applications Not SupportedThe following modules and applications are not supported in Oracle Planning andBudgeting Cloud:
Appendix GPrerequisites and Notes
G-2
• Horizontal planning modules such as Oracle Hyperion Workforce Planning, OracleHyperion Capital Asset Planning, Oracle Project Financial Planning, and OracleHyperion Public Sector Planning and Budgeting. Migration of these applications toOracle Planning and Budgeting Cloud will fail, even if you removed Planningmodules cubes from them, because business rules and forms span cubes.
• Oracle Hyperion EPM Architect-enabled Planning applications.
• Enterprise Resource Planning Integrator, Oracle Hyperion Financial Data QualityManagement, Oracle Hyperion Financial Data Quality Management, EnterpriseEdition.
Reserved WordsBefore migrating an Planning application into Oracle Planning and Budgeting Cloud,ensure that dimension, attribute, and alias names in the application don't conflict withthe words reserved for Planning internal usage of dimension properties (for example,operation, account type, aggregation, and description). If alias names conflict withreserved words, the import of the Planning application can fail. See NamingRestrictions.
Report Mapping Artifacts and Aggregate Storage DatabaseReport Mapping artifacts could have references to Essbase aggregate storagedatabases in your on-premises environment and may fail to import into OraclePlanning and Budgeting Cloud. Oracle recommends that you not select them formigration.
You can manually create an aggregate storage database in Planning, and thenrecreate report mappings. See Adding an Aggregate Storage Outline to an Application.
Business RulesIf your on-premises Planning application has Oracle Hyperion Business Rules as yourcalculation engine, upon migration, all business rules are migrated to CalculationManager. Security access isn't migrated, however, and must be manually defined inOracle Planning and Budgeting Cloud. When defining security access, consider thefollowing:
• Locations—Locations in Business Rules determine where the artifact resideswhen it's migrated to Calculation Manager. For all business rules that you want tomigrate, ensure that the Design Time location in Business Rules is set to SelectLocation status.
– The Location tab of each business rule should always contain the specificlocation of the application cube/database and not All Locations.
– Assign each rule to only one application cube/database. For example, If youassign Rule 1 to APP1's Plan1, you should not also assign it to APP1's Plan 2.
• Launch Variable—Ensure that the Launch variable in the Variables tab of theBusiness Rules rule has one of the valid locations provided in the Locations tab. Itshould not have any location other than those defined in the Locations tab. If therule has locations of both Essbase and Planning applications, then the Launchvariable should always have the Planning application specified and not Essbase.
Appendix GPrerequisites and Notes
G-3
Note:
Having an Essbase application location in the Launch variables mightresult in the rule migration failing.
• Macros—Macros created in Business Rules are migrated as templates intoCalculation Manager. Macros are migrated to the first cube/database for the firstapplication migrated. If there are any prompts in the macro, ensure that they havean associated prompt text; otherwise, macro migration can fail.
• Locations for Sequences—Locations for sequences is always All Locations;however, ensure that the Variable tab of the sequence has the same location asthe respective rule's launch variable. For example, in rule R1's Variable tab for thelaunch variable, provide a valid location, such as Server/APP1Plan1. If R1 is a partof sequence S1, then in the Variable tab of S1, the launch variable of R1 shouldhave Server/APP1/Plan1.
Note:
If the launch variable's location isn't specified correctly, the sequence/rule might not migrate successfully.
• Projects—In Planning, the Business Rules projects are migrated into artifactscalled Folders. After migration, these folders can be found in Planning in theBusiness Rules Security section.
– Rules in Projects—You can put your business rules in projects and definesecurity for the business rules at the project level. You can also use the samerule in multiple projects. However, Planning doesn't allow duplicates of thesame artifact in multiple folders. As a result, you may need to rearrange yourprojects to accommodate Planning's specifications.
For example, rule R1 could be included in projects P1 and P2. When youmigrate the security, which in turn migrates the projects, you might find thatrule R1 is a part of folder P2 and not P1 anymore. This is because Planningdoesn't support having rule R1 in both folder P1 and P2.
Consider a simple scenario where an administrator has to give user IU accessfor rules R1 and R2 and has to give user IU1 launch access on R2 alone. InBusiness Rules, the administrator puts R1 and R2 in project P1 and gives userIU access to project P1, and puts F2 in project P2 and gives user IU1 accessto project P2. When the administrator migrates the security in this scenario, R1is in project P1, and R2 is in project P2, which means the security assignmentisn't correct. To fix this, the administrator night have to make minor changes toexisting Business Rules project and security definitions.
In this same scenario, if the administrator moves project P2 as a child ofproject P1, includes rule R1 under project P1 and rule R2 under project P2,assigns access to user IU on project P1 and user IU1 on project P2, theproblem would be solved. Rule R2 would inherit the access from the folderlevel access of project P1, so both rules R1 and R2 would be launchable foruser IU, and only rule R2 would be launchable for user IU1.
– Sequences in Projects—In Business Rules, you're able to assign access forsequences as well as rules. Sequences are migrated to Calculation Manager
Appendix GPrerequisites and Notes
G-4
as rulesets. After migration, you may find that rulesets (sequences) aremissing from the folders. (Projects get converted to folders in CalculationManager.) This is because there is no security on rulesets in CalculationManager. This is based on the concept that if a user has launch access to allthe rules of the ruleset, then it's not necessary to assign security on a ruleset,as a ruleset alone is a batch processing of the underlying rules. Therefore,these rulesets are not in business rules security, and no security is defined onrulesets. You can access rulesets from Tools Business Rules in Planning, andattach rulesets to menus, forms, and so on.
– Projects in Projects—Projects within projects migrate as they are defined inBusiness Rules, provided that the same rule doesn't exist in one of the childprojects.
Process Flow• Step 1: Migrate the Security Model
• Step 2: Export Artifacts from the On-Premises Deployment
• Step 3: Zip the Exported Artifacts and Upload the ZIP File to the Service Instance
• Step 4: Import Artifacts to the Oracle Planning and Budgeting Cloud Instance
• Step 5: Validate and Troubleshoot
Step 1: Migrate the Security ModelMigrating the security model involves creating identity domain users and assigningthem to roles. Additionally, you must create Native Directory groups in the OraclePlanning and Budgeting Cloud instance if your on-premises environment uses groupsto grant access control to artifacts.
You must create the users of on-premises Planning application as users in youridentity domain and assign them appropriate roles. You create users and grant themroles using Oracle Identity Management Console.
This section details how to identify on-premises Planning users, create user accountsin Oracle Planning and Budgeting Cloud, and grant roles to users.
Steps in an On-Premises Environment• Identify On-Premises Planning Users and Groups
• Create Data Upload Files
Identify On-Premises Planning Users and GroupsBegin by generating a provisioning report to identify users who are authorized toaccess the on-premises application that you want to migrate and related componentsincluding Shared Services, Calculation Manager, FDM/FDMEE, and Oracle HyperionReporting and Analysis.
To identify on-premises Oracle Enterprise Performance Management System usersand groups:
1. In the on-premises deployment, log in to Shared Services as Administrator.
Appendix GProcess Flow
G-5
2. Generate a provisioning report that lists provisioned users.
a. Select Administration, and then View Report.
b. In Find All, select Roles.
c. In For, select Users.
d. In Show Effective Roles, select Yes.
e. In Group By, select Users.
f. From In Application, select the following:
• Foundation: Shared Services
• Reporting and Analysis: Reporting and Analysis
• FDM: ERP Integrator (if present)
• Application group that contains the Planning application that youwant to migrate: The Planning application you want to migrate to OraclePlanning and Budgeting Cloud.
3. Click Create Report.
Create Data Upload FilesUse the provisioning report that you generated as a reference to create these comma-separated value (CSV) files (see Identify On-Premises Planning Users and Groups).Data upload files facilitate the bulk loading of users, Native Directory groups, andaccess control assignments into Oracle Planning and Budgeting Cloud.
Create a User Upload File
Create a user upload file; for example, users.csv, to load on-premises users into theMy Services to create Oracle Planning and Budgeting Cloud users.
Use the provisioning report that you generated to identify the users who should beallowed access to the service. Typically, users who are provisioned––directly orindirectly through groups––to on-premises Oracle Hyperion Foundation Services,Planning, Enterprise Resource Planning Integrator, and Reporting and Analysis mustbe added to users.csv.
Contents of a sample user upload file to load two users:
First Name,Last Name,Email,User LoginJohn,Doe,[email protected],jdoeJane,Doe,[email protected],jndoe
Note:
The User Login column is optional. Don't include this column if you use theemail address as the user name.
To create a user upload file:
1. Using a text editor, create a comma-separated value file; for example, users.csv,and store it in a convenient location. Be sure to save the file as type All Files(*.*).
Appendix GProcess Flow
G-6
2. Edit the user upload file:
a. Enter the following as the file header––first line of content––if you're using atext editor.
First Name,Last Name,Email,User Login
b. Add user details, one line for each user. Separate each entry using a comma.For example:
John,Doe,[email protected],jdoe
Note:
The email address must be unique.
3. Save and close the user upload file.
Create a Group Upload File
From your on-premises environment, export Native Directory group information tocreate the Groups.csv file. This file contains information about all Native Directorygroups.
Groups that are used to grant access to application artifacts are identified in theInheritance Information column of the provisioning report. See Identify On-PremisesPlanning Users and Groups. Using the information in this column as a guide, editGroups.csv to remove the groups that are not used to grant access permissions toartifacts in your on-premises environment.
The Groups.csv file that you generate doesn't contain information about groups fromexternal directories that you used in the on-premises environment to grant access toartifacts. You must add information about such groups into Groups.csv.
The following is a sample Groups.csv file to load two groups: plan_grp1 with child groupplan_grp9 and user member jdoe:
#groupid,provider,name,description,internalidplan_grp1,Native Directory,plan_grp1, ,plan_grp9,Native Directory,Plan_grp9, ,
#group_children (user members of group)id,group_id,group_provider,user_id,user_providerPlan_grp1, , ,jdoe,Native Directory
#group_children (group members of group)id,group_id,group_provider,user_id,user_providerplan_grp9,plan_grp1,Native Directory, , ,
Note:
The Groups.csv file is used to create groups in Oracle Planning andBudgeting Cloud Native Directory. Oracle recommends that you use thesegroups in the service to re-create access control that exists in your on-premises environment.
Appendix GProcess Flow
G-7
To create Groups.csv:
1. In the on-premises deployment, log in to Shared Services as Administrator.
2. In the View pane, expand Application Groups, and Foundation, and then selectShared Services.
3. In Application: Shared Services, expand Native Directory.
4. Right-click Groups, and then select Export for Edit.
5. Save Groups.csv.
6. Edit Groups.csv:
a. Using a text editor, open Groups.csv from the location where you stored it.
b. Delete information of groups that are not used to control access to OracleHyperion Foundation Services, Planning, Enterprise Resource PlanningIntegrator, and Reporting and Analysis artifacts.
c. Add information about the external groups (see Inheritance Informationcolumn of the provisioning report) that are used to grant access to FoundationServices, Planning, Enterprise Resource Planning Integrator, and Reportingand Analysis artifacts.
d. Save and close Groups.csv.
Create Role Upload Files
Roles granted to users and groups in the on-premises environment don't haveequivalents in Oracle Planning and Budgeting Cloud. Additionally, service roles can beassigned to users only.
You use four role upload files, one for each user type, to assign users to default OraclePlanning and Budgeting Cloud roles. You must manually create these upload filesusing the provisioning report (see Identify On-Premises Planning Users and Groups)to identify the service roles that grant access similar to those that users have in the on-premises environment.
To ensure that an appropriate level of access is maintained after migration, grant theservice role that encompasses all the access rights granted to the user in the on-premises environment. For example, assume that user jdoe has the following on-premises roles:
• Interactive User role of the Planning application that is being migrated to OraclePlanning and Budgeting Cloud
• LCM Administrator (Shared Services)
• Report Designer (Reporting and Analysis)
Of these roles, Interactive User and Report Designer are mapped to the Power Userrole of Oracle Planning and Budgeting Cloud. However, because the LCMAdministrator role is mapped to the Service Administrator role of the service, youshould assign it to jdoe.
You use four role upload files, one for each user type, to assign users to defaultservice roles. Create role upload files by dividing the users in the user upload fileamong comma-separated value files; each file containing only the email address of theusers to whom you want to grant a specific role.
Appendix GProcess Flow
G-8
See Assigning One Role to Many Users in Getting Started with Oracle EnterprisePerformance Management Cloud for Administrators.
Because the higher default roles inherit the privileges granted to the lower roles, youneed to grant only one role to a user.
Steps in an Oracle Planning and Budgeting Cloud Environment• Load Users into Oracle Cloud Identity Domain
• Upload Role Assignments
• Import Groups into Oracle Planning and Budgeting Cloud Native Directory
Load Users into Oracle Cloud Identity DomainAn Identity Domain Administrator uploads the user upload file to create users in OracleCloud identity management system.
See Importing a Batch of User Accounts in Getting Started with Oracle Cloud.
Upload Role AssignmentsAn Identity Domain Administrator uploads the role upload files to assign roles to users.
See Assigning One Role to Many Users in Getting Started with Oracle EnterprisePerformance Management Cloud for Administrators.
Import Groups into Oracle Planning and Budgeting Cloud Native DirectoryUse the Groups.csv upload file that you created (Create a Group Upload File) to uploadthe groups that you used to grant access to artifacts.
Oracle recommends that Native Directory groups, not users, be granted access toPlanning and Reporting Settings artifacts. Using groups to control access to artifactsreduces administrative overhead and allows Service Administrators to exercise finercontrol over the access control process.
To import Native Directory groups:
1. Access the service as a Service Administrator.
2. Click Tools and then Migration.
3. Click Snapshots.
4. Upload the group upload file to the service.
You may also use the uploadfile EPM Automate Utility command to upload files tothe service. See Oracle Planning and Budgeting Cloud and Oracle EnterprisePlanning and Budgeting Cloud Commands in Working with EPM Automate forOracle Enterprise Performance Management Cloud.
a. Click Upload.
b. Use Browse to locate and select the group upload file, and then click Upload.
c. Click OK.
5. In Snapshots, select the group upload file that you uploaded in the precedingstep.
Appendix GProcess Flow
G-9
6. Click Actions, and then select Import.
7. Verify that the import completed without errors.
Step 2: Export Artifacts from the On-Premises DeploymentTo export artifacts from the on-premises deployment:
1. In the on-premises deployment, log in to EPM Workspace as Shared ServicesAdministrator, and then launch the Shared Services Console.
This user must be provisioned with the Administrator role of CalculationManager, Reporting and Analysis, and the Planning that you want to migrate.
2. If the Planning application being exported uses Calculation Manager as the ruleengine:
a. In the left pane, expand Foundation, and then select the CalculationManager application.
b. In the right pane, expand Planning, and then select the Planning application.
3. In the left pane, expand Reporting and Analysis, and then select the Reportingand Analysis application.
4. In the right pane, expand Repository Objects, and then do the following:
• Select all Financial Reporting objects associated with the Planning application.
Snapshot Report and Snapshot Book don't need to be associated with anapplication.
• Select any third-party content; for example, documents and HTML files.
• Expand HRInternal, and then:
– Select DataSources.
– Expand UserPOV.
There is a UserPOV for every combination of user and data source. Selectthe UserPOVs for the users that were migrated as part of the securitymodel migration.
For example, if Henry is an active user in Oracle Planning and BudgetingCloud after migrating the security model from your on-premisesenvironment to Oracle Planning and Budgeting Cloud, then select all theUserPOVs having Henry in the artifact name.
5. Select Security.
6. In the application group containing the Hyperion Planning application, select allthe artifacts except the Report Mappings artifact under Global Artifacts.
7. Define the migration and specify the folders for the data set.
When you click Define Migration, a list of products is displayed. Select eachproduct, and keep the default options; then, specify a folder for each product; forexample, OnPremisePlanning, OnPremiseCalc, and OnPremiseReports.
8. Clear the Export with Job Output export option.
9. Select Execute Migration, and then select Launch Migration Status Report.
10. Wait for the migration to display Completed.
Appendix GProcess Flow
G-10
Step 3: Zip the Exported Artifacts and Upload the ZIP File to theService Instance
Note:
These steps apply to an on-premises Windows environment. You canperform equivalent steps for other platforms as well.
Note:
If artifacts in your on-premises environment contain Unicode characters,ensure that the artifacts are zipped from an environment in which theUnicode characters are displayed correctly in the file system. If the artifact inthe file system appears garbled, the artifact will fail to import into OraclePlanning and Budgeting Cloud.
To zip the artifacts and upload the ZIP file to a service instance:
1. On the Foundation Services machine in the on-premises deployment, navigate tothe File System folder where the Oracle Enterprise Performance ManagementSystem artifacts were exported.
By default, this is in MIDDLEWARE_HOME/user_projects/epmsystem1/import_export/admin@native directory.
2. Under the File System folder, select all the folders that were exported and zip upthe contents using a third-party software such as 7-Zip:
a. Right-click the exported folder, and select 7-Zip, and then select Add toArchive.
b. In the Add to Archive dialog box, right-click the selected folders and set thefollowing information:
• In the Archive field, change the name of the archive toOnPremisesApplications.
• In the Archive Format field, select Zip.
• In the Parameters field, enter cu=on.
This setting preserves the Unicode paths and file names.
c. Click OK.
3. Upload the ZIP file to a service instance:
You may also use the uploadfile EPM Automate Utility command to upload files tothe service. See Oracle Planning and Budgeting Cloud and Oracle EnterprisePlanning and Budgeting Cloud Commands in Working with EPM Automate forOracle Enterprise Performance Management Cloud.
a. Access the service as a Service Administrator.
Appendix GProcess Flow
G-11
b. Click Tools and then Migration.
c. Click Snapshots.
d. Click Upload.
e. In the Upload dialog box, browse to the folder where you created the ZIP file,select the ZIP file, and then click Upload.
The upload process may take a few minutes to complete. Click Refresh inSnapshots to refresh the list of snapshots. When the upload is complete, theartifact archive that you uploaded is displayed in Snapshots.
Step 4: Import Artifacts to the Oracle Planning and Budgeting CloudInstance
Note:
A service instance supports only one Planning application. Delete anyexisting application from the instance before importing artifacts. Forinformation on deleting an application, see Removing an Application.
To import artifacts to an Oracle Planning and Budgeting Cloud instance:
1. Access the service instance as a Service Administrator.
2. Click Tools and then Migration.
3. Click Snapshots.
4. Click (Actions) in the row of the snapshot (for example, OnPremiseApplications)that you uploaded in the previous step, and then select Import.
5. In Import, click OK.
The Migration Status Report is displayed. Refresh the report until migration iscomplete.
6. Optional: If the Migration Status Report shows an error that Exchange Rateartifacts failed to import, do the following:
a. In Snapshots, expand the snapshot (OnPremiseApplications) that youuploaded in the previous step, and then select the Planning application; forexample, HP-Vision.
b. In the right pane, expand the Global Artifacts folder, and then select theExchange Rate artifact.
c. Click Import.
d. In Import to Application, click OK.
The Migration Status Report is displayed. Continue refreshing the report untilthe migration is complete.
Manually Migrate Data From Release 11.1.2.x to the Service Instance• Steps in the On-Premises Environment
Appendix GProcess Flow
G-12
• Steps in Oracle Planning and Budgeting Cloud Instance
Steps in the On-Premises EnvironmentIn on-premises Release 11.1.2.1.x environment, use Oracle Essbase AdministrationServices to export data for all the cubes into text files; for example, Cube1.txt.
Note:
When the data size exceeds 2 GB, Administration Services splits the datainto multiple files and names them Cube_1.txt, Cube_2.txt, and so on.
Note:
When exporting data, ensure that the name of the data file is the same asthe cube name.
Steps in Oracle Planning and Budgeting Cloud InstanceIn Oracle Planning and Budgeting Cloud:
1. Access the service instance as a Service Administrator.
2. Click Tools and then Migration.
3. Create a snapshot containing the Essbase data in the Planning application.
a. On Categoies, click Planning to list artifacts.
b. From the artifact list, select Essbase Data.
c. Click Export, specify a snapshot name (for example DataOnly), and then clickOK.
d. Click Refresh in the Migration Status report to refresh it. Click Close when thereport shows the progress of the migration process as complete.
e. Click Close in Artifact List.
4. Download the snapshot to a local computer.
You may also use the downloadfile EPM Automate Utility command to downloadfiles from the service. See Oracle Planning and Budgeting Cloud and OracleEnterprise Planning and Budgeting Cloud Commands in Working with EPMAutomate for Oracle Enterprise Performance Management Cloud.
a. Click Snapshots.
b. Click (Actions) in the row of the snapshot (for example, DataOnly) that youcreated in the preceding step, and then click Download.
c. Save the snapshot to a location on the local computer.
5. Modify the application snapshot.
a. Extract the contents of the snapshot (for example DataOnly.ZIP) to a temporarylocation.
Appendix GProcess Flow
G-13
b. Navigate to HP-APPLICATION_NAME/resource/Essbase Data, whereAPPLICATION_NAME is the name of the Planning application.
c. Replace the contents of HP-APPLICATION_NAME/resource/Essbase Data with thecube data that you previously exported from the on-premises environment.See Steps in the On-Premises Environment.
If necessary, rename the cube data files that you exported from the on-premises environment.
d. Recreate the application snapshot at the HP-APPLICATION_NAME level so that itincludes the new cube files.
6. Upload the modified application snapshot into the service instance.
You may also use the uploadfile EPM Automate Utility command to upload files tothe service. See Oracle Planning and Budgeting Cloud and Oracle EnterprisePlanning and Budgeting Cloud Commands in Working with EPM Automate forOracle Enterprise Performance Management Cloud.
a. Access the service instance as a Service Administrator.
b. Click Tools and then Migration.
c. Click Snapshots, and then Upload.
d. Use Browse to locate the modified application snapshot, and then clickUpload.
7. Import artifacts into the instance.
a. In Snapshots, click (Actions) in the row of the snapshot (for example,DataOnly) that you uploaded in the preceding step, and then click Import.
b. Click OK.
c. Review the Migration Status Report to verify that the import completed withouterrors.
Manually Define Business Rules Security if the Calculation Module WasBusiness Rules in Release 11.1.2.1.x
For additional information on applying security to business rules, see Setting UpAccess Permissions.
• Steps in the On-Premises Environment
• Steps in Oracle Planning and Budgeting Cloud Instance
Steps in On-Premises Release 11.1.2.1.xIn on-premises Release 11.1.2.1.x, manually identify the access privileges of allbusiness rules associated with the Planning application in Oracle EssbaseAdministration Services.
To do this:
1. Log in to Administration Services.
Select Start, then All Programs, then Oracle EPM System, then Essbase, thenAdministration Services, and then Start Administration Services Console.
2. Expand Business Rules, then Repository View, and then Rules.
Appendix GProcess Flow
G-14
3. Select each business rule associated with the Planning application and open it.
4. Select the Access Privileges tab and note the access privileges.
Table G-1 Access Privilege Mapping
On-Premises Access Privilege Oracle Planning and Budgeting CloudAccess Privilege
Validate or launch Launch access in the Oracle Planning andBudgeting Cloud Planning application
Modify rule repository objects Administrator role in Oracle Planning andBudgeting Cloud
Can't validate or launch No Launch access in the Oracle Planningand Budgeting Cloud Planning application
Can't modify rule repository objects A non-administrator role in Oracle Planningand Budgeting Cloud
Steps in Oracle Planning and Budgeting CloudTo assign access privileges for all business rules associated with the application inOracle Planning and Budgeting Cloud:
1. Access the service instance as a Service Administrator.
2. Click Rules.
3. Assign permission for each business rule.
a. In the row of the rule for which you want to assign permissions, click (Permission), and then select Assign Permission.
b. Click Permissions.
c. Assign permissions to match those that existed in the on-premisesenvironment.
Step 5: Validate and TroubleshootTo validate and troubleshoot the migration:
1. Check the Migration Status Report to ensure that the import into the productioninstance was successful.
Note:
If you get an error that says no data sources are available, then anapplication already exits in Oracle Planning and Budgeting Cloud. Deletethe existing application and try the migration again. For detailedinformation, see Removing an Application.
2. In Oracle Planning and Budgeting Cloud, do the following:
• Validate that Essbase data migrated correctly.
• Open an Planning data form and compare it with a data form from the sourceenvironment.
Appendix GProcess Flow
G-15
• Open a data form that contains driver data and compare it with a data formfrom the source environment.
• Verify that dimensions and task lists were migrated. Verify that the dimensionsexist and contain the correct members.
• Verify that you can view the Financial Reporting reports associated with theapplication.
Appendix GProcess Flow
G-16
HDesigning Your Application
Follow these basic steps to design an application that meets your business needs.
1. Getting Started
2. Planning Your Application
3. Putting It All Together
Getting StartedBefore you create your application, gather information about current processes. Thiswill ensure that the application meets your business requirements.
• Analyze your current processes.
– Look at what is working in your current processes, and plan how to build thatin to the application. Consider taking this opportunity to improve currentprocesses.
– Review your company’s financial statements. Determine the key revenue andexpense areas that make up 80% of profit and loss.
– Focus on the major drivers of your business. For this subset of accounts,understand the business drivers and required dimensions. For example,employee compensation typically accounts for 50-60% or more of expenses.
– Decide if detailed modeling is required, or if another methodology exists. Foreach major account in the profit and loss statement, understand how to deriveappropriate values for the account. Business logic could include simplecalculations like Units x Rates or other methods.
– For the remaining 20% of the accounts, plan or forecast using some simplelogic such a percentage growth or simple entry.
• Gather any existing spreadsheets. Based on your current process, gather yourinput sources and understand their purpose. Review the sources to determine thebusiness logic, relationships, and other calculations.
– Analyze the spreadsheets to understand your current processes. Understandthe sources of information and the business logic that they support. Find out ifyour business process logic applies to all organizations.
– Find out if your business process logic applies to other business units anddivisions. If the process differs, decide if you want to make processesconsistent.
• Gather your current reporting requirements. Because reports are used topresent financial results for management review and analysis, they are a keyconsideration during design.
– Understand the business logic, relationships, and calculations for your currentprocesses.
H-1
– Find out if your business process logic applies to other business units anddivisions. If the process differs, decide if you want to make processesconsistent.
• Review your current financial statements. Review reports and consider whattype of information is included.
– Identify the dimensions in reports, for example, if reports are done by costcenter, division, account, or customer. Decide if you need to add dimensions,such as product.
– Review financial statements and examine the intersections. Learn if reportsare done by account and entity or by other slices.
– Understand the business drivers for accounts, including the dimensionsinvolved. Review profit and loss line by line to determine if modeling isinvolved or if the information is simply added by users.
– Note the layout of reports, including which elements are on the rows andcolumns.
– Determine the number of unique report formats such as by Cost Center or byDivision. Specify a report format for each type of report you need.
• Gather planning and forecast requirements. Collect the requirements forproducing an annual plan and forecast. Conduct an analysis and understand if allprocesses are the same.
– Determine currency requirements. Identify the currencies in which you planand report, and whether you plan or forecast in multiple currencies. Verifyforeign currency requirements. Confirm if you perform any currency sensitivityanalysis.
– Determine the planning horizon. Know how many years in the future youplan, such as one, two, three, or five years into the future. Plan how muchhistorical data to bring into the application. It's typical to include one or twoyears of historical data.
– Identify the planning and forecasting process. Know whether you prepareannual budgets and forecasts. Understand how often you revisit your forecast,such as monthly or quarterly.
Determine the planning processes you want to support, such as Plan orForecast. Establish if planning and forecasting processes are similar. Knowwhether you want to prepare a rolling forecast.
Decide if you'll plan toward a target. If you set high level targets for plan orforecast, decide on the level of accounts to target.
Determine if multiple iterations are required. Establish if you need to storemultiple submissions of Plan or Forecast. Determine how many forecasts youmaintain. Decide if you want to do comparisons, such as comparing forecasts.
Additional questions to help you plan the process:
* What are the expense drivers for your business, such as compensation,material, travel, or capital and equipment expenses?
* What are the revenue drivers for your business, such as products,projects, or services?
* If Product is one of the main revenue drivers, how many products do youhave?
Appendix HGetting Started
H-2
* How many business units or entities do you have? What main metrics andKPIs are tracked? How many users are involved in financial planning?Who are the main users?
* Determine the approval process that should be incorporated into theapplication. Is the approval process the same for Plan and Forecast?
– Understand your data sources. Know the file format and the contents ofeach data source. This helps you plan requirements for dimension and dataintegrations.
* Determine the source of dimensions such as Account, Entity, and customdimensions.
* Determine the source and frequency of Actual results.
– Determine your approach going forward. Identify process improvements,and note which ones to incorporate in your application. Plan the strengths toincorporate going forward, and identify any weakness and areas to improve inthe future.
Planning Your ApplicationEstablish the goals, key objectives, and scope of your application. Implementation isoften broken into phases to keep objectives in focus. After you know the requirements,you can move forward with designing your application.
The information you gathered earlier can be included in your application as follows:
• Dimensions
• Forms
• Reports
• Calculations
• Users
• Design dimensions. Identify the dimensions required to support your process.Your application comes with these dimensions: Account, Entity, Version, Scenario,Years, Period, and Currency, where applicable.
– Identify the members to be included in the application and the source of thosedimensions. Understand the size of each dimension.
– It's a best practice to document calculations. For each piece of the calculation,document how the result is determined and the source of the number. Confirmif the source is data entry or data fed from another system.
• Design calculations. Review your company’s profit and loss statement line byline, and confirm how to plan or forecast the account. For accounts that requirecalculations, you can leverage Calculation Manager to build the logic.
Understand calculations, and ask any necessary questions. For base accounts,confirm how each account is planned. Sample questions:
– Does this calculation apply for all entities?
– Are there any other dimensional aspects to this calculation?
– Is the calculation by product or customer?
– Is the calculation the same for Plan and Forecast?
Appendix HPlanning Your Application
H-3
• Determine revenue calculations. It's a best practice to establish therequirements for revenue and its drivers.
– Know the business drivers you use, and understand if revenue is driven byproduct or services. Decide if you want to derive revenue in your model.Identify any other information to capture.
– Establish the revenue drivers. Determine if other dimensions are required.
– Decide on the logic for revenue planning. Identify the calculations you want tobuild to support your process, for example, Units x Price. Plan the logic behindyour revenue calculations.
– Determine the forms and the layout to collect information and input from endusers.
• Determine expense requirements. Review your expense accounts to identify thekey areas of your business.
Focus on the areas that make up the majority of your expense to identify the majordrivers. You can plan the remaining minor expenses in a very simple andstraightforward way, such as by using trends or by simply entering a value.
• Determine expense drivers. Focus on this group of accounts, and determine thebusiness drivers of the accounts and the required dimensions.
Review your expense accounts to identify the key areas of your business. Focuson the areas that make up the majority of your expense to identify the majordrivers. You can plan the remaining minor expenses in a very simple andstraightforward way, such as by using trends or by simply entering a value.
– Review employee compensation. Confirm how employee compensation will beplanned, such as by employee, job, or grade.
– Know which accounts are included in planning, and understand the sources ofdata to support compensation. Identify the type of reporting you do oncompensation.
– Assess other expense account requirements. Plan the calculations you needto build to support your process. Know the logic behind your expensecalculations.
– Document calculations. For each piece of the calculation, document how theresult is determined and the source of the number. Confirm if the source isdata entry or data fed from another system.
– Determine the forms and the layout to collect information and inputs from theend users.
Determine the approval process. Determine the dimensions that drive theapproval process for Plan and Forecast. The base dimension of approval processis Entity, Scenario, and Version. Decide if you want to include another dimension,such as Product, Project, or Market.
Document the approval process the application should support.
Putting It All TogetherAfter reviewing the design guidelines and best practices in this topic, you're on yourway to designing a successful application that meets your business needs. You cannow quickly and easily set up your application.
Appendix HPutting It All Together
H-4
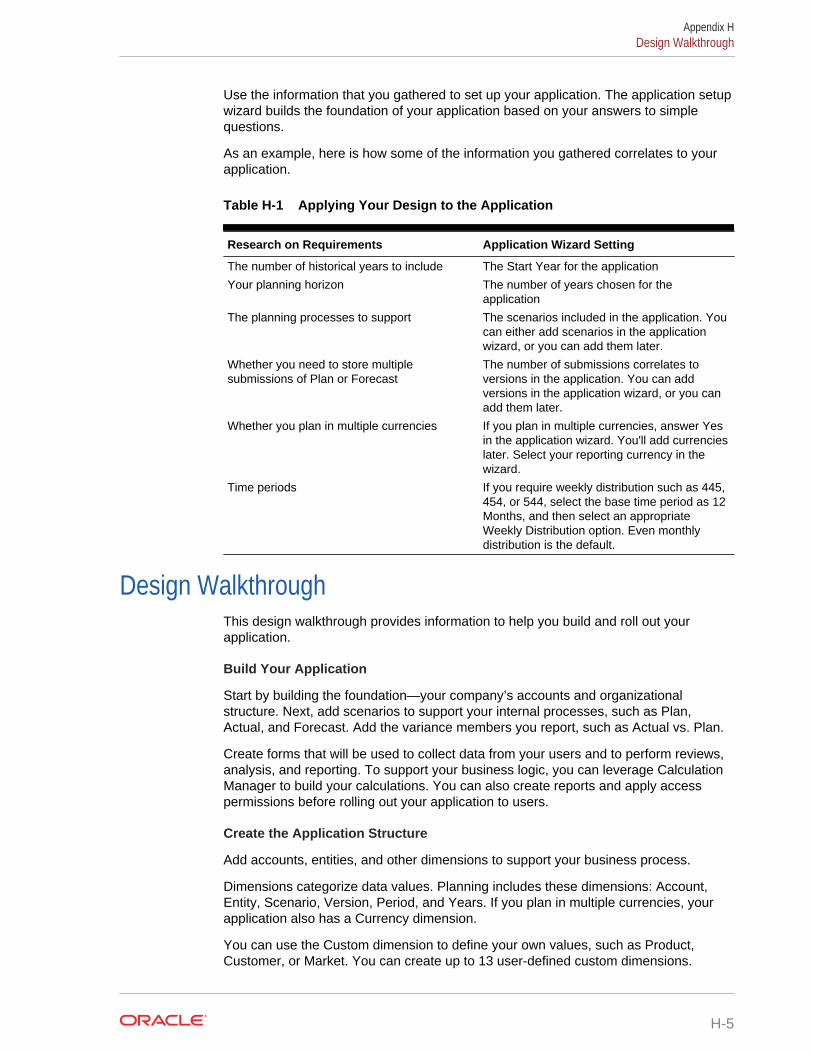
Use the information that you gathered to set up your application. The application setupwizard builds the foundation of your application based on your answers to simplequestions.
As an example, here is how some of the information you gathered correlates to yourapplication.
Table H-1 Applying Your Design to the Application
Research on Requirements Application Wizard Setting
The number of historical years to include The Start Year for the application
Your planning horizon The number of years chosen for theapplication
The planning processes to support The scenarios included in the application. Youcan either add scenarios in the applicationwizard, or you can add them later.
Whether you need to store multiplesubmissions of Plan or Forecast
The number of submissions correlates toversions in the application. You can addversions in the application wizard, or you canadd them later.
Whether you plan in multiple currencies If you plan in multiple currencies, answer Yesin the application wizard. You'll add currencieslater. Select your reporting currency in thewizard.
Time periods If you require weekly distribution such as 445,454, or 544, select the base time period as 12Months, and then select an appropriateWeekly Distribution option. Even monthlydistribution is the default.
Design WalkthroughThis design walkthrough provides information to help you build and roll out yourapplication.
Build Your Application
Start by building the foundation—your company’s accounts and organizationalstructure. Next, add scenarios to support your internal processes, such as Plan,Actual, and Forecast. Add the variance members you report, such as Actual vs. Plan.
Create forms that will be used to collect data from your users and to perform reviews,analysis, and reporting. To support your business logic, you can leverage CalculationManager to build your calculations. You can also create reports and apply accesspermissions before rolling out your application to users.
Create the Application Structure
Add accounts, entities, and other dimensions to support your business process.
Dimensions categorize data values. Planning includes these dimensions: Account,Entity, Scenario, Version, Period, and Years. If you plan in multiple currencies, yourapplication also has a Currency dimension.
You can use the Custom dimension to define your own values, such as Product,Customer, or Market. You can create up to 13 user-defined custom dimensions.
Appendix HDesign Walkthrough
H-5
However, the best practice recommendation is to include fewer than 12. Dimensionscan be added using a load file or built in Oracle Smart View for Office.
Watch this tutorial video to learn how to export and import data in the application.
Tutorial Video
This tutorial shows you how to load dimensions using a file. View tutorial
About the Entity Dimension
The Entity dimension represents your organizational structure, such as Cost Centers,Departments, Business Units, Divisions, and so on.
You can group Cost Centers by creating rollup members, called parents, to reflect howyour organization is viewed. For example, rollups can be by business unit, division, orother functional structure. As an example, you could create Cost Centers that roll up toBusiness Units that roll up to Divisions.
You can create multiple reporting structures. For example, an alternate structure couldbe created to support regional reporting. If you plan in multiple currencies, the basecurrency of each entity should be set.
The Entity dimension is one of the primary dimensions used for the budgeting process.Together with the Scenario and Version dimensions, the Entity dimension is used todefine a planning unit, a discrete component that can be promoted or demoted forapproval or review by a planner’s peers.
Members of all dimensions outside the planning unit will be promoted and demotedalong with the planning unit itself. For example, all twelve months are promotedtogether when a planning unit is promoted. Individual months can't be promotedindependently.
For detailed information on adding dimensions and members using a load file, see Importing and Exporting Data and Metadata.
After each dimension is loaded or updated, it's a best practice to refresh theapplication.
About the Account Dimension
The Account dimension is the place for your chart of accounts. It should include themembers to which you plan or forecast. It doesn't necessarily include every account inyour chart.
For example, your Account dimension could include accounts for Income Statement,Balance Sheet, and Cash Flow. Or, it could include accounts for KPIs and Ratios. Insome cases, your accounts may have sub accounts, but this isn't typical.
The Account dimension includes financial intelligence. The following account types aresupported:
• Expense—Cost of doing business
• Revenue—Source of income
• Asset—Company resources
• Liability and Equity—Residual interest or obligation to creditors
Appendix HDesign Walkthrough
H-6
• Saved assumption—Centralized planning assumptions ensuring consistencyacross the application
The account type settings are used to report Quarterly and Year Total values and forvariance analysis.
Planning uses a hierarchical structure to create Account grouping subtotals and totals.Each account group is assigned a consolidation operator that determines how it rollsup to its parent.
Example: Net Income = Total Revenues - Total Expenses
In this example, the consolidation operator for Total Revenues is Addition, and theconsolidation operator for Total Expenses is Minus.
The Account dimension can be populated either by loading data or using Smart View.To load data from a file, the file format must meet specific requirements.
For detailed information on adding dimensions and members using a load file, see Importing and Exporting Data and Metadata.
After each dimension is loaded or updated, it's a best practice to refresh theapplication.
Best practices:
• Upper level members should be set to Dynamic Calc.
• For member formulas used to calculate Ratios and other types of KPIs orpercentages, set them to Dynamic Calc, Two Pass. The Two Pass setting properlycalculates Percentages at upper levels.
About the Version Dimension
You can use versions to preserve different iterations of the planning process. They arealso useful for controlling data access to Read or Write.
These two types of versions are available:
• Standard Target—Input data can be entered to upper levels.
• Standard Bottom Up—Input data can be entered to level 0 only.
Approvals and workflow functionality can be enabled only for Bottom Up versions.
As a best practice, the following versions are recommended:
• Working—Where users perform their tasks, including reviewing Actual Results anddeveloping Plan and Forecast.
• 1st Pass—If you want to maintain multiple iterations of your Plan, you canpreserve a pass of it in this version. You can create other members if you requiremore than one saved iteration. You can leverage the Copy Data functionality tomove data to this version. Copy data copies data and textual input.
• What If—Provides a placeholder where users can change assumptions andanalyze the outcome.
For detailed information on adding dimensions and members using a load file, see Importing and Exporting Data and Metadata.
After each dimension is loaded or updated in the build process, it's a best practice torefresh the application.
Appendix HDesign Walkthrough
H-7
About the Currency Dimension
If you enabled multiple currencies for your application, you can add the currencies youuse to plan and report.
You can then define exchange rates by scenario and year to be used in conversions.A calculation script is created that enables you to perform currency conversion. Toenter exchange rates, click or tap Plans and open the form “Exchange Rates toPrimary Reporting Currency".
Best practices:
• Limit the number of reporting currencies. Typically, customers have only one. Ifyou have more, see Setting Up Currencies for more information.
• Enter exchange rates for each valid scenario and year combination.
• From this point on, currency conversion can be calculated by running theCalculate Currencies business rule that is associated by default with each form.
• An account’s exchange rate type is modified, such as from Ending to Average.
Run the currency conversion calc script prior to:
• Reviewing any updated local data in reporting currencies
• Running certain calculations that may be dependent on reporting currency data
About Exchange Rates
Each application has a default currency that you specify when creating the application.When you set up exchange rate tables, you enter exchange rates from all sourcecurrencies to the default. Triangulation is used to convert to all other Reportingcurrencies.
Exchange rates are set by Scenario by year for Average and Ending Rates. Fordetailed information on adding dimensions and members using a load file, see Importing and Exporting Data and Metadata.
About the Period Dimension
Use the Period dimension to establish the calendar’s range within a given year, forexample, by month.
Best practices:
• Use substitution variables for this dimension to support reporting and calculations.Potential substitution variables are: ‘CurrMo’, ‘CurrQtr’, ‘PriorMo’. These variablesmust be updated on a monthly basis.
• To use time period calculations such as Year to Date (Y-T-D) or Quarter to Date,select the dynamic time series icon in the Period dimension. You can then selectwhich time period calculations you need to support your process.
• Summary time periods such as quarter totals and a year total should be set todynamic calculate to reduce calculation time.
For detailed information on adding dimensions and members using a load file, see Importing and Exporting Data and Metadata.
After each dimension is loaded or updated, it's considered a best practice to refreshthe application.
Appendix HDesign Walkthrough
H-8
About Years
Years are incorporated into the application in many places, including forms,calculations, reports, and Smart View. Because you'll use the application for manyyears into the future, the best practice to referencing this dimension is by using asubstitution variable.
Substitution variables act as global placeholders for information that changesregularly. The variable and value correspond to the year, and the value can bechanged at any time.
The value of the substitution variable is displayed on forms and reports as aplaceholder. This reduces maintenance for the application. Set substitution variablesby going to Administration, then Manage, then Variables.
For detailed information on adding dimensions and members using a load file, see Importing and Exporting Data and Metadata.
As a best practice, create substitution variables for each year that is included in yourprocess. For example:
Substitution Variable, Description
CurrY, Current Year
NextYr, Budget (Plan) Year
PriorYr, Prior Year
About Custom Dimensions
You can use a custom dimension to further categorize your data. For example, customdimensions might include Product or Markets.
Access permissions can't be granted at the dimension level, also called generationone. For example, access permissions can't be assigned directly to the Productmember for all descendants. If you enable security for your Custom dimension, it'srecommended that you design generation two for all Custom dimensions to whichsecurity will be applied with security access assignments in mind.
For detailed information on adding dimensions and members using a load file, see Importing and Exporting Data and Metadata.
After each dimension is loaded or updated, it's a best practice to refresh theapplication.
Refresh the Application
You must refresh the application whenever you change the application structure.
Changes made to the application are not reflected to users performing data entry andapprovals tasks until the application is refreshed.
For example, when you modify properties of an Entity member, add a Scenario, orchange access permissions, these changes are reflected to users after you refresh theapplication.
Appendix HDesign Walkthrough
H-9
Load Historical Data
After you load all of your structures, such as accounts and entities, you can loadhistorical data. This can include data from prior year actual results and current yearplan and budget.
Loading historical data provides planners a way to analyze results, review trends, andmake meaningful comparisons.
It also helps verify the structures you have built into your application. For example, youcan verify that data ties to previously created reports. If the data doesn't reconcile, youmust verify if this is caused by a true data issue or if there is an issue with thestructures.
An aggregation rule will need to be created to see consolidated data in yourapplication. See Aggregation Options to learn how to create an aggregation rule.
About Valid Intersections
Valid intersections let administrators define rules, called valid intersection rules, thatfilter dimensional intersections for planners when they enter data or select runtimeprompts. For example, you can specify that certain programs are valid only for specificdepartments. Leverage valid intersections to control data entry only to validintersections.
For form design, if the dimensions that are set in the valid intersection are found on thePage, the user will be presented only with valid combinations in the member selector.If the dimensions that are set with valid intersections are found on the column or row,the form designer can suppress invalid intersections completely. When thesuppression option isn't selected, invalid intersections are set to read only.
To learn more, see Defining Valid Intersections.
About Forms
You'll build a number of forms to support data entry and summary-level reports. Theform content is similar to the templates you use to collect and calculate data. Thelayout may differ from what you're currently accustomed to in spreadsheets.
You group forms within major categories such as Revenue, Compensation Expense,Other Expenses, and so on. You can create some forms to support data entry, andothers for summary and review. You can also include charts to help planners analyzeresults.
Planners can enter text and data. They can also enter supporting detail by selecting anappropriate intersection in the form, and then clicking “Supporting Detail” to open anew input form that allows entry of additional detail for that intersection.
Form performance is based on several factors, including network and environmentalfactors, structure, layout, and so on.
Best practices:
• Put dense dimensions such as Account and Period on the row and column of aform. Put sparse dimensions such as Entity on the Page axis.
• Dimensions such as Scenario or Version and Year can reside on the POV,column, or row. It's important to properly gauge how columns or rows will bereturned when a planner opens the form.
Appendix HDesign Walkthrough
H-10
Build Entry Forms
Create forms to enable planners to enter information such as revenue, expenses, andassumptions.
Best practices:
• Group accounts logically, but don't include too many accounts on a single form.
• Limit the number of entry forms to an amount comfortable for end users. A delicatebalance needs to be achieved between the number of accounts on a single formand the number of forms required to support your process.
• Consider using composite forms as a way to limit the number of forms while stillcontrolling the number of rows.
• Use detail forms to enable planners to enter all related information. All accountsthat require input should be found on a form. The accounts can be broken downinto several different forms.
• While building forms, ensure that you select all appropriate options to enhance thedesign of your form. For example, use settings to control precision, display, andmenus, and to associate the proper rules with your form.
• Use Substitution Variables to reference dimensions such as Years.
• Suppress invalid Scenario/Time Period option, set Periods in row or column on theform to the Start and End Period set for the Scenario. Leveraging this functionalitycan be used instead of substitution variables for Years.
• Consider setting valid intersections to set relationships between differentdimensions. Suppressing invalid combinations can be set in row or column tomake only valid intersections available to end users. By default, only validintersections will be available to the end users when the dimensions are set in thePage selection.
• Use relationships to incorporate members onto the forms instead of pickingmembers individually.
• Consider using User Variables for dimensions such as Entity and Scenario to helpreduce the dimension selection for end users.
• If your application supports multiple currencies, consider setting a User variable sousers can define their base currency.
• Organize forms into folders.
• Substitution Variables reduce the maintenance on forms.
Build Detailed Revenue and Expense Forms
Detail forms should allow planners to enter all revenue- and expense-relatedinformation. All accounts that require input should be found on a form.
Best practices:
• Group accounts logically, but don't include too many accounts on a single form.
• Limit the number of entry forms to an amount comfortable for end users. A delicatebalance needs to be achieved between the number of accounts on a single formand the number of forms required to support your process.
Appendix HDesign Walkthrough
H-11
• Consider using composite forms as a way to limit the number of forms while stillcontrolling the number of rows.
• Use detail forms to enable planners to enter all revenue related information. Allaccounts that require input should be found on a form. The accounts can bebroken down into several different forms.
• While building forms, ensure that you select all appropriate options to enhance thedesign of your form. For example, use settings to control precision, display, andmenus, and to associate the proper rules with your form.
• Building forms can be iterative to support planners and processes.
Associate Rules with Forms
Associating rules with forms enables users with appropriate access to launchassociated business rules from the form to calculate and derive values.
You can associate multiple business rules with a form by cube.
Business rules associated with a form can be set to launch automatically when theform is opened or saved. You can select Use Members on Form to populate runtimeprompts from the current form instead of prompting users for input when rules arelaunched.
Best practices:
• For rules that take longer to run, set them to launch from an Action menu or simplythrough association with the form.
• If a business rule has runtime prompts, limit the number of prompts to keep theplanner’s job simple.
Add Menus to Forms
You can associate menus with forms. Action menus allow planners to click rows orcolumns in forms and select menu items to:
• Launch a business rule, with or without runtime prompts
• Move to another form
• Move to Manage Approvals with a predefined scenario and version
Menus are context-sensitive. The menus that display depend on the form settings andwhere planners right-click in the form.
Best practices:
• When designing forms, use Other Options to select menus available for Formmenu item types.
• As you update applications, update the appropriate menus. For example, if youdelete a business rule referenced by a menu, remove it from the menu.
Build Data Validation Forms
Data validation can serve as a visual clue to planners that business policies have beenmet. You can add conditional color coding to forms, and validation messages can begenerated if entered data violates validation rules or if a condition is met.
Defining data validation rules involves these main tasks:
Appendix HDesign Walkthrough
H-12
• Identify the data cells or location that you want to display with validation messagesor in different colors when conditions are met.
• Identify the cell, column, or row that needs to participate during rule evaluation,and define the rule accordingly.
• Create the data validation rule at the location identified.
Create Composite Forms
Composite forms allow you to display several forms simultaneously. You can displayforms as charts. You can also display multiple forms in a tabular format, similar to whatyour users are accustomed to seeing in spreadsheets.
These features help you create whatever composite form layout is best for yourapplication.
• Each area in the composite form is called a section. Initially, you specify whetherto divide the composite form layout into two side-by-side sections, or into twosections that are stacked one above the other.
• There is also a custom layout option. Each section in a composite form isassociated with properties set during creation. You can edit these properties aftercreating a composite form.
• The composite form point of view and page dimensions can be specified within acomposite form. You can set the composite setting to combine dimensions.
• You can design composite forms that have one master composite form andmultiple simple forms. When you do so, the selection of members in the masterform automatically filters to the members in the simple forms. The simple formsshow only the details that are relevant to the members highlighted in the masterform. Leveraging master composite forms is a useful way to view both summaryand detail level data within a single form.
Organize Forms into Folders
Use folders as a way to organize the forms in your application. Forms can be groupedin folders by process or user type, or simply to help users readily find forms. You canmove forms into folders, and you can create a folder hierarchy. Creating folders alsosimplifies assigning access because all forms in the folder will inherit the accesspermissions assigned.
Create Dashboards
Dashboards allow you to display information graphically or to display several formssimultaneously. You can also design interactive multi-chart dashboards to enableusers to analyze their plan or forecast data. As another option, you can display a gridand a graph together, or you can combine multiple grids.
To create a dashboard:
• Drag and drop forms into the dashboard. Using the settings wheel to select thechart type desired for each grid.
• You can drag and drop as many forms as you would like, setting the size of thedisplay by setting either the height or width for the component.
• Set dashboard settings to combine dimensions into a common POV.
Appendix HDesign Walkthrough
H-13
• As a best practice, balance the number of components on the dashboard toensure that it's visually pleasing to the user.
Build Summary Level Forms
Summary level forms typically bring together all of the pieces of a user's plan orforecast. They enable planners to review and analyze their results.
Leveraging composite forms is a useful way to pull together summary level results andstill have the ability to drill into detail. Using charts can also be an effective way to helpplanners analyze their results.
Using dashboards can also be an effective way to help planners analyze their results.
Build Financial Statements
Financial statements allow users to analyze performance and verify their assumptions.Financial statements could include Income Statement, Balance Sheet, and Cash Flow.
Typically, financial statements include comparative information so users can analyzetheir variances. Summary level information is typically built into financial statementswith the ability to view detailed data either through master detail composite forms or bylinking detailed forms using menus.
Incorporate Business Logic
To incorporate your business logic into your application, calculations can be built usingCalculation Manager. This enables you to create, validate, deploy, and administersophisticated calculations that solve business problems.
You typically create business rules and rulesets to:
• Perform revenue modeling
• Perform expense modeling
• Calculate KPIs
• Perform allocations
Calculation Manager includes these objects:
• Rules—Contain components and templates
• Components—Assist you in building rules
• Rulesets—Contain rules that can be calculated simultaneously or sequentially
To learn more about creating calculations, see the Calculation Managerdocumentation.
Build Aggregations
Aggregations roll up your application to summary-level members in the dimension,such as Entity or any other sparse dimension.
Calculation Manager includes templates to help you build aggregations. The SystemTemplate Aggregation has several tabs. Here are some suggestions on how to usetemplates.
Appendix HDesign Walkthrough
H-14
Set the Point of View
When the point of view is set, the rule will run only for the members chosen. Using aruntime prompt for the dimensions will allow users to specify member values for thesedimensions when launching the rule. This way, users can launch the rule several timesfor different years, scenarios and versions without having to modify the rule inCalculation Manager.
Full dense aggregation
Complete this section if parent values in your dense dimensions are not set to dynamiccalc. Typically this tab is left empty.
Full sparse aggregation
Select the sparse dimension that needs to be aggregated. The order of the selecteddimensions isn't relevant.
Partial dimension aggregation—dense
Complete this section if parent values in your dense dimensions are not set to dynamiccalc. Typically this tab is left empty.
Recommended settings:
Aggregate the data up to the local currency—No
Aggregate the missing values in the Database—Yes
Optimize the Calculation on Sparse dimension—Off
Select a value for the calculator cache—Default
Do you want to activate the debug mode for this wizard?—Debug Wizard On or DebugWizard Off. Select Debug Wizard On if you want to see a script generated to displayselections for some of the Design Time Prompts in this template.
Best practices:
• Leverage runtime prompts for members such as Entity, Scenario, and Version.This allows your rule to be dynamic and run based on user input.
• Typically, dense dimensions such as Account and Period don't need to beaggregated. If this is the case, you can set parent members to dynamic calc.However, if you have member formulas on dense dimensions and they are not setto dynamic calc, a Calc Dim rule is required.
Build Detailed Calculations
You use Calculation Manager to create, validate, deploy, and administer sophisticatedcalculations that solve business problems.
There are three types of objects that can be calculated in Calculation Manager:
• Rulesets—Contain rules that can be calculated simultaneously or sequentially(See Administering Rules.)
• Rules—Contain components and templates (See Administering Rules.)
• Components—Contain formula components, script components, conditioncomponents, range components, and fixed loop components (See AdministeringRules.)
Appendix HDesign Walkthrough
H-15
Best practices:
• As a first step in building your rules, ensure that you understand the business logicand which entities or departments the rule applies to. For example, know theaccounts that are involved in the rule.
• Be sure you know the source and destination accounts.
• After you fully understand the drivers of the calculation, use the proper objectcomponent or template to build the rule. The components and templates facilitatemember selection to help deploy the rules.
Leveraging runtime prompts for members such as Entity, Scenario, and Version allowsyour rule to be dynamic and run based on user input.
Build Reports
Building reports allows you to report on your financials for management. In this step,you build your Income Statement and other detailed reporting with the properformatting that your management team is accustomed to reviewing.
Report formats specify the layout of the report, such as which elements are on therows and columns. Report formats can be used to create many different reports, suchas by Cost Center or by Division.
Best practices:
• Before building reports, determine how many different report formats are required.
• To simplify building reports, specify a report format for each type of report youneed.
• Begin building reports by arranging dimensions properly. Next, get the report tocapture the data. Finally, apply formatting.
Build Task Lists
Task lists guide users through the planning process by listing tasks, instructions, anddue dates. Task lists help flow users through the application to ensure that the processis followed and that all of the proper data has been collected.
Task lists should be developed to support the different types of users and processflows. Tasks can help users perform many types of tasks, such as:
• Open a form
• Launch a business rule that you specify
• Start the review process with a specified scenario and version
• Copy a version of the current form’s data
• Open a specified URL
Tasks guide users through the planning process. Tasks can help users perform manytypes of tasks. They help flow users through the application to ensure that the processis followed and that all of the proper data has been collected.
Build tasks to support the different types of users and process flows.
Appendix HDesign Walkthrough
H-16
Set Up the Navigation Flow
Navigation Flows set the clusters or cards available at the top of the user screen. Thecards are typically associated with actions in your business process, such as PlanRevenue and Plan Expenses. Within each card, vertical tabs can be created to leadthe user through the process for that business area. Forms can be linked to a verticaltab to guide the user in the process. Vertical tabs can have one or many horizontaltabs linking to either forms or dashboards.
Your application comes with a default navigation flow. To customize the cards and flowfor your organization, copy the default, and then you can use it to make your own.
Tap or click Settings, then Navigation Flow. Tap or click Action, then Create Copy.
You can create a cluster to represent an entire business process that can containcards for the actions, or you can simply create new cards. Cards can be designed tobe single page or can have multiple tabs. For a card that is set up to be tabular, youcan have multiple tabs that allow you to have content visible to the end user ashorizontal tabs. You specify the content type for each of the tabs and link to an artifact.
For example, you can associate cards with:
• Dashboards
• Forms
• Rules
• Approvals
Set Up Access Permissions
Access permissions determine a user’s privileges after the product launches. Mostoften, groups are established to help organize users. By definition, a user group is aset of users with similar access permissions.
Access permissions for groups and individual users can be assigned to theseapplication elements:
• Scenarios
• Versions
• Accounts
• Entities
• Custom dimension members
• Forms
• Business rules
Users can be in a group:
• Service Administrator
• Power User
• Planner
• Viewer
Best practices:
Appendix HDesign Walkthrough
H-17
• For dimensions secured by default, modify access permissions as needed.
• Assign access permissions to application elements such as dimension members,forms, and rules. Users can view or use only those application elements to whichthey have access.
About Users and Groups
Your company’s users must be added to the Oracle Identity Management System priorto gaining access permissions to any of the elements in your application. Accesspermissions determine a user’s privileges after the product launches.
By definition, a user group is a set of users with similar access permissions. The useof groups as a way to organize users and assign access permissions is a bestpractice.
Add Users
Users must be added to your environment, assigned privileges, and granted access tothe application.
Users' roles will be defined as one of these types:
• Service Administrator—Creates and manages applications, including dimensions,forms, Calculations, and so on. The Service Administrator manages accesspermissions and initiates the budget process
• Power User—Creates and maintains forms, Smart View worksheets, and FinancialReporting reports. Can perform all Planner tasks.
• Planner—Enters and submits plans for approval, runs business rules, uses reportsthat others have created, and views and uses task lists. Leverages Smart View toenter data and do ad hoc analysis.
• Viewer—Views and analyzes data through data forms and any data access toolsfor which they are licensed. Viewers can't modify any data in the application.Typical View users are executives who want to see business plans during and atthe end of the budget process.
Planners, Power Users, and Viewers can access forms, task lists, and business rulesbased on permissions assigned by the Service Administrator.
Create Groups
It's highly recommended to leverage groups when assigning access permissions tousers. Having groups of similar users eases security maintenance on an on-goingbasis. As users are added to groups, they inherit the access permissions of the group.Assigning group access permissions to elements such as dimension members, forms,and task lists means that you don’t need to assign those access permissionsindividually for each user.
Best practices:
• If an individual user is assigned to a group, and the access permissions of theindividual user conflict with those of the group, the individual user’s accesspermissions take precedence.
• The use of groups for sets of users with similar access permissions should be welldefined prior to implementing user access.
• Individual permissions override group permissions.
Appendix HDesign Walkthrough
H-18
• If an individual is assigned to multiple groups, the group with the highest accesspermission takes precedence.
Access permissions assigned to a user directly override access permissions inheritedfrom groups that the user belongs to. For example, if you have inherited read accessto Plan from a group but are assigned write access to Plan directly, you get writeaccess to Plan.
Assign Users to Groups
As a best practice, leverage groups as a way to reduce maintenance and assignsimilar access to users. Give users access to the appropriate groups.
Assign Access to Dimensions
In order for users to read or write data, access permissions must be assigned to thefollowing dimensions:
• Account
• Entity
• Scenario
• Version
If security is enabled on custom dimensions, you must assign security to users tothose dimensions as well. For dimensions secured by default, modify security accessas needed.
Assign Access to the Account Dimension
Give users read or write access only to those accounts they are allowed to see. Youcan assign access privileges as Read, Write, or None.
Best practices:
• Relationship functions should also be leveraged whenever possible to reduce on-going security maintenance. The relationship functions are: Member, Children,iChildren, Descendant, and iDescendant. For example, assigning Write access toDescendants of Net Income for a group allows all users of that group to have Writeaccess to all accounts that are descendants of Net Income. This way, you don'tneed to assign access individually to each account.
• To take full advantage of the rules of precedence and inheritance, use anexception-based method for managing security. Primary assignment of securityshould be by group and relationship. Assign group rights to parent level members,and use relationships to push the assignments down to the children ordescendants. Assign individual user rights to children on an exception basis.
Assign Access to the Entity Dimension
Give users read or write access only to those entities they are allowed to see. You canassign access privileges as Read, Write, or None.
Assign Access to the Scenario Dimension
Access to Scenario is typically set to Read or Write. For example, you may want toassign access to Actual and Variance scenarios as Read, and to Plan and Forecast asWrite.
Appendix HDesign Walkthrough
H-19
Assign Access to the Version Dimension
Access to Version is typically set to Read or Write. For example, you may want toassign access to Final Version as Read, and to Working as Write.
Assign Access to Custom Dimensions
If security is enabled on any custom dimension, you must assign security to thedimension in order for users to have access.
Assign Access to Forms
Before users can open forms, they must be assigned access permissions.
Planners who are assigned access to a form folder can access the forms in that folderunless they are assigned more specific access.
Planners and interactive users can view or enter data only into forms to which theyhave access. They can work only with members to which they have access.
Tips:
• To simplify assigning access to forms, organize forms into folders and assignaccess at the folder level instead of the individual form level. Access permissionscan be set to Read, Write or None.
• When you assign access to a folder, all folders under it inherit that access.
• If you assign specific access (such as None or Write) to a form folder, that accesspermission takes precedence over its parent folder's access permissions. Forexample, if a user has Write access to Folder1 that contains Folder2 to which theuser has None access, the user can open Folder1, but doesn't see Folder2.
• If a user has None access to a form folder called Folder1 that contains a formcalled Form1 to which the user has Write access, the user can see Folder1 andForm1.
Assign Access to Business Rules
Before users can launch business rules, they must be given access permissions to therules.
As a best practice, organize business rules into folders that have similar user access,and apply security to the folders. You can also give access permissions to individualbusiness rules, although this is a little more time-consuming.
Planners have Launch access to Calculation Manager business rules in folders towhich they are assigned access, unless they are assigned more specific access
Assign Access to Task Lists
In order to navigate through the application, users must be assigned access toindividual task lists.
As a best practice, assign access using groups. This is more efficient than applyingaccess to individual task lists.
Assign Access to Reports
Users must be assigned access to a report before they can use it.
Appendix HDesign Walkthrough
H-20
As with other artifacts, it's recommended that you organize reports into folders andassign access at the folder level. This limits the amount of maintenance required forsecurity. As reports are added to the folder, access is inherited from the folder.
Build Approvals
Use approvals to track budgets and review status, planning unit ownership, andprocess issues. This reduces the time required for the planning cycle.
Set up the approval path independent of organizational structure to reflect the path aplan or forecast must follow for approval.
Users can provide annotations and comments for their submissions.
Set up the Planning Unit Hierarchy
Setting the planning unit hierarchy defines the promotional path used in approvals.The basis of the planning unit hierarchy is the Entity or any part of the Entity dimensionin combination with any secondary dimension.
The secondary dimension can be a mix between several dimensions, depending onwhere you are in the workflow. For example, you can combine the Entity dimensionwith the Products dimension in the promotional path for certain entities, while using theChannels dimension in the promotional path for other entities.
Owners and reviewers can be directly assigned the planning unit. Validation rules canbe created to handle conditional promotion path dependent on data conditionals. Youcreate different planning unit hierarchies to support review processes within yourorganization
The planning unit hierarchy is then assigned to the appropriate Scenario and Versioncombination.
Planning units are combinations of scenario, version, and entity or part of an entity.Scenarios and versions are the basis of the review cycle. A planning unit hierarchycontains planning units and any other dimensions that are part of the review process.
Things to know about approvals:
• The review process follows the promotional path you set up when you select theowner and reviewers for a planning unit, unless an event triggers a change in thepromotional path.
• Parent/child relationships between planning unit hierarchy members affect thereview process
• When users promote or reject a parent, the parent’s children are promoted orrejected unless they are approved. The owner for the parent becomes the ownerof the children.
• When users approve a parent, its children are approved.
• After all children are promoted to the same owner, the parent is promoted to theowner.
• When the status of all children changes to one status, for example Signed Off,parent status changes to the same status.
• Users can't change the status of a parent if its children have different owners.
• If the children are promoted to, submitted to, or signed off by different users, theparent has no owner and only administrators can change its status.
Appendix HDesign Walkthrough
H-21
• The planning unit moves from one reviewer to another until the budget process iscomplete.
Test
Testing is a critical step in application development. All of the calculations, accesspermissions, and reports must be tested to ensure that they work appropriately.
About Unit Testing
Unit testing is the first step of formalized testing, and is the main building block of thetest environment. Unit testing involves testing each functional area of the applicationas a separate unit to ensure that it performs as expected.
For example, a test could confirm that a data load executes to completion withouterrors. Other tests could confirm that forms and reports are accessible, calculationscomplete, and so on.
The person that builds or configures the application usually conducts unit testing.
About System Testing
System testing validates that the system operates without error and provides therequired functionality.
The main emphasis is to test the way in which the application has been configured andto look at how the team has constructed the business processes and reports. Systemtesting focuses on testing the entire system, including unique parameter configuration,all functions that will be used, and any enhancements.
System testing also looks beyond the software, and validates the effectiveness ofmanual procedures, forms and controls. It's a complete set of formal functional testscovering all aspects of functionality within the system being built.
This type of test is often combined with:
• Security Tests—Tests that the system security and database security isappropriate for the overall system and each specific user.
• Integration Tests—Tests the overall business solution, including the passage ofdata to and from other integrated systems. This confirms that the functionalityremains valid when all aspects of the system have been combined.
• User Acceptance Tests—Users validate that the system operates correctly andmeets requirements. If users are not involved in formal system testing or theyrequest specific tests, there may be a need for further acceptance tests. However,in most cases, this type of testing is done as part of System and Integration Tests,provided that users recognize these tests as adequate for acceptance purposes.
Rollout
During rollout, you can train end users on the system, and show them how to navigateand use functionality. As a best practice, document your system to enable someoneelse to take over administration if necessary.
Training
All users of the system should be trained on the application. Users need to learn howto navigate comfortably around the application and understand the tasks assigned tothem. Training should include logging into the application, navigating through task lists,
Appendix HDesign Walkthrough
H-22
entering data, running rules, using Smart View, and using tools within the application.Training is typically the user’s first exposure to the application, and a well planned andexecuted training session helps make a good first impression.
Document System and Administrative Information
After building your application, it's recommended that you create system andadministrative documentation for the application.
Best practices:
• Create this documentation at the end of the Build Process when the information isfresh.
• Include information such as the sources of data, the application structure, howcalculations work, and what maintenance is required for the application.
List maintenance tasks broken down into timeframes, such as monthly and annualmaintenance. This makes it possible for someone else to take over the system later ifnecessary.
Enable the Application for Users
To enable the application for end users, you must open up the system enabling. Inaddition, start planning units to enable approvals.
Start Planning Units
The planning unit must be started before users can access the system to begin thereview process. After it's started, the planning unit moves from one reviewer to anotheruntil the process is complete.
Appendix HDesign Walkthrough
H-23
IFrequently Asked Questions
Related Links
• What is the PBCS Plus One Business Process Option?
• How Can I Brand My Environment for Easy Recognition?
• Can I Change the Logo in My Cloud Service? What Graphical Elements can ICustomize?
• Can I Customize the Look of My EPM Cloud Services and Change theBackground?
• Where Can I Find Documentation and Examples for Groovy Business Rules?
What is the PBCS Plus One Business Process Option?
In addition to the Standard PBCS and Enterprise PBCS licenses, Oracle offers aPBCS Plus One Business Process option. When you purchase the Enterprise PBCSlicense or PBCS Plus One Business Process option license, depending on the specificoption you license, you can create an application of Enterprise type or convert aStandard application to an Enterprise application type and choose to configureEnterprise business processes: Financials, Strategic Modeling, Workforce, Projects, orCapital.
Some features in the product are enabled only when your application is an Enterpriseapplication type. One such feature is using Groovy rules (see Using Groovy Rules).
How Can I Brand My Environment for Easy Recognition?
See Customizing Your Display.
Can I Change the Logo in My Cloud Service? What Graphical Elements can ICustomize?
Yes, you can change the logo. See Customizing Your Display.
Can I Customize the Look of My EPM Cloud Services and Change theBackground?
Yes, you can customize the look and change the background. See Customizing YourDisplay.
Where Can I Find Documentation and Examples for Groovy Business Rules?
Groovy rules are available for the applications of type "Enterprise" (available withEnterprise PBCS or PBCS Plus One licenses). For basic information on working withGroovy rules, see Using Groovy Rules.
For details about creating business rules with Groovy, see Creating a GroovyBusiness Rule in Designing with Calculation Manager for Oracle EnterprisePerformance Management Cloud.
I-1
To view a technical reference and sample scripts for designing Groovy rules, see the Java API Reference for Oracle Enterprise Performance Management Cloud GroovyRules on the cloud help center. You can also access this reference from the OracleEnterprise Planning and Budgeting Cloud Academy. To access the Academy, sign intoa service instance, and then click Academy.
The API reference includes examples that demonstrate the syntax and power of theEPM Groovy object model.
To see example Groovy scripts:
1. Open the Java API Reference for Oracle Enterprise Performance ManagementCloud Groovy Rules, http://docs.oracle.com/cloud/latest/epm-common/GROOV/.
2. Do one of the following:
• On the main page, scroll down to Example Groovy Scripts. To view theexamples, click the word “here” in the sentence about example Groovy scripts.
• In the left pane, under All Classes, click a topic to view detailed informationand examples of Groovy scripts. For example, click StrategicModel to seeexample scripts to load data from Planning and push it into Strategic Modeling,and to load data from Strategic Modeling and push it into Planning.
Appendix I
I-2