Embed Size (px)
Citation preview

Admitted Student Questionnaire®
How to Interpret and UseYour ASQ® Reports and Data
User Guide
2013–2015www.collegeboard.org
chapter 1Introduction to ASQ® Reports . . . . . . . . . . . . . . . . . . . . . . . . . . . 1
chapter 2ASQ as Market Research . . . . . . . . . . . . . . . . . . . . . . . . . . . . . . . 5
chapter 3Your Highlights and Detailed Reports . . . . . . . . . . . . . . . . . . . . . 9
chapter 4How to Use the ASQ Data File . . . . . . . . . . . . . . . . . . . . . . . . . . 25
chapter 5How to Do Your Own Analyses . . . . . . . . . . . . . . . . . . . . . . . . . . 31
chapter 6How to Develop Statistical Models . . . . . . . . . . . . . . . . . . . . . . . 37
contents
ASQ® User Guide2013–2015
SPSS examples . . . . . . . . . . . . . . . . . . . . . . . . . . . . . . . . 411 . Analyzing ASQ Responses of Gender Subgroups
2 . Segmenting by Geographic Markets
3 . Computing Average Ratings by Test Score Group
4 . Using Indicator Variables for Exploratory Analyses of Group Differences
5 . Perceptions of Information Sources
6 . Ratings of Quality Relative to Perceived Importance
7 . Computing Cross-Applications and Cross-Admits for Selected Student Groups
8 . Selecting Applicants or Admits to Specified Colleges for Analysis
9 . Analyzing Yields
appendix aRecord Layout—Admitted Student Questionnaire® . . . . . . . . . . . 49
appendix bProgram Listing for ASQ .SPS (SPSS File Layout) . . . . . . . . . . . . . 55
appendix cListing of Supplementary SPSS Commands . . . . . . . . . . . . . . . . . 63
© 2013 The College Board. College Board, Admitted Student Questionnaire, ASQ, EPS, SAT and the acorn logo are registered
trademarks of the College Board. Windows, Microsoft Word and Microsoft Excel are registered trademarks of Microsoft
Corporation. Other products and services may be trademarks of their respective owners. Visit the College Board on the Web:
www.collegeboard.org.
Introduction to ASQ®
Reports
How to Use This GuideThis user guide provides suggestions about how to use the information contained in the ASQ® reports prepared from students’ responses to the Admitted Student Questionnaire®.
Although the ASQ reports include a large amount of information, you may want to pursue further research with your data. If so, you can obtain the results of your survey on a CD-ROM. The last part of the guide describes the data files that users of ASQ may receive, and provides specific suggestions for analyzing ASQ data in relation to a wide range of issues.
After a brief discussion of the marketing approach to college admission in Chapters 1 and 2, Chapter 3 takes you through your Highlights Report section by section, with reference to additional information found in the Detailed Report and the Norms Report. This chapter contains a set of research questions that helps you interpret your ASQ results. Each question is accompanied by a discussion of its marketing implications and of analytical steps to help you identify the salient points of each section of the report.
Questions 1–7 concern the importance and comparative quality rating of the 20 characteristics that form the first page of the questionnaire .
Questions 8 and 9 consider the college images found at the bottom of the second page of the survey .
Question 10 covers the importance of and the comparative rating of your institution by selected influential people .
1
chapter 1
Questions 11 and 12 deal with sources of information about your college .
Question 13 examines the information about your competition, taken from the write-in section at the top of page 3 of the questionnaire .
Question 14 considers cost and financial aid .
The first three chapters will be beneficial to all ASQ users and do not require the purchase of any additional data files or services.
Chapters 4 to 6 describe the data files that users of the ASQ can obtain. Chapter 4 includes a description of ASQAnalyst, the Windows®-based software program that is included with the ASQ data files on the CD-ROM. This program gives you access to the data without having to go through a statistical package such as SAS or SPSS. With this software you can reproduce the basic tables in the reports, view your results side by side with data from the Norms Report, and relate one set of variables from the survey with other sets.
Chapters 5 and 6 provide specific suggestions for analyzing ASQ data in relation to a wide range of issues. Included are discussions of some of the technical details of the ASQ, with listings of SPSS commands that will produce the suggested analyses.
The suggestions in Chapters 5 and 6 are most useful to admission professionals who have some background in research or to institutional researchers. The discussions of potential areas of investigation are intended to be accessible to all users. However, a capability to use computers for statistical analysis is necessary to carry out the types of analyses described, and specific suggestions relating to analytic methods assume a working familiarity with data analysis using statistical computer software.
ASQ data can also be used in programs such as MS Excel, although certain types of statistical analysis are more difficult using spreadsheet programs.
Approaching Your DataYour Highlights Report is the basic analytical tool for exploration of the data from your study. The graphics in this report highlight many of the relationships, or lack of relationships, that can be observed in the data. The graphics can also help you make presentations to senior administrators, planning or marketing committees, faculty senates, and trustee admission committees.
Your Detailed Report contains the percentages of respondents who gave each response to the survey items on an item-by-item basis. It also shows the number of respondents on which each percentage distribution is calculated—the base numbers. Both the percentages and the base numbers are essential when interpreting and evaluating the information, especially the graphs, in the Highlights Report. The Detailed Report also contains information about questions that didn’t show up in the sets of “top” responses in the Highlights Report. That’s where you will sometimes find the items you thought would be significant but didn’t turn out that way. If you used the optional “local question” feature of ASQ, the students’ responses to those questions are included in the Detailed Report.
2 ASQ User Guide

How to Use the ReportsStart your analysis of the data with the questions that appear at the top of each page in the Highlight Reports. As you read the questions and look at the students’ responses in the tables and graphs, compare the results with what you thought they would be, based on your experience with students in the market or on your knowledge of your institution and the competition. Look at the students’ ratings of the aspects of your school that are featured in your communications with them.
For example, look at the image data on page 15 of the Highlights Report. These data answer the question: Which images are most frequently associated with our college? Study the images listed at the top of the table:
■ Are they the images you were trying to project in your communications with students?
■ Are some images that should be recognized widely, given the nature of your institution, insufficiently represented among your principal images?
■ What do these findings about your images say about aspects of your institution that you may want to reinforce through publications or through program policy and budget decisions?
In the Highlights Report, look at your ratings on the characteristics in Exhibits B-2 and B-3 (and on pages 2–8 of the Detailed Report). Because these are ratings that compare students’ perceptions of your school to others they considered seriously, you should begin by reviewing the institutions with which you are being compared—which are listed in the Appendix of the Highlights Report. In view of what you know about your own college and about your competition, gleaned from both their publications and their objective characteristics, which ratings are essentially accurate and which reflect some misinformation (either favorable or unfavorable)?
After you have read the reports you may find that some additional materials are needed. This guide describes some supplemental analyses you can perform using the data in the reports. Chapter 5 provides more detailed suggestions for analyses based on the raw data. At any time you can order a CD-ROM containing the data from this year or any previous year(s). An optional Trend Report, which sets out side by side the results from any two to any six years of your ASQ studies, is also available.
3

ASQ as Market Research
A Marketing Approach to Data AnalysisMarket research is grounded in the methods of the social sciences, but it is not a social science, that is, it is not an attempt to create or test generalized theories of behavior. Rather, market research is a vehicle for expanding, testing, and perhaps challenging knowledge gained from experience about the ways different types of people think and behave. Through market research you can examine the attitudes and perceptions of students you would like to attract and find ways to adjust your programs or your recruiting efforts in order to become more visible. Although much of this guide deals with the expansion of your market through market research, with a focus on nonenrolling students, it is essential that you understand your present clientele. You do not want to undertake initiatives to expand your market that will unwittingly erode your attractiveness to the types of students you now serve.
In addition to understanding the desires and perceptions of groups and subgroups of students, it is important to understand the competition, especially as seen through the eyes of students themselves.
Market research examines the interrelated perspective of:
■ What students want in a college
■ What you can offer students
■ What your competition offers students
■ What students know about what they want, what you offer, and what the competition offers
■ How these phenomena may differ across types of students
5
chapter 2

Reasonable Interpretations of Market Research DataMarket research often focuses on typical (modal) responses given by a group of students or on how different types of students respond. For example, do students with certain perceptions of your college tend to enroll more frequently than other students? Looking for relationships between phenomena such as those given above is a basic part of market research. The lack of a relationship, however, can be as important in marketing as a strong relationship between two phenomena. For example, if the way students view you on a particular characteristic has no effect on the likelihood of their enrolling, any decision to invest heavily in the development of that characteristic will need to be made for reasons other than the improvement in your yield of admitted students.
When looking for different behaviors between enrolling and nonenrolling students, focus on those that are sizable and that have marketing implications. Do not give undue attention to minor differences. The Highlights Report employs one mechanism for protecting against such errors: Differences that are statistically significant are noted in the tables. Statistical significance, however, does not necessarily mean substantive or marketing significance. The former indicates that given the size of your sample, the difference that appears between two groups is not likely to be due to chance variations in the way the two groups responded. A small difference between two groups in a large number of respondents will result in statistical significance more often than with a small number of respondents. Relatively small percentage differences can be statistically significant in large groups.
Substantively significant differences in market research data, on the other hand, are not a function of sample size but of the likelihood that different marketing activities directed toward different groups will produce the same desirable response, such as enrollment in a college at a reasonable cost. This approach to marketing is in contrast to undifferentiated treatment of groups, which produces an uneven response across groups. For example, take a statistically significant difference between two groups, where 56 percent of one group believes that campus setting is important and 45 percent of the other group shares that feeling. This difference may be statistically significant, but it is not substantive. About one-half of each group believes that campus setting is important and, if there were 150 people in each group, the difference between the two groups on this measure would be only 16 people. On the other hand, had the differences been substantive, something like 49 percent and 25 percent, differential treatment might be justified.
Remember that relatively large differences between two groups of students may not be useful for marketing purposes if they reflect behavior or attitudes of a small portion of each group. For example, suppose that 31 percent of your nonenrolling students were concerned about quality of social life, compared with only 15 percent of enrolling students. You may decide that this small segment of your nonenrolling students is a group you wish to cultivate, and that this is the means by which to do it. But an initiative in this area will not be an attraction to a majority of your nonenrolling students, even though these students are more than twice as likely as your enrolling students to report quality of social life as very important.
Remember that ASQ data come from students who have not yet attended college. Although student perspectives are critical because they are used to make decisions regarding colleges, these perspectives are not entirely based on actual experience.
6 ASQ User Guide
Therefore, professional responsibility is also essential in determining what a school should do and how it should educate prospective students about what the school is and what it accomplishes.
Sharing Data with Decision Makers and Advisory GroupsAlthough the Highlights Report shows only key findings of your study, it still contains a large volume of data. This report can be daunting, especially for administrators, faculty, and trustees for whom admission is not a day-to-day concern. The experiences of the ASQ institutions suggest that the information from your study may be most effective when shared in limited doses. We recommend two approaches for dealing with the problems of information overload and its resulting frustrations.
1 . Produce executive summaries based on the report. Limit each summary to three pages . Report on your four principal images, the four college characteristics that are the most important to the students, your five competitors, and several areas in which you excel according to the admitted students . Discuss a few findings you anticipated that did not materialize . Focus on key student characteristics, values, or perceptions that distinguish enrolling from nonenrolling students . If there are particular policy or budgetary issues currently being discussed on campus, focus on any data that are related to these issues . (See Example 1 .)
2 . Prepare topical summaries and distribute them in installments. The ASQ questionnaire and Reports are divided into sections, such as images, information sources, individual competitors, financial aid, etc ., each of which is a candidate for a summary . You can distribute one- to two-page summaries in these topical areas, along with appropriate graphs and tables from the reports, a short discussion of their marketing implications and, as appropriate, marketing recommendations from your office . (See Example 2 .)
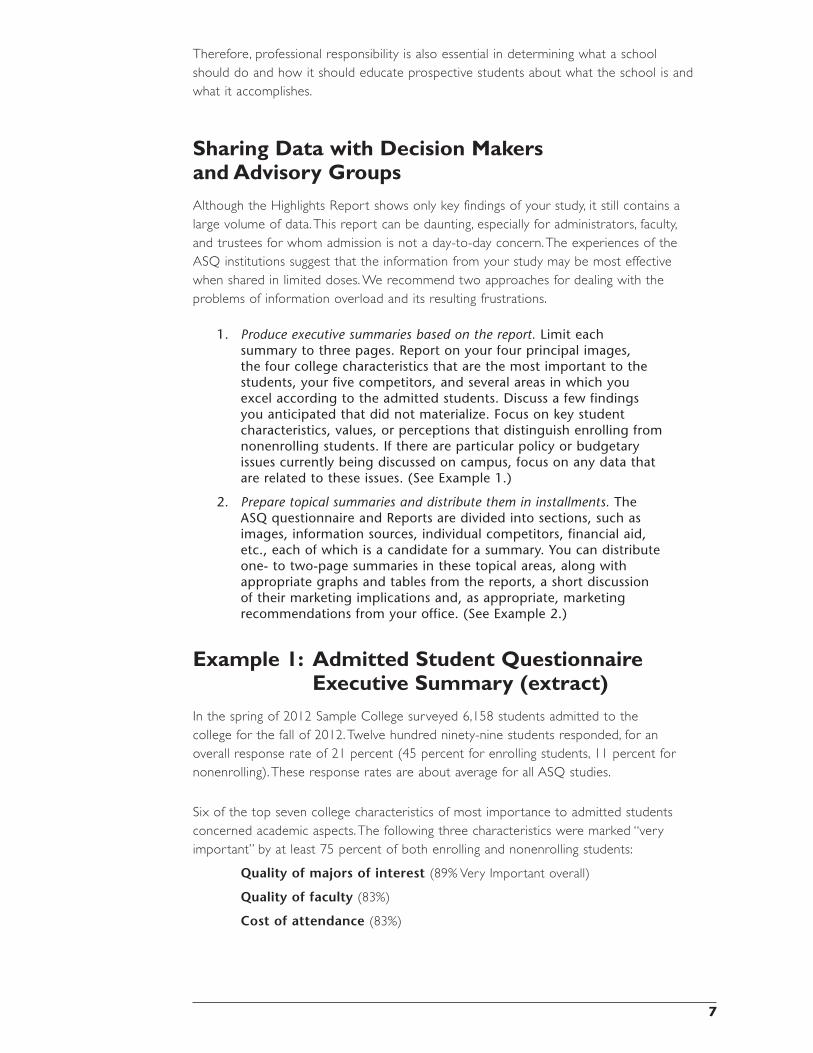
Example 1: Admitted Student Questionnaire Executive Summary (extract)
In the spring of 2012 Sample College surveyed 6,158 students admitted to the college for the fall of 2012. Twelve hundred ninety-nine students responded, for an overall response rate of 21 percent (45 percent for enrolling students, 11 percent for nonenrolling). These response rates are about average for all ASQ studies.
Six of the top seven college characteristics of most importance to admitted students concerned academic aspects. The following three characteristics were marked “very important” by at least 75 percent of both enrolling and nonenrolling students:
Quality of majors of interest (89% Very Important overall)
Quality of faculty (83%)
Cost of attendance (83%)
7
Quality of majors was somewhat more important to our admitted students (89% Very Important) than it was to students at liberal ar ts colleges in general (84%), and Cost of attendance was much more important to our students (83% Very Important, compared to 70 percent for all liberal ar ts students).
Two of the characteristics of most importance to our admitted students were among those rated most positively:
Overall academic reputation (56% Better or Best)
Quality of majors (55%)
Quality of faculty (53%)
Quality of academic facilities (53%)
Most of these ratings compare favorably to those given to private liberal ar ts colleges in general:
Overall academic reputation (45% Better or Best vs. 56% for Sample College)
Quality of majors (38% vs. 55%)
Quality of faculty (50% vs. 53%)
Quality of academic facilities (41% vs. 53%)
For at least 45 percent of our admitted students, Sample College is perceived to be:
Comfortable (marked by 53% of all admitted students)
Friendly (52%)
Social (46%)
Enrolling students marked each of these three images more often than did nonenrolling students. Comfortable was the only image marked by at least half the nonenrolling students.
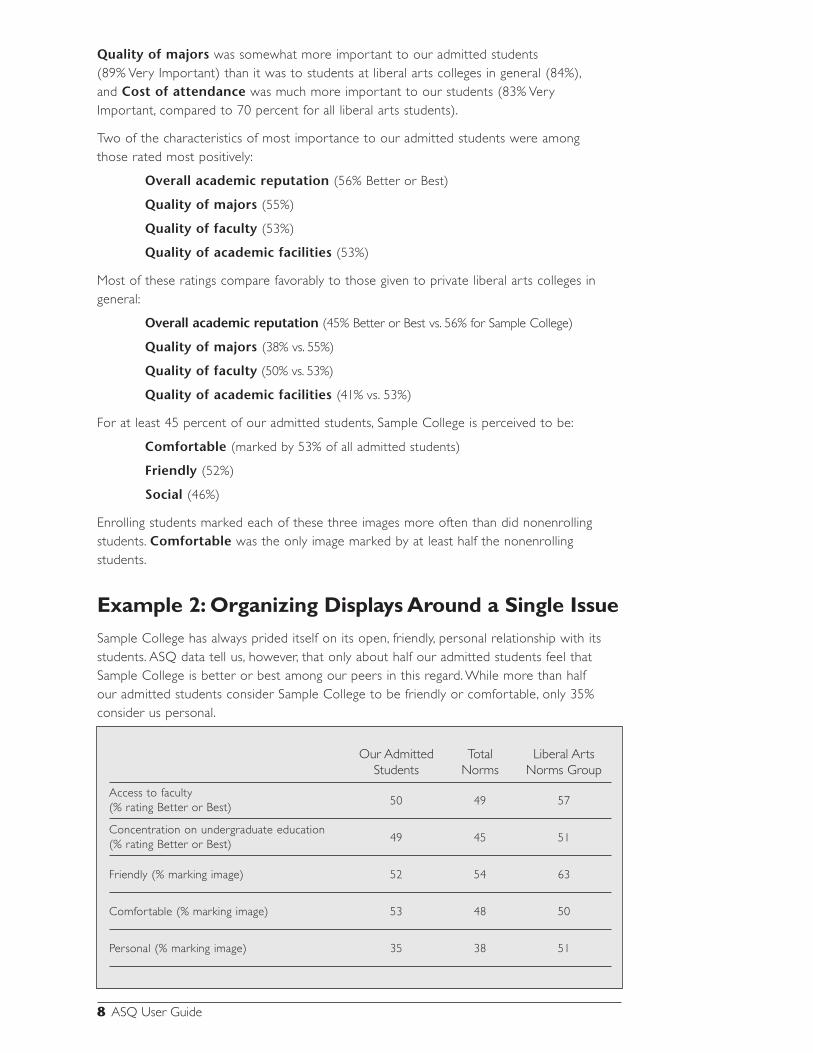
Example 2: Organizing Displays Around a Single IssueSample College has always prided itself on its open, friendly, personal relationship with its students. ASQ data tell us, however, that only about half our admitted students feel that Sample College is better or best among our peers in this regard. While more than half our admitted students consider Sample College to be friendly or comfortable, only 35% consider us personal.
Our Admitted Total Liberal Arts Students Norms Norms Group
Access to faculty 50 49 57
(% rating Better or Best)
Concentration on undergraduate education 49 45 51
(% rating Better or Best)
Friendly (% marking image) 52 54 63
Comfortable (% marking image)
53 48 50
Personal (% marking image)
35 38 51
8 ASQ User Guide
Your Highlights and Detailed ReportsQuestions that might be answered by your Highlights Report are listed in this chapter. The Marketing Implications section suggests why you might want these answers and the Analytical Steps section explains how to use the reports to answer these questions.
In order to keep the two standard ASQ reports manageable, they focus only on the entire admitted applicant pool or on enrolling versus nonenrolling students. However, many other groups, such as racial, gender, or ability groups, are of interest in a market research inquiry. Many relationships between phenomena that are not presented in the standard reports are also important in understanding your markets, your marketing program, and your marketing opportunities. For example, do people who use different information sources tend to have different images of your college? Questions of this type are best answered using the raw data file. See Chapter 5 of this guide for fur ther discussion.
The following questions are based on the Highlights Report.
College Characteristics
QUESTION 1. What is important to the students we would like to enroll but who are choosing to go elsewhere?
Marketing Implications
If your enrollments are below capacity, your institution can be enhanced by enrolling more of the students who are admissible. Alternatively, higher yields will permit you to
9
chapter 3

be more selective in your admission so that you can have a socioeconomically diverse class or attract students with particular talents or interests. In the event your enrolling and nonenrolling students consider the same things to be important, you should look for other clues that distinguish the two groups, such as their relative use of information sources or the importance of college costs and financial aid. On the other hand, if enrolling and nonenrolling students consider different things to be important, you may be able to increase your yield among the latter by addressing their distinctive interests. Be careful to avoid initiatives designed to cultivate nonenrolling students that will alienate the students you already attract.
Analytical Steps
Review the column of nonenrolling students’ data in Exhibit B-1 of the Highlights Report and the seven pages in the Detailed Report covering college characteristics. Focus on the “Importance” ratings and look for relatively large percentages, for example, 60 percent or higher for very important characteristics. Then compare those percentages with the corresponding figures for enrolling students. Look for relatively large differences, such as 15 percentage points or more. (Remember that differences of less than 15 percent may be statistically significant.) The important characteristics thus identified may include those you could use to cultivate nonenrolling students.
As shown in Example 1, nonenrolling and enrolling students are both likely to report the same thing as “very important”: “quality of majors.” At the same time, 6 percent more nonenrolling than enrolling students indicate a strong concern for “cost of attendance,” and “variety of courses,” both of which were considered to be “very important” by at least 70 percent of the nonenrolling students. Cultivation of these nonmatriculants might focus on these aspects of the college.
10 ASQ User Guide
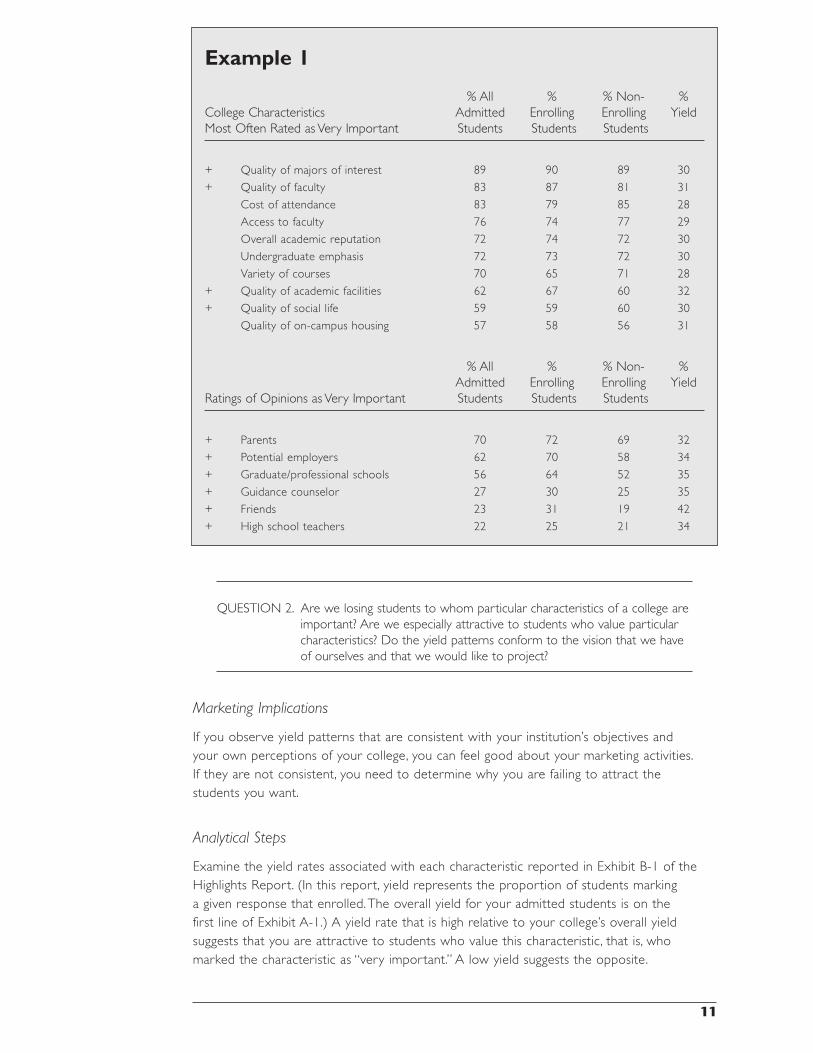
Example 1
% All % % Non- % College Characteristics Admitted Enrolling Enrolling Yield Most Often Rated as Very Important Students Students Students
+ Quality of majors of interest 89 90 89 30
+ Quality of faculty 83 87 81 31
Cost of attendance 83 79 85 28
Access to faculty 76 74 77 29
Overall academic reputation 72 74 72 30
Undergraduate emphasis 72 73 72 30
Variety of courses 70 65 71 28
+ Quality of academic facilities 62 67 60 32
+ Quality of social life 59 59 60 30
Quality of on-campus housing 57 58 56 31
% All % % Non- % Admitted Enrolling Enrolling Yield Ratings of Opinions as Very Important Students Students Students
+ Parents 70 72 69 32
+ Potential employers 62 70 58 34
+ Graduate/professional schools 56 64 52 35
+ Guidance counselor 27 30 25 35
+ Friends 23 31 19 42
+ High school teachers 22 25 21 34
QUESTION 2. Are we losing students to whom particular characteristics of a college are important? Are we especially attractive to students who value particular characteristics? Do the yield patterns conform to the vision that we have of ourselves and that we would like to project?
Marketing Implications
If you observe yield patterns that are consistent with your institution’s objectives and your own perceptions of your college, you can feel good about your marketing activities. If they are not consistent, you need to determine why you are failing to attract the students you want.
Analytical Steps
Examine the yield rates associated with each characteristic reported in Exhibit B-1 of the Highlights Report. (In this report, yield represents the proportion of students marking a given response that enrolled. The overall yield for your admitted students is on the first line of Exhibit A-1.) A yield rate that is high relative to your college’s overall yield suggests that you are attractive to students who value this characteristic, that is, who marked the characteristic as “very important.” A low yield suggests the opposite.
11
In Example 1, note that yield is highest for the minority of students for whom the opinions of their friends are very important, but relatively low for those to whom cost of attendance or variety of courses is very important.
The next step is to investigate how nonmatriculants may differ from enrolling students in their perceptions of your institution. You may also need to engage in additional research (e.g., other surveys, group interviews with current or prospective students, etc.) to determine why students with particular interests and concerns fail to find your college as attractive as other students do.
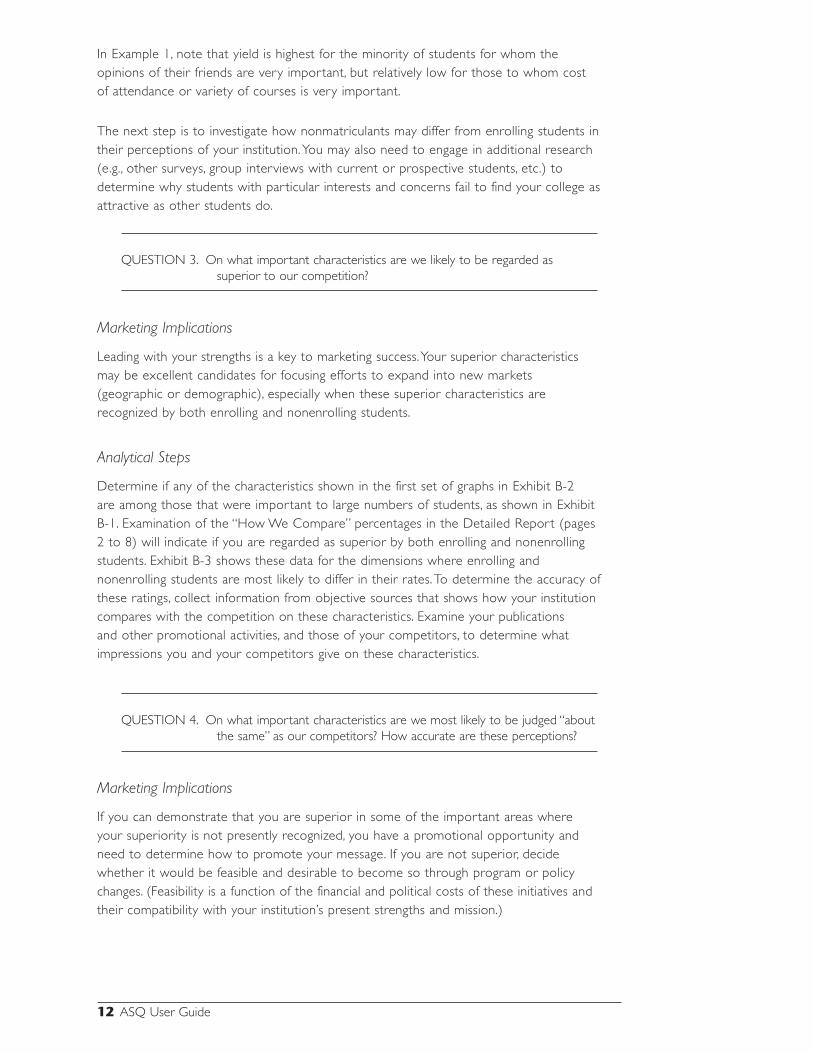
QUESTION 3. On what important characteristics are we likely to be regarded as superior to our competition?
Marketing Implications
Leading with your strengths is a key to marketing success. Your superior characteristics may be excellent candidates for focusing efforts to expand into new markets (geographic or demographic), especially when these superior characteristics are recognized by both enrolling and nonenrolling students.
Analytical Steps
Determine if any of the characteristics shown in the first set of graphs in Exhibit B-2 are among those that were important to large numbers of students, as shown in Exhibit B-1. Examination of the “How We Compare” percentages in the Detailed Report (pages 2 to 8) will indicate if you are regarded as superior by both enrolling and nonenrolling students. Exhibit B-3 shows these data for the dimensions where enrolling and nonenrolling students are most likely to differ in their rates. To determine the accuracy of these ratings, collect information from objective sources that shows how your institution compares with the competition on these characteristics. Examine your publications and other promotional activities, and those of your competitors, to determine what impressions you and your competitors give on these characteristics.
QUESTION 4. On what important characteristics are we most likely to be judged “about the same” as our competitors? How accurate are these perceptions?
Marketing Implications
If you can demonstrate that you are superior in some of the important areas where your superiority is not presently recognized, you have a promotional opportunity and need to determine how to promote your message. If you are not superior, decide whether it would be feasible and desirable to become so through program or policy changes. (Feasibility is a function of the financial and political costs of these initiatives and their compatibility with your institution’s present strengths and mission.)
12 ASQ User Guide
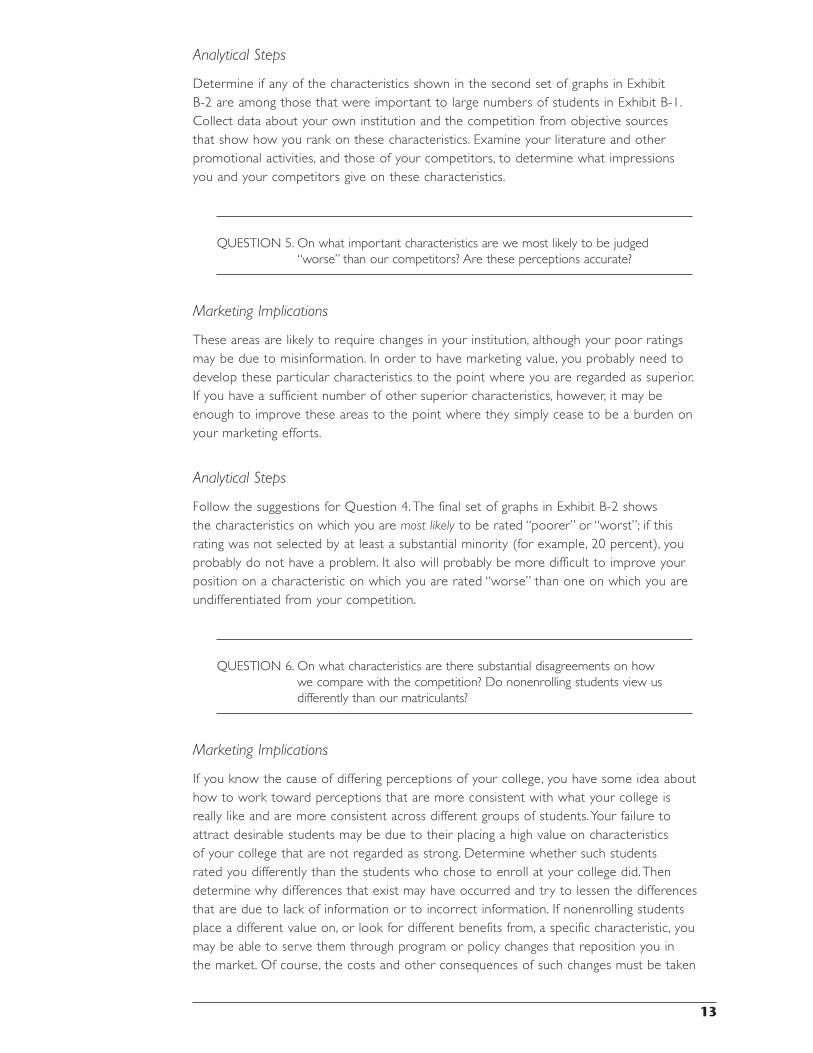
Analytical Steps
Determine if any of the characteristics shown in the second set of graphs in Exhibit B-2 are among those that were important to large numbers of students in Exhibit B-1. Collect data about your own institution and the competition from objective sources that show how you rank on these characteristics. Examine your literature and other promotional activities, and those of your competitors, to determine what impressions you and your competitors give on these characteristics.
QUESTION 5. On what important characteristics are we most likely to be judged “worse” than our competitors? Are these perceptions accurate?
Marketing Implications
These areas are likely to require changes in your institution, although your poor ratings may be due to misinformation. In order to have marketing value, you probably need to develop these particular characteristics to the point where you are regarded as superior. If you have a sufficient number of other superior characteristics, however, it may be enough to improve these areas to the point where they simply cease to be a burden on your marketing efforts.
Analytical Steps
Follow the suggestions for Question 4. The final set of graphs in Exhibit B-2 shows the characteristics on which you are most likely to be rated “poorer” or “worst”; if this rating was not selected by at least a substantial minority (for example, 20 percent), you probably do not have a problem. It also will probably be more difficult to improve your position on a characteristic on which you are rated “worse” than one on which you are undifferentiated from your competition.
QUESTION 6. On what characteristics are there substantial disagreements on how we compare with the competition? Do nonenrolling students view us differently than our matriculants?
Marketing Implications
If you know the cause of differing perceptions of your college, you have some idea about how to work toward perceptions that are more consistent with what your college is really like and are more consistent across different groups of students. Your failure to attract desirable students may be due to their placing a high value on characteristics of your college that are not regarded as strong. Determine whether such students rated you differently than the students who chose to enroll at your college did. Then determine why differences that exist may have occurred and try to lessen the differences that are due to lack of information or to incorrect information. If nonenrolling students place a different value on, or look for different benefits from, a specific characteristic, you may be able to serve them through program or policy changes that reposition you in the market. Of course, the costs and other consequences of such changes must be taken
13
into account. If, on the other hand, nonenrolling students are less likely to have exposure to sources of information about your performance or status with regard to a particular characteristic, ways to increase such exposure need to be explored.
Analytical Note
A variety of comparative ratings are included in the ASQ. These ratings focus on comparisons of your institution with other institutions that the students considered seriously (but not limited to those institutions to which they applied or to which they were admitted). This frame of reference was selected because substantial numbers of students apply (many through early decision programs) to only one institution.
Differences in the ratings of your institution that are observed between enrolling and nonenrolling students may be due in part to their different perceptions of your institution and in part to the two groups making implicit comparisons of your school with different sets of institutions (that is, the two groups tend to see you in a similar manner but compare you with sets of institutions that differ in their characteristics and strengths). If you think this is the case, you need to use the data file to explore this issue. Although it may be difficult to determine whether differences in the rating given your college by enrolling and nonenrolling students might be due to different institutional frames of reference, it is important to know where you are perceived as weak or strong and where nonenrolling students are especially prone to give you low comparative ratings.
Analytical Steps
Exhibit B-3 in the Highlights Report shows the characteristics on which enrolling and nonenrolling students differ by the largest amount when comparing your institution to your competitors. Look for one of several patterns in the comparative ratings given by nonenrolling students: They may be more likely to give your college a rating of “poorer/worst” than any other rating; they may be about equally likely to rate you “better/best” or “about the same,” in contrast to the majority of enrolling students who tend to rate your college “better/best”; or they may regard your institution as mostly undifferentiated from the competition. Pages 2–8 in the “How We Compare” response tabulations of the Detailed Report show the exact percentages that give each response. The amount of promotional or program development that would be required to give you superior ratings among nonenrolling students differs substantially across these three response patterns.
The Detailed Report may also be used to determine whether there are any characteristics for which substantial numbers of students rate you “best” and for which substantial numbers rate you “about the same” or “worse.” However, to get some clues on whether enrolling and nonenrolling students (a) have different values regarding these characteristics, or (b) have different types of levels of exposure to your college, you can use the Highlights and Detailed Reports in only limited ways. See the section on working with the ASQ data file for some suggested analyses that may provide more illuminating details.
As an example of how the Detailed Report can be used for clues regarding these ratings, consider “quality of majors of interest” in Example 2. To determine whether the differences in enrolling and nonenrolling students’ ratings of the college in the example
14 ASQ User Guide
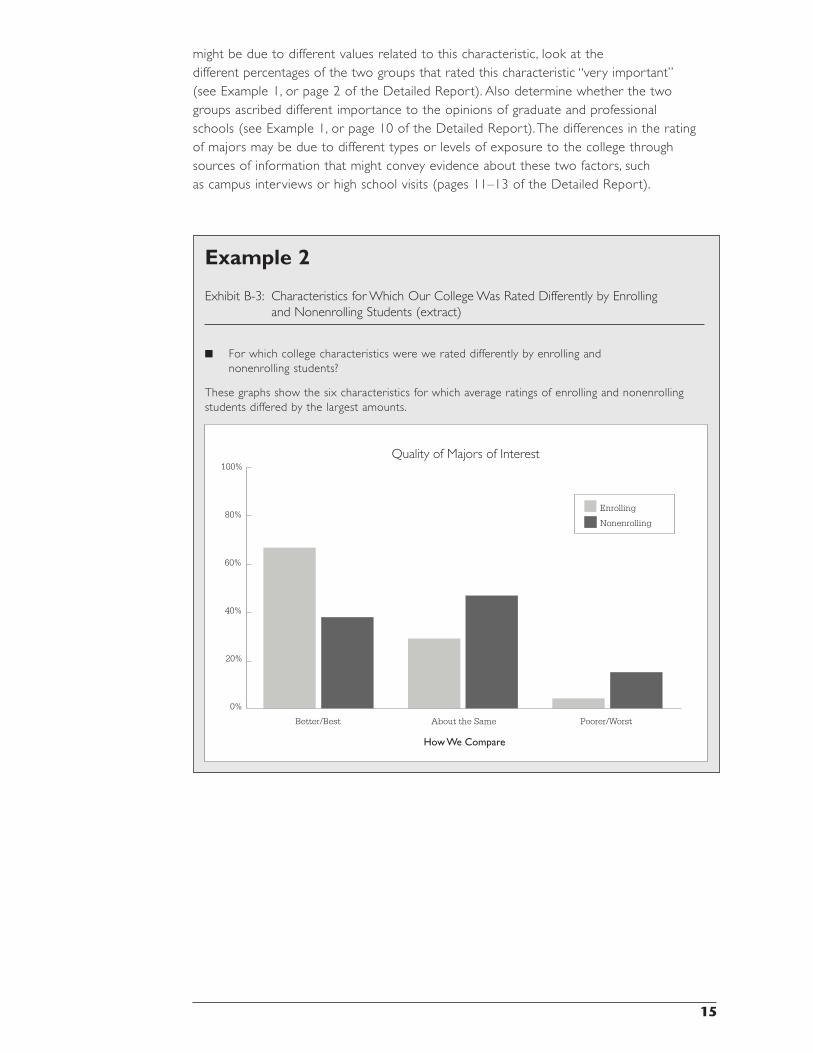
might be due to different values related to this characteristic, look at the different percentages of the two groups that rated this characteristic “very important” (see Example 1, or page 2 of the Detailed Report). Also determine whether the two groups ascribed different importance to the opinions of graduate and professional schools (see Example 1, or page 10 of the Detailed Report). The differences in the rating of majors may be due to different types or levels of exposure to the college through sources of information that might convey evidence about these two factors, such as campus interviews or high school visits (pages 11–13 of the Detailed Report).
Example 2
Exhibit B-3: Characteristics for Which Our College Was Rated Differently by Enrolling and Nonenrolling Students (extract)
■ For which college characteristics were we rated differently by enrolling and nonenrolling students?
These graphs show the six characteristics for which average ratings of enrolling and nonenrolling students differed by the largest amounts.
15
0.0
0.2
0.4
0.6
0.8
Quality of Majors of Interest100%
80%
60%
40%
20%
0%
Enrolling
Nonenrolling
Better/Best
How We Compare
About the Same Poorer/Worst

QUESTION 7. Which seems to have the greatest effect on yield—the salience of a particular college characteristic to a student or our performance in that area?
Marketing Implications
The challenge of attracting people who place a different value on a particular characteristic of a college is often greater than the challenge of creating a consistent perception of your institution. For example, students who want an “emphasis on undergraduate education” are probably looking for a different type of institution than students to whom this characteristic is not very important. It is probably more difficult to serve both types of students at the same institution than it is to demonstrate that you have a strong focus on undergraduate education (if, indeed, you do).
Analytical Steps
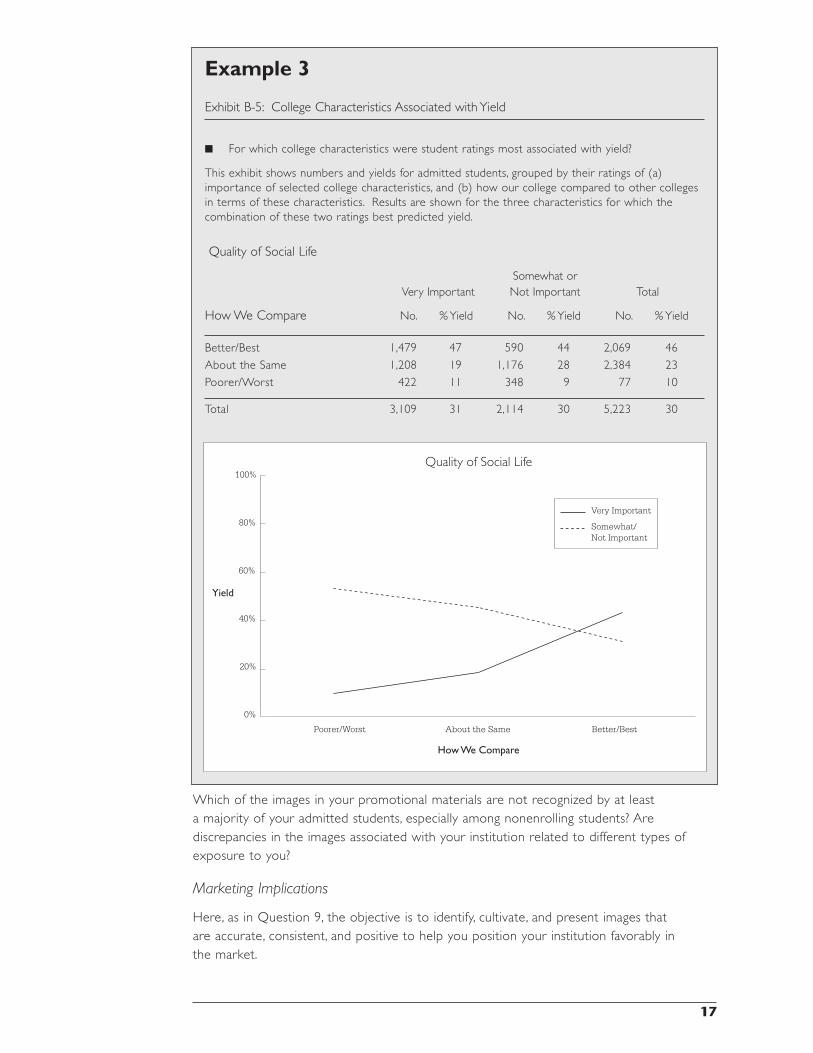
An estimate of these two effects can be obtained by looking at Exhibit B-5 in the Highlights Report. The graph displays the effect on yield of different quality ratings for two groups of students—those who rated the characteristic “very important” and those who rated it “somewhat important” or “not important.” If the two lines move in the same direction, have a substantial slant to them, and are close together, the greatest effect on yield comes from ratings of your performance. If the lines diverge, the yield is affected by the importance of the characteristic to the students. More precise estimates of these two sources of effects on yield can be obtained by subtracting the total yields in the columns from each other and comparing the results to the differences between the total yields for the rows.
In Example 3, both the importance of quality of social life to the students and their rating of this characteristic have an effect on yield, but the effect of the rating is greater. The difference across the importance ratings is just 1 percentage point (the total for “somewhat important” subtracted from the total for “very important” [31 percent – 30 percent = 1 percent]). The difference between “better/best” and “about the same” (the first two rows) is 23 percent [46 percent – 23 percent] and is 36 percentage points [46 percent – 10 percent] between the first and third rows. (If one of the rows or columns has a small number of people in it, you should avoid calculations using that row; be especially cautious of the numbers in the third row [the “poorer/worst” rating], which are often based on small numbers of students. In the Highlights Report, percentages based on fewer than 25 weighted cases are enclosed in square brackets— [ ].)
Images
QUESTION 8. Which images of our college that are held by a sizable number of students (for example, 20 percent or more) are at variance with those we believe to be accurate?
16 ASQ User Guide
Example 3
Exhibit B-5: College Characteristics Associated with Yield
■ For which college characteristics were student ratings most associated with yield?
This exhibit shows numbers and yields for admitted students, grouped by their ratings of (a) importance of selected college characteristics, and (b) how our college compared to other colleges in terms of these characteristics. Results are shown for the three characteristics for which the combination of these two ratings best predicted yield.
Quality of Social Life
Somewhat or Very Important Not Important Total
How We Compare No. % Yield No. % Yield No. % Yield
Better/Best 1,479 47 590 44 2,069 46
About the Same 1,208 19 1,176 28 2,384 23
Poorer/Worst 422 11 348 9 77 10
Total 3,109 31 2,114 30 5,223 30
Which of the images in your promotional materials are not recognized by at least a majority of your admitted students, especially among nonenrolling students? Are discrepancies in the images associated with your institution related to different types of exposure to you?
Marketing Implications
Here, as in Question 9, the objective is to identify, cultivate, and present images that are accurate, consistent, and positive to help you position your institution favorably in the market.
17
Quality of Social Life100%
80%
60%
40%
20%
0%
Poorer/Worst
How We Compare
Yield
About the Same Better/Best0.0
0.2
0.4
0.6
0.8Very Important
Somewhat/Not Important
Analytical Steps
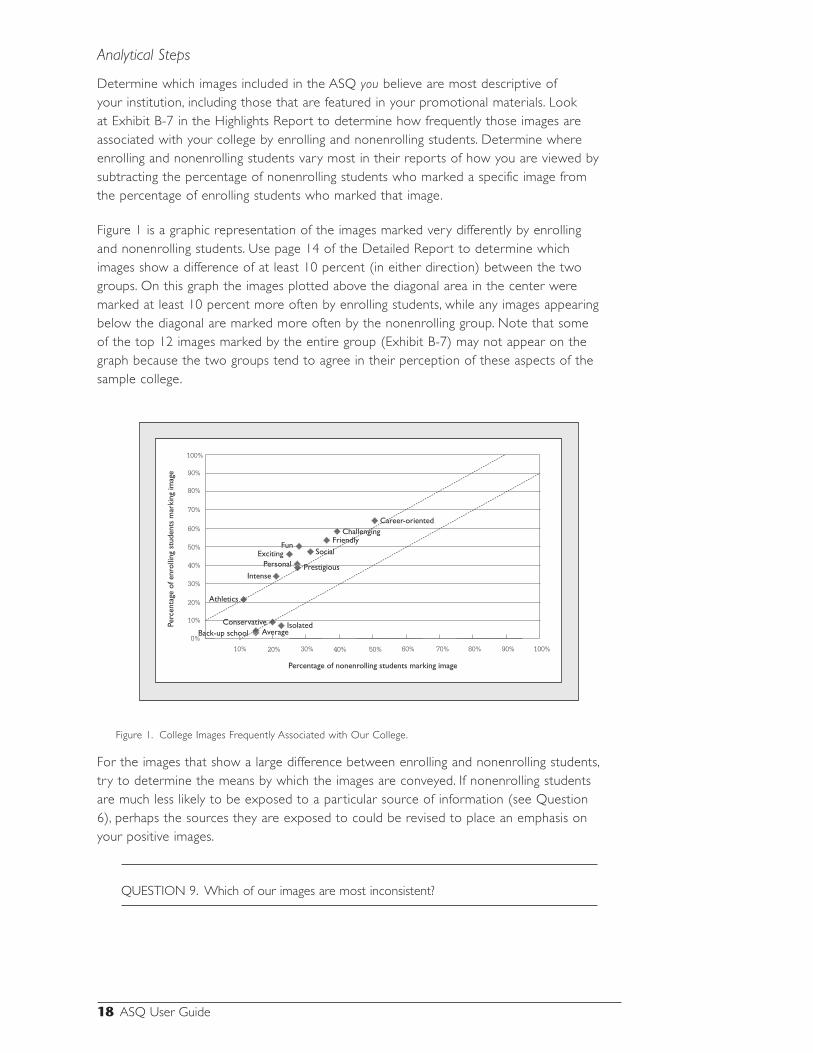
Determine which images included in the ASQ you believe are most descriptive of your institution, including those that are featured in your promotional materials. Look at Exhibit B-7 in the Highlights Report to determine how frequently those images are associated with your college by enrolling and nonenrolling students. Determine where enrolling and nonenrolling students vary most in their reports of how you are viewed by subtracting the percentage of nonenrolling students who marked a specific image from the percentage of enrolling students who marked that image.
Figure 1 is a graphic representation of the images marked very differently by enrolling and nonenrolling students. Use page 14 of the Detailed Report to determine which images show a difference of at least 10 percent (in either direction) between the two groups. On this graph the images plotted above the diagonal area in the center were marked at least 10 percent more often by enrolling students, while any images appearing below the diagonal are marked more often by the nonenrolling group. Note that some of the top 12 images marked by the entire group (Exhibit B-7) may not appear on the graph because the two groups tend to agree in their perception of these aspects of the sample college.
Percentage of nonenrolling students marking image
Perc
enta
ge o
f enr
ollin
g st
uden
ts m
arki
ng im
age
10%
10%
0%
20%
30%
40%
50%
60%
70%
80%
90%
100%
20% 30% 40% 50% 60% 70% 80% 90% 100%
Career-orientedChallenging
Friendly
Personal
FunExciting
Intense
IsolatedAverageBack-up school
Prestigious
Social
Athletics
Conservative
Figure 1. College Images Frequently Associated with Our College.
For the images that show a large difference between enrolling and nonenrolling students, try to determine the means by which the images are conveyed. If nonenrolling students are much less likely to be exposed to a particular source of information (see Question 6), perhaps the sources they are exposed to could be revised to place an emphasis on your positive images.
QUESTION 9. Which of our images are most inconsistent?
18 ASQ User Guide
Analytical Steps
Look for images in the Detailed Report (page 14) that are marked by 40 to 60 percent of the students; the students who do not mark these images view you differently. Look for images that are conceptually opposite (for example, “conservative” versus “liberal,” or “personal” versus “impersonal”) and determine whether sizable numbers of students mark each of the contrasting images. Review what you say in your publications or other media, interviews, tours, and talks to see if you are providing consistent information. You may also want to conduct some interviews with your current students to get a better idea of what these terms mean to students and what indicators they use to determine whether a particular image applies to a given institution.
Influential People
QUESTION 10. How do students think our institution is rated by the people and institutions whose opinions they especially value?
Marketing Implications
These are similar to the implications noted for data on student ratings of the importance of institutional characteristics and the ways in which they rate your institution in comparison with the competition.
Analytical Steps
Follow the steps discussed in Questions 1 through 7 for the analysis of college characteristics. Determine whose opinions are most important to matriculants and nonmatriculants, look for sources of variation in ratings, and so forth. You may also want to do some additional research (for example, a set of formal interviews or informal conversations) with some of these “influential people” directly to confirm that students are correctly reporting how you are viewed by these people. The use of alumni, parents, and other existing contacts as informants can help refine these data, but this information may not provide definitive answers.
Sources of Information
QUESTION 11. Which of our highly rated sources of information are not given enough exposure to students?
Marketing Implications
An important goal should be to expose as many prospective students as possible to the sources of information that are rated highly by students, especially those that are associated with high yields.
19
Analytical Steps
Use Exhibit C-2 in the Highlights Report to identify those sources of information for which students give you high ratings, and use Exhibit C-1 to identify those for which exposure is associated with a high yield. Then, from Exhibit C-1, determine if any of these sources of information have a low incidence of usage. Be careful in assessing causality in this type of analysis. Exposure to a given source of information may not produce a higher yield per se, but may reflect a predisposition to enroll. For example, students who are already strongly interested in your college are probably more likely than others to visit your campus.
QUESTION 12. Which of our sources of information are rated low by all admitted students? On which sources do enrolling students rate us significantly higher?
Marketing Implications
Since sources of information that are highly rated by prospective students should produce superior marketing results, it is important to identify those that need to be reviewed for improvement.
Analytical Steps
Use Exhibit C-2 in the Highlights Report to determine which sources of information receive low ratings from all admitted students. Those rated “better/best” by less than 60 percent would likely benefit from review and improvement. Remember that some sources of information are less subject to dramatic improvement than others. For example, financial aid communications are frequently the lowest rated sources of information because the aid process has become so complex and college costs are often worrisome, even with financial aid. (Examination of the Norms Report will give you the context in which to place the observed percentages from your survey.)
Use Exhibit C-3 to determine which information sources have the largest differences in mean ratings for enrolling and nonenrolling students. These sources should be examined, especially if a high yield rate for a source rated “better/best” indicates that exposure to that source did have some influence on the students. A low yield rate for a source rated “poorer/worst” may support the above interpretation if it is rated this way by a relatively large percentage, such as 10 percent or more, of the total group.
The ASQ data file provides information about the kinds of students that are least likely to have exposure to your highly rated and effective media. In addition, you might want to determine whether exposure to, or rating of, specific sources of information affects the rating of related college characteristics. For example, does contact with faculty produce a higher rating on “quality of faculty,” “access to faculty,” or “concentration on undergraduate education”?
The CompetitionExhibits D-1 through D-3 and the Appendix of the ASQ Highlights Report provide information about competitors in the student markets you want to serve. This
20 ASQ User Guide
information can be particularly helpful in strategic planning for the future and in the evaluation of your current recruiting objectives.
QUESTION 13. How does our admission overlap compare with the application overlap for our principal competitors?
Marketing Implications
Some institutions make more waves in your applicant pool than others. You may have large numbers of applicants in common with an institution, but your relatively greater selectivity makes you a lesser competitor for admitted students. Expansion of your market share with such an institution would probably come easily if you admitted more students from this overlap pool. On the other hand, such a disparity between common applicants and admitted students may be due to your competitor’s greater selectivity. In this case, your competitor can pose a threat to you if it begins to admit a greater proportion of your common applicants.
You may wish to position yourself differently or focus on your relative positioning at different points in the college-selection process for different types of competitors. If you share a large number of applicants with another institution, but few common admits because of its greater selectivity, you may want to focus your positioning efforts on the early stages of the recruitment process, when visibility is achieved and interest aroused. Institutions with which you share many common admits present a more challenging problem because they are competitive threats at every stage of the college-selection process.
Analytical Steps
First, take time to understand the information presented in Exhibit D-3 (Win-Loss Analysis). For each of the 12 schools with the greatest number of cross-admits, this exhibit displays the percentage enrolling at your college, the percentage enrolling at the given college, and the percentage enrolling at some unspecified other institution. The “Win Percent” is calculated from the number of students choosing to attend either your college or the given college and represents the percentage of those students who are enrolling at your institution. Say, for example, that 200 of your students were cross-admitted with College A. Fifty students plan to enroll at your college, 50 at College A, and the other 100 somewhere else. Your win percentage versus College A would be 50 percent because you have won 50 percent of the 100 students who chose between your college and College A.
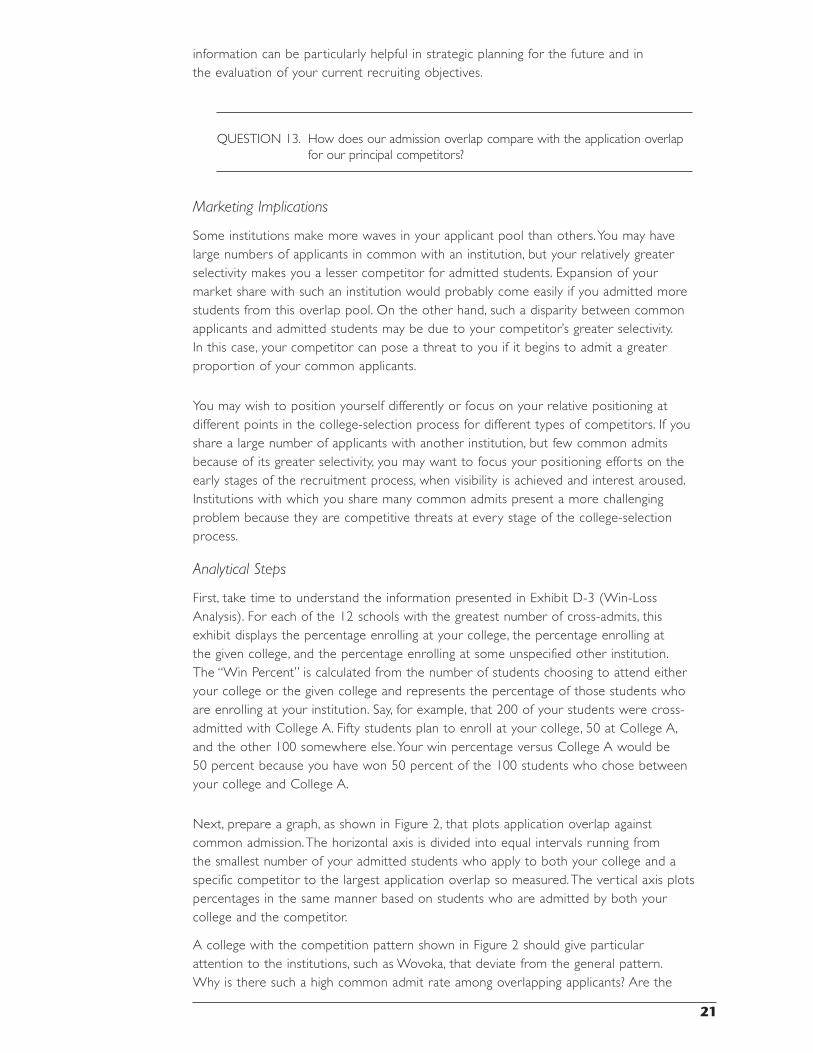
Next, prepare a graph, as shown in Figure 2, that plots application overlap against common admission. The horizontal axis is divided into equal intervals running from the smallest number of your admitted students who apply to both your college and a specific competitor to the largest application overlap so measured. The vertical axis plots percentages in the same manner based on students who are admitted by both your college and the competitor.
A college with the competition pattern shown in Figure 2 should give particular attention to the institutions, such as Wovoka, that deviate from the general pattern. Why is there such a high common admit rate among overlapping applicants? Are the
21
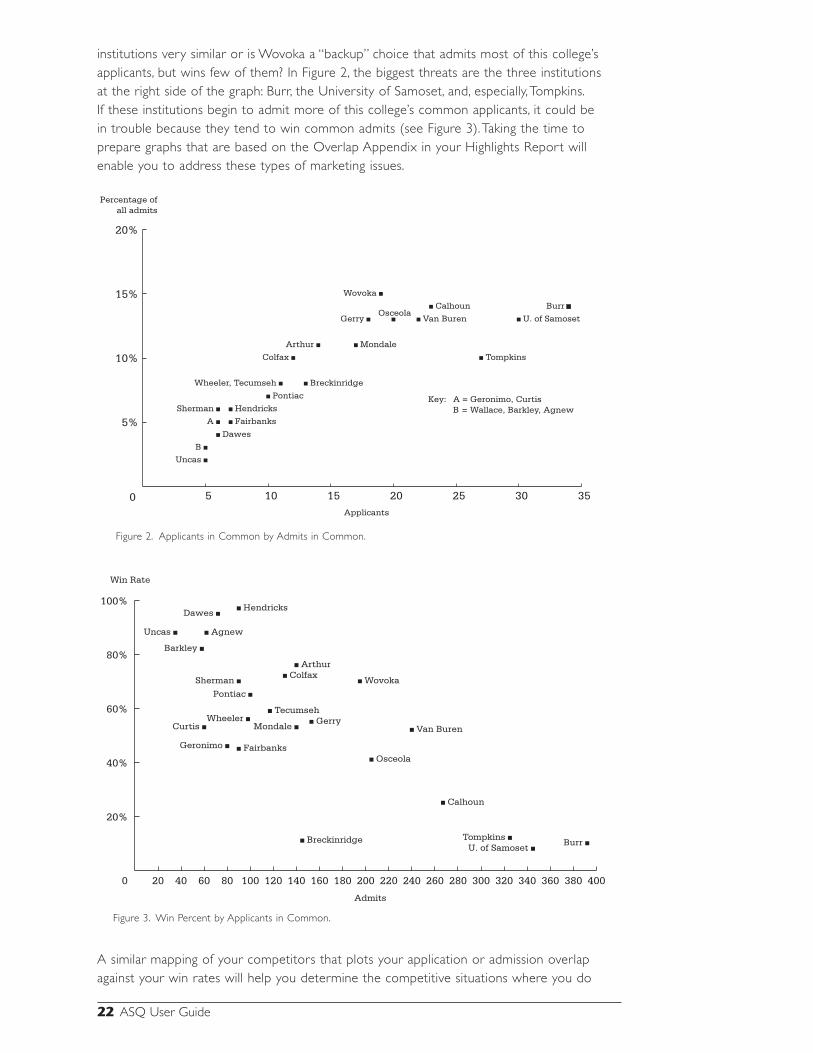
institutions very similar or is Wovoka a “backup” choice that admits most of this college’s applicants, but wins few of them? In Figure 2, the biggest threats are the three institutions at the right side of the graph: Burr, the University of Samoset, and, especially, Tompkins. If these institutions begin to admit more of this college’s common applicants, it could be in trouble because they tend to win common admits (see Figure 3). Taking the time to prepare graphs that are based on the Overlap Appendix in your Highlights Report will enable you to address these types of marketing issues.
5 10 15 20 25 30 35
5%
10%
15%
20%
Applicants
Percentage ofall admits
Figure 2 APPLICANTS IN COMMON BY ADMITS IN COMMON
Calhoun
Wovoka
Gerry
Arthur
Colfax
Pontiac
Hendricks
Fairbanks
Sherman
A
B
Uncas
Dawes
Osceola
Mondale
BreckinridgeWheeler, Tecumseh
Van Buren
Tompkins
Burr
U. of Samoset
0
Key: A = Geronimo, CurtisB = Wallace, Barkley, Agnew
Figure 2. Applicants in Common by Admits in Common.
20 40 60 80 100 120 140 160 180 200 220 240 260 280 300 320 340 360 380 400
20%
40%
60%
80%
100%
0
Wovoka
Van Buren
Osceola
Gerry
Fairbanks
Tecumseh
Colfax Arthur
Hendricks
Agnew
Calhoun
Burr U. of Samoset
Tompkins
Mondale
Geronimo
Curtis Wheeler
Pontiac
Sherman
Dawes
Uncas
Barkley
Breckinridge
Admits
Figure 3 WIN PERCENT BY APPLICANTS IN COMMON
Win Rate
Figure 3. Win Percent by Applicants in Common.
A similar mapping of your competitors that plots your application or admission overlap against your win rates will help you determine the competitive situations where you do
22 ASQ User Guide
especially well or poorly. You can try to increase the competitive relationships where the former phenomenon occurs and reduce the incidence of the latter by expanding your recruiting efforts in markets presently served by institutions against which you do especially well. You can also work on improving the conditions that give you a disadvantage against other competitors.
The Completeness of Overlap DataThe fact that not all of your admitted students completed the ASQ Questionnaire may affect the reports dealing with your competition overlap. The students who do not respond may be disproportionately the applicants you share with specific institutions. Some of your responding admitted students also may have applied to more institutions than the six provided for in the ASQ. An inquiry conducted in association with the development of the original ASQ with seven institutions that shared substantial overlap in applications indicated that underrepresentation of a given competitor is most likely to occur for highly selective institutions whose applicants apply to large numbers of colleges. The underrepresented applications, however, were likely to be backup choices to the highly selected choices, that is, colleges against which an institution had a high win rate. On the reports of the less selective institutions, the more selective competitors were likely to be more completely represented. Thus, for both highly selective and less selective institutions, the principal competition is likely to be captured in an ASQ survey.
Financial Aid
QUESTION 14. Are we achieving the goals we established for our financial aid awards?
Marketing Implications
Due to the increasing importance of college costs in determining where students choose to apply for admission and, ultimately, where they decide to enroll, it is crucial to know whether your financial aid resources for need-based awards will keep you competitive for students who qualify for such aid.
In addition, if your institution is offering no-need awards to increase yields for students having superior academic records or other particularly valued attributes, you need to know whether these awards are achieving their objectives. Exhibit E-1 of the Highlights Report, along with your knowledge of the goals you had for no-need awards (if such awards are part of your marketing plan) will enable you to get a sense of whether you are meeting those goals. If your institution does not offer no-need awards, but some percentage of the students indicated that they received these awards, you may want to review the need-based award letter that is sent to students. Is it so congratulatory and flattering that some students are led to believe that they did receive an “academic” award? Another possibility is that some state or federal grants that are provided through your institution may be interpreted by the students as college-based, no-need awards. Again, better explanatory materials might help to avoid some of this confusion.
23

Analytical Steps
Exhibit E-1 of the Highlights Report and the Cost/Aid section of the Detailed Report are designed to help you answer the above questions. However, you will need to compare the ASQ data with the plans and enrollment estimates you made for need-based students to judge whether you have met your goals. The yields reported in the tables must also be interpreted in light of whether you were able to meet all or only a portion of the students’ demonstrated need. The exhibit from the Highlights Report provides valuable insights on your competitiveness for students seeking need-based aid.
Examine the first part of Exhibit E-1, which shows the percentages of enrolling and nonenrolling students applying for and awarded financial aid at your college. Does it show differences between the two groups? How does the yield for aid applicants compare to the overall yield? How does the yield for students awarded aid compare to the overall yield? You might expect that students to whom you have offered financial aid would be more likely to enroll than those to whom no aid was offered. (Remember that the yield percentage for any given response, e.g., those awarded aid by your college, is most useful when compared to the overall yield percentage.) The Cost/Aid section of the Detailed Report can be used to calculate yield rates for students who were, or were not, offered financial aid by some other college.
The second part of Exhibit E-1 examines yield patterns for different combinations of financial aid awards for students who were admitted to at least one other college. The first panel considers overall aid status; you might expect to find the yield highest for students who were only awarded aid by your college and lowest for students who were only awarded aid by some other college. Look at the second panel of this table to determine the magnitude of the effect that no-need aid awards, by your institution or another, had on yield.
24 ASQ User Guide
How to Use the ASQ Data File
IntroductionThe ASQ Highlights and Detailed Reports contain extensive analyses of your Admitted Student Questionnaire data, but you may have additional questions that can be addressed through your own analyses of the data, such as:
■ Differences among types of students in the importance they ascribe to specific college characteristics and in their perceptions of your institution
■ How students’ views of your institution are related to the types of information to which they were exposed
■ Your competitive environment and your specific competitors for different types of students
■ Factors related to students’ decisions to attend or not to attend your institution
Files Supplied on CD-ROMA data file on CD-ROM is an optional feature of ASQ. Users who order a CD using the final transmittal form that is submitted with questionnaires for processing will receive the data file and all supporting documentation with their ASQ reports. A data file (from the current or any previous year) may also be ordered at any other time by requesting a Supplemental Order Form.
25
chapter 4
A college’s data file contains all the ASQ responses for your surveys, with student identification numbers (if used), additional geographic data (Enrollment Planning Service state and market codes), and case weights used to adjust for differential response rates for enrolling and nonenrolling students. Responses to your locally developed optional questions are also included. The data file is in text format, where each record is 264 bytes in length. The contents of the data file are fully described in a record layout and code book (see Appendix A).
In addition to your data, the CD includes:
■ A file of SPSS commands that can be used with the SPSS statistical analysis package to define and read in variables for analysis, to define labels for these variables and for their coded values, and to set up case weights
■ A file containing a list of names and four-digit College Board codes for all colleges represented in the data file (other colleges to which your admitted students applied)
■ A file containing a list of names for the 304 markets defined by the Enrollment Planning Service (EPS®); this file and the previous one can be used with the SPSS or SAS file definition commands as labels for the College Board codes or EPS state and market codes
■ A file containing supplementary SPSS commands to perform selected analyses of your ASQ data; some of these analyses are described in the SPSS examples
Linking to Other FilesStudent identifiers used by colleges on their questionnaires are also present in the ASQ data file (see the field named ID in columns 248–257). This makes it possible to link the ASQ data file with any other admission or student record files that use the same identifiers to expand your research possibilities. For example, students’ ASQ responses could be examined in relation to admission ratings, legacy status, intended major, specific financial aid data, or subsequent satisfaction ratings that are present on the linked file.
Alternatives for Conducting Data AnalysesAs noted earlier, an extensive set of SPSS commands that can be used for data definition and labeling is provided with the ASQ data file. By adding a relatively small number of procedure statements and any associated data-transformation statements—such as those provided in the supplementary SPSS file—to this set of commands, SPSS users can carry out many analyses, some of which can be extensive and complex. Examples of SPSS transformation and procedure commands needed to carry out specific types of data analyses are given in the SPSS Examples section of this guide.
The SPSS language is used in this guide and in the program segments supplied because we have found that SPSS is the package most often used by those responsible for local analyses of ASQ data and because it is available on many campuses. The ASQ data file can also be used with other statistical packages (SAS, for example), but users of another package will need to create their own file-definition statements. In some cases, the needed statements will closely parallel the SPSS statements and can be created by editing the files contained on the CD.
26 ASQ User Guide
Although it is assumed that users will almost always use some form of statistical program, other approaches to the analysis of ASQ data are possible. For example:
■ Programs can be written in a general purpose computer language to analyze ASQ data . Writing programs in these languages is more labor intensive than using a statistical package, so these programs would be used only in instances when specific kinds of data manipulations or analyses cannot be obtained by other means .
■ Database management programs (such as Microsoft Access) can be used to develop counts of response frequencies for specific questions by specific types of students . These programs are generally limited in the kinds of analyses they support, and they are more cumbersome to use than statistical packages for extensive sets of tabulations . A database manager, however, might be useful for finding answers to a limited set of specific inquiries . (See Appendix A for suggestions and examples .)
Your data can also be ordered in Microsoft Excel format. Alternatively, if you have taken advantage of the SPSS syntax files supplied with your ASQ CD to read the text data file, the resulting SPSS data can be saved as an Excel file. Note that saving SPSS data into an Excel file may require further format changes (e.g., removing commas from fields such as zip code, or replacing nulls with blanks). In addition, the number of variables that can be saved is limited to 255 in versions of Excel earlier than 2007. While Excel is limited in its ability to analyze data in the ways described in this User Guide, its data management capabilities can be exploited, particularly in importing data into databases such as MS Access.
If your survey includes local questions, each question will appear in a separate column in the worksheet.
Using Case Weights in AnalysisIn order for analyses to produce results that are comparable to those included in the standard ASQ report, data must be multipled by the weighting factor (the variable named CASEWT) that is included on the file. The WEIGHT BY CASEWT line found toward the end of the SPSS file definition program specifies that all SPSS procedures that follow it use weighted cases for analysis. When the WEIGHT BY CASEWT command has been given in a program, the weighting remains in effect for all subsequent commands.
The weighting procedure used for ASQ data is described in the introductions to the ASQ Highlights and Detailed Reports. Weights are used to adjust for differential response rates for enrolling and nonenrolling students. Vir tually all colleges get a higher response from enrolling than from nonenrolling students. If weighting were not used, certain estimates could be seriously affected. For example, if yields were calculated simply as ratios of enrolling ASQ respondents to all ASQ respondents without the use of case weights, estimated yields would be inflated because enrolling students are more likely than other students to complete and return the questionnaires.
Since using separate enrolling and nonenrolling case weights entails multiplying responses in each group by a constant, the within-group percentages displayed, i.e., based on enrolling or nonenrolling students only, are not affected by the case weight. Use of case weights only affects the value of percentages displayed for all admitted students.
27
Where Can I Find...?
■ The college a nonenrolling student will attend. On the nonenrolling form of the questionnaire (which is also used by colleges sending the same form to all admitted students), question 67 asks the respondents:
Do you plan to enroll in college within the next 12 months?
1 Yes 2 No
If yes, please indicate the name of the college you plan to attend .
The answer to the second part of Question 67 (labeled Q67C in the SPSS program and located in columns 96–99 in the data file) indicates where your nonenrolling respondents plan to attend .
The name of your institution will never appear in this field . If the student plans to attend your school, his or her enrollment status is automatically set equal to 1 (Enrolling) and the name of your institution is removed from Q67C . For enrolling students, Q67C simply represents another school to which they applied .
■ My locally developed questions. The basic SPSS file definition program includes a field called QLOCAL in columns 192–231 . The responses to your local questions have been keyed in this area . The documentation that you receive along with your CD includes a “Supplementary Record Layout,” which describes the position and format of each of your local questions . In most cases the syntax file you receive will include specific information (location, labels, etc .) relating to your local questions .
■ My college's ID number. The field called ID, located in columns 248–257, contains up to 10 bytes of identification information . The supplied SPSS program defines this field as alphanumeric . IDs used for access to the Web survey are also stored in this field .
■ Whether the respondent is an enrolling student. The field called STATUS contains a 1 for enrolling students and a 2 for nonenrolling students . If you mailed the same form of the questionnaire to all admitted students, the STATUS information is derived from the response to Q67C . That is, a student who writes the name of your college in response to Q67C will be assigned a 1 in the status field . A student who writes in the name of another college or who leaves Q67C blank will be assigned a 2 . In the case of a respondent who has left Q67C blank, his or her status can be verified against your records prior to processing when an ID number has been included on your questionnaires .
■ Whether the respondent completed the survey on the Web. The data file includes a five-digit sequence number field called AERID (columns 243–247) . The AERID for a Web survey will begin with a 4 .
Using the ASQAnalyst Software ProgramYou may choose to order the ASQAnalyst program along with your data. This Windows-based program gives you access to your data without having to go through a statistical package such as SPSS. ASQAnalyst allows you to:
28 ASQ User Guide
■ Reproduce most of the tables in your Highlights and Detailed Reports
■ Cut and paste tables into other applications
■ Segment your admitted students into subgroups based on any of the demographic questions in the survey
■ View your college’s data side by side with data from the most recent Norms Report
■ Request cross tabulations of selected pairs of questions in the survey
The ASQAnalyst program has the following limitations:
■ Local questions are not included in the analyses
■ The program does not reproduce the graphical displays from the Highlights Report
Using Windows Explorer to display the contents of the ASQ CD in any CD-ROM drive, double-click on the InstallASQAnalyst application. (Alternatively, RUN the application from the Windows Start menu.) The self-extracting program creates an ASQAnalyst directory and copies all of the files from the Data subdirectory of the CD into a new Data subdirectory of ASQAnalyst. Thus the Data subdirectory will contain the ASQ data file and the SPSS command files, although the latter are not used by the Analyst program.
During the installation of the program you will be asked whether you would like instructions to be displayed at the conclusion of the installation. If you answer “yes,” the instructions will appear in a Notepad window, which can then be printed. A hard copy of the instructions ("Getting Star ted With the ASQAnalyst") is also included in the box containing your reports.
At the conclusion of the installation program, an ASQAnalyst icon is placed on your desktop. Double clicking on this icon puts you into the program, where you can choose the year’s data you would like to analyze. Although the program analyzes data from any ASQ year, for data files ordered in years prior to 2000 you must rename the old xxxx-ASQ.DTA file (where xxxx is your four-digit College Board code) to xxxx_yy.DTA (where yy is the year in question) and copy it into the Data subdirectory of the ASQAnalyst directory.
When you are in the ASQAnalyst program, click on the blue “S” button (or choose “Standard report format” from the Report menu) to reproduce the tabular displays found in the ASQ Highlights and Detailed Reports. These reports can be copied into other Windows applications, such as MS Word. The information can be displayed for subsets of your admitted students, such as males or Enrollment Planning Service (EPS) market, by clicking on “Select.” Subgroups can be formed from any of the demographic questions on the survey, or on the basis of specific colleges or groups of colleges to which your respondents were also admitted. Remember to return to the Select menu to reset the selection criterion to the entire group.
Clicking on the blue “N” (or selecting “Norms report format” from the Report menu) will give you displays of your college ratings side by side with ratings of all ASQ participants in the Norms report. To limit the comparison to institutions similar to yours (e.g., Public/Doctoral Institutions), make a selection from the Group drop-down list at the top of any of the Norms displays.
29

The Overlap Report (the blue “O”) provides you with more information than the ASQ Highlights Report does. The displays include 20 colleges—the Highlights Report only shows 12. The breakdown of the students’ cross-admit colleges according to Carnegie classification is located here also.
You can go beyond the Highlights and Detailed reports by using the Analyze menu. The “Cross-Tabs” selection displays the results from one variable on the questionnaire across each of the categories of selected other variables. The first cross-tabs panel asks you to select a row variable and a column variable to be displayed. Click on the plus sign (+) next to one of the sets of survey questions to select the particular item you wish to analyze (e.g., importance of “cost to your family” vs. “how we compare” on the same factor).
When you select the variables to be analyzed, click on “Run” to display a cross-tabulation where column percentages for all admitted students are the default values in the table. Use the “Display” drop-down list to select other table values for display; use the “Group” list to select enrolling or nonenrolling students only.
If you select “Examine Yields” from the Analyze menu, you will get a list of the characteristics, influential opinions, and cost and aid questions, with an indicator of the strength of the relationship between each question and admission yield. Clicking on one of the items produces a cross tabulation of the rating of the item (row variable) against its importance (column), where the cell values displayed are yield percentages. You can get yield displays by using the general cross-tabulation menu.
The “Browse Competitors” selection displays the same list of overlap institutions that is in the Appendix of the ASQ Highlights Report. The list is originally sorted in descending order of the number of cross-applications between your college and the given competitor, but it can also be sorted by cross-admits or students attending. See Question 13 of the previous chapter for an explanation of “Win Percent.”
Note: Using the ASQ Analyst program, you can export your ASQ data to Microsoft Excel or Access format files. Although such files are limited in terms of the data analysis that can be conducted on them without extensive programming, the availability of these options may be helpful in data management and in merging with other data files.
30 ASQ User Guide
How to Do Your Own AnalysesThis chapter presents suggestions for analyzing your ASQ data file to answer questions concerning differences among students, relationships among ASQ ratings, more in-depth perspectives on competition, and factors relating to enrollment choices.
Differences Among StudentsAn important use of the ASQ data file is to obtain frequency distributions and cross tabulations of responses to questions of interest for specific types of students. These fundamental questions are addressed in this type of analysis: (1) Do response frequencies for all students (as shown in the standard ASQ reports) accurately characterize specific subgroups of admitted students as well? For example, do your minority students have the same sets of college objectives and perceptions of you as students in the general population? (2) Do specific types of students, especially those whom you would particularly like to attract, differ from others in what is important to them or in how they view your college?
This section describes two ways to investigate differences among students:
1 . Define market segments (key subgroups) of interest and examine ASQ response frequencies for these subgroups
2 . Identify the sets of ratings or perceptions to be studied and examine the relationships of these to students’ background variables
Although these approaches differ in orientation (i.e., they have different star ting points), they lead to similar types of analyses in many cases.
31
chapter 5
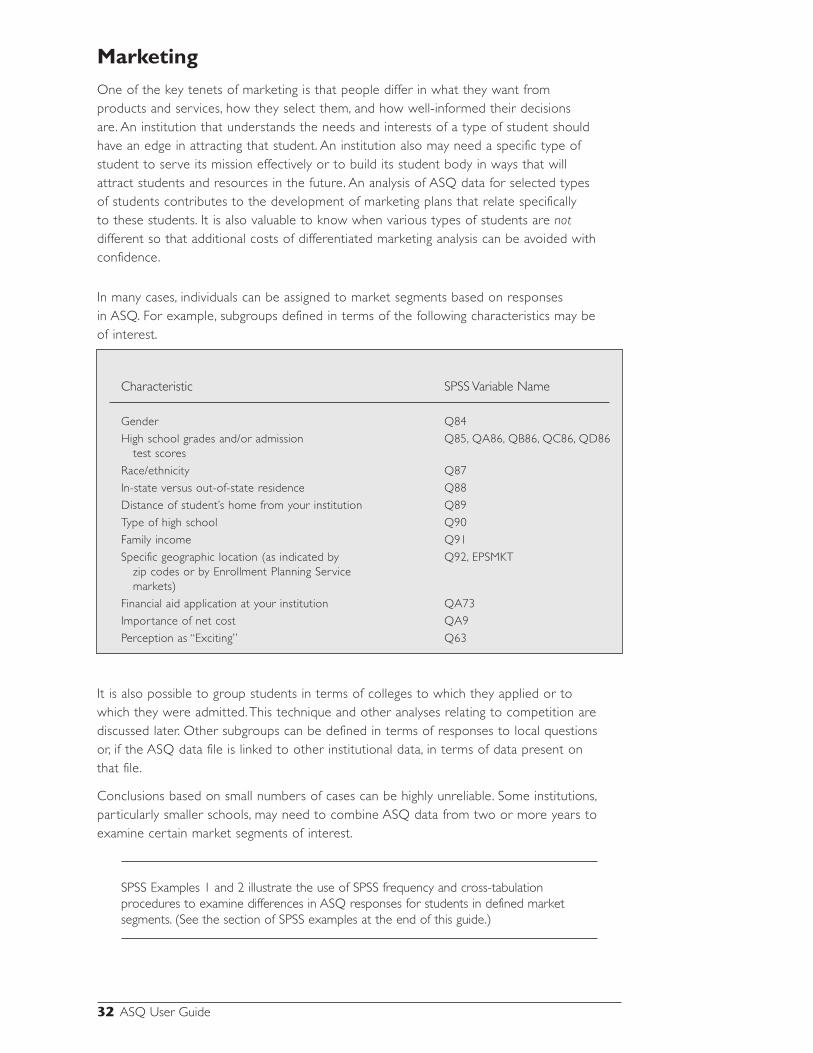
MarketingOne of the key tenets of marketing is that people differ in what they want from products and services, how they select them, and how well-informed their decisions are. An institution that understands the needs and interests of a type of student should have an edge in attracting that student. An institution also may need a specific type of student to serve its mission effectively or to build its student body in ways that will attract students and resources in the future. An analysis of ASQ data for selected types of students contributes to the development of marketing plans that relate specifically to these students. It is also valuable to know when various types of students are not different so that additional costs of differentiated marketing analysis can be avoided with confidence.
In many cases, individuals can be assigned to market segments based on responses in ASQ. For example, subgroups defined in terms of the following characteristics may be of interest.
Characteristic SPSS Variable Name
Gender Q84
High school grades and/or admission Q85, QA86, QB86, QC86, QD86 test scores
Race/ethnicity Q87
In-state versus out-of-state residence Q88
Distance of student’s home from your institution Q89
Type of high school Q90
Family income Q91
Specific geographic location (as indicated by Q92, EPSMKT zip codes or by Enrollment Planning Service markets)
Financial aid application at your institution QA73
Importance of net cost QA9
Perception as “Exciting” Q63
It is also possible to group students in terms of colleges to which they applied or to which they were admitted. This technique and other analyses relating to competition are discussed later. Other subgroups can be defined in terms of responses to local questions or, if the ASQ data file is linked to other institutional data, in terms of data present on that file.
Conclusions based on small numbers of cases can be highly unreliable. Some institutions, particularly smaller schools, may need to combine ASQ data from two or more years to examine certain market segments of interest.
SPSS Examples 1 and 2 illustrate the use of SPSS frequency and cross-tabulation procedures to examine differences in ASQ responses for students in defined market segments. (See the section of SPSS examples at the end of this guide.)
32 ASQ User Guide
Examining Relationships of Student Ratings to Background VariablesWe’ve just explained ways to develop information to serve defined market segments. Instead of approaching group differences in this way, you can examine how ASQ ratings—for example, student perceptions of college characteristics, use of information media, images, reported aid-application behavior, or ratings of costs and financial aid—relate to a variety of student background variables and personal characteristics.
The tables in the standard ASQ reports can provide insights into modal responses. What are your prevailing images? On what characteristics are you rated high or low? What are the most important characteristics to the majority of your admitted students? Differences among students, however, can be even more illuminating and productive of marketing initiatives than modal or average responses. As other institutions pursue the modal student, you may have a strong market composed of subgroups of students who tend to have distinct sets of values and perceptions.
The marketing power from these investigations comes from the following strategies:
■ Devising ways to exploit existing patterns. For example, if a type of student finds a particular college characteristic important and your institution is strong in that characteristic, determine how you can convey this information to these students as effectively as possible .
■ Finding ways to alter observed patterns. For example, if students who are potentially eligible for aid are not applying for financial aid as frequently as they should be, determine how they can be informed about aid and encouraged to apply for it .
Importance of an Institution’s Characteristics
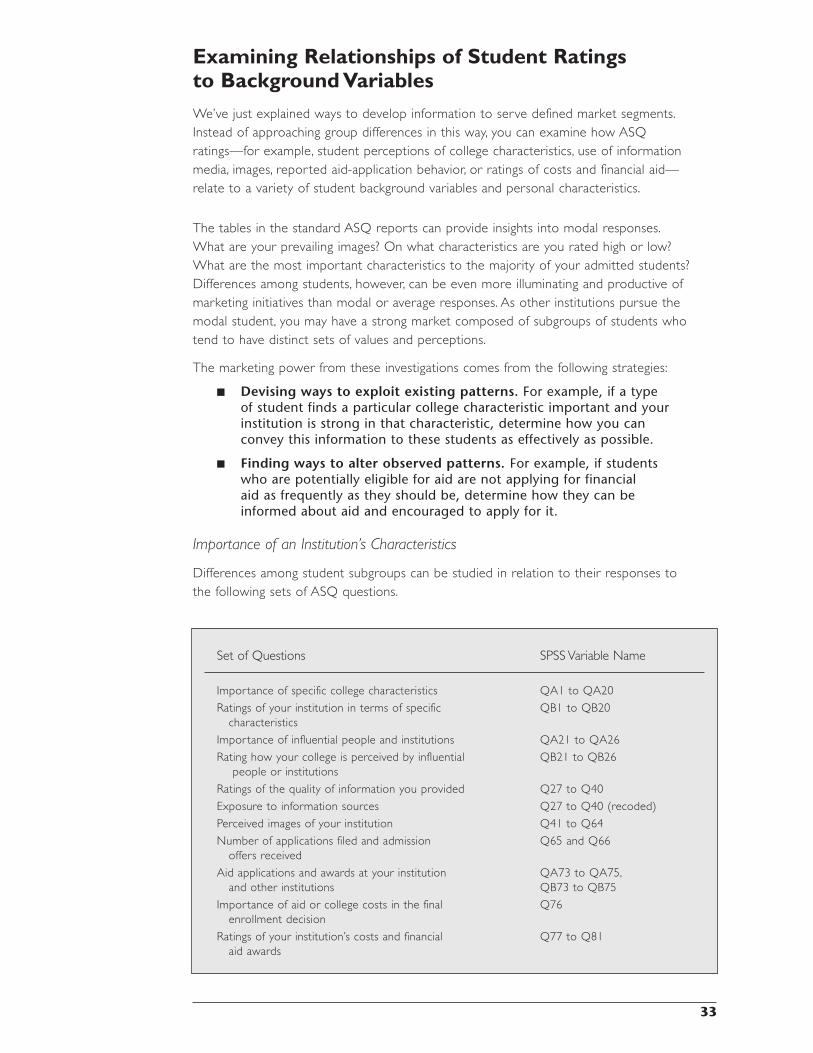
Differences among student subgroups can be studied in relation to their responses to the following sets of ASQ questions.
Set of Questions SPSS Variable Name
Importance of specific college characteristics QA1 to QA20
Ratings of your institution in terms of specific QB1 to QB20 characteristics
Importance of influential people and institutions QA21 to QA26
Rating how your college is perceived by influential QB21 to QB26 people or institutions
Ratings of the quality of information you provided Q27 to Q40
Exposure to information sources Q27 to Q40 (recoded)
Perceived images of your institution Q41 to Q64
Number of applications filed and admission Q65 and Q66 offers received
Aid applications and awards at your institution QA73 to QA75, and other institutions QB73 to QB75
Importance of aid or college costs in the final Q76 enrollment decision
Ratings of your institution’s costs and financial Q77 to Q81 aid awards
33
Frequency of Application to Certain Colleges
Another possibility not listed above is that of examining frequency of application and admission to specific colleges for defined subgroups of students. Analyses relating to other institutions are discussed in a later section.
As the lists of variables and student background factors indicate, an enormous number of breakdowns of student responses could be run. Some prior selection from among these possibilities is essential, particularly if you intend to investigate relationships through cross tabulations of ratings with background variables. Structure your approach by considering particular hypotheses or practical questions of interest. How might ASQ data provide insights into questions you have about the effectiveness of your communications? What kinds of findings would lead you to make changes in your admission program? In what areas and for what groups do you believe that differentiated marketing may be effective? These questions may help you structure your analysis:
■ What subgroups are expected to show differences in the importance they place on specific college characteristics and in their perceptions of your college? Males and females? High-achieving versus lower-achieving students?
■ Does the degree of influence of other people, such as parents, counselors, teachers, and friends, vary for certain groups of students? Minority and other students? Public and private school students?
■ Are some students more likely than others to be exposed to different types of information, such as campus visits and contact with current students or alumni? Does exposure to specific information sources vary with distance from your college or by specific geographic location? How do students who live in key geographic markets rate the quality of the information given at meetings, such as high school visits, college-sponsored gatherings, and contact with graduates?
■ For what groups are images of your school likely to differ? What stereotypes of your school can ASQ data assess?
■ What percentage of students from low-, middle-, and high-income families indicate that financial aid or college costs are significant factors in their final choice of college? How did these students rate your costs and financial aid awards in relation to those of other schools they considered?
Cross tabulations such as those in SPSS Examples 1 and 2 can be produced to compare responses of different types of students to ASQ items of interest. Running these cross tabulations, however, generates many pages of output and more numbers than can be easily interpreted.
SPSS Examples 3 and 4 illustrate the use of two more concise ways to study group differences and relationships in ASQ data: comparison of mean ratings for subgroups and computation of correlation coefficients.
34 ASQ User Guide
Relationships Between ASQ RatingsAs previously discussed, relationships of ASQ perceptual data to student background variables can provide useful information on the degree to which an institution is successfully attracting and communicating with different types of students. Relationships among selected ASQ ratings can also help assess why different students respond differently to an institution. Here are some examples of questions:
■ Are ratings of the characteristics of your institution related to student levels of exposure to certain types of information? For instance, do students who have visited the campus perceive you differently from nonvisitors in terms of nonacademic characteristics like access to off-campus activities or quality of social life?
■ Does exposure to a particular medium of information increase the probability that a student will associate a particular image with your college?
■ What relationship exists between student ratings of importance of college characteristics and ratings of how your institution compares to others on these characteristics? For which characteristics frequently judged as important do you receive low ratings? For which characteristics do you receive high ratings?
■ Are certain kinds of behavior reported in ASQ (such as the number of applications) related to student values or to views of your institution? What characteristics are very important to students who applied only to your institution? In what ways are these students different from others regarding the characteristics they value or how they view your college?
Using Cross Tabulations
The most direct way to address many of these questions is through cross tabulations of the relevant items.
SPSS Example 5 is an illustrative approach to analyzing the relationship of students’ perceptions of your institution to the kinds of information sources to which they were exposed. Example 6 examines the perceived quality of your institution’s characteristics relative to their perceived importance.
Perspectives on CompetitionThe ASQ collects information about specific other institutions to which students have applied and to which they were admitted. This information can provide new insights concerning your competitive position. Questions such as these may be addressed:
■ Do you have different competitors for different types of students?
■ Who are the main competitors in each of the major markets that you serve?
■ Do those admitted students who applied to one or more of your major competitors perceive you differently from other admitted students? How are you perceived by nonenrolling admitted students who are planning to attend one of those competitors?
■ Do your competitors behave differently toward different types of students?
35
Analytical Approaches
These questions can be addressed by means of two analytical approaches:
1 . Group students by characteristics of interest (e .g ., ability level, zip code, EPS market) and compute frequencies of application and admission to other colleges for these groups . (This is a way to develop answers to the first two questions listed above .)
2 . Group students according to the institutions where they applied (or were admitted) and compute response frequencies to ASQ items of interest, including student background information . (This is a way to answer the last two questions listed above .)
Since students can name up to six colleges where they applied, using data for other colleges is somewhat more complex than use of other ASQ data. Instead of tabulating or selecting responses recorded in a single field, it is generally necessary to filter the data so as to work with selected groups of colleges to which students applied.
SPSS Example 7 illustrates use of the SPSS TABLES procedure to compute frequencies of cross-applicants and cross-admissions with other colleges for different types of students. SPSS Example 8 describes a method for grouping students in terms of the colleges to which they have applied, to which they have been admitted, and at which they plan to enroll, so that these groups can be isolated for separate analyses of their responses to ASQ items.
Because so much of the data in ASQ is comparative, the ratings have more meaning when they are summarized for student groups that are more homogeneous than the total group in terms of the sets of competing institutions used in the comparisons. Therefore, it may be helpful to examine the ratings of students who are enrolling in specified other colleges or sets of colleges. You can also code each of your competitors by type, such as public, private-selective, or private-less-selective, and then look at your relative ratings by students whose application sets are dominated by one of these types—and who compare you to these kinds of institutions.
Factors Relating to Enrollment ChoiceThe ASQ Highlights Report presents a substantial amount of information concerning your yields among specific groups of students, however, it is not exhaustive. Use your data file to:
■ Extend the analysis of yield to all relevant subgroups of interest, including groups defined in terms of background characteristics and in terms of their ratings of your institution on specific dimensions
■ Identify the variables in the data set that are statistically most related to yield .
A direct way to compute yields is to cross tabulate enrollment status with the student descriptors of interest. A comparable approach that produces less output is to create an indicator variable (enrolling = 1, nonenrolling = 0) and to compute mean values of the indicator for subgroups of interest. Regression methods can also be used to assess how yields vary in relation to combinations of predictor variables. (See SPSS Example 9 for illustrations of each of these approaches.)
36 ASQ User Guide
How to Develop Statistical ModelsThis chapter explores more complex statistical methods that you can use to analyze students’ enrollment choices.
Statistical ModelsStatistical techniques that are more sophisticated and complex than those illustrated in the preceding chapters can also be employed in analyzing your ASQ data. These techniques can help you:
■ Develop simpler and more economical representations of student perceptions of your institution’s characteristics and images
■ Develop statistical models that account for student behavior, such as matriculation in your school or choice of specific other schools, in terms of background variables and/or perceptual data
Several possibilities are described below without detailed examples. You will need the advice of someone well versed in the appropriate research methods before proceeding with these kinds of investigations. The types of investigations included here are only suggestions; their suitability depends on your particular marketing issues and on the nature and quality of the data that you receive in your ASQ project.
Data SimplificationIt is useful to determine whether and how a set of ratings can be reduced to a smaller number of scales. The ratings of how your institution compares with others in terms of 20 college characteristics are good candidates for factor analysis. This procedure can assess whether these ratings can be represented by a small number of scales,
37
chapter 6
for example, a scale encompassing items relating to academic quality, a scale relating to undergraduate emphasis and access to faculty, a scale based on items dealing with social and recreational opportunities, etc. Another candidate for factor analysis is the set of 23 college images, even though the types of factor analysis most often used may not be entirely satisfactory because of the dichotomous (marked versus not marked) nature of the image ratings.
Assuming that the factors emerging from a factor analysis make conceptual sense, one can develop scales either through the use of factor scores or through the simple addition of sets of variables that have high loadings on a given factor. The use of a small set of relatively nonrelated scales may be particularly useful in modeling student choices because some of the other procedures described here (e.g., regression methods) do not always lead to stable results when a relatively large number of interrelated ratings are used as independent variables.
In SPSS, the FACTOR and RELIABILITY procedures are useful for conducting analyses relating to scales.
Developing Models of Choice BehaviorSeveral statistical methods can be used to model student choices in relation to personal characteristics and student values, attitudes, and perceptions. The statistical techniques often used for such modeling are regression and discriminant analysis. Another technique that has certain technical advantages over regression analysis in modeling choice behavior is logit analysis. This technique is used most often to assess the determinants of binary choices, such as enrollment versus nonenrollment, but it can be used in a more general form (multinomial logit analysis) to study choices from among a larger set of alternatives, such as among colleges of different kinds.
In SPSS, the REGRESSION, DISCRIMINANT, and LOGLINEAR procedures can be used to estimate different statistical models of student choice.
ConclusionsASQ survey ratings are from high school students who still have several years of education ahead of them that will alter their perspectives and values. Although these ratings provide valuable information about how these students view institutions and what influences their decisions about where to enroll, the ratings alone should not drive the management decisions of colleges and universities. Some very important characteristics may not differentiate institutions within your competitive set, but may differentiate this set of institutions from others to which your applicants do not tend to apply. The importance of some institutional characteristics for the educational development of students may not be reflected in these data because prospective students may not yet appreciate the role they can play. Effective marketing by educational institutions requires that the education of students during the recruitment process be a part of marketing concerns.
38 ASQ User Guide

The suggestions in this guide do not include all types of analyses to which ASQ data can be subjected; nor do they discuss other data systems within an institution that can be used to improve (alone or in combination with ASQ) the marketing of an institution. The ideas contained herein, however, should help you begin to market your institution effectively.
39

General NotesThe commands in this section conform to the conventions of SPSS version 12.0.1 for Windows. This User Guide is not intended to serve as an introduction to SPSS, and assumes basic knowledge of SPSS terminology and procedures. Consult your SPSS user guides for fur ther information.
This section gives you SPSS procedures that are applicable to the examples of additional analyses discussed here. Other types of analyses are possible. To facilitate these analyses, most of the SPSS procedures shown below, with the associated variable transformations, have been combined into a supplementary file on your CD. The complete set of commands applicable to the total data file is reproduced in Appendix C.
The commands as you would type them are shown in uppercase letters. Your SPSS for Windows program will accept either upper or lowercase commands, however. Similarly, most SPSS commands can be abbreviated to three or four letters.
Although each of the SPSS examples includes the WEIGHT BY CASEWT command, it is only necessary to execute this command once. All subsequent procedures executed during the same SPSS session will use weighted data. If your data file is saved as an SPSS file at the end of a session that has used weighted data, subsequent applications will also use weighted data.
The file of supplementary SPSS commands included on your CD contains more analyses than most people could use at one time. For example, a request for cross tabulations of all ratings variables in the ASQ against enrollment status for each category in the seven categorical demographic variables, which would allow you to analyze the admissions yield of each rating for your demographic subgroups, would produce 3,000 tables! Before you run any of these commands, carefully consider which analyses are most valuable to you.
41
SPSS examples

Example 1: Analyzing ASQ Responses of Gender Subgroups
The following SPSS commands produce frequency distributions of the responses of women (Q84 = 1) to all ASQ questions concerned with college characteristics, opinions of influential people and institutions, information sources, college images, and ratings of college costs and financial aid.
WEIGHT BY CASEWT .
TEMP .
SELECT IF (Q84 = 1) .
FREQUENCIES VARIABLES = QA1 TO Q64, Q77 TO Q81 .
The cross-tabulation procedure is often more efficient than the frequency procedure in analyzing response frequencies for subgroups. For example, the following commands produce tables of responses by women and men to the questions analyzed in the preceding example.
WEIGHT BY CASEWT .
CROSSTABS TABLES=QA1 TO Q64, Q77 TO Q81 BY Q84/CELL COUNT COLUMN .
There is no SELECT IF statement in this example. Instead of selecting women for analysis, the cross tabulations displays the frequencies for women and men in separate columns of the table. Since QA1 to Q64 and Q77 to Q81 are named before the word BY in the CROSSTABS command, the values of these variables are shown in the rows of the tables produced, while the values of Q84 (Female, Male) are shown in the columns. CELL COUNT COLUMN specifies that each cell of the table will display the number of cases in that combination of categories, along with percentages based on column totals, i.e., based on the values of Q84.
A chi-square test of the statistical significance of the differences in response percentages of men and women in each table can be requested in this example by adding the subcommand: /STATISTICS CHISQ. However, SPSS uses weighted numbers in computing test statistics and does not report correct significance levels in analyses with weighted data. Values of chi-square using weighted data may still be used as a convenient way to flag tables showing large group differences, even though the reported significance levels are incorrect.
Example 2: Segmenting by Geographic Markets
Identifying students by geographic markets often requires recoding. For example, a college wants to examine the following groups:
Code Description
1 Students living in zip codes starting with 999
2 All other in-state students
3 All out-of-state students
The following statements create a variable—MKTGRP—to be used for this subgrouping and then cross tabulate ASQ ratings relating to college characteristics against it.
RECODE Q88 (1=2) (2=3) INTO MKTGRP .
COMPUTE ZIP3=TRUNC(Q92/100) .
IF (ZIP3=999) MKTGRP=1 .
42 ASQ User Guide

43
VARIABLE LABELS MKTGRP MARKET AREA .
VALUE LABELS MKTGRP 1 ‘ZIP3=999’ 2 ‘IN-STATE/NOT 999’ 3 ‘OUT-OF-STATE’ .
WEIGHT BY CASEWT .
CROSSTABS TABLES=QA1 TO QB20 BY MKTGRP/CELL COUNT COLUMN .
Students also can be grouped by Enrollment Planning Service (EPS) markets. For example, an institution wants to study the following three segments:
Code Description
1 Students in Alaska: market 1
2 Students in Alaska: market 2
3 All other students
In this case, MKTGRP could be created as follows:
COMPUTE MKTGRP=3 .
IF (EPSMKT=’AK 1’) MKTGRP=1 .
IF (EPSMKT=’AK 2’) MKTGRP=2 .
Your top 12 EPS markets, and the percentages of students in each, are shown in Exhibit A-2 of your Highlights Report. This exhibit can guide you in the selection of EPS markets for fur ther analysis. For more information on the Enrollment Planning Service, contact the College Board.
Example 3: Computing Average Ratings by Test Score Group
For rating scales, average ratings provide more concise means of comparing subgroups of interest than response frequencies do. In this example, average ratings of college characteristics (QB1 to QB20) are computed for students at three ability levels: SAT CR+M (Critical Reading + Mathematics) score below 1000, between 1000 and 1190, and 1200 or higher. In the interpretation of average ratings for most ASQ scales, lower numbers represent better ratings (i.e., 1 = Very Important, or 1 = Best).
COMPUTE SATLEVEL=QA86 + QB86 .
RECODE SATLEVEL (LO THRU 990=1) (1000 THRU 1190=2) (1200 THRU HI=3) .
VAR LAB SATLEVEL SAT CR+M SCORE .
VAL LAB SATLEVEL 1 ‘BELOW 1000’ 2 ‘1000 TO 1190’ 3 ‘1200 AND OVER’ .
WEIGHT BY CASEWT .
MEANS TABLES=QB1 TO QB20 BY SATLEVEL .
The MEANS command can also be used to compute means for students grouped by more than one characteristic. For example, the following command produces tables of mean college characteristic ratings for students grouped by SAT level and by matriculation status (enrolling versus nonenrolling). Note that students who could not rate the questions (marking "0") have been excluded from the analysis.
WEIGHT BY CASEWT .
MEANS VAR=QB1 TO QB20, SATLEVEL, STATUS/CROSSBREAK=QB1 TO QB20 BY SATLEVEL BY STATUS/CELLS COUNT MEAN .
The display format for CROSSBREAK resembles tables produced by CROSSTABS but shows means for the variables named before the first BY rather than response counts. CELLS requests that only the number of cases and mean rating for each cell be printed (suppressing the sums and standard deviations) and leads to a less cluttered table. In

some earlier versions of SPSS for Windows, CROSSBREAK requires that BREAKDOWN be run in “integer mode”—with the ranges of the variables included in the VARIABLES specification above.
Example 4: Using Indicator Variables for Exploratory Analyses of Group Differences
Correlation methods provide highly concise measures of relationships, but they generally require variables to be scaled. For example, it would not be meaningful to compute correlations of ASQ rating data with Q87 (race/ethnicity) since the category numbers used to represent groups are arbitrary and do not form a scale. However, correlation methods can be used with group membership variables if they form a dichotomy (e.g., 1=membership, 0=non-membership).
In the following statements, a number of group membership “indicator variables” are created. (In the main program, the ratings of images—Q41 to Q63—are also recoded so that codes of 1 represent an image that is marked, and codes of 0 represent an image that is not marked.) The CORRELATION command below requests correlations between the image ratings and the indicator variables (with detailed output of pairwise numbers of cases suppressed).
DO REPEAT V1=Q84,Q85,Q88,Q90,Q91,QA73/ V2=FEMALE,AGRADES,INSTATE, PUBLIC,LOWINC,AIDAPP .
RECODE V1 (1=1) (ELSE=0) INTO V2 .
END REPEAT .
COMPUTE SAT1200=QA86+QB86 .
RECODE SAT1200 (1200 THRU HI=1) (ELSE=0) .
RECODE Q87 (2=1) (ELSE=0) INTO ASIAN .
RECODE Q87 (3,4,5=1) (ELSE=0) INTO HISPANIC .
RECODE Q87 (6=1) (ELSE=0) INTO BLACK .
RECODE Q90 (2=1) (ELSE=0) INTO INDEP .
RECODE Q90 (3=1) (ELSE=0) INTO CATHOLIC .
RECODE Q91 (7,8=1) (ELSE=0) INTO HIGHINC .
WEIGHT BY CASEWT .
CORRELATION Q41 TO Q63 WITH FEMALE TO HIGHINC/PRINT=NOSIG .
The DO REPEAT...END REPEAT commands represent a shorthand way to describe multiple RECODE commands, all of which accomplish the same type of transformation (in this case, recoding to 0 everything except the first response in each question).
This analysis produces a single 23 by 13 correlation matrix that can be scanned to assess where there are sizable positive or negative associations of images with group membership. Where associations appear to exist, cross tabulations using the original background variables can then be run to obtain more readily interpretable representations of the relationships.
The correlations computed by the commands above are phi coefficients—correlations between dichotomous variables. The values of phi coefficients are sensitive to the distributions of cases in the variables (departures from a 50-50 split leading to lower coefficients) and are not entirely comparable to correlations computed for variables
44 ASQ User Guide

that are less discrete. For this reason, the technique described here is suggested as an exploratory method—as a way of quickly assessing where relatively large associations appear to exist.
Example 5: Perceptions of Information Sources
The following commands produce cross tabulations of ratings of college characteristics with exposure to selected information sources. Ratings of quality of information (Q27 to Q40) are recoded into new variables (QE27 to QE40) for which values of 1 indicate exposure and 2 indicate no exposure.
RECODE Q27 TO Q40 (1 THRU 5=1) (0,SYSMIS=2) INTO QE27 TO QE40 .
WEIGHT BY CASEWT .
CRO TAB=QB1 TO QB20 BY QE34,QE37,QE39,QE40/CELL COUNT COL .
This example focuses on ratings of college characteristics in relation to use of four selected information sources: campus visits (QE34), contact with faculty (QE37), contact with graduates (QE39), and contact with students (QE40). If ratings of college characteristics were cross-tabulated with measures of exposure to all 14 information sources, 280 tables would result.
A smaller set of college characteristics might also be selected for study. For instance, attention might be limited to characteristics most often rated as very important (as determined in your own analysis or by reference to the ASQ Detailed Report).
Example 6: Ratings of Quality Relative to Perceived Importance
The purpose of the commands in this example is to examine the respondents’ ratings of the quality of your college for each of the characteristics relative to the perceived importance of the characteristics. Because it is really only meaningful to compare the importance of a characteristic to the rating of the same characteristic, there are just 20 possible tables of interest here.
The first set of commands below produces a cross tabulation of ratings against importance for four characteristics, overall academic reputation, access to faculty, cost to family, and quality of social life. This lets you determine if the perceived quality of your college for these characteristics is different for respondents who marked these characteristics as “very important,” compared to those who rated the characteristics “not important.”
WEIGHT BY CASEWT .
CRO TAB=QB3 BY QA3/QB6 BY QA6/QB9 BY QA9/QB14 BY QA14/CELL COUNT COL .
The following commands limit the set of respondents under examination to those who indicated that a characteristic was “very important.” More typing is required in this case because each comparison has to be spelled out separately, and the output consists of frequency distributions rather than cross tabulations.
WEIGHT BY CASEWT .
TEMP .
SELECT IF (QA3=1) .
FRE QB1,QB2,QB3,QB4 .
TEMP .
45

SELECT IF (QA6=1) .
FRE QB1, QB6, Q37 .
TEMP .
SELECT IF (QA9=1) .
FRE QB9,Q76,QA73,QB73,Q89 .
TEMP .
SELECT IF (QA14=1) .
FRE QB11,QB12,QB14,QB34,QB40 .
Example 7: Computing Cross-Applications and Cross-Admits
for Selected Student Groups
Since codes for colleges applied to can appear in any of six fields (Q67C to Q72C), ordinary frequency and cross-tabulation procedures cannot be used in computing cross-admissions. This example illustrates use of the TABLES procedure available as an extra cost option in SPSS to tabulate cross-application frequencies by SAT CR+M score interval.
COMPUTE SATLEVEL=QA84+QB84 .
RECODE SATLEVEL (LO THRU 990=1) (1000 THRU 1190=2) (1200 THRU HI=3) .
VAR LAB SATLEVEL SAT CR+M INTERVAL .
VAL LAB SATLEVEL 1 ‘BELOW 1000’ 2 ‘1000 TO 1190’ 3 ‘1200 AND OVER’ .
WEIGHT BY CASEWT .
TABLES
/FTOTAL=T1 “TOTAL”
/MRGROUP=CROSSAPS ‘COLLEGES APPLIED TO’ Q67C,Q68C,Q69C,Q70C,
Q71C,Q72C
/TABLE=CROSSAPS + T1 BY SATLEVEL + T1
/STAT=COUNT(‘’) CPCT ((PCT3)’’: SATLEVEL) .
The names corresponding to the college codes shown in the tables that these commands produce can be found in a code list on your CD. For your convenience this file has been inserted into your SPSS syntax file as value labels for Q67C to Q72C.
If cross-admissions are to be tabulated, then variables are needed that contain codes for colleges admitted to (that is, colleges for which the relevant status variable is equal to 1). The following statements are one way to create these variables (ADMIT1 to ADMIT6) and to compute cross-admissions frequencies for subgroups. This example assumes that the recode shown above has already been performed. Remember to assign the college names to the code values of the new variables.
DO REPEAT V1=Q67S,Q68S,Q69S,Q70S,Q71S,Q72S/
V2=Q67C,Q68C,Q69C,Q70C,Q71C,Q72C/
V3=ADMIT1,ADMIT2,ADMIT3,ADMIT4,ADMIT5,ADMIT6 .
IF (V1=1) V3=V2 .
END REPEAT .
46 ASQ User Guide

WEIGHT BY CASEWT .
TABLES / FTOTAL=T1 “TOTAL”
/ MRGROUP=ADMITS ‘COLLEGES ADMITTED TO’
ADMIT1,ADMIT2,ADMIT3,ADMIT4,ADMIT5,ADMIT6
/ TABLE=ADMITS + T1 BY SATLEVEL + T1
/ STAT=COUNT CPCT((PCT3):SATLEVEL) .
These commands produce lists, frequencies, and percentages for each subgroup’s college codes.
Example 8: Selecting Applicants or Admits to Specified Colleges for Analysis
The following statements assume that one wants to identify all students who have applied to colleges with codes 9001, 9002, 9003, or 9004. These students will have one or more of these codes in fields Q67C to Q72C. You can use several approaches. The following one is easy to enter, read, and modify if the set of colleges of interest changes.
COMPUTE APPTEST=2 .
DO REPEAT V1=9001,9002,9003,9004 .
IF (ANY(V1,Q67C,Q68C,Q69C,Q70C,Q71C,Q72C)) APPTEST=1 .
END REPEAT .
To identify students admitted to any one of these four colleges of interest, the following can be used:
DO REPEAT V1=Q67S,Q68S,Q69S,Q70S,Q71S,Q72S/V2=Q67C,Q68C,Q69C,Q70C, Q71C,Q72C/V3=ADMIT1,ADMIT2,ADMIT3,ADMIT4,ADMIT5,ADMIT6 .
IF (V1=1) V3=V2 .
END REPEAT .
COMPUTE ADMTEST=2 .
DO REPEAT V1=9001,9002,9003,9004 .
IF (ANY(V1,ADMIT1 TO ADMIT6)) ADMTEST=1 .
END REPEAT .
For some analyses, you can focus attention on nonenrolling students who are attending specified colleges. Nonenrolling students are identified by a value of 2 for the variable STATUS. Codes for the colleges they plan to attend are in field Q67C. Thus nonenrolling students who will attend colleges 9001, 9002, 9003, or 9004 can be identified by:
COMPUTE LOSETEST=2 .
IF (STATUS=2 AND ANY(Q67C,9001,9002,9003,9004)) LOSETEST=1 .
The variables created above—APPTEST, ADMTEST, or LOSETEST—can be used to select specific students for analysis (in SELECT IF statements). They can also be used in cross tabulations such as the following, in which ratings of college characteristics (importance and how we compare to others) are analyzed for applicants/nonapplicants, admits/nonadmits, and students attending/not attending the specified colleges.
47

48 ASQ User Guide
WEIGHT BY CASEWT .
CRO TAB = QA1 TO QA20, QB1 TO QB20 BY APPTEST/
QA1 TO QA20,QB1 TO QB20 BY ADMTEST/
QA1 TO QA20,QB1 TO QB20 BY LOSETEST/
CELL COUNT COL .
Example 9: Analyzing Yields
The following cross tabulation shows the yields for students who marked and did not mark each of the college images (Exhibit B-7 of the Highlights Report displays the yield only for students who did mark each of the 12 images marked most frequently):
WEIGHT BY CASEWT .
CRO TAB=Q41 TO Q63 BY STATUS/CELL COUNT ROW .
The yields are row percentages in the tables produced by the above commands, since yield as used in ASQ reports refers to enrolling students marking a given answer as a percentage of all students marking that answer.
Yields (expressed as proportions) can also be computed by recoding enrollment status to an indicator variable with values of 1 and 0, and then computing means as shown in the following example. The higher the resulting mean shown for a given value, the higher the yield.
RECODE STATUS (1=1) (2=0) INTO DSTAT .
WEIGHT BY CASEWT .
MEANS TABLES=DSTAT BY QU37 .1 TO QU37 .20 .
You can also examine yields (expressed as proportions) relative to combinations of background variables, using regression methods and indicator variables of the kind described in Example 4. The following statements produce an analysis of how yield varies jointly with sex, high SAT scores, in-state residence, public school attendance, and aid-application status. The unstandardized regression weights (B weights) of each predictor can be interpreted as the yield difference that is associated with that characteristic, holding the other predictors constant.
RECODE STATUS (1=1) (2=0) INTO DSTAT .
RECODE Q84 (1=1) (ELSE=0) INTO FEMALE .
COMPUTE SAT1200=QA86+QB86 .
RECODE SAT1200 (1200 THRU HI=1) (ELSE=0) .
RECODE Q88 (1=1) (ELSE=0) INTO INSTATE .
RECODE Q90 (1=1) (ELSE=0) INTO PUBLIC .
RECODE QA73 (1=1) (ELSE=0) INTO AIDAPP .
WEIGHT BY CASEWT .
REGRESSION VAR=DSTAT, FEMALE TO AIDAPP
/DESCRIPTIVES
/DEPENDENT=DSTAT
/ENTER=FEMALE TO AIDAPP .
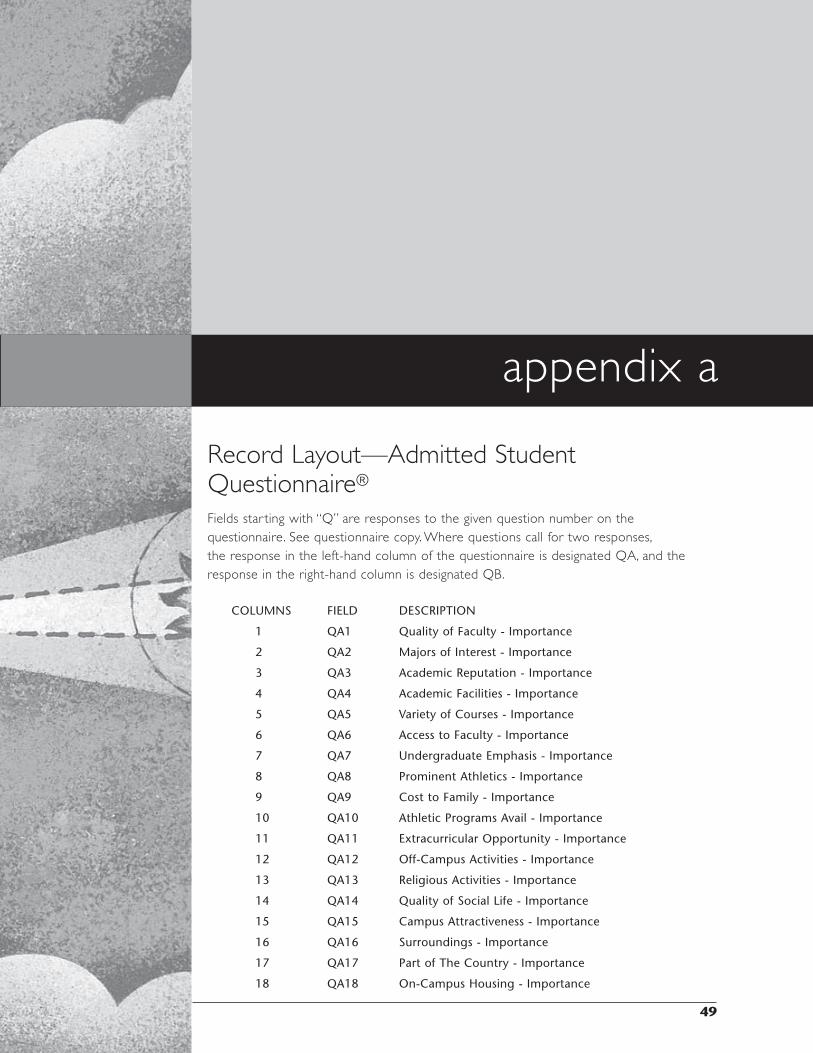
Record Layout—Admitted Student Questionnaire®
Fields star ting with “Q” are responses to the given question number on the questionnaire. See questionnaire copy. Where questions call for two responses, the response in the left-hand column of the questionnaire is designated QA, and the response in the right-hand column is designated QB.
COLUMNS FIELD DESCRIPTION
1 QA1 Quality of Faculty - Importance
2 QA2 Majors of Interest - Importance
3 QA3 Academic Reputation - Importance
4 QA4 Academic Facilities - Importance
5 QA5 Variety of Courses - Importance
6 QA6 Access to Faculty - Importance
7 QA7 Undergraduate Emphasis - Importance
8 QA8 Prominent Athletics - Importance
9 QA9 Cost to Family - Importance
10 QA10 Athletic Programs Avail - Importance
11 QA11 Extracurricular Opportunity - Importance
12 QA12 Off-Campus Activities - Importance
13 QA13 Religious Activities - Importance
14 QA14 Quality of Social Life - Importance
15 QA15 Campus Attractiveness - Importance
16 QA16 Surroundings - Importance
17 QA17 Part of The Country - Importance
18 QA18 On-Campus Housing - Importance
49
appendix a
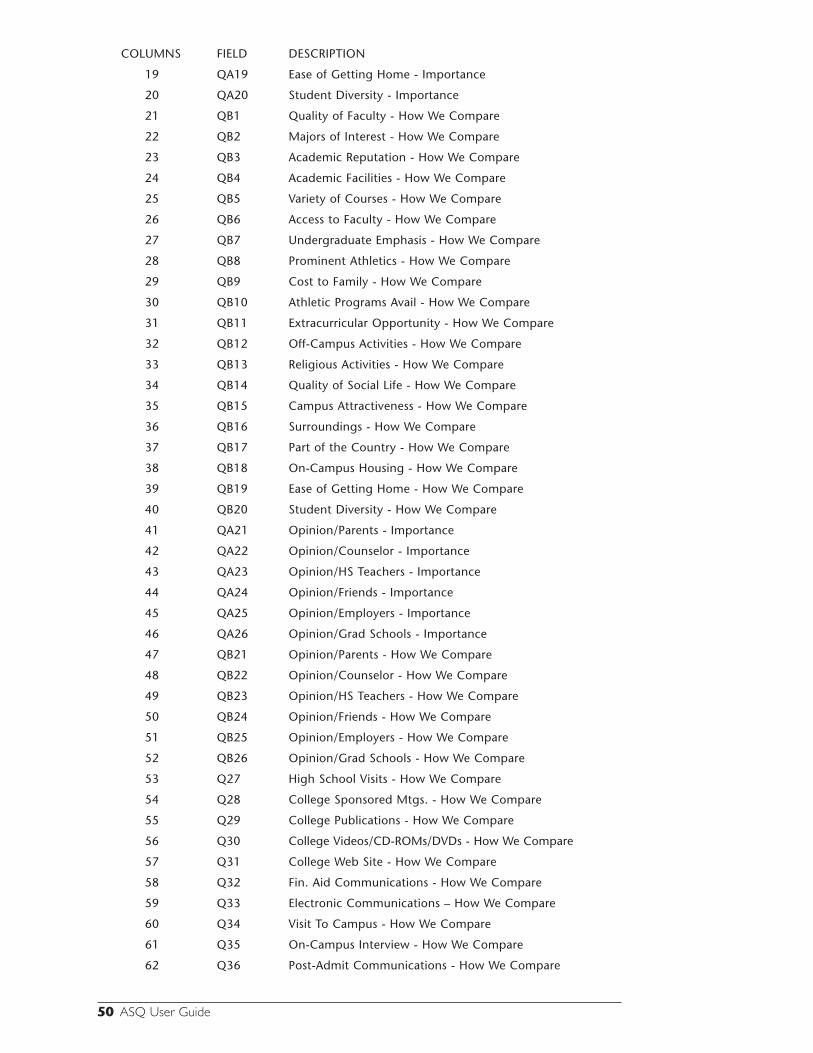
COLUMNS FIELD DESCRIPTION
19 QA19 Ease of Getting Home - Importance
20 QA20 Student Diversity - Importance
21 QB1 Quality of Faculty - How We Compare
22 QB2 Majors of Interest - How We Compare
23 QB3 Academic Reputation - How We Compare
24 QB4 Academic Facilities - How We Compare
25 QB5 Variety of Courses - How We Compare
26 QB6 Access to Faculty - How We Compare
27 QB7 Undergraduate Emphasis - How We Compare
28 QB8 Prominent Athletics - How We Compare
29 QB9 Cost to Family - How We Compare
30 QB10 Athletic Programs Avail - How We Compare
31 QB11 Extracurricular Opportunity - How We Compare
32 QB12 Off-Campus Activities - How We Compare
33 QB13 Religious Activities - How We Compare
34 QB14 Quality of Social Life - How We Compare
35 QB15 Campus Attractiveness - How We Compare
36 QB16 Surroundings - How We Compare
37 QB17 Part of the Country - How We Compare
38 QB18 On-Campus Housing - How We Compare
39 QB19 Ease of Getting Home - How We Compare
40 QB20 Student Diversity - How We Compare
41 QA21 Opinion/Parents - Importance
42 QA22 Opinion/Counselor - Importance
43 QA23 Opinion/HS Teachers - Importance
44 QA24 Opinion/Friends - Importance
45 QA25 Opinion/Employers - Importance
46 QA26 Opinion/Grad Schools - Importance
47 QB21 Opinion/Parents - How We Compare
48 QB22 Opinion/Counselor - How We Compare
49 QB23 Opinion/HS Teachers - How We Compare
50 QB24 Opinion/Friends - How We Compare
51 QB25 Opinion/Employers - How We Compare
52 QB26 Opinion/Grad Schools - How We Compare
53 Q27 High School Visits - How We Compare
54 Q28 College Sponsored Mtgs . - How We Compare
55 Q29 College Publications - How We Compare
56 Q30 College Videos/CD-ROMs/DVDs - How We Compare
57 Q31 College Web Site - How We Compare
58 Q32 Fin . Aid Communications - How We Compare
59 Q33 Electronic Communications – How We Compare
60 Q34 Visit To Campus - How We Compare
61 Q35 On-Campus Interview - How We Compare
62 Q36 Post-Admit Communications - How We Compare
50 ASQ User Guide
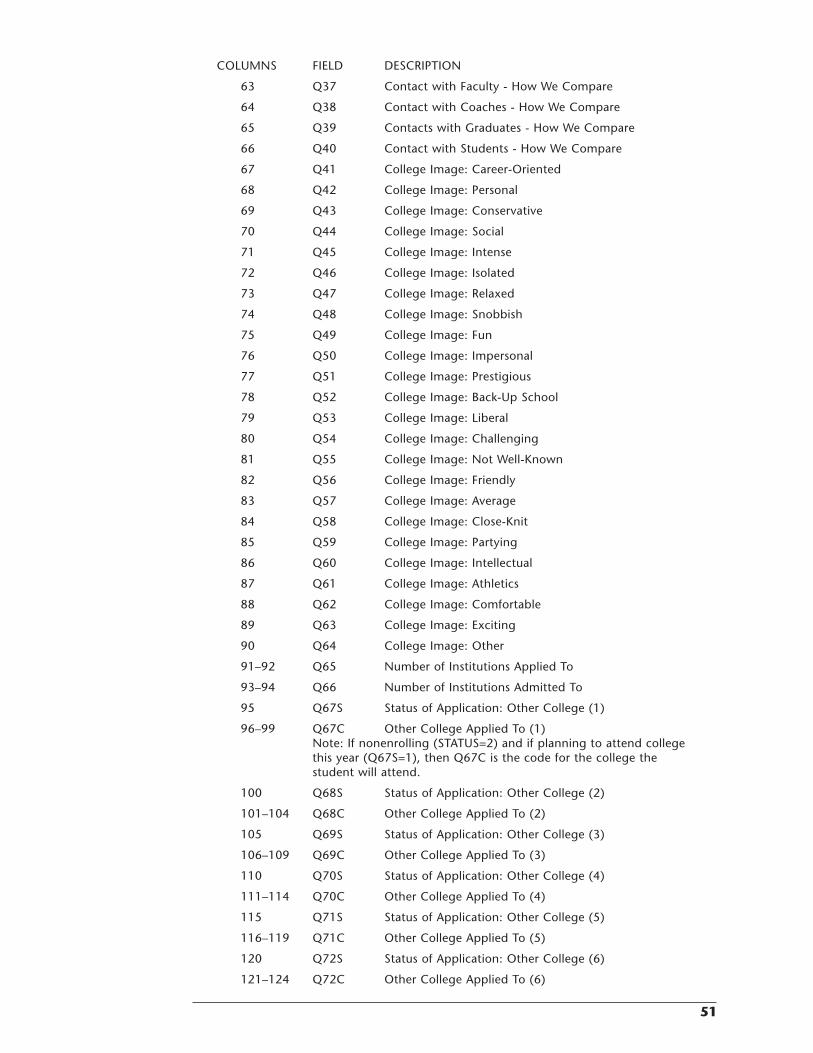
COLUMNS FIELD DESCRIPTION
63 Q37 Contact with Faculty - How We Compare
64 Q38 Contact with Coaches - How We Compare
65 Q39 Contacts with Graduates - How We Compare
66 Q40 Contact with Students - How We Compare
67 Q41 College Image: Career-Oriented
68 Q42 College Image: Personal
69 Q43 College Image: Conservative
70 Q44 College Image: Social
71 Q45 College Image: Intense
72 Q46 College Image: Isolated
73 Q47 College Image: Relaxed
74 Q48 College Image: Snobbish
75 Q49 College Image: Fun
76 Q50 College Image: Impersonal
77 Q51 College Image: Prestigious
78 Q52 College Image: Back-Up School
79 Q53 College Image: Liberal
80 Q54 College Image: Challenging
81 Q55 College Image: Not Well-Known
82 Q56 College Image: Friendly
83 Q57 College Image: Average
84 Q58 College Image: Close-Knit
85 Q59 College Image: Partying
86 Q60 College Image: Intellectual
87 Q61 College Image: Athletics
88 Q62 College Image: Comfortable
89 Q63 College Image: Exciting
90 Q64 College Image: Other
91–92 Q65 Number of Institutions Applied To
93–94 Q66 Number of Institutions Admitted To
95 Q67S Status of Application: Other College (1)
96–99 Q67C Other College Applied To (1) Note: If nonenrolling (STATUS=2) and if planning to attend college
this year (Q67S=1), then Q67C is the code for the college the student will attend .
100 Q68S Status of Application: Other College (2)
101–104 Q68C Other College Applied To (2)
105 Q69S Status of Application: Other College (3)
106–109 Q69C Other College Applied To (3)
110 Q70S Status of Application: Other College (4)
111–114 Q70C Other College Applied To (4)
115 Q71S Status of Application: Other College (5)
116–119 Q71C Other College Applied To (5)
120 Q72S Status of Application: Other College (6)
121–124 Q72C Other College Applied To (6)
51
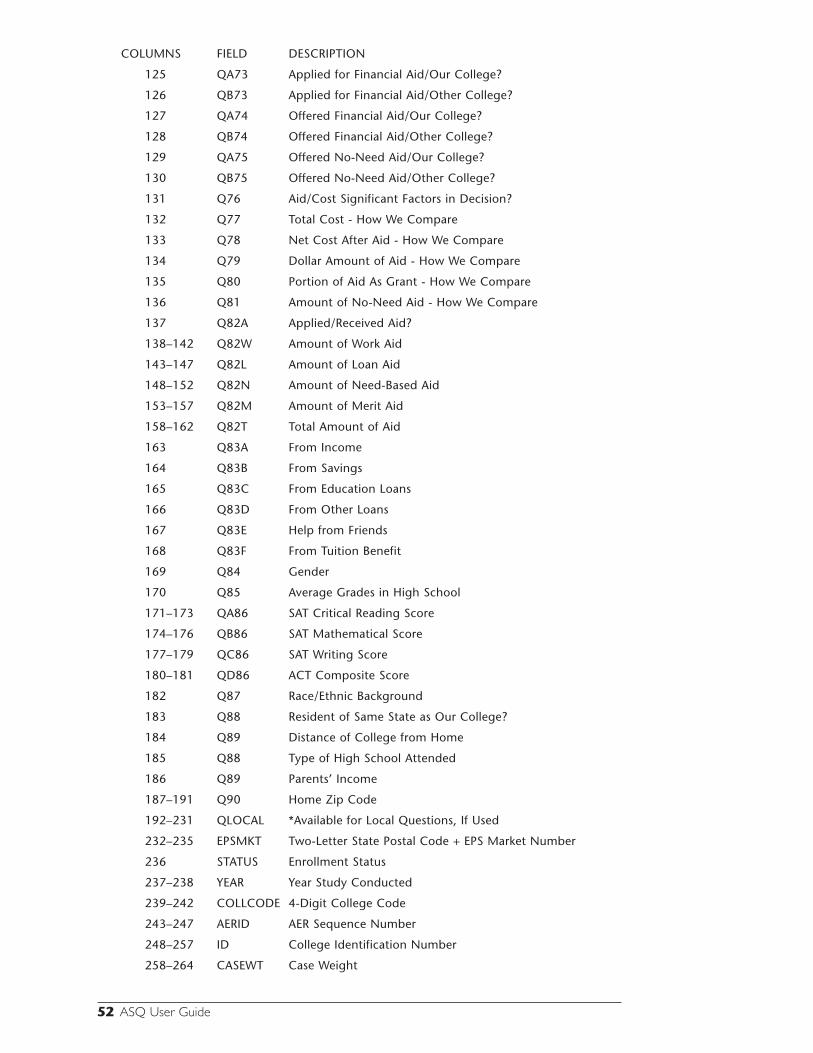
COLUMNS FIELD DESCRIPTION
125 QA73 Applied for Financial Aid/Our College?
126 QB73 Applied for Financial Aid/Other College?
127 QA74 Offered Financial Aid/Our College?
128 QB74 Offered Financial Aid/Other College?
129 QA75 Offered No-Need Aid/Our College?
130 QB75 Offered No-Need Aid/Other College?
131 Q76 Aid/Cost Significant Factors in Decision?
132 Q77 Total Cost - How We Compare
133 Q78 Net Cost After Aid - How We Compare
134 Q79 Dollar Amount of Aid - How We Compare
135 Q80 Portion of Aid As Grant - How We Compare
136 Q81 Amount of No-Need Aid - How We Compare
137 Q82A Applied/Received Aid?
138–142 Q82W Amount of Work Aid
143–147 Q82L Amount of Loan Aid
148–152 Q82N Amount of Need-Based Aid
153–157 Q82M Amount of Merit Aid
158–162 Q82T Total Amount of Aid
163 Q83A From Income
164 Q83B From Savings
165 Q83C From Education Loans
166 Q83D From Other Loans
167 Q83E Help from Friends
168 Q83F From Tuition Benefit
169 Q84 Gender
170 Q85 Average Grades in High School
171–173 QA86 SAT Critical Reading Score
174–176 QB86 SAT Mathematical Score
177–179 QC86 SAT Writing Score
180–181 QD86 ACT Composite Score
182 Q87 Race/Ethnic Background
183 Q88 Resident of Same State as Our College?
184 Q89 Distance of College from Home
185 Q88 Type of High School Attended
186 Q89 Parents’ Income
187–191 Q90 Home Zip Code
192–231 QLOCAL *Available for Local Questions, If Used
232–235 EPSMKT Two-Letter State Postal Code + EPS Market Number
236 STATUS Enrollment Status
237–238 YEAR Year Study Conducted
239–242 COLLCODE 4-Digit College Code
243–247 AERID AER Sequence Number
248–257 ID College Identification Number
258–264 CASEWT Case Weight
52 ASQ User Guide
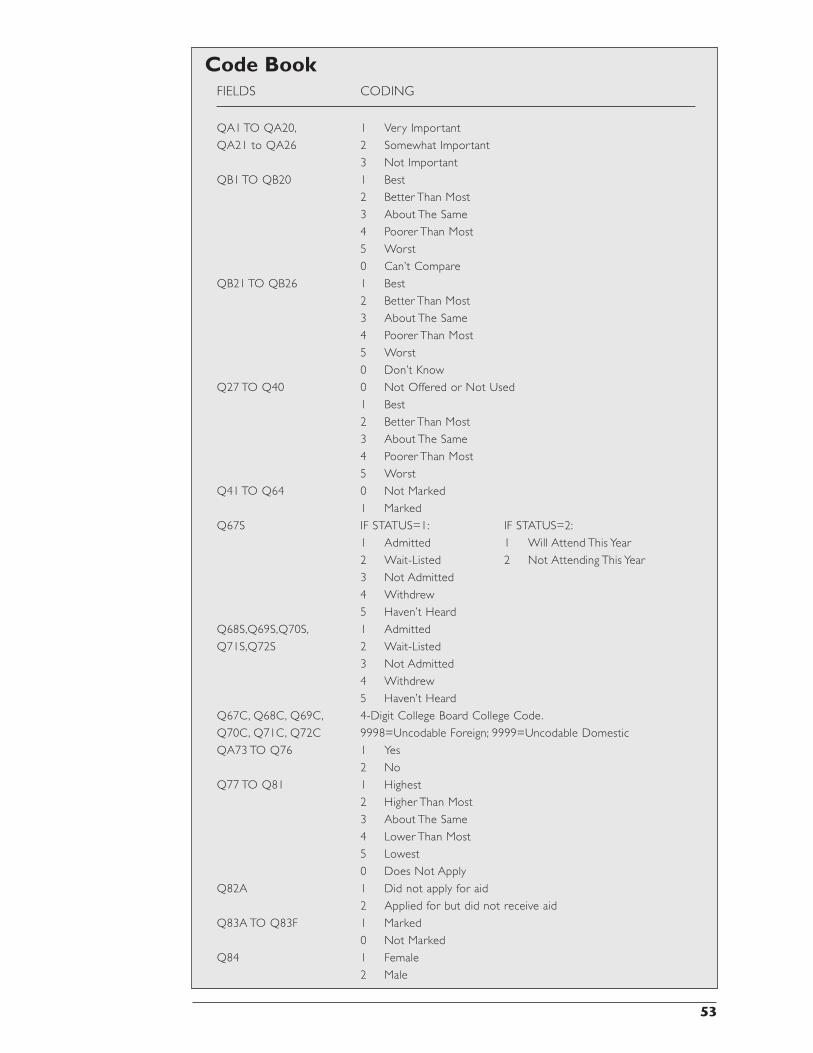
Code BookFIELDS CODING
QA1 TO QA20, 1 Very Important
QA21 to QA26 2 Somewhat Important
3 Not Important
QB1 TO QB20 1 Best
2 Better Than Most
3 About The Same
4 Poorer Than Most
5 Worst
0 Can’t Compare
QB21 TO QB26 1 Best
2 Better Than Most
3 About The Same
4 Poorer Than Most
5 Worst
0 Don’t Know
Q27 TO Q40 0 Not Offered or Not Used
1 Best
2 Better Than Most
3 About The Same
4 Poorer Than Most
5 Worst
Q41 TO Q64 0 Not Marked
1 Marked
Q67S IF STATUS=1: IF STATUS=2:
1 Admitted 1 Will Attend This Year
2 Wait-Listed 2 Not Attending This Year
3 Not Admitted
4 Withdrew
5 Haven’t Heard
Q68S,Q69S,Q70S, 1 Admitted
Q71S,Q72S 2 Wait-Listed
3 Not Admitted
4 Withdrew
5 Haven’t Heard
Q67C, Q68C, Q69C, 4-Digit College Board College Code.
Q70C, Q71C, Q72C 9998=Uncodable Foreign; 9999=Uncodable Domestic
QA73 TO Q76 1 Yes
2 No
Q77 TO Q81 1 Highest
2 Higher Than Most
3 About The Same
4 Lower Than Most
5 Lowest
0 Does Not Apply
Q82A 1 Did not apply for aid
2 Applied for but did not receive aid
Q83A TO Q83F 1 Marked
0 Not Marked
Q84 1 Female
2 Male
53

FIELDS CODING
Q85 1 A (90–100)
2 B (80–89)
3 C (70–79)
4 D or below (69 or below)
Q87 1 American Indian or Alaskan Native
2 Asian or Pacific Islander
3 Mexican American or Chicano
4 Puerto Rican
5 Latin American, South American, Central American, or Other Hispanic
6 Black or African American
7 White
8 Other
Q88 1 Yes
2 No
Q89 1 Under 50 Miles
2 51 to 100 Miles
3 101 to 300 Miles
4 301 to 500 Miles
5 More than 500 Miles
Q90 1 Public
2 Independent, Not Religiously Affiliated
3 Independent, Catholic
4 Other Independent, Religiously Affiliated
Q91 1 Below $30,000
2 $30,000–$39,999
3 $40,000–$59,999
4 $60,000–$79,999
5 $80,000–$99,999
6 $100,000–$149,999
7 $150,000–$199,999
8 $200,000 and Over
EPSMKT Two-letter U.S. Postal Code + two-digit market within state
STATUS 1 Enrolling
2 Nonenrolling
YEAR Constant: Year Study Conducted
COLLCODE Constant: College Board Code for College Conducting Study
CASEWT The ratio of students responding to students surveyed, calculated separately for enrolling and nonenrolling students.
54 ASQ User Guide
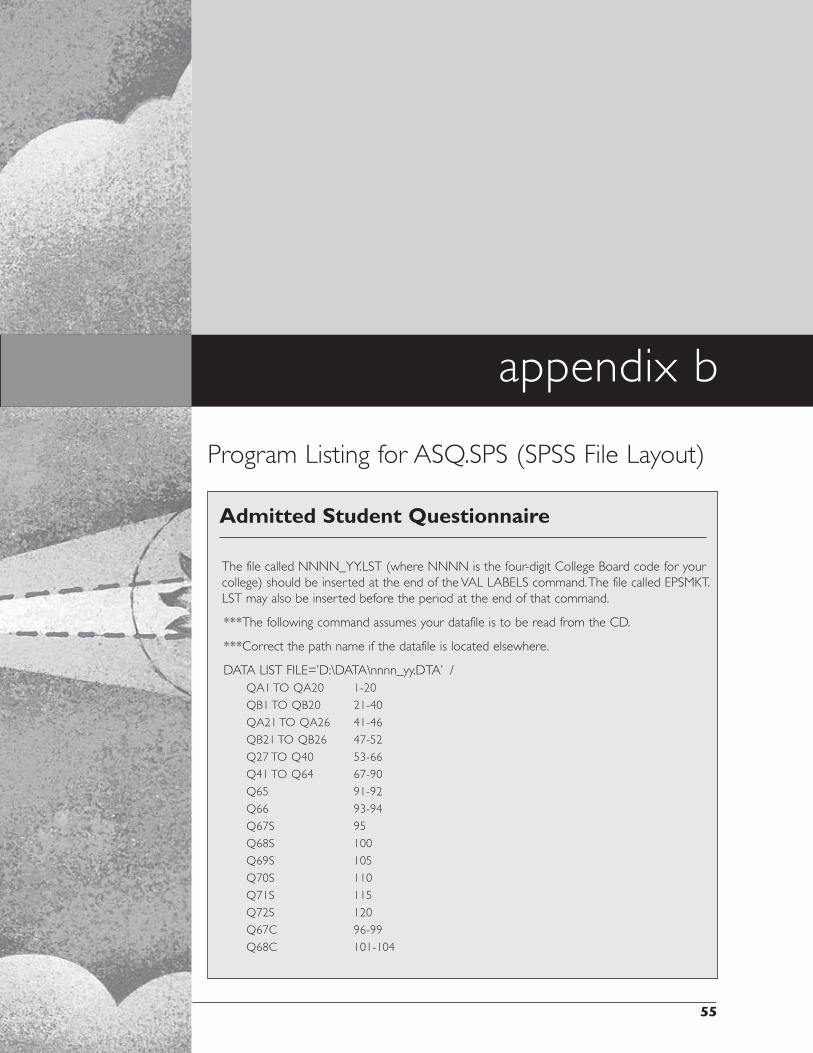
Program Listing for ASQ.SPS (SPSS File Layout)
Admitted Student Questionnaire
The file called NNNN_YY.LST (where NNNN is the four-digit College Board code for your college) should be inserted at the end of the VAL LABELS command. The file called EPSMKT.LST may also be inserted before the period at the end of that command.
***The following command assumes your datafile is to be read from the CD.
***Correct the path name if the datafile is located elsewhere.
DATA LIST FILE=’D:\DATA\nnnn_yy.DTA’ / QA1 TO QA20 1-20
QB1 TO QB20 21-40
QA21 TO QA26 41-46
QB21 TO QB26 47-52
Q27 TO Q40 53-66
Q41 TO Q64 67-90
Q65 91-92
Q66 93-94
Q67S 95
Q68S 100
Q69S 105
Q70S 110
Q71S 115
Q72S 120
Q67C 96-99
Q68C 101-104
55
appendix b
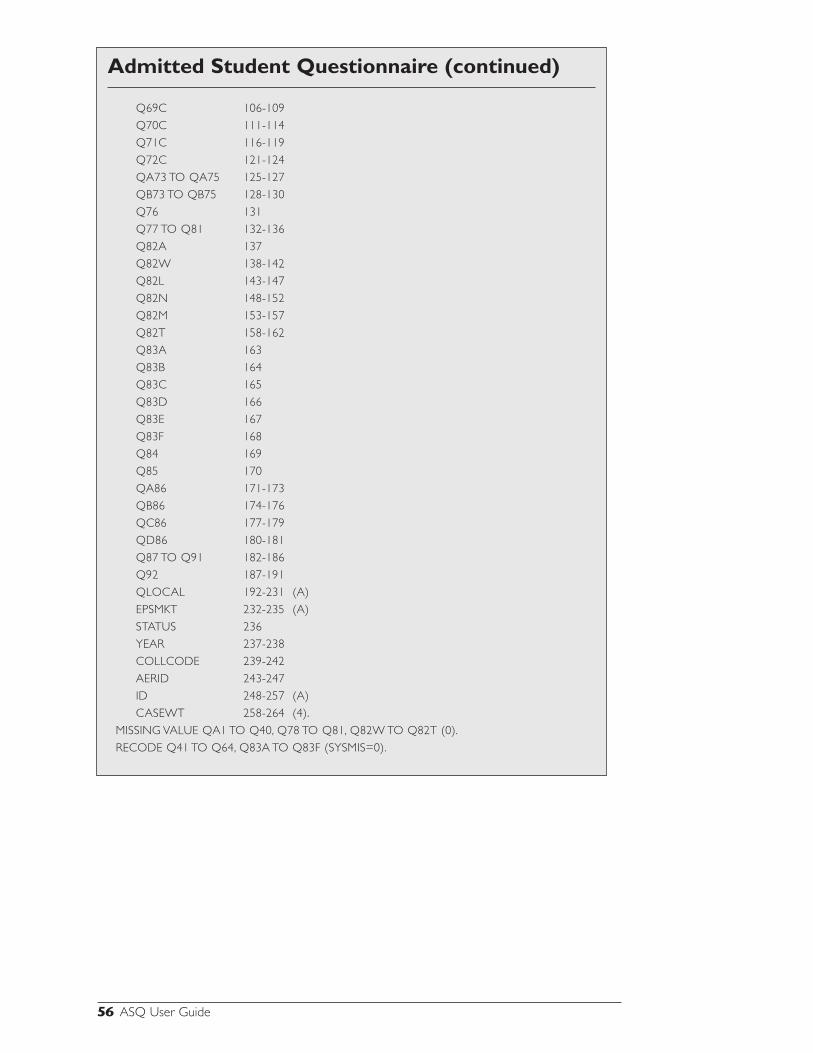
56 ASQ User Guide
Admitted Student Questionnaire (continued)
Q69C 106-109
Q70C 111-114
Q71C 116-119
Q72C 121-124
QA73 TO QA75 125-127
QB73 TO QB75 128-130
Q76 131
Q77 TO Q81 132-136
Q82A 137
Q82W 138-142
Q82L 143-147
Q82N 148-152
Q82M 153-157
Q82T 158-162
Q83A 163
Q83B 164
Q83C 165
Q83D 166
Q83E 167
Q83F 168
Q84 169
Q85 170
QA86 171-173
QB86 174-176
QC86 177-179
QD86 180-181
Q87 TO Q91 182-186
Q92 187-191
QLOCAL 192-231 (A)
EPSMKT 232-235 (A)
STATUS 236
YEAR 237-238
COLLCODE 239-242
AERID 243-247
ID 248-257 (A)
CASEWT 258-264 (4).
MISSING VALUE QA1 TO Q40, Q78 TO Q81, Q82W TO Q82T (0).
RECODE Q41 TO Q64, Q83A TO Q83F (SYSMIS=0).
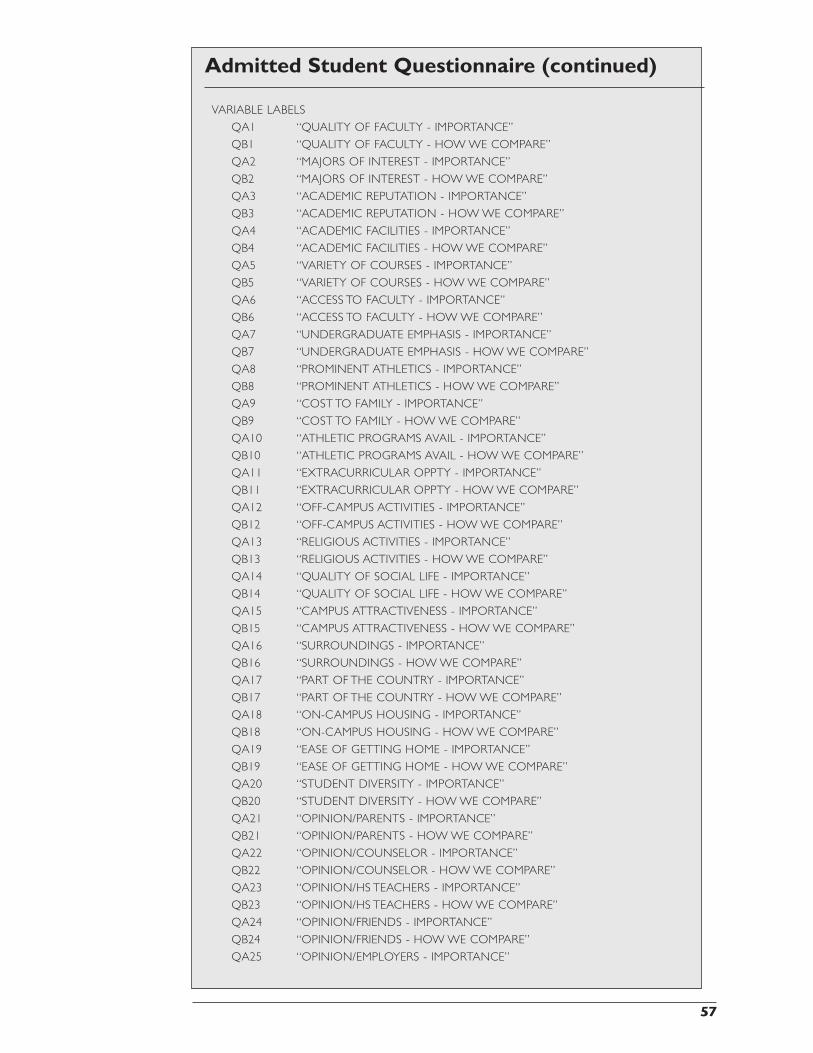
Admitted Student Questionnaire (continued)
VARIABLE LABELS
QA1 “QUALITY OF FACULTY - IMPORTANCE”
QB1 “QUALITY OF FACULTY - HOW WE COMPARE”
QA2 “MAJORS OF INTEREST - IMPORTANCE”
QB2 “MAJORS OF INTEREST - HOW WE COMPARE”
QA3 “ACADEMIC REPUTATION - IMPORTANCE”
QB3 “ACADEMIC REPUTATION - HOW WE COMPARE”
QA4 “ACADEMIC FACILITIES - IMPORTANCE”
QB4 “ACADEMIC FACILITIES - HOW WE COMPARE”
QA5 “VARIETY OF COURSES - IMPORTANCE”
QB5 “VARIETY OF COURSES - HOW WE COMPARE”
QA6 “ACCESS TO FACULTY - IMPORTANCE”
QB6 “ACCESS TO FACULTY - HOW WE COMPARE”
QA7 “UNDERGRADUATE EMPHASIS - IMPORTANCE”
QB7 “UNDERGRADUATE EMPHASIS - HOW WE COMPARE”
QA8 “PROMINENT ATHLETICS - IMPORTANCE”
QB8 “PROMINENT ATHLETICS - HOW WE COMPARE”
QA9 “COST TO FAMILY - IMPORTANCE”
QB9 “COST TO FAMILY - HOW WE COMPARE”
QA10 “ATHLETIC PROGRAMS AVAIL - IMPORTANCE”
QB10 “ATHLETIC PROGRAMS AVAIL - HOW WE COMPARE”
QA11 “EXTRACURRICULAR OPPTY - IMPORTANCE”
QB11 “EXTRACURRICULAR OPPTY - HOW WE COMPARE”
QA12 “OFF-CAMPUS ACTIVITIES - IMPORTANCE”
QB12 “OFF-CAMPUS ACTIVITIES - HOW WE COMPARE”
QA13 “RELIGIOUS ACTIVITIES - IMPORTANCE”
QB13 “RELIGIOUS ACTIVITIES - HOW WE COMPARE”
QA14 “QUALITY OF SOCIAL LIFE - IMPORTANCE”
QB14 “QUALITY OF SOCIAL LIFE - HOW WE COMPARE”
QA15 “CAMPUS ATTRACTIVENESS - IMPORTANCE”
QB15 “CAMPUS ATTRACTIVENESS - HOW WE COMPARE”
QA16 “SURROUNDINGS - IMPORTANCE”
QB16 “SURROUNDINGS - HOW WE COMPARE”
QA17 “PART OF THE COUNTRY - IMPORTANCE”
QB17 “PART OF THE COUNTRY - HOW WE COMPARE”
QA18 “ON-CAMPUS HOUSING - IMPORTANCE”
QB18 “ON-CAMPUS HOUSING - HOW WE COMPARE”
QA19 “EASE OF GETTING HOME - IMPORTANCE”
QB19 “EASE OF GETTING HOME - HOW WE COMPARE”
QA20 “STUDENT DIVERSITY - IMPORTANCE”
QB20 “STUDENT DIVERSITY - HOW WE COMPARE”
QA21 “OPINION/PARENTS - IMPORTANCE”
QB21 “OPINION/PARENTS - HOW WE COMPARE”
QA22 “OPINION/COUNSELOR - IMPORTANCE”
QB22 “OPINION/COUNSELOR - HOW WE COMPARE”
QA23 “OPINION/HS TEACHERS - IMPORTANCE”
QB23 “OPINION/HS TEACHERS - HOW WE COMPARE”
QA24 “OPINION/FRIENDS - IMPORTANCE”
QB24 “OPINION/FRIENDS - HOW WE COMPARE”
QA25 “OPINION/EMPLOYERS - IMPORTANCE”
57
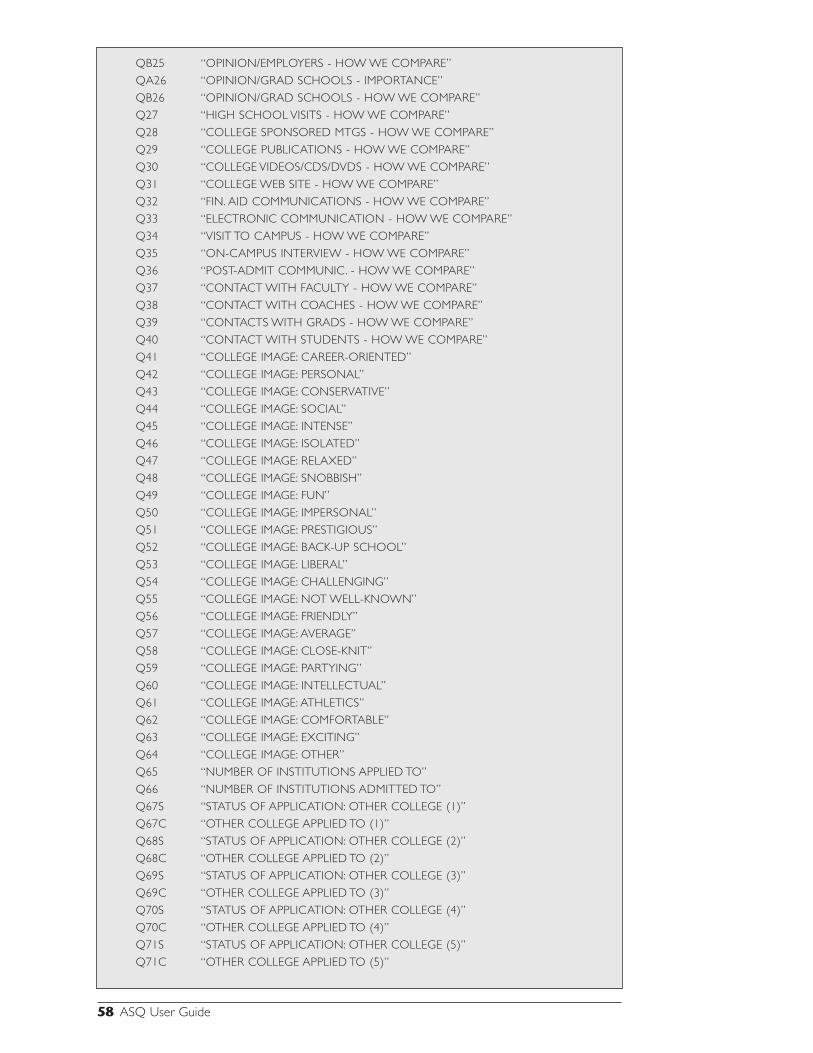
QB25 “OPINION/EMPLOYERS - HOW WE COMPARE”
QA26 “OPINION/GRAD SCHOOLS - IMPORTANCE”
QB26 “OPINION/GRAD SCHOOLS - HOW WE COMPARE”
Q27 “HIGH SCHOOL VISITS - HOW WE COMPARE”
Q28 “COLLEGE SPONSORED MTGS - HOW WE COMPARE”
Q29 “COLLEGE PUBLICATIONS - HOW WE COMPARE”
Q30 “COLLEGE VIDEOS/CDS/DVDS - HOW WE COMPARE”
Q31 “COLLEGE WEB SITE - HOW WE COMPARE”
Q32 “FIN. AID COMMUNICATIONS - HOW WE COMPARE”
Q33 “ELECTRONIC COMMUNICATION - HOW WE COMPARE”
Q34 “VISIT TO CAMPUS - HOW WE COMPARE”
Q35 “ON-CAMPUS INTERVIEW - HOW WE COMPARE”
Q36 “POST-ADMIT COMMUNIC. - HOW WE COMPARE”
Q37 “CONTACT WITH FACULTY - HOW WE COMPARE”
Q38 “CONTACT WITH COACHES - HOW WE COMPARE”
Q39 “CONTACTS WITH GRADS - HOW WE COMPARE”
Q40 “CONTACT WITH STUDENTS - HOW WE COMPARE”
Q41 “COLLEGE IMAGE: CAREER-ORIENTED”
Q42 “COLLEGE IMAGE: PERSONAL”
Q43 “COLLEGE IMAGE: CONSERVATIVE”
Q44 “COLLEGE IMAGE: SOCIAL”
Q45 “COLLEGE IMAGE: INTENSE”
Q46 “COLLEGE IMAGE: ISOLATED”
Q47 “COLLEGE IMAGE: RELAXED”
Q48 “COLLEGE IMAGE: SNOBBISH”
Q49 “COLLEGE IMAGE: FUN”
Q50 “COLLEGE IMAGE: IMPERSONAL”
Q51 “COLLEGE IMAGE: PRESTIGIOUS”
Q52 “COLLEGE IMAGE: BACK-UP SCHOOL”
Q53 “COLLEGE IMAGE: LIBERAL”
Q54 “COLLEGE IMAGE: CHALLENGING”
Q55 “COLLEGE IMAGE: NOT WELL-KNOWN”
Q56 “COLLEGE IMAGE: FRIENDLY”
Q57 “COLLEGE IMAGE: AVERAGE”
Q58 “COLLEGE IMAGE: CLOSE-KNIT”
Q59 “COLLEGE IMAGE: PARTYING”
Q60 “COLLEGE IMAGE: INTELLECTUAL”
Q61 “COLLEGE IMAGE: ATHLETICS”
Q62 “COLLEGE IMAGE: COMFORTABLE”
Q63 “COLLEGE IMAGE: EXCITING”
Q64 “COLLEGE IMAGE: OTHER”
Q65 “NUMBER OF INSTITUTIONS APPLIED TO”
Q66 “NUMBER OF INSTITUTIONS ADMITTED TO”
Q67S “STATUS OF APPLICATION: OTHER COLLEGE (1)”
Q67C “OTHER COLLEGE APPLIED TO (1)”
Q68S “STATUS OF APPLICATION: OTHER COLLEGE (2)”
Q68C “OTHER COLLEGE APPLIED TO (2)”
Q69S “STATUS OF APPLICATION: OTHER COLLEGE (3)”
Q69C “OTHER COLLEGE APPLIED TO (3)”
Q70S “STATUS OF APPLICATION: OTHER COLLEGE (4)”
Q70C “OTHER COLLEGE APPLIED TO (4)”
Q71S “STATUS OF APPLICATION: OTHER COLLEGE (5)”
Q71C “OTHER COLLEGE APPLIED TO (5)”
58 ASQ User Guide
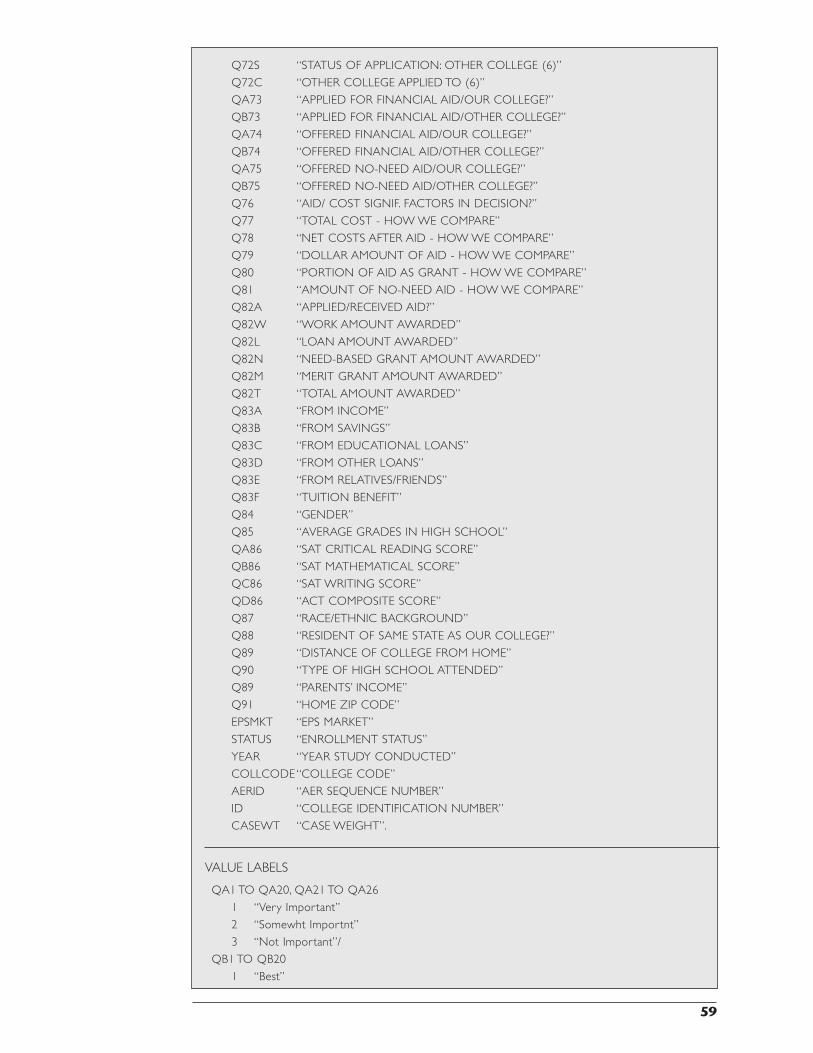
Q72S “STATUS OF APPLICATION: OTHER COLLEGE (6)”
Q72C “OTHER COLLEGE APPLIED TO (6)”
QA73 “APPLIED FOR FINANCIAL AID/OUR COLLEGE?”
QB73 “APPLIED FOR FINANCIAL AID/OTHER COLLEGE?”
QA74 “OFFERED FINANCIAL AID/OUR COLLEGE?”
QB74 “OFFERED FINANCIAL AID/OTHER COLLEGE?”
QA75 “OFFERED NO-NEED AID/OUR COLLEGE?”
QB75 “OFFERED NO-NEED AID/OTHER COLLEGE?”
Q76 “AID/ COST SIGNIF. FACTORS IN DECISION?”
Q77 “TOTAL COST - HOW WE COMPARE”
Q78 “NET COSTS AFTER AID - HOW WE COMPARE”
Q79 “DOLLAR AMOUNT OF AID - HOW WE COMPARE”
Q80 “PORTION OF AID AS GRANT - HOW WE COMPARE”
Q81 “AMOUNT OF NO-NEED AID - HOW WE COMPARE”
Q82A “APPLIED/RECEIVED AID?”
Q82W “WORK AMOUNT AWARDED”
Q82L “LOAN AMOUNT AWARDED”
Q82N “NEED-BASED GRANT AMOUNT AWARDED”
Q82M “MERIT GRANT AMOUNT AWARDED”
Q82T “TOTAL AMOUNT AWARDED”
Q83A “FROM INCOME”
Q83B “FROM SAVINGS”
Q83C “FROM EDUCATIONAL LOANS”
Q83D “FROM OTHER LOANS”
Q83E “FROM RELATIVES/FRIENDS”
Q83F “TUITION BENEFIT”
Q84 “GENDER”
Q85 “AVERAGE GRADES IN HIGH SCHOOL”
QA86 “SAT CRITICAL READING SCORE”
QB86 “SAT MATHEMATICAL SCORE”
QC86 “SAT WRITING SCORE”
QD86 “ACT COMPOSITE SCORE”
Q87 “RACE/ETHNIC BACKGROUND”
Q88 “RESIDENT OF SAME STATE AS OUR COLLEGE?”
Q89 “DISTANCE OF COLLEGE FROM HOME”
Q90 “TYPE OF HIGH SCHOOL ATTENDED”
Q89 “PARENTS’ INCOME”
Q91 “HOME ZIP CODE”
EPSMKT “EPS MARKET”
STATUS “ENROLLMENT STATUS”
YEAR “YEAR STUDY CONDUCTED”
COLLCODE “COLLEGE CODE”
AERID “AER SEQUENCE NUMBER”
ID “COLLEGE IDENTIFICATION NUMBER”
CASEWT “CASE WEIGHT”.
VALUE LABELS
QA1 TO QA20, QA21 TO QA26
1 “Very Important”
2 “Somewht Importnt”
3 “Not Important”/
QB1 TO QB20
1 “Best”
59
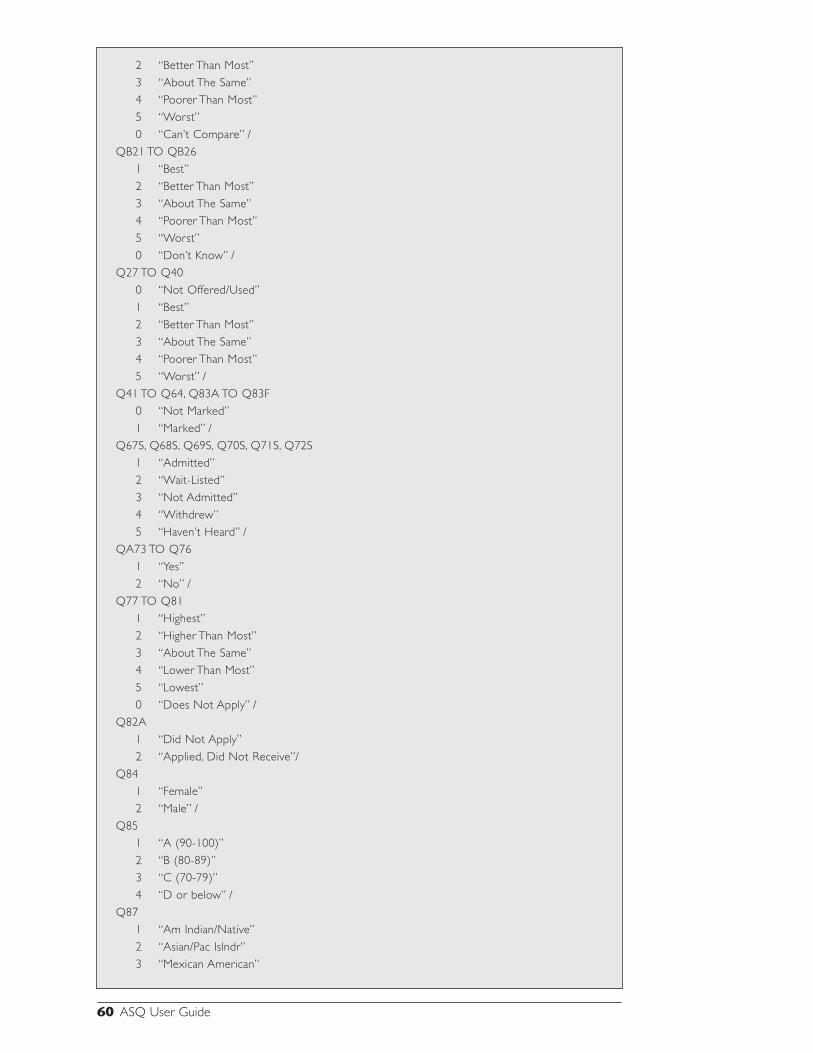
2 “Better Than Most”
3 “About The Same”
4 “Poorer Than Most”
5 “Worst”
0 “Can’t Compare” /
QB21 TO QB26
1 “Best”
2 “Better Than Most”
3 “About The Same”
4 “Poorer Than Most”
5 “Worst”
0 “Don’t Know” /
Q27 TO Q40
0 “Not Offered/Used”
1 “Best”
2 “Better Than Most”
3 “About The Same”
4 “Poorer Than Most”
5 “Worst” /
Q41 TO Q64, Q83A TO Q83F
0 “Not Marked”
1 “Marked” /
Q67S, Q68S, Q69S, Q70S, Q71S, Q72S
1 “Admitted”
2 “Wait-Listed”
3 “Not Admitted”
4 “Withdrew”
5 “Haven’t Heard” /
QA73 TO Q76
1 “Yes”
2 “No” /
Q77 TO Q81
1 “Highest”
2 “Higher Than Most”
3 “About The Same”
4 “Lower Than Most”
5 “Lowest”
0 “Does Not Apply” /
Q82A
1 “Did Not Apply”
2 “Applied, Did Not Receive”/
Q84
1 “Female”
2 “Male” /
Q85
1 “A (90-100)”
2 “B (80-89)”
3 “C (70-79)”
4 “D or below” /
Q87
1 “Am Indian/Native”
2 “Asian/Pac Islndr”
3 “Mexican American”
60 ASQ User Guide
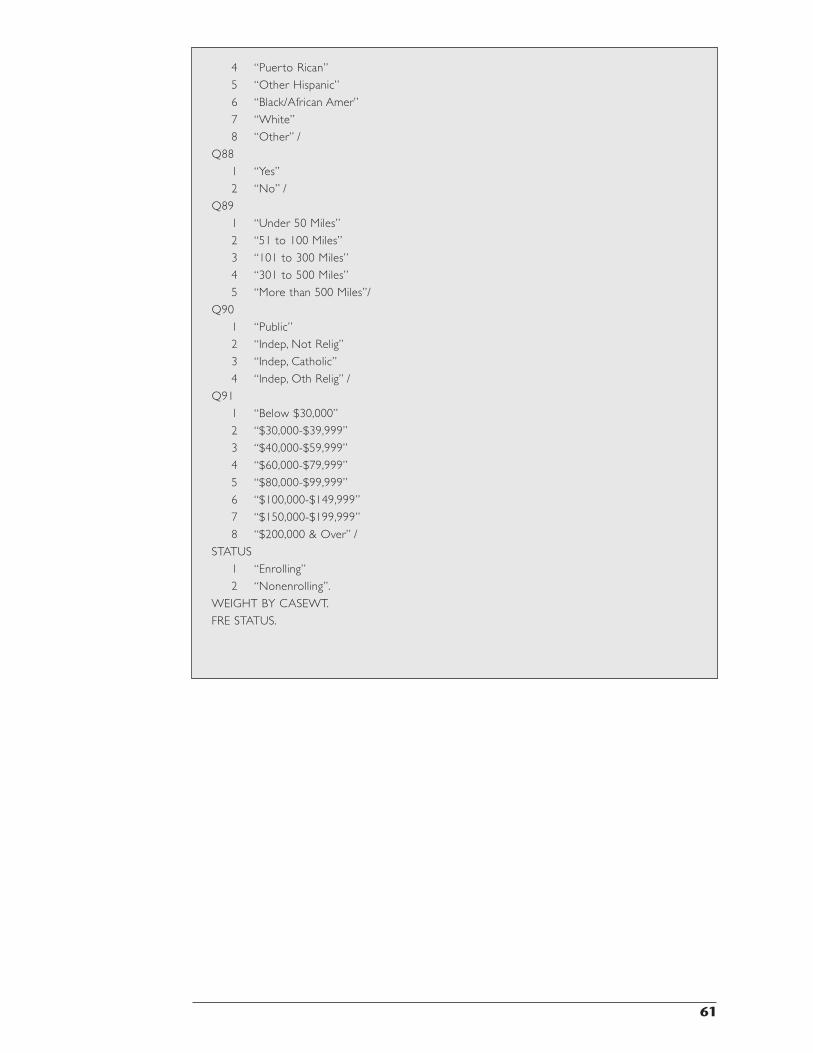
61
4 “Puerto Rican”
5 “Other Hispanic”
6 “Black/African Amer”
7 “White”
8 “Other” /
Q88
1 “Yes”
2 “No” /
Q89
1 “Under 50 Miles”
2 “51 to 100 Miles”
3 “101 to 300 Miles”
4 “301 to 500 Miles”
5 “More than 500 Miles”/
Q90
1 “Public”
2 “Indep, Not Relig”
3 “Indep, Catholic”
4 “Indep, Oth Relig” /
Q91
1 “Below $30,000”
2 “$30,000-$39,999”
3 “$40,000-$59,999”
4 “$60,000-$79,999”
5 “$80,000-$99,999”
6 “$100,000-$149,999”
7 “$150,000-$199,999”
8 “$200,000 & Over” /
STATUS
1 “Enrolling”
2 “Nonenrolling”.
WEIGHT BY CASEWT.
FRE STATUS.

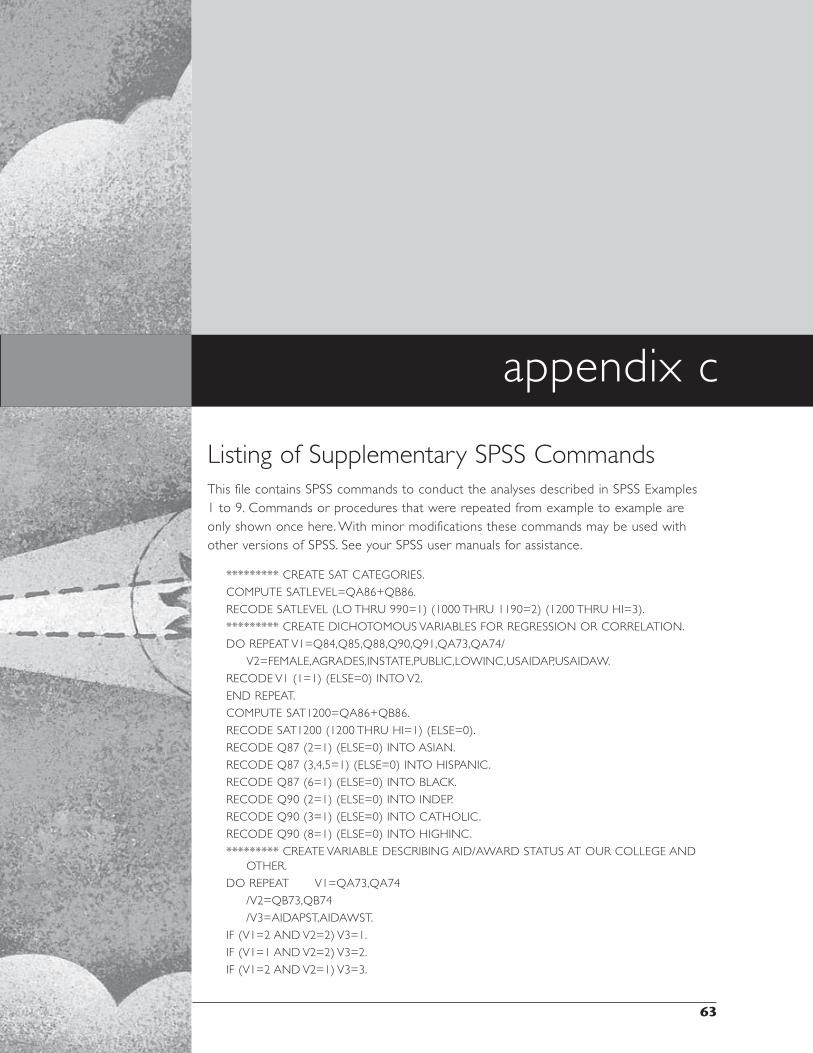
Listing of Supplementary SPSS CommandsThis file contains SPSS commands to conduct the analyses described in SPSS Examples 1 to 9. Commands or procedures that were repeated from example to example are only shown once here. With minor modifications these commands may be used with other versions of SPSS. See your SPSS user manuals for assistance.
********* CREATE SAT CATEGORIES.
COMPUTE SATLEVEL=QA86+QB86.
RECODE SATLEVEL (LO THRU 990=1) (1000 THRU 1190=2) (1200 THRU HI=3).
********* CREATE DICHOTOMOUS VARIABLES FOR REGRESSION OR CORRELATION.
DO REPEAT V1=Q84,Q85,Q88,Q90,Q91,QA73,QA74/
V2=FEMALE,AGRADES,INSTATE,PUBLIC,LOWINC,USAIDAP,USAIDAW.
RECODE V1 (1=1) (ELSE=0) INTO V2.
END REPEAT.
COMPUTE SAT1200=QA86+QB86.
RECODE SAT1200 (1200 THRU HI=1) (ELSE=0).
RECODE Q87 (2=1) (ELSE=0) INTO ASIAN.
RECODE Q87 (3,4,5=1) (ELSE=0) INTO HISPANIC.
RECODE Q87 (6=1) (ELSE=0) INTO BLACK.
RECODE Q90 (2=1) (ELSE=0) INTO INDEP.
RECODE Q90 (3=1) (ELSE=0) INTO CATHOLIC.
RECODE Q90 (8=1) (ELSE=0) INTO HIGHINC.
********* CREATE VARIABLE DESCRIBING AID/AWARD STATUS AT OUR COLLEGE AND OTHER.
DO REPEAT V1=QA73,QA74
/V2=QB73,QB74
/V3=AIDAPST,AIDAWST.
IF (V1=2 AND V2=2) V3=1.
IF (V1=1 AND V2=2) V3=2.
IF (V1=2 AND V2=1) V3=3.
63
appendix c

IF (V1=1 AND V2=1) V3=4.
END REPEAT.
********* RECODE INFORMATION SOURCES TO CREATE EXPOSURE VARIABLES.
RECODE Q27 TO Q40 (1 THRU 5=1) (0,SYSMIS=2) INTO QE27 TO QE40.
*********CREATE COLLEGES ADMITTED TO.
DO REPEAT V1=Q67S,Q68S,Q69S,Q70S,Q71S,Q72S/V2=Q67C,Q68C,Q69C,Q70C,Q71C,Q72C /V3=ADMIT1,ADMIT2,ADMIT3,ADMIT4,ADMIT5,ADMIT6.
IF (V1=1) V3=V2.
END REPEAT.
FORMAT ADMIT1 TO ADMIT6 (F4).
VARIABLE LABELS
SATLEVEL SAT CR + M SCORE INTERVAL
USAIDAP APPLIED FOR AID - OUR COLLEGE
USAIDAW AWARDED AID - OUR COLLEGE
AIDAPST AID APPLICATION STATUS
AIDAWST AID AWARD STATUS
QE27 HIGH SCHOOL VISITS: EXPOSURE
QE28 MEETINGS: EXPOSURE
QE29 PUBLICATIONS: EXPOSURE
QE30 VIDEOS, CDS, DVDS: EXPOSURE
QE31 WEB SITE: EXPOSURE
QE32 AID COMMUNICATIONS: EXPOSURE
QE33 ELECT COMMUNICATION: EXPOSURE
QE34 CAMPUS VISIT: EXPOSURE
QE35 INTERVIEW: EXPOSURE
QE36 POST-ADMIT CONTACT: EXPOSURE
QE37 FACULTY CONTACT: EXPOSURE
QE38 COACH CONTACT: EXPOSURE
QE39 GRADUATE CONTACT: EXPOSURE
QE40 STUDENT CONTACT: EXPOSURE
ADMIT1 FIRST COLLEGE ADMITTED TO
ADMIT2 SECOND COLLEGE ADMITTED TO
ADMIT3 THIRD COLLEGE ADMITTED TO
ADMIT4 FOURTH COLLEGE ADMITTED TO
ADMIT5 FIFTH COLLEGE ADMITTED TO
ADMIT6 SIXTH COLLEGE ADMITTED TO.
********** NOTE: INSERT FILE CALLED nnnn_yy.LST FOLLOWING LINE “ADMIT4,ADMIT5,ADMIT6” BELOW.
VALUE LABELS
SATLEVEL
1 BELOW 1000
2 1000 TO 1190
3 1200 AND OVER
/AIDAPST,AIDAWST
1 NEITHER
2 US ONLY
3 OTHER ONLY
4 BOTH
/QE27 TO QE40
1 EXPOSURE TO INFORMATION
2 NO EXPOSURE
/Q67C,Q68C,Q69C,Q70C,Q71C,Q72C,ADMIT1,ADMIT2,ADMIT3,ADMIT4,ADMIT5,ADMIT6 . WEIGHT BY CASEWT.
64 ASQ User Guide

********* CROSSTABS: ALL RATINGS BY GENDER.
CROSSTABS TABLES=QA1 TO Q64,QA73 TO Q81 BY Q84/CELL COUNT COLUMN.
********* CROSSTABS: ALL RATINGS BY STATUS BY HIGH SCHOOL GRADES.
CROSSTABS TABLES=QA1 TO Q64,QA73 TO Q81 BY STATUS BY Q85/CELL COUNT ROW
COLUMN.
********* CROSSTABS: CHARACTERISTICS BY EXPOSURE TO CAMPUS VISIT; CHARACTERISTICS BY STATUS BY EXPOSURE TO STUDENT CONTACT.
CROSSTABS TABLES=QB1 TO QB20 BY QE34/QB1 TO QB20 BY STATUS BY QE40/
CELL COUNT COLUMN.
********* CROSSTABS: RATINGS BY IMPORTANCE (FIRST 12 CHARACTERISTICS).
CROSSTABS TABLES=QB1 BY STATUS BY QA1/QB2 BY STATUS BY QA2/
QB3 BY STATUS BY QA3/QB4 BY STATUS BY QA4/QB5 BY STATUS BY QA5/
QB6 BY STATUS BY QA6/QB7 BY STATUS BY QA7/QB8 BY STATUS BY QA8/
QB9 BY STATUS BY QA9/QB10 BY STATUS BY QA10/QB11 BY STATUS BY QA11/
QB12 BY STATUS BY QA12/CELL COUNT COL.
********* MEANS: RATINGS BY SAT LEVEL (TOTAL AND BY STATUS).
MEANS VAR=QB1 TO QB20(LO,HI), SATLEVEL(1,3), STATUS(1,2)
/CROSSBREAK=QB1 TO QB20 BY SATLEVEL BY STATUS
/CELL MEAN COUNT.
********* CORRELATIONS: IMAGES WITH DICHOTOMOUS DEMOGRAPHICS.
CORR Q41 TO Q63 WITH FEMALE TO USAIDAW, SAT1200 TO HIGHINC.
********* TABLES: IMAGES MARKED, BY RACE/ETHNICITY PERCENT VERY IMPORTANT, BY INCOME.
TABLES
/FTOTAL=T1 “TOTAL”
/MDGROUP=IMAGES ‘IMAGES MARKED’ Q41 TO Q63 (1)
/MDGROUP=IMPORT ‘VERY IMPORTANT CHARACTERISTICS’ QA1 TO QA20 (1)
/TABLE=IMAGES + T1 BY Q87 + T1
/STAT=COUNT(‘’) CPCT((PCT3)’’:Q87)
/TABLE=IMPORT + T1 BY Q91 + T1
/STAT=COUNT(‘’) CPCT((PCT3)’’:Q91).
***** COLLEGES ADMITTED TO, BY SAT LEVEL AND TYPE OF HIGH SCHOOL (TABLES).
TABLES
/ FTOTAL=T1 “TOTAL”
/ MRGROUP=ADMITS ‘COLLEGES ADMITTED TO’ ADMIT1 TO ADMIT6
/ TABLE=ADMITS BY Q90 + T1
/ STATISTICS=COUNT(‘’) CPCT((PCT3)’’:Q90)
/ TABLE=ADMITS BY SATLEVEL + T1
/ STATISTICS=COUNT(‘’) CPCT((PCT3)’’:SATLEVEL).
***** REGRESSION: PREDICTING ENROLLMENT STATUS FROM DEMOGRAPHIC VARIABLES.
REGRESSION VAR=STATUS, FEMALE TO USAIDAW
/DESCRIPTIVES
/DEPENDENT=STATUS
/ENTER=FEMALE TO USAIDAW.
65