Embed Size (px)
Citation preview
1
Advertising as a Major Source of Human Dissatisfaction: Cross-National
Evidence on One Million Europeans
Chloe Michela, Michelle Sovinskyb,c , Eugenio Protod,f , and Andrew J. Oswalde,f
January 2019
a University of Zurich, Switzerland. b University of Mannheim, Germany. c Centre for Economic Policy Research, London, UK. d University of Bristol, UK. e University of Warwick, UK. f IZA Institute for the Study of Labor, Bonn, Germany.
The first author acknowledges support from European Research Council Grant #725081
FORENSICS (Sovinsky). She also acknowledges financial support from the Collaborative
Research Center Transregion 224 Grant. The last author acknowledges support from the
CAGE center at the University of Warwick.
This paper is to be published in 2019 in a volume in honor of Richard Easterlin.
2
Abstract
Advertising is ubiquitous in modern life. Yet might it be harmful to the happiness of
nations? This paper blends longitudinal data on advertising with large-scale surveys on
citizens’ well-being. The analysis uses information on approximately 1 million randomly
sampled European citizens across 27 nations over 3 decades. We show that increases in
national advertising expenditure are followed by significant declines in levels of life
satisfaction. This finding is robust to adjustments for a range of potential confounders --
including the personal and economic characteristics of individuals, country fixed-effects,
year dummies, and business-cycle influences. Further research remains desirable.
Nevertheless, our empirical results are some of the first to be consistent with the hypothesis
that, perhaps by fostering unending desires, high levels of advertising may depress societal
well-being.
Keywords: adverts, status, life satisfaction, Easterlin Paradox, positive affect
3
1. Introduction
In a classic article, Richard Easterlin (1974) documented some of the first evidence for the
striking idea that society does not seem to become happier as it grows richer. He suggested
that one mechanism at work might be an intrinsic tendency of human beings to compare
themselves with their neighbors. Easterlin’s thesis drew, in part, on Thorstein Veblen’s
(1899, 1904) arguments about people’s desires for conspicuous consumption. If humans
have ‘relativistic’ preferences, so that they constantly look over their shoulders before
deciding how contented they feel, then as those individuals consume more and more goods
they might fail to become happier because they see others around them also consuming
more and more. The pleasure of my new car might be nullified by the fact that Ms Jones,
in the parking spot next to mine, has also just bought one.
As Thorstein Veblen anticipated, there is today a global industrial sector -- known as
the advertising industry -- that is devoted to the unceasing encouragement of consumption.
Advertising plays a prominent role in all countries of which we are knowledgeable. Might
that industry, by fostering discontent with what people already own, be harmful to human
happiness, perhaps because of the relativistic kinds of utility functions alluded to by scholars
such as Richard Easterlin?
It is not known for certain how much advertising the typical citizen witnesses.
However, one modern study, Speers et al. (2011), concluded for the United States that on
prime-time television the brand names of food, beverages and restaurants appeared
approximately 35,000 times in one year. Coca Cola products, for example, were seen 198
times by the average child and 269 times by the average adolescent. These influences appear
to be gradually strengthening through time. Other research, by Cowling and Poolsombat
(2007), documented a 4-fold increase in real advertising per-capita in the US over 5 decades.
Links between advertising and human well-being are imperfectly understood. Effects

4
might operate along two broad channels. First, one way to conceive of advertising is as a
force for good. Advertising informs. It may therefore promote human welfare by allowing
people to make better choices about the right products for them. Second, an alternative way
to conceive of advertising is as a force that creates dissatisfaction and stimulates potentially
infeasible desires. If correct, that would imply that advertising might reduce net human
welfare by unduly raising the consumption aspirations of human beings. Since Veblen,
many writers have worried about the possibility of, and in some cases found small-scale
evidence for, negative effects of advertising upon people’s well-being (see e.g. Richins
1995, Easterlin and Crimmins 1991, Bagwell and Bernheim 1996, Sirgy et al. 1998, Dittmar
et al. 2014, Frey et al. 2007, and Harris et al. 2009). A moderately large literature exists,
primarily on the likely detrimental effects upon children (Andreyeva et al. 2011,
Borzekowski and Robinson 2001, Buijzen and Valkenburg 2003a, Opree et al. 2013, and
Buijzen and Valkenburg 2003b), although the most recent work, by Opree et al. (2016),
produced mixed results. More broadly, Clark (2018) reviews recent evidence consistent
with important ‘comparison effects’ in adult humans, and Mujcic and Oswald (2018)
document longitudinal evidence consistent with negative wellbeing consequences from
envy.
At the national level, it is not known which of the two forces -- one beneficial and one
detrimental -- is dominant. There are apparently no cross-country econometric studies on
representative samples of adults. The now-large modern literature on the social science of
well-being, described in sources such as Easterlin (2003), Oswald (1997), Layard (2005)
and Clark (2018), has so far paid little attention to the role of advertising. A number of
national variables have been shown to influence well-being in country fixed-effects
equations (in particular, the generosity of the welfare state and various macroeconomic
variables such as unemployment, in sources such as DiTella et al. 2001, DiTella et al. 2003,
5
and Radcliff 2013).
In this study we examine -- and provide evidence of -- links between national
advertising and national well-being. Using longitudinal information on countries (built up
from pooled cross-sectional surveys), this study finds that rises and falls in advertising are
followed, a small number of years later, by falls and rises in national life-satisfaction. The
results thus reveal an inverse connection between advertising levels and the later well-being
levels of nations.
To perform the statistical analysis, we take a sample of slightly over 900,000 randomly
sampled European citizens, who report information on their life-satisfaction levels and on
many other aspects of themselves and their lives. The data are from repeated surveys,
collected annually, for 27 countries from 1980 to 2011. For each nation, and each year, total
advertising expenditure levels are also gathered (details are given later in the appendix on
Data and Methods). We then match one set of data with the other. To adjust in the analysis
for possible confounding factors, we use regression analysis, and estimate fixed-effects
equations in which the unobservable characteristics of nations can be held constant.
Although strict causal interpretations are not possible, none of the paper’s results depend on
elementary cross-sectional regression equations.
2. Results
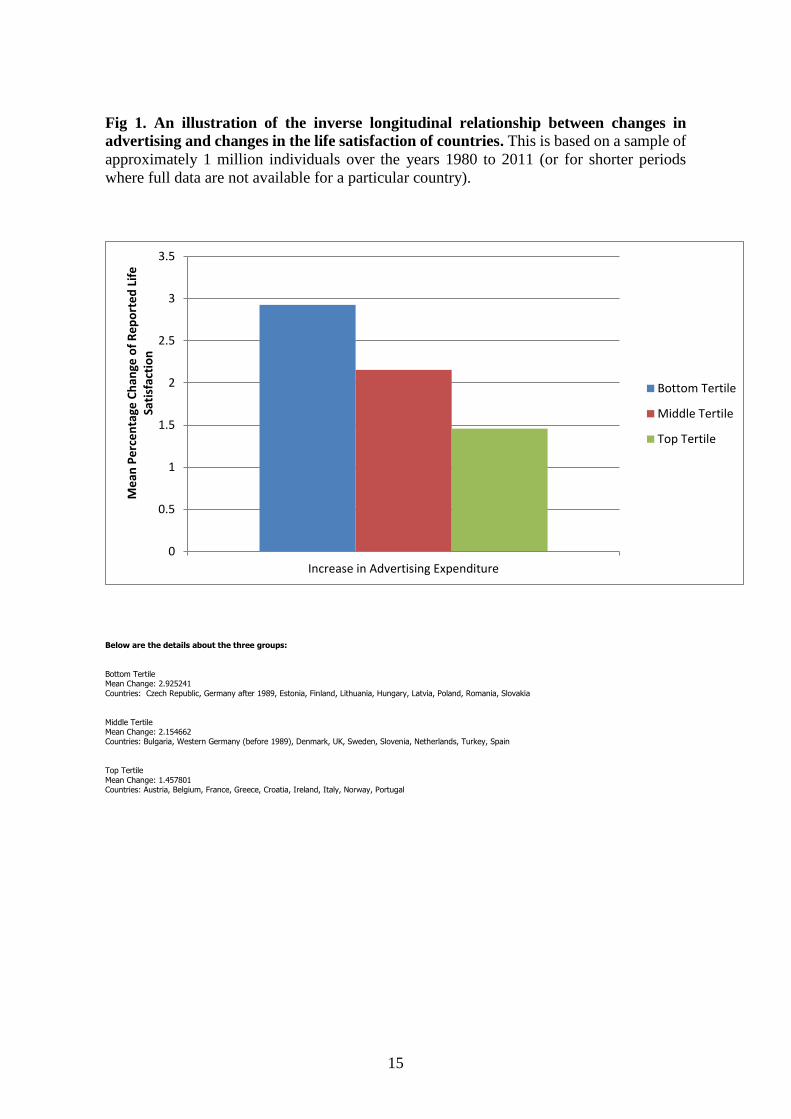
Fig. 1 illustrates the study’s key idea. The figure divides the data into tertiles and then plots
the (uncorrected) relationship between the change in advertising and the change in life
satisfaction. The three vertical bars separate the data into countries that over our period of
study had particularly large increases in advertising expenditure, moderate increases, and
small increases. Figure 1 demonstrates that the greater is the rise in advertising within a
nation, the smaller is any later improvement in life satisfaction.
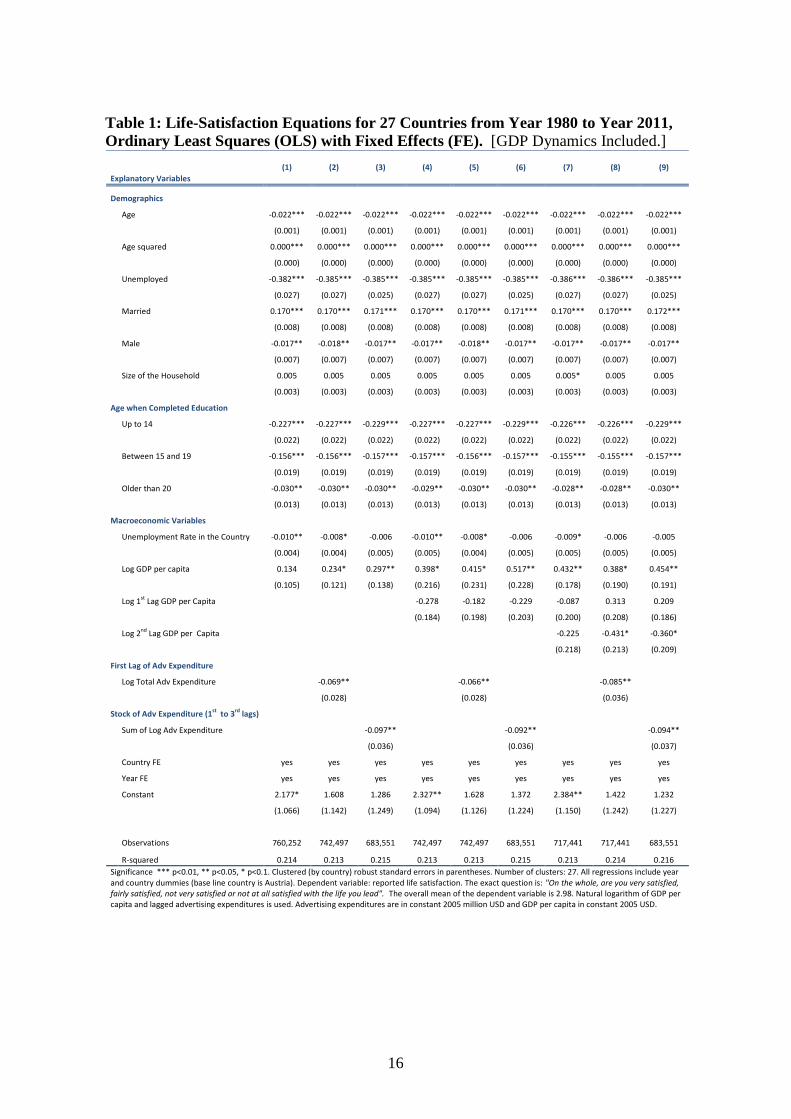
Regression equations in Table 1 provide evidence of a more formal kind. They
6
demonstrate the same type of pattern as in Figure 1. The variable “Adv Expenditure”
measures the level of advertising expenditure in that particular country in that particular
year.
In column 1 of Table 1, the now-standard statistical specification for national
happiness equations (as in DiTella et al, 2001, for example) fits the data in the conventional
way. A variable for the person’s age enters with the quadratic form that is commonly found
in the well-being literature; being married and highly educated are both associated with
greater satisfaction with life; being unemployed is associated with low levels of life
satisfaction; the unemployment rate in the country enters negatively. Interestingly, the
coefficient on GDP is positive but, consistent with Easterlin’s famous ‘paradox’, statistically
weak.
Columns 2 to 9 of Table 1 reveal a correlation between life-satisfaction scores in the
current period with past advertising levels. Table 1 shows what happens when advertising
variables are included within the regression equation, where columns 4 and 7 give the base
results without advertising included. In each case, the advertising variables enter negatively,
with small standard errors (this is after adjustment for potential biases from clustering). In
column 2, for example, the coefficient on the logarithm of advertising expenditure is -0.069
with a standard error of 0.028. This variable is for advertising lagged one period. In column
3, the coefficient on the stock of advertising (measured as the sum of advertising
expenditures over three previous years, again in logarithms) is -0.097 with a standard error
of 0.036.
There is a natural potential criticism of the regression equations in the second and
third columns of Table 1. It is that an advertising variable might in some way be erroneously
standing in for earlier business-cycle movements. The later columns of Table 1 probe that
possibility. In each case, however, the study’s key result appears to be robust. The most
7
general specifications are in columns 8 and 9 of Table 1, but even with three GDP per-capita
terms included (that is, current GDP and two variables for lagged GDP in each of the two
prior years) the advertising variables continue to be negative, statistically significantly
different from zero, and of similar size to that in earlier columns. Hence the advertising
variables seem not to be creating a spurious association that is attributable merely to the
state of the business cycle in any particular year or country.
One noticeable feature of Table 1 is that the estimated GDP coefficients tend to
become somewhat larger after the inclusion of the advertising variables (for example, in
column 2 compared to column 1). This is consistent with the hypothesis that, although rises
in GDP may ceteris paribus be beneficial, the benefits of economic growth are somewhat
offset by a rise in advertising expenditure. Following the tradition in much of the literature
on the economics of advertising (Bain 1956, Bagwell 2001), Table 1 also checks a
specification that uses a variable for the ‘stock of advertising’. This is designed to capture
the idea that commercial organizations spend money on advertising to build up a lasting
brand in the minds of their consumers.
The results reported here allow for the following covariates: age, whether
unemployed, whether married, whether male, size of family, level of education, the
unemployment rate in the country, and GDP-per-capita in the country (for a detailed
specification of these variables, see the SI). Throughout the paper’s tables, variables for
country dummies and year dummies are included. Unlike previous longitudinal studies of
national well-being, the data set has the advantage that it makes it possible to incorporate
measures of advertising expenditure for each country and year.
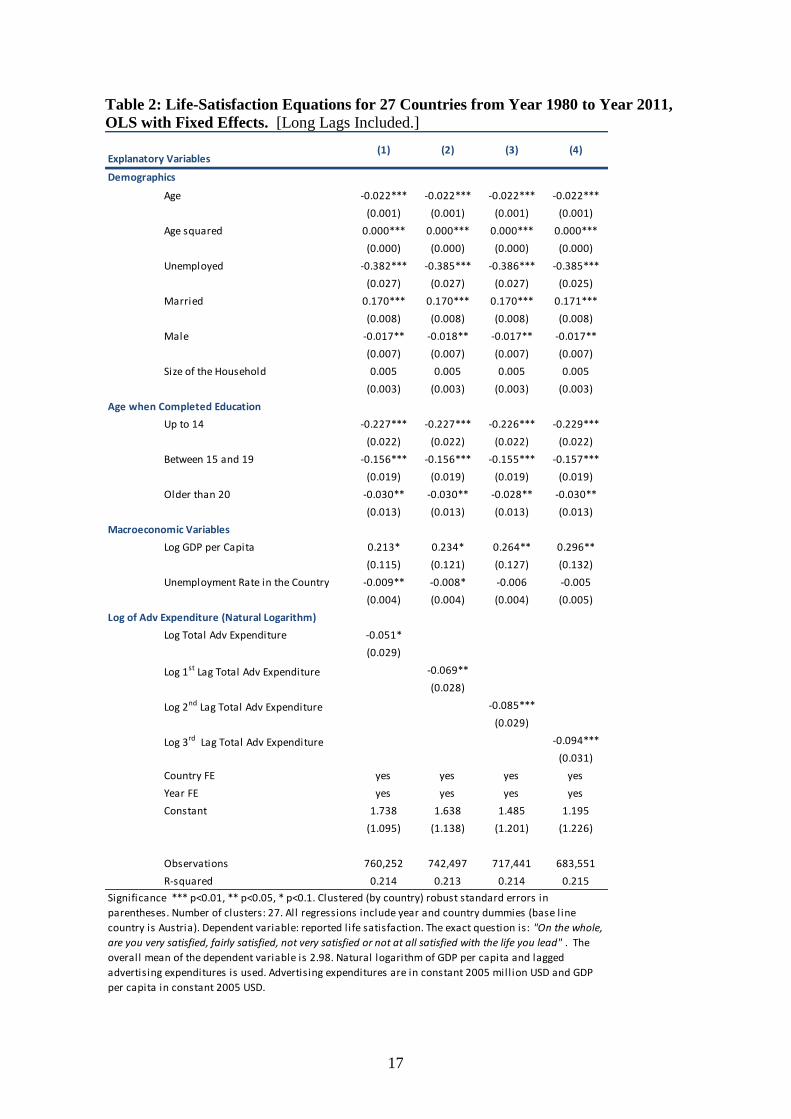
It may take time for advertising to have its effects upon human beings. Table 2
therefore explores a range of lag lengths. The approximate robustness of the original result
is evident: rises in advertising are precursors to declines in well-being. The size of the
8
predictive power of advertising on later life-satisfaction depends on the time lag between
the two variables. Longer lags, as in the right-hand columns of Table 2, are associated with
more-negative estimates.
In these tables the estimated advertising effect-size is substantial. For column 3 of
Table 1, for example, the coefficient on the stock of advertising is -0.097. Because this
variable is in logarithms, the percentage change of life satisfaction with respect to the
percentage change in (the stock of) advertising is approximately -0.03 (this calculation uses
the fact that the mean of life satisfaction is 2.98, which has to be used to divide the number
-0.097), and -0.03 can thus be thought of approximately as the long-run elasticity of national
well-being with respect to advertising spending. This implies, given the assumed
cardinalization, that a hypothetical doubling of advertising expenditure would result in a 3
percent drop in life satisfaction. Around the mean of 2.98, therefore, that 3 percent figure
would translate into a fall of 0.09 life satisfaction points when measured on the one to four
scale used in the Eurobarometer Surveys. That is not minor in size. It is approximately one
half the absolute size of the marriage effect on life satisfaction, or approximately one quarter
of the absolute size of the effect of being unemployed (the coefficient on marriage is 0.17
and that on unemployment is -0.38).
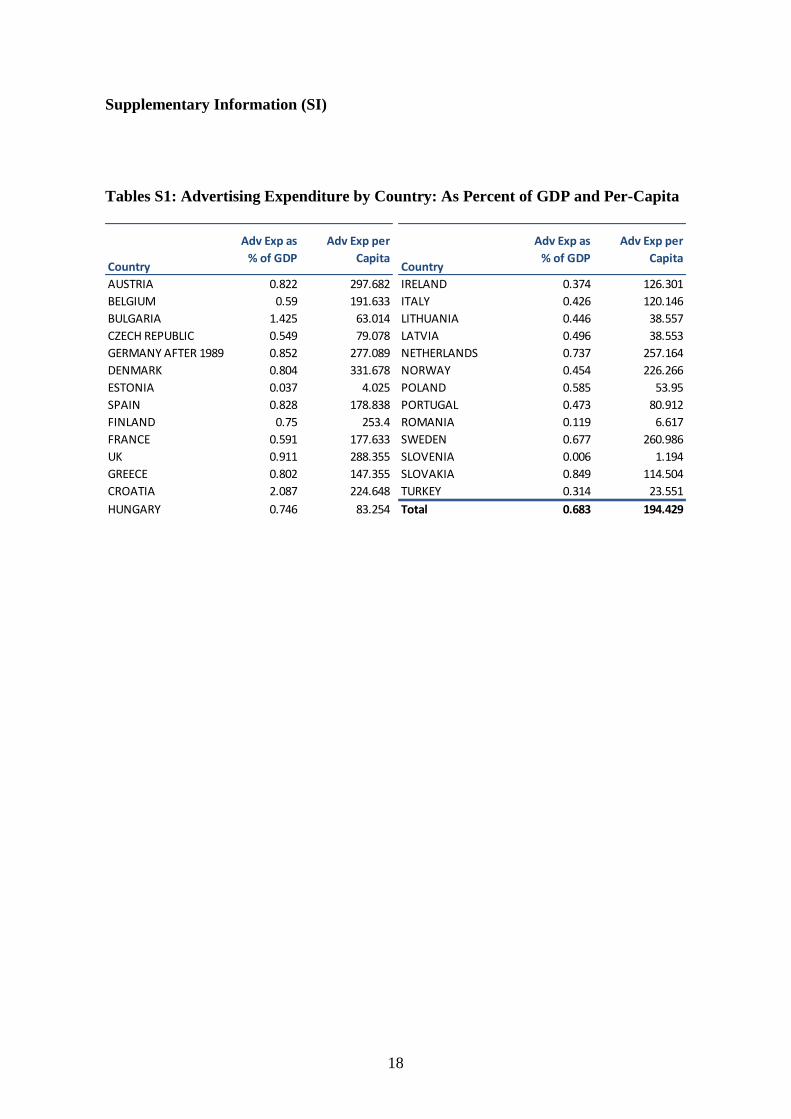
As background, Table S1 in the Supplementary Information summarizes the levels of
advertising expenditure for the different nations. On average, countries spend just under
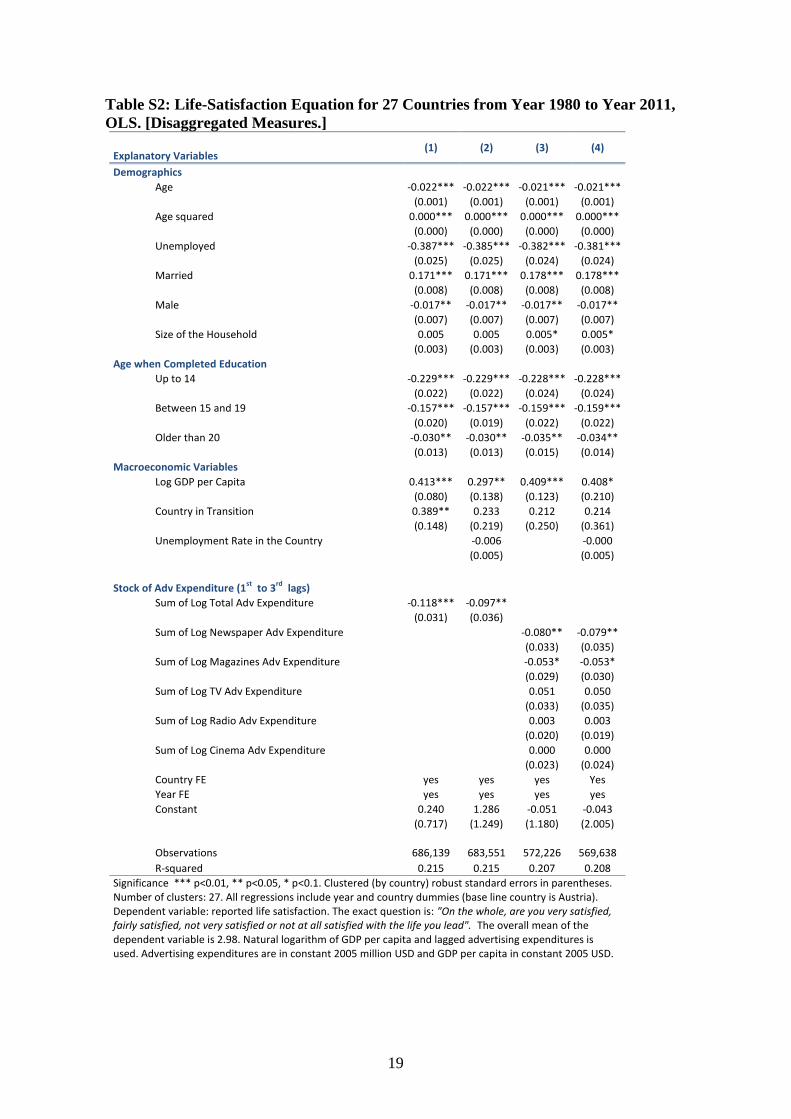
1% of GDP in this way. Table S2 in Supplementary Information presents results for fixed-
effects models in which the kind of advertising expenditure is disaggregated into five
different categories (newspapers, magazines, TV, radio, cinema). It is the first two kinds
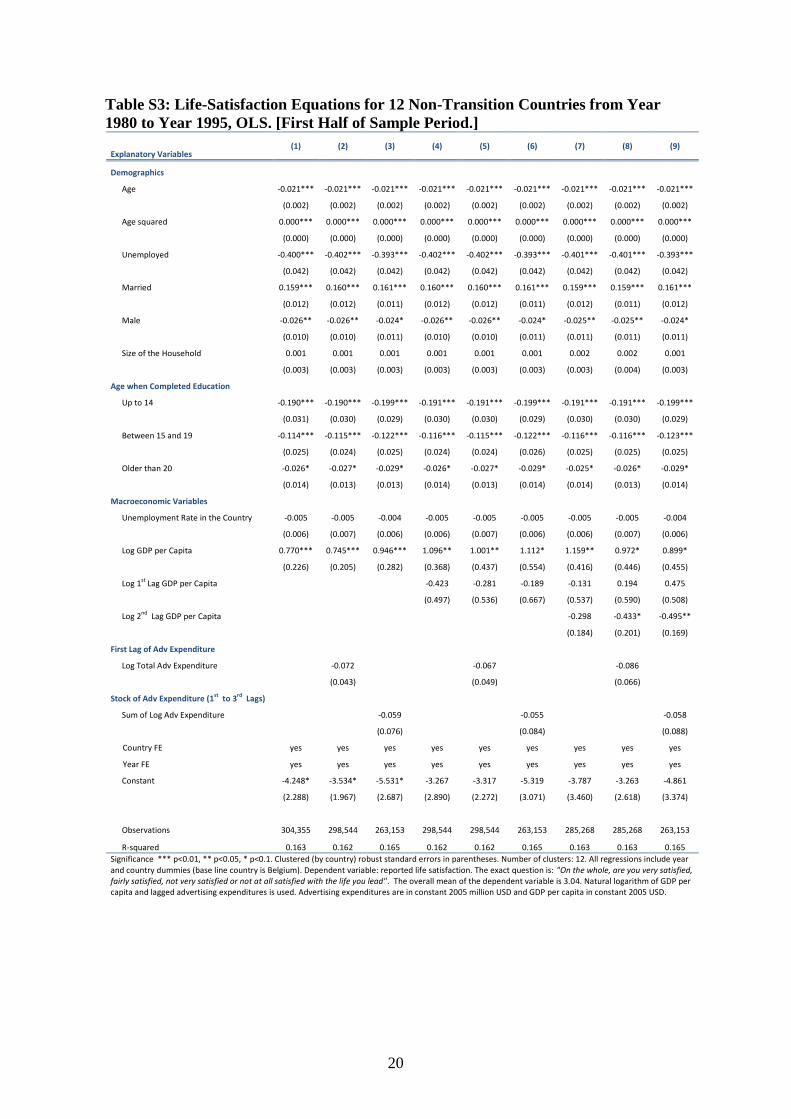
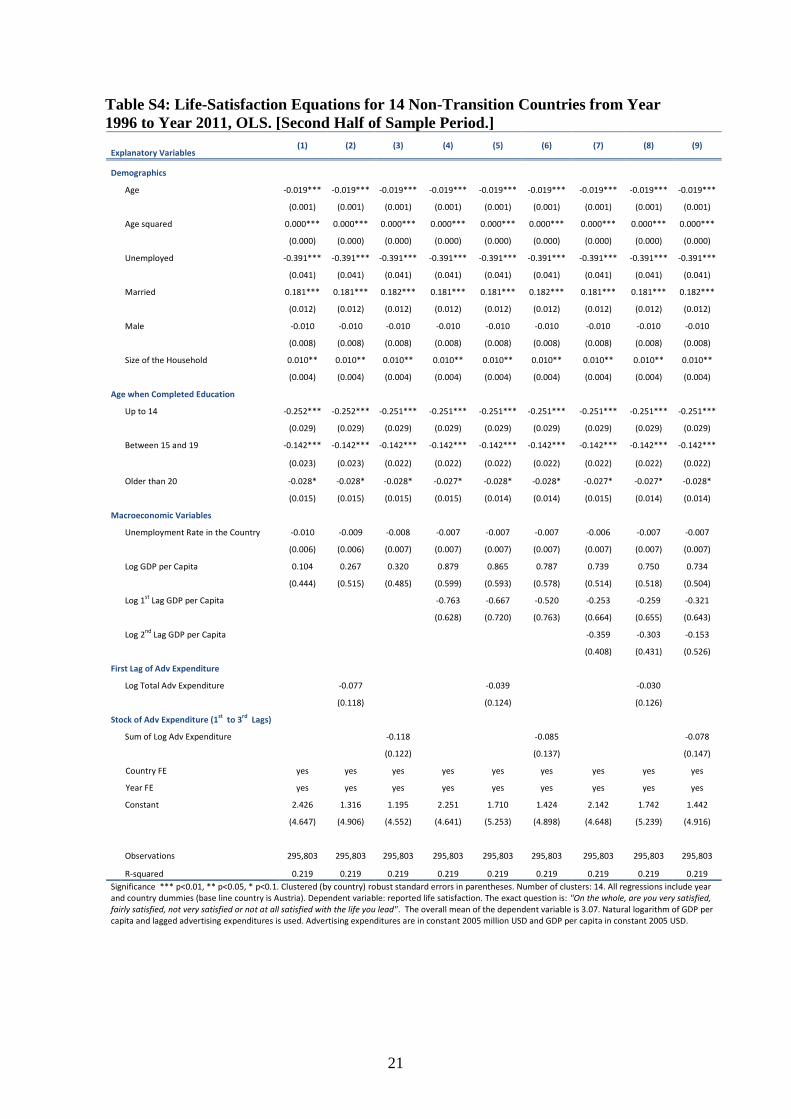
that exhibit large and significant negatives. Tables S3 and S4 show that, dividing the data
period into two halves for the non-transition countries, the coefficient on advertising is fairly
stable across time. This is a check on robustness. Importantly, all twelve of the coefficients,
9
across the two tables, are negative. In Table S3 the advertising coefficient is approximately
-0.06, and in Table S4 it averages to a similar size (though is somewhat smaller for lagged
advertising and bigger for the stock of advertising). Standard errors, of course, are
inevitably larger than for the full sample of thirty years taken as a whole; the appropriate
test is instead for stability in coefficient sizes.
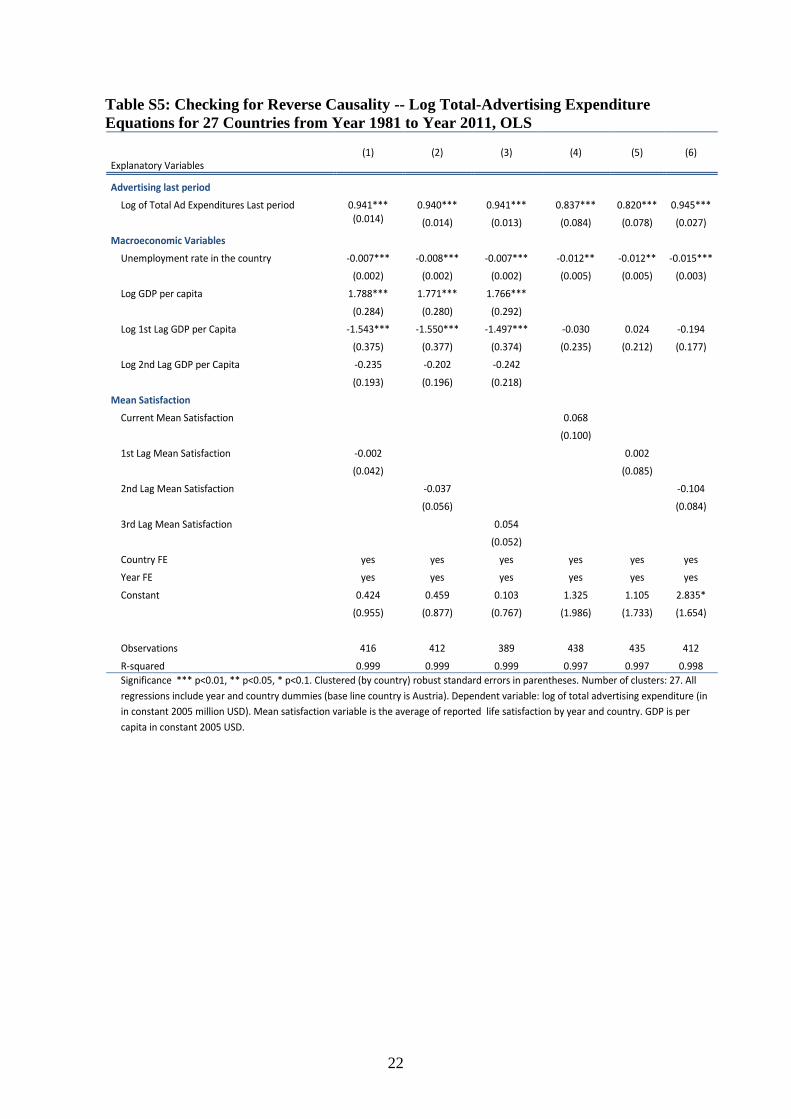
We also check, in the spirit of a Granger-causality test, for possible reverse linkages.
Encouragingly, Table S5 reveals no evidence that lagged values of life satisfaction have
predictive power in an advertising equation.
3. Conclusions
This study explores a potentially important question in social science: how is the well-
being of a nation affected by large-scale advertising? We believe this is the first empirical
study of its kind.
Our results are consistent with societal concerns raised more than a century ago by
authors such as Thorstein Veblen (1904) and Joan Robinson (1933); they are consistent with
arguments discussed by Easterlin (1974, 2003) and in Layard (1980); they may also be
consistent with ideas about the deleterious consequences of materialism (Sirgy et al. 2012,
Burroughs and Rindfleisch 2002, Speck and Roy 2008, and Snyder and Debono 1985).
Rises and falls in advertising expenditure in Europe’s nations have been found here to be
followed by -- respectively -- falls and rises in life-satisfaction levels.
Although much remains to be discovered about genuinely causal mechanisms, there
is evidence of an inverse longitudinal relationship between national advertising and national
dissatisfaction. The estimated effect-size here seems substantial and not merely statistically
well-determined. These issues demand further scrutiny.
10
Appendix on Data and Methods
For this paper, data are taken from three different sources: the Eurobarometer
Survey, Zenith-Optimedia, and the World Bank. The Eurobarometer survey, which began
in 1972, is a set of public opinion surveys conducted on behalf of the European Commission.
Each spring and autumn, face-to-face interviews are conducted for a new sample of residents
of European Union (EU) Member States (around 1000 per country). The questions that
respondents are asked are varied and include items intended to assess life satisfaction, to
elicit opinions about the state of politics in Europe, to gain insight into perceptions of
political institutions, etc. The data recorded in the Eurobarometer are used by the European
Commission to monitor the evolution of public opinion and ultimately to aid in decision
making.
For this study, data are gathered from individuals from 27 countries over the years
1980 to 2011. Specifically, data are available on the following transition European
countries: Bulgaria, Czech Republic, Estonia, Croatia, Hungary, Latvia, Lithuania, Poland,
Romania, Slovenia, Slovakia, and Turkey, and on the following non-transition countries:
Austria, Belgium, Germany, Denmark, Spain, Finland, France, UK, Greece, Ireland, Italy,
Netherlands, Norway, Portugal, and Sweden. The survey contains information on
individual demographics, such as age, gender, education, marital status, employment status,
and household size, as well as life satisfaction indicators. In particular, the survey asks “On
the whole, are you very satisfied, fairly satisfied, not very satisfied or not at all satisfied with
the life you lead?” Answers to this question are available for every year except 1996.
Annual country total advertising expenditure data are available from Zenith-
Optimedia, which is a global media services company. They publish a quarterly report (the
“Advertising Expenditure Forecasts”) that covers advertising from a large number of
markets around the world. This record contains the total amount spent on advertising in the

11
country historically as well as forecasts for the future. Here historical data are used from
1980 to 2011, as reported in the issue “Advertising Expenditure Forecasts of December
2013.” Further details are available in Austin A, Barnard J, Hutcheon N, Advertising
Expenditure Forecasts. Zenith-Optimedia, December 2013.
Macroeconomic indicators are taken from the World Bank. In particular, data are
available by country for the years 1980 to 2011 on GDP, GDP per capita, and the national
unemployment rate. These are published in World Development Indicators. Information is
combined from all three data sources for the same 27 countries and time periods (1980-
2011). The final sample-size for the current study consists of a little over 900,000
observations on randomly sampled European citizens.
The data are used to estimate coefficients from linear regression models, where
robust clustered standard errors are computed to account for the fact that the errors may be
correlated within countries. Life satisfaction scores are regressed on a variety of control
variables as detailed below. Specifically, the main equation that is estimated is
𝐿𝑆𝑖𝑗𝑡 = 𝛼 + 𝛽𝐴𝑑𝑣𝐸𝑥𝑝𝑗𝑡 + Φ𝐷𝑒𝑚𝑜𝑖𝑗𝑡 + Γ𝑀𝑎𝑐𝑟𝑜𝑗𝑡 + 𝜈𝑗 + 𝜂𝑡 + 𝜖𝑖𝑗𝑡 ,
where i denotes an individual, j a country, and t a year. The variable 𝐿𝑆𝑖𝑗𝑡 is reported life
satisfaction, 𝐴𝑑𝑣𝐸𝑥𝑝𝑗𝑡 represents advertising expenditures (measured, in turn, as the lag of
natural logarithm of total advertising expenditure and as the sum of three previous lags of
natural logarithm of total advertising expenditures), the vector 𝐷𝑒𝑚𝑜𝑖𝑗𝑡 contains individual
demographic characteristics (age, education, gender, etc.), and M𝑎𝑐𝑟𝑜𝑗𝑡 is a vector of
macroeconomic variables that may impact life satisfaction, such as the lag of GDP per capita
and the unemployment rate. To control for common country and year attributes, the
statistical analysis allows for country (𝜈𝑗) and time (𝜂𝑡) fixed effects. The 𝜖𝑖𝑗𝑡 term captures
an individual, country, year specific error. A number of different specifications are
estimated as robustness checks.

12
Acknowledgments
Information on how to obtain the Eurobarometer data is available on the European
Commission website http://ec.europa.eu/public_opinion/index_en.htm.
13
References
Andreyeva T, Kelly IR, Inas R, Harris JL (2011) Exposure to food advertising on television:
Associations with children’s fast food and soft drink consumption and obesity.
Economics and Human Biology 9: 221-313.
Bagwell K ed. (2001) The economics of advertising. Edward Elgar Publishing, London.
Bagwell LS, Bernheim BD (1996) Veblen effects in a theory of conspicuous consumption.
American Economic Review 86: 349-373.
Bain J S (1956) Barriers to new competition: Their character and consequences in
manufacturing industries. Harvard University Press, Cambridge MA.
Borzekowski DLG, Robinson TN (2001) The 30-second effect: An experiment revealing
the impact of television commercials on food preferences of preschoolers. Journal of
the American Dietetic Association 101: 42–46.
Buijzen M, Valkenburg PM (2003a) The unintended effects of television advertising: A
parent-child survey. Communication Research 30: 483–503.
Buizjen M, Valkenburg PM (2003b) The effects of television advertising on materialism,
parent-child conflict, and unhappiness: A review of research. Journal of Applied
Developmental Psychology 24: 437-456.
Burroughs JE, Rindfleisch A (2002) Materialism and well-being: A conflicting values
perspective. Journal of Consumer Research 29: 348-370.
Clark AE (2018) Four decades of the economics of happiness: Where next? Review of
Income and Wealth 64: 245-269.
Cowling K, Poolsombat R (2007) Advertising and labour supply: Why do Americans work
such long hours? Warwick Economic Research Paper 789.
Di Tella R, MacCulloch RJ, Oswald AJ (2001) Preferences over inflation and
unemployment: Evidence from surveys of happiness. American Economic Review 91:
335-341.
Di Tella R, MacCulloch RJ, Oswald AJ (2003) The macroeconomics of happiness. Review
of Economics and Statistics 85: 809-827.
Dittmar H, Bond R, Hurst M, et al. (2014) The relationship between materialism and
personal well-being: A meta-analysis. Journal of Personality and Social Psychology
107: 879-924.
Easterlin R.A. (1974) Does economic growth improve the human lot? Some empirical
evidence. In: David PA, Reder MW (Eds.), Nations and households in economic
growth: Essays in honor of Moses Abramowitz. Academic Press: New York; p. 89-
125.
Easterlin RA (2003) Explaining happiness. Proceedings of the National Academy of
Sciences of the USA 100: 11176-11183.
Easterlin RA, Crimmins EM (1991) Private materialism, personal self-fulfillment, family
life, and public interest. Public Opinion Quarterly 55: 499-533.
Frey B, Denesch C, Stutzer A (2007) Does watching TV makes us happy? Journal of
Economic Psychology 28: 283–313.
Harris JL, Bargh JA, Brownell KD (2009) Priming effects of television food advertising on
eating behavior. Health Psychology 28: 404–413.
Layard R (2005) Happiness: Lessons from a new science. Penguin, London.
Layard R (1980) Human satisfactions and public policy. Economic Journal 90: 737-750.
Mujcic R, Oswald AJ (2018) Is envy harmful to a society’s psychological health and
wellbeing? A longitudinal study of 18,000 adults. Social Science & Medicine 198: 103-
111.
14
Opree SJ, Buizjen M, Valkenburg PM (2012) Lower life satisfaction related to materialism
in children frequently exposed to advertising. Pediatrics 130: E486-E491.
Opree SJ, Buizjen M, van Reijmersdal EA (2016) The impact of advertising on children’s
psychological wellbeing and life satisfaction. European Journal of Marketing 50: 1975-
1992.
Oswald AJ (1997) Happiness and economic performance, Economic Journal 107: 1815-
1831.
Radcliff B (2013) The political economy of human happiness: How voters’ choices
determine the quality of life. Cambridge University Press, New York.
Richins ML (1995) Social comparison, advertising, and consumer discontent. American
Behavioural Scientist 28: 593-607.
Robinson J (1933) Economics of imperfect competition. Macmillan, London.
Sirgy MJ, Lee DJ, Kosenko R et al. (1998) Does television viewership play a role in the
perception of quality of life? Journal of Advertising 27: 125-142.
Sirgy JM, Gurel-Atay E, Webb D, et al. (2012) Linking advertising, materialism, and life
satisfaction. Social Indicators Research 107: 79-101.
Snyder M, Debono KG (1985) Appeals to image and claims about quality - Understanding
the psychology of advertising. Journal of Personality and Social Psychology 49: 586-
597.
Speck SK, Roy A (2008) The interrelationships between television viewing, values and
perceived well-being: A global perspective. Journal of International Business Studies
39: 1197-1219.
Speers SE, Harris JL, Schwartz MB (2011) Child and adolescent exposure to food and
beverage brand appearances during prime-time television programming. American
Journal of Preventive Medicine 41: 291–296.
Veblen T (1899) The theory of the leisure class (New York: Macmillan).
Veblen T (1904) The theory of business enterprise (New York: Charles Scribner’s Sons).
15
Fig 1. An illustration of the inverse longitudinal relationship between changes in
advertising and changes in the life satisfaction of countries. This is based on a sample of
approximately 1 million individuals over the years 1980 to 2011 (or for shorter periods
where full data are not available for a particular country).
Below are the details about the three groups:
Bottom Tertile Mean Change: 2.925241
Countries: Czech Republic, Germany after 1989, Estonia, Finland, Lithuania, Hungary, Latvia, Poland, Romania, Slovakia
Middle Tertile Mean Change: 2.154662 Countries: Bulgaria, Western Germany (before 1989), Denmark, UK, Sweden, Slovenia, Netherlands, Turkey, Spain
Top Tertile
Mean Change: 1.457801 Countries: Austria, Belgium, France, Greece, Croatia, Ireland, Italy, Norway, Portugal
0
0.5
1
1.5
2
2.5
3
3.5
Increase in Advertising Expenditure
Me
an P
erc
en
tage
Ch
ange
of
Re
po
rte
d L
ife
Sa
tisf
acti
on
Bottom Tertile
Middle Tertile
Top Tertile
16
Table 1: Life-Satisfaction Equations for 27 Countries from Year 1980 to Year 2011,
Ordinary Least Squares (OLS) with Fixed Effects (FE). [GDP Dynamics Included.]
(1) (2) (3) (4) (5) (6) (7) (8) (9)
Explanatory Variables
Demographics
Age -0.022*** -0.022*** -0.022*** -0.022*** -0.022*** -0.022*** -0.022*** -0.022*** -0.022***
(0.001) (0.001) (0.001) (0.001) (0.001) (0.001) (0.001) (0.001) (0.001)
Age squared 0.000*** 0.000*** 0.000*** 0.000*** 0.000*** 0.000*** 0.000*** 0.000*** 0.000***
(0.000) (0.000) (0.000) (0.000) (0.000) (0.000) (0.000) (0.000) (0.000)
Unemployed -0.382*** -0.385*** -0.385*** -0.385*** -0.385*** -0.385*** -0.386*** -0.386*** -0.385***
(0.027) (0.027) (0.025) (0.027) (0.027) (0.025) (0.027) (0.027) (0.025)
Married 0.170*** 0.170*** 0.171*** 0.170*** 0.170*** 0.171*** 0.170*** 0.170*** 0.172***
(0.008) (0.008) (0.008) (0.008) (0.008) (0.008) (0.008) (0.008) (0.008)
Male -0.017** -0.018** -0.017** -0.017** -0.018** -0.017** -0.017** -0.017** -0.017**
(0.007) (0.007) (0.007) (0.007) (0.007) (0.007) (0.007) (0.007) (0.007)
Size of the Household 0.005 0.005 0.005 0.005 0.005 0.005 0.005* 0.005 0.005
(0.003) (0.003) (0.003) (0.003) (0.003) (0.003) (0.003) (0.003) (0.003)
Age when Completed Education
Up to 14 -0.227*** -0.227*** -0.229*** -0.227*** -0.227*** -0.229*** -0.226*** -0.226*** -0.229***
(0.022) (0.022) (0.022) (0.022) (0.022) (0.022) (0.022) (0.022) (0.022)
Between 15 and 19 -0.156*** -0.156*** -0.157*** -0.157*** -0.156*** -0.157*** -0.155*** -0.155*** -0.157***
(0.019) (0.019) (0.019) (0.019) (0.019) (0.019) (0.019) (0.019) (0.019)
Older than 20 -0.030** -0.030** -0.030** -0.029** -0.030** -0.030** -0.028** -0.028** -0.030**
(0.013) (0.013) (0.013) (0.013) (0.013) (0.013) (0.013) (0.013) (0.013)
Macroeconomic Variables
Unemployment Rate in the Country -0.010** -0.008* -0.006 -0.010** -0.008* -0.006 -0.009* -0.006 -0.005
(0.004) (0.004) (0.005) (0.005) (0.004) (0.005) (0.005) (0.005) (0.005)
Log GDP per capita 0.134 0.234* 0.297** 0.398* 0.415* 0.517** 0.432** 0.388* 0.454**
(0.105) (0.121) (0.138) (0.216) (0.231) (0.228) (0.178) (0.190) (0.191)
Log 1st Lag GDP per Capita
-0.278 -0.182 -0.229 -0.087 0.313 0.209
(0.184) (0.198) (0.203) (0.200) (0.208) (0.186)
Log 2nd Lag GDP per Capita
-0.225 -0.431* -0.360*
(0.218) (0.213) (0.209)
First Lag of Adv Expenditure
Log Total Adv Expenditure
-0.069**
-0.066**
-0.085**
(0.028)
(0.028)
(0.036)
Stock of Adv Expenditure (1st to 3rd lags)
Sum of Log Adv Expenditure
-0.097**
-0.092**
-0.094**
(0.036)
(0.036)
(0.037)
Country FE yes yes yes yes yes yes yes yes yes
Year FE yes yes yes yes yes yes yes yes yes
Constant 2.177* 1.608 1.286 2.327** 1.628 1.372 2.384** 1.422 1.232
(1.066) (1.142) (1.249) (1.094) (1.126) (1.224) (1.150) (1.242) (1.227)
Observations 760,252 742,497 683,551 742,497 742,497 683,551 717,441 717,441 683,551
R-squared 0.214 0.213 0.215 0.213 0.213 0.215 0.213 0.214 0.216
Significance *** p<0.01, ** p<0.05, * p<0.1. Clustered (by country) robust standard errors in parentheses. Number of clusters: 27. All regressions include year and country dummies (base line country is Austria). Dependent variable: reported life satisfaction. The exact question is: "On the whole, are you very satisfied, fairly satisfied, not very satisfied or not at all satisfied with the life you lead". The overall mean of the dependent variable is 2.98. Natural logarithm of GDP per capita and lagged advertising expenditures is used. Advertising expenditures are in constant 2005 million USD and GDP per capita in constant 2005 USD.
17
Table 2: Life-Satisfaction Equations for 27 Countries from Year 1980 to Year 2011,
OLS with Fixed Effects. [Long Lags Included.]
Age -0.022*** -0.022*** -0.022*** -0.022***
(0.001) (0.001) (0.001) (0.001)
Age squared 0.000*** 0.000*** 0.000*** 0.000***
(0.000) (0.000) (0.000) (0.000)
Unemployed -0.382*** -0.385*** -0.386*** -0.385***
(0.027) (0.027) (0.027) (0.025)
Married 0.170*** 0.170*** 0.170*** 0.171***
(0.008) (0.008) (0.008) (0.008)
Male -0.017** -0.018** -0.017** -0.017**
(0.007) (0.007) (0.007) (0.007)
Size of the Household 0.005 0.005 0.005 0.005
(0.003) (0.003) (0.003) (0.003)
Up to 14 -0.227*** -0.227*** -0.226*** -0.229***
(0.022) (0.022) (0.022) (0.022)
Between 15 and 19 -0.156*** -0.156*** -0.155*** -0.157***
(0.019) (0.019) (0.019) (0.019)
Older than 20 -0.030** -0.030** -0.028** -0.030**
(0.013) (0.013) (0.013) (0.013)
Log GDP per Capita 0.213* 0.234* 0.264** 0.296**
(0.115) (0.121) (0.127) (0.132)
Unemployment Rate in the Country -0.009** -0.008* -0.006 -0.005
(0.004) (0.004) (0.004) (0.005)
Log Total Adv Expenditure -0.051*
(0.029)
Log 1st Lag Total Adv Expenditure -0.069**
(0.028)
Log 2nd Lag Total Adv Expenditure -0.085***
(0.029)
Log 3rd Lag Total Adv Expenditure -0.094***
(0.031)
Country FE yes yes yes yes
Year FE yes yes yes yes
Constant 1.738 1.638 1.485 1.195
(1.095) (1.138) (1.201) (1.226)
Observations 760,252 742,497 717,441 683,551
R-squared 0.214 0.213 0.214 0.215
(4)
Demographics
Age when Completed Education
Macroeconomic Variables
Log of Adv Expenditure (Natural Logarithm)
Significance *** p<0.01, ** p<0.05, * p<0.1. Clustered (by country) robust standard errors in
parentheses. Number of clusters: 27. All regressions include year and country dummies (base line
country is Austria). Dependent variable: reported life satisfaction. The exact question is: "On the whole,
are you very satisfied, fairly satisfied, not very satisfied or not at all satisfied with the life you lead" . The
overall mean of the dependent variable is 2.98. Natural logarithm of GDP per capita and lagged
advertising expenditures is used. Advertising expenditures are in constant 2005 mill ion USD and GDP
per capita in constant 2005 USD.
Explanatory Variables(1) (2) (3)
18
Supplementary Information (SI)
Tables S1: Advertising Expenditure by Country: As Percent of GDP and Per-Capita
Country Country
AUSTRIA 0.822 297.682 IRELAND 0.374 126.301
BELGIUM 0.59 191.633 ITALY 0.426 120.146
BULGARIA 1.425 63.014 LITHUANIA 0.446 38.557
CZECH REPUBLIC 0.549 79.078 LATVIA 0.496 38.553
GERMANY AFTER 1989 0.852 277.089 NETHERLANDS 0.737 257.164
DENMARK 0.804 331.678 NORWAY 0.454 226.266
ESTONIA 0.037 4.025 POLAND 0.585 53.95
SPAIN 0.828 178.838 PORTUGAL 0.473 80.912
FINLAND 0.75 253.4 ROMANIA 0.119 6.617
FRANCE 0.591 177.633 SWEDEN 0.677 260.986
UK 0.911 288.355 SLOVENIA 0.006 1.194
GREECE 0.802 147.355 SLOVAKIA 0.849 114.504
CROATIA 2.087 224.648 TURKEY 0.314 23.551
HUNGARY 0.746 83.254 Total 0.683 194.429
Adv Exp as
% of GDP
Adv Exp per
Capita
Adv Exp as
% of GDP
Adv Exp per
Capita
19
Table S2: Life-Satisfaction Equation for 27 Countries from Year 1980 to Year 2011,
OLS. [Disaggregated Measures.]
(1) (2) (3) (4)
Explanatory Variables
Demographics
Age -0.022*** -0.022*** -0.021*** -0.021***
(0.001) (0.001) (0.001) (0.001)
Age squared 0.000*** 0.000*** 0.000*** 0.000***
(0.000) (0.000) (0.000) (0.000)
Unemployed -0.387*** -0.385*** -0.382*** -0.381***
(0.025) (0.025) (0.024) (0.024)
Married 0.171*** 0.171*** 0.178*** 0.178***
(0.008) (0.008) (0.008) (0.008)
Male -0.017** -0.017** -0.017** -0.017**
(0.007) (0.007) (0.007) (0.007)
Size of the Household 0.005 0.005 0.005* 0.005*
(0.003) (0.003) (0.003) (0.003)
Age when Completed Education
Up to 14 -0.229*** -0.229*** -0.228*** -0.228***
(0.022) (0.022) (0.024) (0.024)
Between 15 and 19 -0.157*** -0.157*** -0.159*** -0.159***
(0.020) (0.019) (0.022) (0.022)
Older than 20 -0.030** -0.030** -0.035** -0.034**
(0.013) (0.013) (0.015) (0.014)
Macroeconomic Variables
Log GDP per Capita 0.413*** 0.297** 0.409*** 0.408*
(0.080) (0.138) (0.123) (0.210)
Country in Transition 0.389** 0.233 0.212 0.214
(0.148) (0.219) (0.250) (0.361)
Unemployment Rate in the Country
-0.006
-0.000
(0.005)
(0.005)
Stock of Adv Expenditure (1st
to 3rd
lags)
Sum of Log Total Adv Expenditure -0.118*** -0.097**
(0.031) (0.036)
Sum of Log Newspaper Adv Expenditure
-0.080** -0.079**
(0.033) (0.035)
Sum of Log Magazines Adv Expenditure
-0.053* -0.053*
(0.029) (0.030)
Sum of Log TV Adv Expenditure
0.051 0.050
(0.033) (0.035)
Sum of Log Radio Adv Expenditure
0.003 0.003
(0.020) (0.019)
Sum of Log Cinema Adv Expenditure
0.000 0.000
(0.023) (0.024)
Country FE yes yes yes Yes
Year FE yes yes yes yes
Constant 0.240 1.286 -0.051 -0.043
(0.717) (1.249) (1.180) (2.005)
Observations 686,139 683,551 572,226 569,638
R-squared 0.215 0.215 0.207 0.208
Significance *** p<0.01, ** p<0.05, * p<0.1. Clustered (by country) robust standard errors in parentheses. Number of clusters: 27. All regressions include year and country dummies (base line country is Austria). Dependent variable: reported life satisfaction. The exact question is: "On the whole, are you very satisfied, fairly satisfied, not very satisfied or not at all satisfied with the life you lead". The overall mean of the dependent variable is 2.98. Natural logarithm of GDP per capita and lagged advertising expenditures is used. Advertising expenditures are in constant 2005 million USD and GDP per capita in constant 2005 USD.
20
Table S3: Life-Satisfaction Equations for 12 Non-Transition Countries from Year
1980 to Year 1995, OLS. [First Half of Sample Period.]
Explanatory Variables (1) (2) (3) (4) (5) (6) (7) (8) (9)
Demographics
Age -0.021*** -0.021*** -0.021*** -0.021*** -0.021*** -0.021*** -0.021*** -0.021*** -0.021***
(0.002) (0.002) (0.002) (0.002) (0.002) (0.002) (0.002) (0.002) (0.002)
Age squared 0.000*** 0.000*** 0.000*** 0.000*** 0.000*** 0.000*** 0.000*** 0.000*** 0.000***
(0.000) (0.000) (0.000) (0.000) (0.000) (0.000) (0.000) (0.000) (0.000)
Unemployed -0.400*** -0.402*** -0.393*** -0.402*** -0.402*** -0.393*** -0.401*** -0.401*** -0.393***
(0.042) (0.042) (0.042) (0.042) (0.042) (0.042) (0.042) (0.042) (0.042)
Married 0.159*** 0.160*** 0.161*** 0.160*** 0.160*** 0.161*** 0.159*** 0.159*** 0.161***
(0.012) (0.012) (0.011) (0.012) (0.012) (0.011) (0.012) (0.011) (0.012)
Male -0.026** -0.026** -0.024* -0.026** -0.026** -0.024* -0.025** -0.025** -0.024*
(0.010) (0.010) (0.011) (0.010) (0.010) (0.011) (0.011) (0.011) (0.011)
Size of the Household 0.001 0.001 0.001 0.001 0.001 0.001 0.002 0.002 0.001
(0.003) (0.003) (0.003) (0.003) (0.003) (0.003) (0.003) (0.004) (0.003)
Age when Completed Education
Up to 14 -0.190*** -0.190*** -0.199*** -0.191*** -0.191*** -0.199*** -0.191*** -0.191*** -0.199***
(0.031) (0.030) (0.029) (0.030) (0.030) (0.029) (0.030) (0.030) (0.029)
Between 15 and 19 -0.114*** -0.115*** -0.122*** -0.116*** -0.115*** -0.122*** -0.116*** -0.116*** -0.123***
(0.025) (0.024) (0.025) (0.024) (0.024) (0.026) (0.025) (0.025) (0.025)
Older than 20 -0.026* -0.027* -0.029* -0.026* -0.027* -0.029* -0.025* -0.026* -0.029*
(0.014) (0.013) (0.013) (0.014) (0.013) (0.014) (0.014) (0.013) (0.014)
Macroeconomic Variables
Unemployment Rate in the Country -0.005 -0.005 -0.004 -0.005 -0.005 -0.005 -0.005 -0.005 -0.004
(0.006) (0.007) (0.006) (0.006) (0.007) (0.006) (0.006) (0.007) (0.006)
Log GDP per Capita 0.770*** 0.745*** 0.946*** 1.096** 1.001** 1.112* 1.159** 0.972* 0.899*
(0.226) (0.205) (0.282) (0.368) (0.437) (0.554) (0.416) (0.446) (0.455)
Log 1st Lag GDP per Capita
-0.423 -0.281 -0.189 -0.131 0.194 0.475
(0.497) (0.536) (0.667) (0.537) (0.590) (0.508)
Log 2nd Lag GDP per Capita
-0.298 -0.433* -0.495**
(0.184) (0.201) (0.169)
First Lag of Adv Expenditure
Log Total Adv Expenditure
-0.072
-0.067
-0.086
(0.043)
(0.049)
(0.066)
Stock of Adv Expenditure (1st to 3rd Lags)
Sum of Log Adv Expenditure
-0.059
-0.055
-0.058
(0.076)
(0.084)
(0.088)
Country FE yes yes yes yes yes yes yes yes yes
Year FE yes yes yes yes yes yes yes yes yes
Constant -4.248* -3.534* -5.531* -3.267 -3.317 -5.319 -3.787 -3.263 -4.861
(2.288) (1.967) (2.687) (2.890) (2.272) (3.071) (3.460) (2.618) (3.374)
Observations 304,355 298,544 263,153 298,544 298,544 263,153 285,268 285,268 263,153
R-squared 0.163 0.162 0.165 0.162 0.162 0.165 0.163 0.163 0.165
Significance *** p<0.01, ** p<0.05, * p<0.1. Clustered (by country) robust standard errors in parentheses. Number of clusters: 12. All regressions include year and country dummies (base line country is Belgium). Dependent variable: reported life satisfaction. The exact question is: "On the whole, are you very satisfied, fairly satisfied, not very satisfied or not at all satisfied with the life you lead". The overall mean of the dependent variable is 3.04. Natural logarithm of GDP per capita and lagged advertising expenditures is used. Advertising expenditures are in constant 2005 million USD and GDP per capita in constant 2005 USD.
21
Table S4: Life-Satisfaction Equations for 14 Non-Transition Countries from Year
1996 to Year 2011, OLS. [Second Half of Sample Period.]
Explanatory Variables (1) (2) (3) (4) (5) (6) (7) (8) (9)
Demographics
Age -0.019*** -0.019*** -0.019*** -0.019*** -0.019*** -0.019*** -0.019*** -0.019*** -0.019***
(0.001) (0.001) (0.001) (0.001) (0.001) (0.001) (0.001) (0.001) (0.001)
Age squared 0.000*** 0.000*** 0.000*** 0.000*** 0.000*** 0.000*** 0.000*** 0.000*** 0.000***
(0.000) (0.000) (0.000) (0.000) (0.000) (0.000) (0.000) (0.000) (0.000)
Unemployed -0.391*** -0.391*** -0.391*** -0.391*** -0.391*** -0.391*** -0.391*** -0.391*** -0.391***
(0.041) (0.041) (0.041) (0.041) (0.041) (0.041) (0.041) (0.041) (0.041)
Married 0.181*** 0.181*** 0.182*** 0.181*** 0.181*** 0.182*** 0.181*** 0.181*** 0.182***
(0.012) (0.012) (0.012) (0.012) (0.012) (0.012) (0.012) (0.012) (0.012)
Male -0.010 -0.010 -0.010 -0.010 -0.010 -0.010 -0.010 -0.010 -0.010
(0.008) (0.008) (0.008) (0.008) (0.008) (0.008) (0.008) (0.008) (0.008)
Size of the Household 0.010** 0.010** 0.010** 0.010** 0.010** 0.010** 0.010** 0.010** 0.010**
(0.004) (0.004) (0.004) (0.004) (0.004) (0.004) (0.004) (0.004) (0.004)
Age when Completed Education
Up to 14 -0.252*** -0.252*** -0.251*** -0.251*** -0.251*** -0.251*** -0.251*** -0.251*** -0.251***
(0.029) (0.029) (0.029) (0.029) (0.029) (0.029) (0.029) (0.029) (0.029)
Between 15 and 19 -0.142*** -0.142*** -0.142*** -0.142*** -0.142*** -0.142*** -0.142*** -0.142*** -0.142***
(0.023) (0.023) (0.022) (0.022) (0.022) (0.022) (0.022) (0.022) (0.022)
Older than 20 -0.028* -0.028* -0.028* -0.027* -0.028* -0.028* -0.027* -0.027* -0.028*
(0.015) (0.015) (0.015) (0.015) (0.014) (0.014) (0.015) (0.014) (0.014)
Macroeconomic Variables
Unemployment Rate in the Country -0.010 -0.009 -0.008 -0.007 -0.007 -0.007 -0.006 -0.007 -0.007
(0.006) (0.006) (0.007) (0.007) (0.007) (0.007) (0.007) (0.007) (0.007)
Log GDP per Capita 0.104 0.267 0.320 0.879 0.865 0.787 0.739 0.750 0.734
(0.444) (0.515) (0.485) (0.599) (0.593) (0.578) (0.514) (0.518) (0.504)
Log 1st Lag GDP per Capita
-0.763 -0.667 -0.520 -0.253 -0.259 -0.321
(0.628) (0.720) (0.763) (0.664) (0.655) (0.643)
Log 2
nd Lag GDP per Capita
-0.359 -0.303 -0.153
(0.408) (0.431) (0.526)
First Lag of Adv Expenditure
Log Total Adv Expenditure
-0.077
-0.039
-0.030
(0.118)
(0.124)
(0.126)
Stock of Adv Expenditure (1st to 3rd Lags)
Sum of Log Adv Expenditure
-0.118
-0.085
-0.078
(0.122)
(0.137)
(0.147)
Country FE yes yes yes yes yes yes yes yes yes
Year FE yes yes yes yes yes yes yes yes yes
Constant 2.426 1.316 1.195 2.251 1.710 1.424 2.142 1.742 1.442
(4.647) (4.906) (4.552) (4.641) (5.253) (4.898) (4.648) (5.239) (4.916)
Observations 295,803 295,803 295,803 295,803 295,803 295,803 295,803 295,803 295,803
R-squared 0.219 0.219 0.219 0.219 0.219 0.219 0.219 0.219 0.219
Significance *** p<0.01, ** p<0.05, * p<0.1. Clustered (by country) robust standard errors in parentheses. Number of clusters: 14. All regressions include year and country dummies (base line country is Austria). Dependent variable: reported life satisfaction. The exact question is: "On the whole, are you very satisfied, fairly satisfied, not very satisfied or not at all satisfied with the life you lead". The overall mean of the dependent variable is 3.07. Natural logarithm of GDP per capita and lagged advertising expenditures is used. Advertising expenditures are in constant 2005 million USD and GDP per capita in constant 2005 USD.
22
Table S5: Checking for Reverse Causality -- Log Total-Advertising Expenditure
Equations for 27 Countries from Year 1981 to Year 2011, OLS
(1) (2) (3) (4) (5) (6) Explanatory Variables
Advertising last period
Log of Total Ad Expenditures Last period 0.941*** 0.940*** 0.941*** 0.837*** 0.820*** 0.945***
(0.014) (0.014) (0.013) (0.084) (0.078) (0.027)
Macroeconomic Variables
Unemployment rate in the country -0.007*** -0.008*** -0.007*** -0.012** -0.012** -0.015***
(0.002) (0.002) (0.002) (0.005) (0.005) (0.003)
Log GDP per capita 1.788*** 1.771*** 1.766***
(0.284) (0.280) (0.292)
Log 1st Lag GDP per Capita -1.543*** -1.550*** -1.497*** -0.030 0.024 -0.194
(0.375) (0.377) (0.374) (0.235) (0.212) (0.177)
Log 2nd Lag GDP per Capita -0.235 -0.202 -0.242
(0.193) (0.196) (0.218)
Mean Satisfaction
Current Mean Satisfaction
0.068
(0.100)
1st Lag Mean Satisfaction -0.002
0.002
(0.042)
(0.085)
2nd Lag Mean Satisfaction -0.037
-0.104
(0.056)
(0.084)
3rd Lag Mean Satisfaction
0.054
(0.052)
Country FE yes yes yes yes yes yes
Year FE yes yes yes yes yes yes
Constant 0.424 0.459 0.103 1.325 1.105 2.835*
(0.955) (0.877) (0.767) (1.986) (1.733) (1.654)
Observations 416 412 389 438 435 412
R-squared 0.999 0.999 0.999 0.997 0.997 0.998
Significance *** p<0.01, ** p<0.05, * p<0.1. Clustered (by country) robust standard errors in parentheses. Number of clusters: 27. All
regressions include year and country dummies (base line country is Austria). Dependent variable: log of total advertising expenditure (in
in constant 2005 million USD). Mean satisfaction variable is the average of reported life satisfaction by year and country. GDP is per
capita in constant 2005 USD.

23
Table S6: Descriptive Statistics for the Regression-Equation Explanatory Variables
Mean Standard Deviation
Min Max Observations
Demographics
Age 44.675 18.161 15 99 1321739
Unemployed 0.066 0.249 0 1 1347518
Married 0.612 0.487 0 1 1252627
Male 0.473 0.499 0 1 1353045
Size of the Household 2.903 1.491 1 9 1181314
Age when completed education*
Up to 14 0.214 0.410 0 1 1239393
Between 15 and 19 0.463 0.499 0 1 1239393
Older than 20 0.229 0.420 0 1 1239393
Macroeconomic Variables
Unemployment Rate 8.875 3.818 2.5 23.9 1295463
GDP per Capita 27988.23 10590.15 3553.93 54599.3 1330368
*excluded category is “still studying”


![Experience Dissatisfaction[1]](https://img.pdfslide.net/doc/110x75/577ce6361a28abf1039261dd/experience-dissatisfaction1.jpg)