Embed Size (px)
Citation preview

1 © 2017 Ipsos.
AFRICAN LIONS Frequently Asked Questions
Project ChampionSamantha Payne
[email protected] 400 8888

2 © 2017 Ipsos.
List of Questions1. What is the study about?
2. Which cities were researched?
3. What methodology was used?
4. What does each city report cover?
5. What methodology was used to segment the middle
class?
6. Who are the middle class?
7. How do I get access to the research?
8. Are there any important dates to be aware of?
9. Who should I contact?

3 © 2017 Ipsos.
A bold research study originated by the University of Cape Town Unilever Institute of Strategic Marketing
in partnership with Ipsos
The broad objective was to define and quantify aspects of the African
Middle Class/Afropolitan sector across the continent, but specifically within
10 key cities. This includes the demographics, growth trends, technology
use, decision-making and aspirations, lifestyle and spending choices, cultural
and traditional influences of the people; as well as market challenges, local
complexities, local case studies and consumption patterns, within each city
4 © 2017 Ipsos.
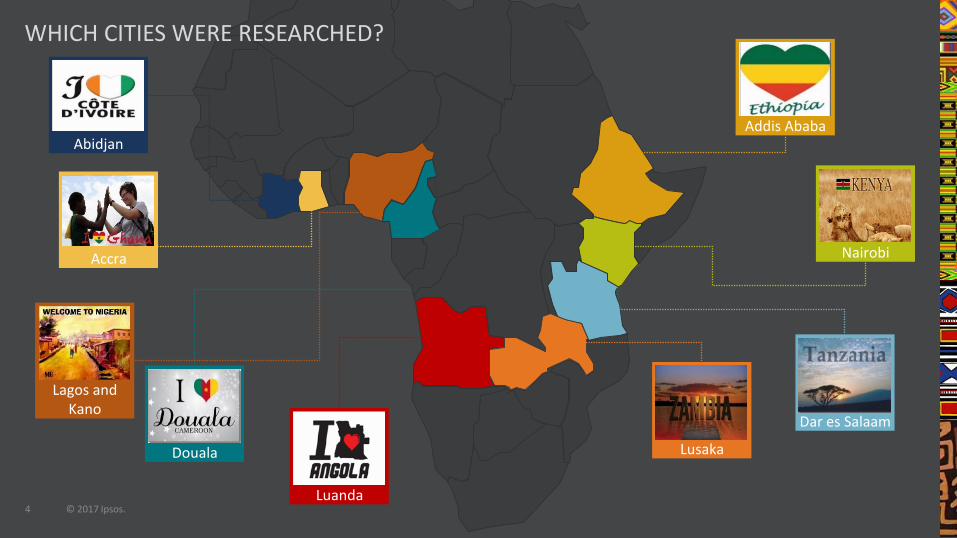
Abidjan
Accra
Lagos and Kano
Douala
Luanda
Lusaka
Dar es Salaam
Nairobi
Addis Ababa
WHICH CITIES WERE RESEARCHED?

5 © 2017 Ipsos.
QUAL, QUANT & ETHNOQualitative Research: Ipsos Mobile offer Applife and WhatsApp groups followed by 3 focus groups sessions in each city participating in actual respondent events like weddings, outings, groups meetings etc.Quantitative Research: 60 minute questionnaire with 750 people in each cityEthnography Research: video interviews in each city with respondents in each segment along with ‘day in the life of’ clips
DESK RESEARCH
Review of available data, academic papers and other literature. This information has been collated to help answer some of the fundamental questions about size and growth of the Sub-Saharan Middle Class. These include IEU data, recent analysis by Standard Bank, Ipsos and others.
1. Population, age, gender and employment2. Income distribution3. Where is this middle class? Which countries and cities are these consumers concentrated in?4. The size and shape of the African City Middle Class5. Growth potential for Sub Saharan middle class6. Size of formal and informal retail markets
BRAINSTORMING
Interrogation of our findings to isolate meaningful insights for marketers. This included several workshops with leading thinkers and partners on the project.
Conducted ‘expert interviews’ with local thought leaders, academics and businesses.
A second avenue of exploration included case studies, where we examined examples of successful marketing strategies as well as failures.

6 © 2017 Ipsos.
Approach: Methodology and sample
Segments
Demographic profile and household structure
Individual and household financial reality
Nutrition and health
Interaction with technology
Psychographic similarities amongst African Lions
Background and objectives: Contextualising the study
Shopping and spending
Brand relationships
Media usage and communication
Concluding thoughts
Appendix
REPORT COVERAGE
African Lions
1 23
4
56
78910
1112
13
7 © 2017 Ipsos.
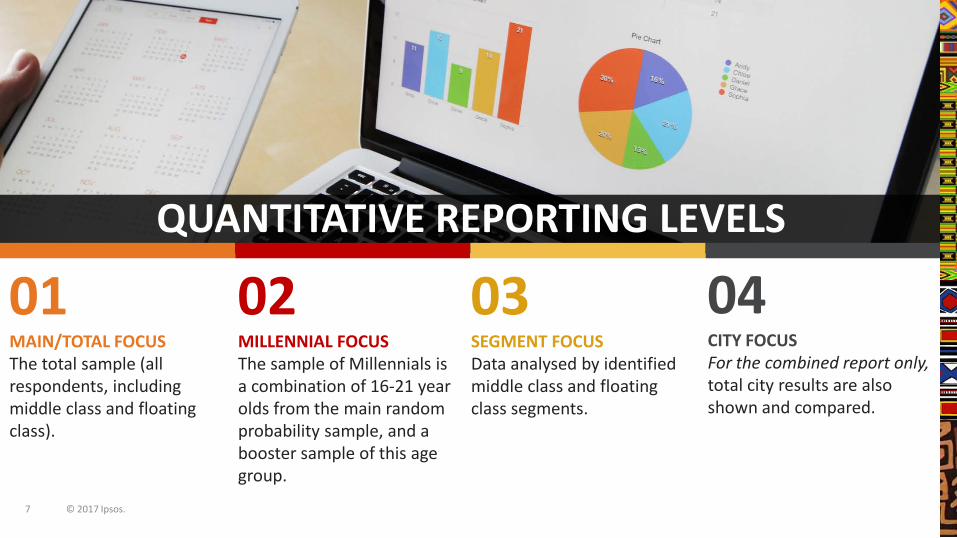
QUANTITATIVE REPORTING LEVELS
01MAIN/TOTAL FOCUSThe total sample (all respondents, including middle class and floating class).
02MILLENNIAL FOCUSThe sample of Millennials is a combination of 16-21 year olds from the main random probability sample, and a booster sample of this age group.
03SEGMENT FOCUSData analysed by identified middle class and floating class segments.
04CITY FOCUSFor the combined report only, total city results are also shown and compared.
8 © 2017 Ipsos.
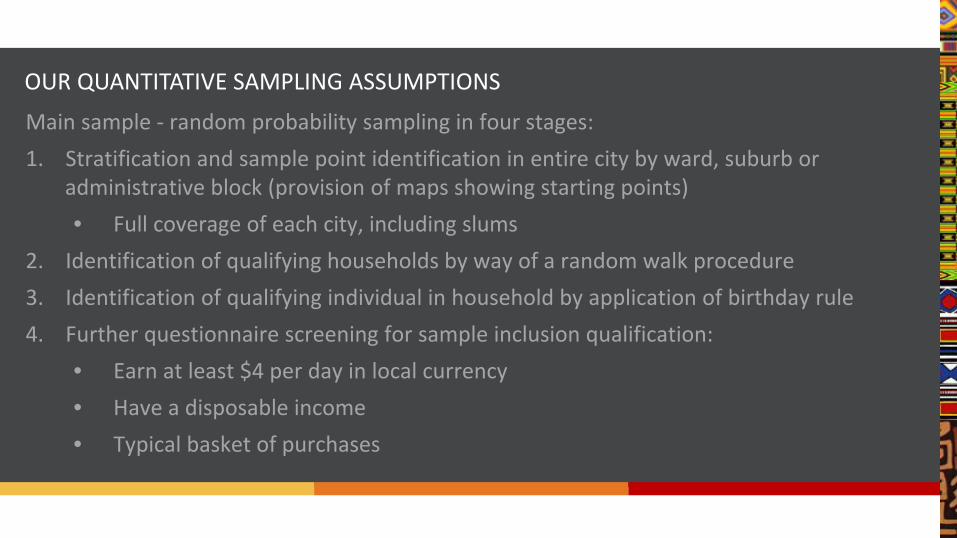
OUR QUANTITATIVE SAMPLING ASSUMPTIONS
Main sample - random probability sampling in four stages:1. Stratification and sample point identification in entire city by ward, suburb or
administrative block (provision of maps showing starting points)• Full coverage of each city, including slums
2. Identification of qualifying households by way of a random walk procedure3. Identification of qualifying individual in household by application of birthday rule4. Further questionnaire screening for sample inclusion qualification:
• Earn at least $4 per day in local currency• Have a disposable income• Typical basket of purchases

9 © 2017 Ipsos.
WHO FALLS INTO THE MIDDLE CLASS?• Higher than Primary School education • Employed - Employed / Students / Stay at home• Have money for at least food and clothing• Once in a while or more frequently have money left at the end of the month • Housing and Utilities usually less than 75% of family income
HOW DID WE SEGMENT?Attitudinal Segmentation View, towards Issues such as:• Money• Tradition• Brands• Nutrition
WHAT DIFFERENTIATES THE ESTABLISHED MIDDLE CLASS? (ACCOMPLISHED)• Tertiary education in progress or completed• Have money for emergencies• Can afford more than food and clothing• Greater stability in employment and income (Full time employment / monthly income)• No / low debt• Access to email / internet / personal computer

10 © 2017 Ipsos.
Who is middle class?OUR TAKE
Not in poverty
Have disposable income and discretion

11 © 2017 Ipsos.
We find largest proportion of middle class in citiesSO HOW BIG IS THE MIDDLE CLASS?
10 CITIES POPULATIONMIDDLE CLASS %
(ATTITUDINAL SEGMENTATION)
MIDDLE CLASS (ATTITUDINAL
SEGMENTATION)
Accra (Ghana) 2.3 Million 61% 1.4 Million
Addis Ababa (Ethiopia) 4.6 Million 59% 2.7 Million
Douala (Cameroon) 2.4 Million 58% 1.4 Million
Dar es Salaam (Tanzania) 4.4 Million 69% 3.0 Million
Abidjan (Ivory Coast) 4.7 Million 56% 2.6 Million
Kano (Nigeria) 3.3 Million 57% 2.0 Million
Lagos (Nigeria) 21.0 Million 67% 14.2 Million
Luanda (Angola) 6.5 Million 67% 4.4 Million
Lusaka (Zambia) 2.5 Million 66% 1.6 Million
Nairobi (Kenya) 3.3 Million 49% 1.6 Million
12 © 2017 Ipsos.
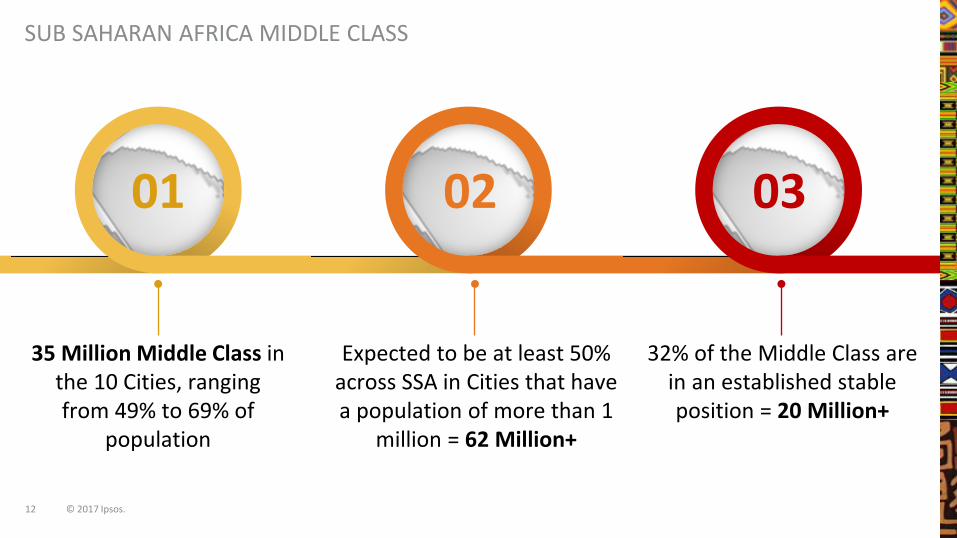
SUB SAHARAN AFRICA MIDDLE CLASS
01 02 03
35 Million Middle Class in the 10 Cities, ranging from 49% to 69% of
population
Expected to be at least 50% across SSA in Cities that have a population of more than 1
million = 62 Million+
32% of the Middle Class are in an established stable position = 20 Million+

13 © 2017 Ipsos.
NANZALA MWAURALead
Cell: 076 052 [email protected]
SAMANTHA PAYNEProject ChampionCell: 084 400 8888
HENDRIK VAN BLERKResearch SpecialistCell: 082 429 4847
PAUL EGANDirector
Tel: 021 650 4633 Cell: 081 467 5855 [email protected]
KULSOEM ROODEOffice Manager
Tel: 021 650 4715 Cell: 079 811 [email protected]
ASHLEIGH COULLMembership Support
Cell: 082 573 [email protected]
14 © 2017 Ipsos.14 © 2017 Ipsos.
We look forward to hearing from you!